
Electrocardiographic Patterns of Depolarization Abnormalities Help to Identify Reduced Left Ventricular Ejection Fraction


Abstract
:1. Introduction
2. Materials and Methods
3. Statistical Assessment
4. Results
5. Discussion
6. Conclusions
Author Contributions
Funding
Institutional Review Board Statement
Informed Consent Statement
Conflicts of Interest
References
- Braunwald, E. Cardiovascular Medicine at the Turn of the Millennium: Triumphs, Concerns, and Opportunities. N. Engl. J. Med. 1997, 337, 1360–1369. [Google Scholar] [CrossRef] [PubMed]
- Polyakov, D.S.; Fomin, I.V.; Belenkov, Y.N.; Mareev, V.Y.; Ageev, F.T.; Artemjeva, E.G.; Badin, Y.V.; Bakulina, E.V.; Vinogradova, N.G.; Galyavich, A.S.; et al. Chronic heart failure in the Russian Federation: What has changed over 20 years of follow-up? Results of the EPOCH-CHF study. Kardiologiia 2021, 61, 4–14. [Google Scholar] [CrossRef] [PubMed]
- Li, X.Q.; Tang, X.R.; Li, L.L. Antipsychotics cardiotoxicity: What’s known and what’s next. World J. Psychiatry 2021, 11, 736–753. [Google Scholar] [CrossRef] [PubMed]
- Fomin, I.V. Chronic heart failure in Russian Federation: What do we know and what to do. Russ. J. Cardiol. 2016, 8, 7–13. [Google Scholar] [CrossRef]
- Taylor, C.J.; Ordóñez-Mena, J.M.; Roalfe, A.K.; Lay-Flurrie, S.; Jones, N.R.; Marshall, T.; Hobbs, F.D.R. Trends in survival after a diagnosis of heart failure in the United Kingdom 2000–2017: Population based cohort study. BMJ 2019, 364, l223. [Google Scholar] [CrossRef] [Green Version]
- Sandhu, A.T.; Tisdale, R.L.; Rodriguez, F.; Stafford, R.S.; Maron, D.J.; Hernandez-Boussard, T.; Lewis, E.; Heidenreich, P.A. Disparity in the Setting of Incident Heart Failure Diagnosis. Circ. Heart Fail. 2021, 14, e008538. [Google Scholar] [CrossRef]
- Ponikowski, P.; Voors, A.A.; Anker, S.D.; Bueno, H.; Cleland, J.G.F.; Coats, A.J.S.; Falk, V.; González-Juanatey, J.R.; Harjola, V.P.; Jankowska, E.A.; et al. 2016 ESC Guidelines for the diagnosis and treatment of acute and chronic heart failure: The Task Force for the diagnosis and treatment of acute and chronic heart failure of the European Society of Cardiology (ESC)Developed with the special contribution of the Heart Failure Association (HFA) of the ESC. Eur. Heart J. 2016, 37, 2129–2200. [Google Scholar]
- Solomon, S.D.; Vaduganathan, M.; Claggett, B.L.; de Boer, R.A.; DeMets, D.; Hernandez, A.F.; Inzucchi, S.E.; Kosiborod, M.N.; Lam, C.S.; Martinez, F.; et al. Baseline Characteristics of Patients With HF With Mildly Reduced and Preserved Ejection Fraction: DELIVER Trial. JACC Heart Fail. 2022, 10, 184–197. [Google Scholar] [CrossRef]
- Abdul-Rahim, A.H.; Shen, L.; Rush, C.R.; Jhund, P.S.; Lees, K.R.; McMurray, J.J.V. Effect of digoxin in patients with heart failure and mid-range (borderline) left ventricular ejection fraction. Eur. J. Heart Fail. 2018, 20, 1139–1145. [Google Scholar] [CrossRef] [Green Version]
- Kotecha, D.; Flather, M.D.; Altman, D.G.; Holmes, J.; Rosano, G.; Wikstrand, J.; Packer, M.; Coats, A.J.S.; Manzano, L.; Böhm, M.; et al. Heart Rate and Rhythm and the Benefit of Beta-Blockers in Patients With Heart Failure. J. Am. Coll. Cardiol. 2017, 69, 2885–2896. [Google Scholar] [CrossRef]
- Solomon, S.D.; Claggett, B.; Lewis, E.F.; Desai, A.; Anand, I.; Sweitzer, N.K.; O'Meara, E.; Shah, S.J.; McKinlay, S.; Fleg, J.L.; et al. Influence of ejection fraction on outcomes and efficacy of spironolactone in patients with heart failure with preserved ejection fraction. Eur. Heart J. 2016, 37, 455–462. [Google Scholar] [CrossRef] [PubMed]
- Nauta, J.F.; Hummel, Y.M.; van Melle, J.P.; van der Meer, P.; Lam, C.S.P.; Ponikowski, P.; Voors, A.A. What have we learned about heart failure with mid-range ejection fraction one year after its introduction? Eur. J. Heart Fail. 2017, 19, 1569–1573. [Google Scholar] [CrossRef] [PubMed] [Green Version]
- Daamen, M.A.M.J.; Brunner-la Rocca, H.-P.; Tan, F.E.S.; Hamers, J.P.H.; Schols, J.M.G.A. Clinical diagnosis of heart failure in nursing home residents based on history, physical exam, BNP and ECG: Is it reliable? Eur. Geriatr. Med. 2017, 8, 59–65. [Google Scholar] [CrossRef]
- van Ommen, A.-M.; Kessler, E.L.; Valstar, G.; Onland-Moret, N.C.; Cramer, M.J.; Rutten, F.; Coronel, R.; Den Ruijter, H. Electrocardiographic Features of Left Ventricular Diastolic Dysfunction and Heart Failure with Preserved Ejection Fraction: A Systematic Review. Front. Cardiovasc. Med. 2021, 8, 772803. [Google Scholar] [CrossRef]
- Coronel, R.; Wilders, R.; Verkerk, A.O.; Wiegerinck, R.F.; Benoist, D.; Bernus, O. Electrophysiological changes in heart failure and their implications for arrhythmogenesis. Biochim. Biophys. Acta. 2013, 1832, 2432–2441. [Google Scholar] [CrossRef] [Green Version]
- Ding, W.Y.; Cooper, R.; Todd, D.; Gupta, D.; Hall, M.; Rao, A.; Wright, J.; Snowdon, R.; Waktare, J.; Modi, S. Natural progression of QRS duration in ICD-only patients. J. Interv. Card. Electrophysiol. 2018, 53, 47–51. [Google Scholar] [CrossRef]
- Magnani, J.W.; Wang, N.; Nelson, K.P.; Connelly, S.; Deo, R.; Rodondi, N.; Schelbert, E.B.; Garcia, M.E.; Phillips, C.L.; Shlipak, M.G.; et al. Electrocardiographic PR Interval and Adverse Outcomes in Older Adults. Circ. Arrhythm. Electrophysiol. 2013, 6, 84–90. [Google Scholar] [CrossRef] [Green Version]
- Olesen, L.L.; Andersen, A. ECG as a first step in the detection of left ventricular systolic dysfunction in the elderly. ESC Heart Fail. 2016, 3, 44–52. [Google Scholar] [CrossRef]
- Nikolaidou, T.; Samuel, N.A.; Marincowitz, C.; Fox, D.J.; Cleland, J.G.F.; Clark, A.L. Electrocardiographic characteristics in patients with heart failure and normal ejection fraction: A systematic review and meta-analysis. Ann. Noninvasive Electrocardiol. 2020, 25, e12710. [Google Scholar] [CrossRef] [Green Version]
- Nguyen, T.P.; Qu, Z.; Weiss, J.N. Cardiac fibrosis and arrhythmogenesis: The road to repair is paved with perils. J. Mol. Cell. Cardiol. 2014, 70, 83–91. [Google Scholar] [CrossRef] [Green Version]
- Parmon, E.V.; Treshkur, T.V.; Gordeeva, M.S. Sovremennye predstavleniya o roli elektrokardiografii v opredelenii fibroza miokarda i diagnostike pervichnyh aritmogennyh sindromov dlya profilaktiki vnezapnoj serdechnoj smerti. Translyacionnaya Med. 2020, 1, 533–563. [Google Scholar]
- Tangwiwat, C.; Kaolawanich, Y.; Krittayaphong, R. Electrocardiographic predictors of myocardial fibrosis and apical hypertrophic cardiomyopathy. Ann. Noninvasive Electrocardiol. 2019, 24, e12612. [Google Scholar] [CrossRef] [Green Version]
- Kadi, H.; Kevser, A.; Ozturk, A.; Koc, F.; Ceyhan, K. Fragmented QRS Complexes Are Associated with Increased Left Ventricular Mass in Patients with Essential Hypertension. Ann. Noninvasive Electrocardiol. 2013, 18, 547–554. [Google Scholar] [CrossRef] [PubMed]
- Eyuboglu, M. Fragmented QRS as a Marker of Myocardial Fibrosis in Hypertension: A Systematic Review. Curr. Hypertens. Rep. 2019, 21, 73. [Google Scholar] [CrossRef]
- Bozbeyoğlu, E.; Yıldırımtürk, Ö.; Yazıcı, S.; Ceylan, U.S.; Erdem, A.; Kaya, A.; Dönmez, C.; Akyüz, Ş.; Çetin, M. Fragmented QRS on Admission Electrocardiography Predicts Long-Term Mortality in Patients with Non-ST-Segment Elevation Myocardial Infarction. Ann. Noninvasive Electrocardiol. 2016, 21, 352–357. [Google Scholar] [CrossRef]
- Kanjanahattakij, N.; Rattanawong, P.; Riangwiwat, T.; Prasitlumkum, N.; Limpruttidham, N.; Chongsathidkiet, P.; Vutthikraivit, W.; Crossey, E. Fragmented QRS and mortality in patients undergoing percutaneous intervention for ST-elevation myocardial infarction: Systematic review and meta-analysis. Ann. Noninvasive Electrocardiol. 2018, 23, e12567. [Google Scholar] [CrossRef]
- Tanriverdi, Z.; Colluoglu, T.; Unal, B.; Dursun, H.; Kaya, D. The prognostic value of the combined use of QRS distortion and fragmented QRS in patients with acute STEMI undergoing primary percutaneous coronary intervention. J. Electrocardiol. 2018, 51, 210–217. [Google Scholar] [CrossRef] [PubMed]
- Gordeeva, M.S.; Parmon, E.V.; Karlina, V.A.; Ryzhkova, D.V. Fragmented QRS complex as a marker of myocardial fibrosis in patients with coronary artery disease. Sci. Innov. Med. 2022, 7, 95–102. (In Russian) [Google Scholar] [CrossRef]
- Parmon, E.V.; Gordeeva, M.S.; Kurilenko, T.A.; Berngardt, E.R. QRS complex fragmentation—An important marker of abnormal depolarization. Russ. J. Cardiol. 2017, 8, 90–95. [Google Scholar] [CrossRef] [Green Version]
- Ogura, S.; Nakamura, K.; Morita, H.; Toh, N.; Nakawaga, K.; Yoshida, M.; Watanabe, A.; Nishii, N.; Miyoshi, T.; Ito, H. New Appearance of Fragmented QRS as a Predictor of Ventricular Arrhythmic Events in Patients With Hypertrophic Cardiomyopathy. Circ. J. 2020, 84, 487–494. [Google Scholar] [CrossRef] [Green Version]
- Lu, X.; Wang, W.; Zhu, L.; Wang, Y.; Sun, K.; Zou, Y.; Tian, T.; Hui, R.; Wang, J.; Kang, L.; et al. Prognostic Significance of Fragmented QRS in Patients with Hypertrophic Cardiomyopathy. Cardiology 2017, 138, 26–33. [Google Scholar] [CrossRef] [PubMed]
- Rattanawong, P.; Riangwiwat, T.; Prasitlumkum, N.; Limpruttidham, N.; Kanjanahattakij, N.; Chongsathidkiet, P.; Vutthikraivit, W.; Chung, E.H. Baseline fragmented QRS increases the risk of major arrhythmic events in Brugada syndrome: Systematic review and meta-analysis. Ann. Noninvasive Electrocardiol. 2018, 23, e12507. [Google Scholar] [CrossRef] [PubMed]
- Kanitsoraphan, C.; Rattanawong, P.; Mekraksakit, P.; Chongsathidkiet, P.; Riangwiwat, T.; Kanjanahattakij, N.; Vutthikraivit, W.; Klomjit, S.; Thavaraputta, S. Baseline fragmented QRS is associated with increased all-cause mortality in heart failure with reduced ejection fraction: A systematic review and meta-analysis. Ann. Noninvasive Electrocardiol. 2019, 24, e12597. [Google Scholar] [CrossRef] [Green Version]
- Liu, P.; Wu, J.; Wang, L.; Han, D.; Sun, C.; Sun, J. The prevalence of fragmented QRS and its relationship with left ventricular systolic function in chronic kidney disease. J. Int. Med. Res. 2020, 48, 0300060519890792. [Google Scholar] [CrossRef] [PubMed]
- Nikoo, M.H.; Jamali, Z.; Razeghian-Jahromi, I.; Sayadi, M.; Verdecchia, P.; Abtahi, F. Fragmented QRS as an early predictor of left ventricular systolic dysfunction in healthy individuals: A nested case-control study in the era of speckle tracking echocardiography. Cardiovasc. Ultrasound. 2020, 18, 33. [Google Scholar] [CrossRef]
- Bayramoğlu, A.; Taşolar, H.; Bektaş, O.; Kaya, A.; Günaydın, Z.Y. Association between fragmented QRS complexes and left ventricular dysfunction in healthy smokers. Echocardiography 2019, 36, 292–296. [Google Scholar] [CrossRef]
- Miragoli, M.; Goldoni, M.; Demola, P.; Paterlini, A.; Li Calzi, M.; Gioia, M.I.; Visioli, F.; Rossi, S.; Pelà, G. Left ventricular geometry correlates with early repolarization pattern in adolescent athletes. Scand. J. Med. Sci. Sports 2019, 29, 1727–1735. [Google Scholar] [CrossRef]
- Azevedo, P.M.O.; Guerreiro, C.; Ladeiras-Lopes, R.; Ferreira, N.; Faria, R.; Barbosa, R.; Primo, J.; Braga, J. Early Repolarization Pattern and Left Ventricular Mass in Hypertrophic Cardiomyopathy. Cardiology 2020, 145, 303–308. [Google Scholar] [CrossRef]
- Gordeeva, M.S.; Zemskov, I.A.; Sokolova, A.A.; Parmon, E.V. Early repolarization on ECG (early repolarization pattern and syndrome). Transl. Med. 2018, 5, 23–34. (In Russian) [Google Scholar] [CrossRef] [Green Version]
- Cheng, Y.-J.; Li, Z.-Y.; Yao, F.-J.; Xu, X.-J.; Ji, C.-C.; Chen, X.-M.; Liu, L.-J.; Lin, X.-X.; Yao, H.; Wu, S.-H. Early repolarization is associated with a significantly increased risk of ventricular arrhythmias and sudden cardiac death in patients with structural heart diseases. Heart Rhythm. 2017, 14, 1157–1164. [Google Scholar] [CrossRef]
- Cheng, Y.; Zhao, X.X.; Pan, S.P.; Pan, J.M.; Zhang, M.; Li, Z.Y. Association of early repolarization pattern with cardiovascular outcomes in middle-aged population: A cohort study. Clin. Cardiol. 2020, 43, 1601–1608. [Google Scholar] [CrossRef] [PubMed]
- Ikeda-Yorifuji, I.; Yamada, T.; Tamaki, S.; Morita, T.; Furukawa, Y.; Iwasaki, Y.; Kawasaki, M.; Kikuchi, A.; Kawai, T.; Seo, M.; et al. Prediction of sudden cardiac death in chronic heart failure patients with reduced ejection fraction by ADMIRE-HF risk score and early repolarization pattern. J. Nucl. Cardiol. 2020, 27, 992–1001. [Google Scholar] [CrossRef] [PubMed]
- Kakhki, V.R.D.; Ayati, N.; Zakavi, S.; Sadeghi, R.; Tayyebi, M.; Shariati, F. Comparison between fragmented QRS and Q waves in myocardial scar detection using myocardial perfusion single photon emission computed tomography. Kardiol. Pol. 2015, 73, 437–444. [Google Scholar] [CrossRef]
- MacFarlane, P.W.; Antzelevitch, C.; Haissaguerre, M.; Huikuri, H.V.; Potse, M.; Rosso, R.; Sacher, F.; Tikkanen, J.T.; Wellens, H.; Yan, G.X. The early repolarization pattern: A consensus paper. J. Am. Coll. Cardiol. 2015, 66, 470–477. [Google Scholar] [CrossRef]
- López-Castillo, M.; Aceña, Á.; Pello-Lázaro, A.M.; Viegas, V.; Merchán Muñoz, B.; Carda, R.J.; Franco-Peláez, J.; Martín-Mariscal, M.L.; Briongos-Figuero, S.; Tuñón, J. Prognostic value of initial QRS analysis in anterior STEMI: Correlation with left ventricular systolic dysfunction, serum biomarkers, and cardiac outcomes. Ann. Noninvasive Electrocardiol. 2021, 26, e12791. [Google Scholar] [CrossRef]
- Delewi, R.; IJff, G.; van de Hoef, T.P.; Hirsch, A.; Robbers, L.F.; Nijveldt, R.; van der Laan, A.M.; van der Vleuten, P.A.; Lucas, C.; Tijssen, J.G.P.; et al. Pathological Q Waves in Myocardial Infarction in Patients Treated by Primary PCI. JACC Cardiovasc. Imaging 2013, 6, 324–331. [Google Scholar] [CrossRef] [PubMed] [Green Version]
- Akgun, T.; Kalkan, S.; Tigen, K.M. Variations of QRS morphology in patients with dilated cardiomyopathy; clinical and prognostic implications. J. Cardiovasc. Thorac. Res. 2014, 6, 85–89. [Google Scholar]
- Boyle, N. A Clinical Review of Ventricular Arrhythmias in Patients with Congestive Heart Failure. EMJ Cardiol. 2019. [Google Scholar] [CrossRef]
- Wellens, H.J.J.; Schwartz, P.J.; Lindemans, F.W.; Buxton, A.E.; Goldberger, J.J.; Hohnloser, S.H.; Huikuri, H.V.; Kääb, S.; La Rovere, M.T.; Malik, M.; et al. Risk stratification for sudden cardiac death: Current status and challenges for the future. Eur. Heart J. 2014, 35, 1642–1651. [Google Scholar] [CrossRef] [Green Version]
- Rusnak, J.; Behnes, M.; Weiß, C.; Nienaber, C.; Reiser, L.; Schupp, T.; Bollow, A.; Taton, G.; Reichelt, T.; Ellguth, D.; et al. Impact of Left Ventricular Ejection Fraction on Recurrent Ventricular Tachyarrhythmias in Recipients of Implantable Cardioverter Defibrillators. Cardiology 2020, 145, 359–369. [Google Scholar] [CrossRef]
- Dong, Y.; Shi, Y.; Wang, J.; Dan, Q.; Gao, L.; Zhao, C.; Mu, Y.; Liu, M.; Yin, C.; Wu, R.; et al. Development and Validation of a Risk Prediction Model for Ventricular Arrhythmia in Elderly Patients with Coronary Heart Disease. Cardiol. Res. Pract. 2021, 2021, 2283018. [Google Scholar] [CrossRef] [PubMed]
- Ramírez, J.; Orini, M.; Mincholé, A.; Monasterio, V.; Cygankiewicz, I.; Bayés de Luna, A.; Pablo Martínez, J.; Laguna, P.; Pueyo, E. Sudden cardiac death and pump failure death prediction in chronic heart failure by combining ECG and clinical markers in an integrated risk model. PLoS ONE 2017, 12, e0186152. [Google Scholar] [CrossRef] [PubMed]
- Al Badarin, F.J.; Peri-Okonny, P. The quest to improve sudden cardiac death prediction using sympathetic innervation scintigraphy: Chasing a mirage? J. Nucl. Cardiol. 2020, 27, 1002–1004. [Google Scholar] [CrossRef] [PubMed] [Green Version]
- Wu, K.C.; Calkins, H. Powerlessness of a Number: Why Left Ventricular Ejection Fraction Matters Less for Sudden Cardiac Death Risk Assessment. Circ. Cardiovasc. Imaging 2016, 9, e005519. [Google Scholar] [CrossRef] [Green Version]
- Zhao, Q.; Zhang, P.; Hou, J.; Yu, B. Relationship between Fragmented QRS and NT-proBNP in Patients with ST Elevation Myocardial Infarction Who Underwent Primary Percutaneous Coronary Intervention. Acta Cardiol. Sin. 2018, 34, 13–22. [Google Scholar]


| Localization of Changes | Group 1, n (%) | Group 2, n (%) | Group 3, n (%) |
|---|---|---|---|
| LV anterior wall | 7 (43.75) | 4 (30.70) | 5 (31.25) |
| LV lateral wall | 3 (18.75) | 5 (38.46) | 1 (6.25) |
| LV inferior wall | 6 (37.5) | 4 (30.70) | 10 (62.50) |
| EF, % | IVS, mm | EDV, mL | ESV, mL | EDS, mm | ESS, mm | ||
|---|---|---|---|---|---|---|---|
| fQRS | Pearson correlation | −0.316 | 0.021 | 0.385 | 0.340 | 0.325 | 0.355 |
| Significance | <0.001 | 0.83 | <0.001 | <0.001 | 0.001 | 0.001 | |
| N | 148 | 108 | 119 | 112 | 110 | 85 | |
| Pearson’s Chi-Squared Test | Fisher Test | |
|---|---|---|
| fQRS | 0.061 | 0.05 |
| Leads with fQRS | 0.033 | |
| EVR | 0.519 | 0.403 |
| EVR morphology | 0.642 | |
| Leads with EVR | 0.748 | |
| Pathological Q wave | 0.654 | 0.405 |
| The occurrence of fibrosis changes according to data of cardiac visualization methods (MRI, SPECT) | <0.001 | <0.001 |
| SEN | SPE | +LR | −LR | AUC | |
|---|---|---|---|---|---|
| Mildly reduced EF (Figure 7a) | |||||
| Qpath | 0.345 | 0.712 | 2.945 | 0.339 | 0.522 |
| FQRSS | 0.448 | 0.734 | 2.031 | 0.492 | 0.586 |
| Low reduced EF (Figure 7b) | |||||
| Qpath | 0.645 | 0.781 | 1.142 | 0.875 | 0.713 |
| FQRSS | 0.516 | 0.746 | 1.623 | 0.616 | 0.631 |
| Localization of Changes | Group 1, n (%) | Group 2, n (%) | Group 3, n (%) |
|---|---|---|---|
| LV anterior wall | 0 | 1 (50) | 2 (20) |
| LV lateral wall | 0 | 0 | 1 (10) |
| LV inferior wall | 2 (100) | 1 (50) | 7 (70) |
| Group 1 | Group 2 | Group 3 | ||||
|---|---|---|---|---|---|---|
| Average value (ms) | 117.3 | 108.3 | 100 | |||
| MSD (ms) | 30.9 | 21.8 | 18.6 | |||
| Minimal value (ms) | 60 | 80 | 68 | |||
| Maximal value (ms) | 190 | 152 | 172 | |||
| Confidence interval 95% (top and bottom value) (ms) | 106 | 129 | 100 | 116.6 | 96 | 104 |
| Number of observations | 31 | 29 | 85 | |||
| Group 1 | Group 2 | Group 3 | ||||||
|---|---|---|---|---|---|---|---|---|
| N | 31 | 29 | 88 | |||||
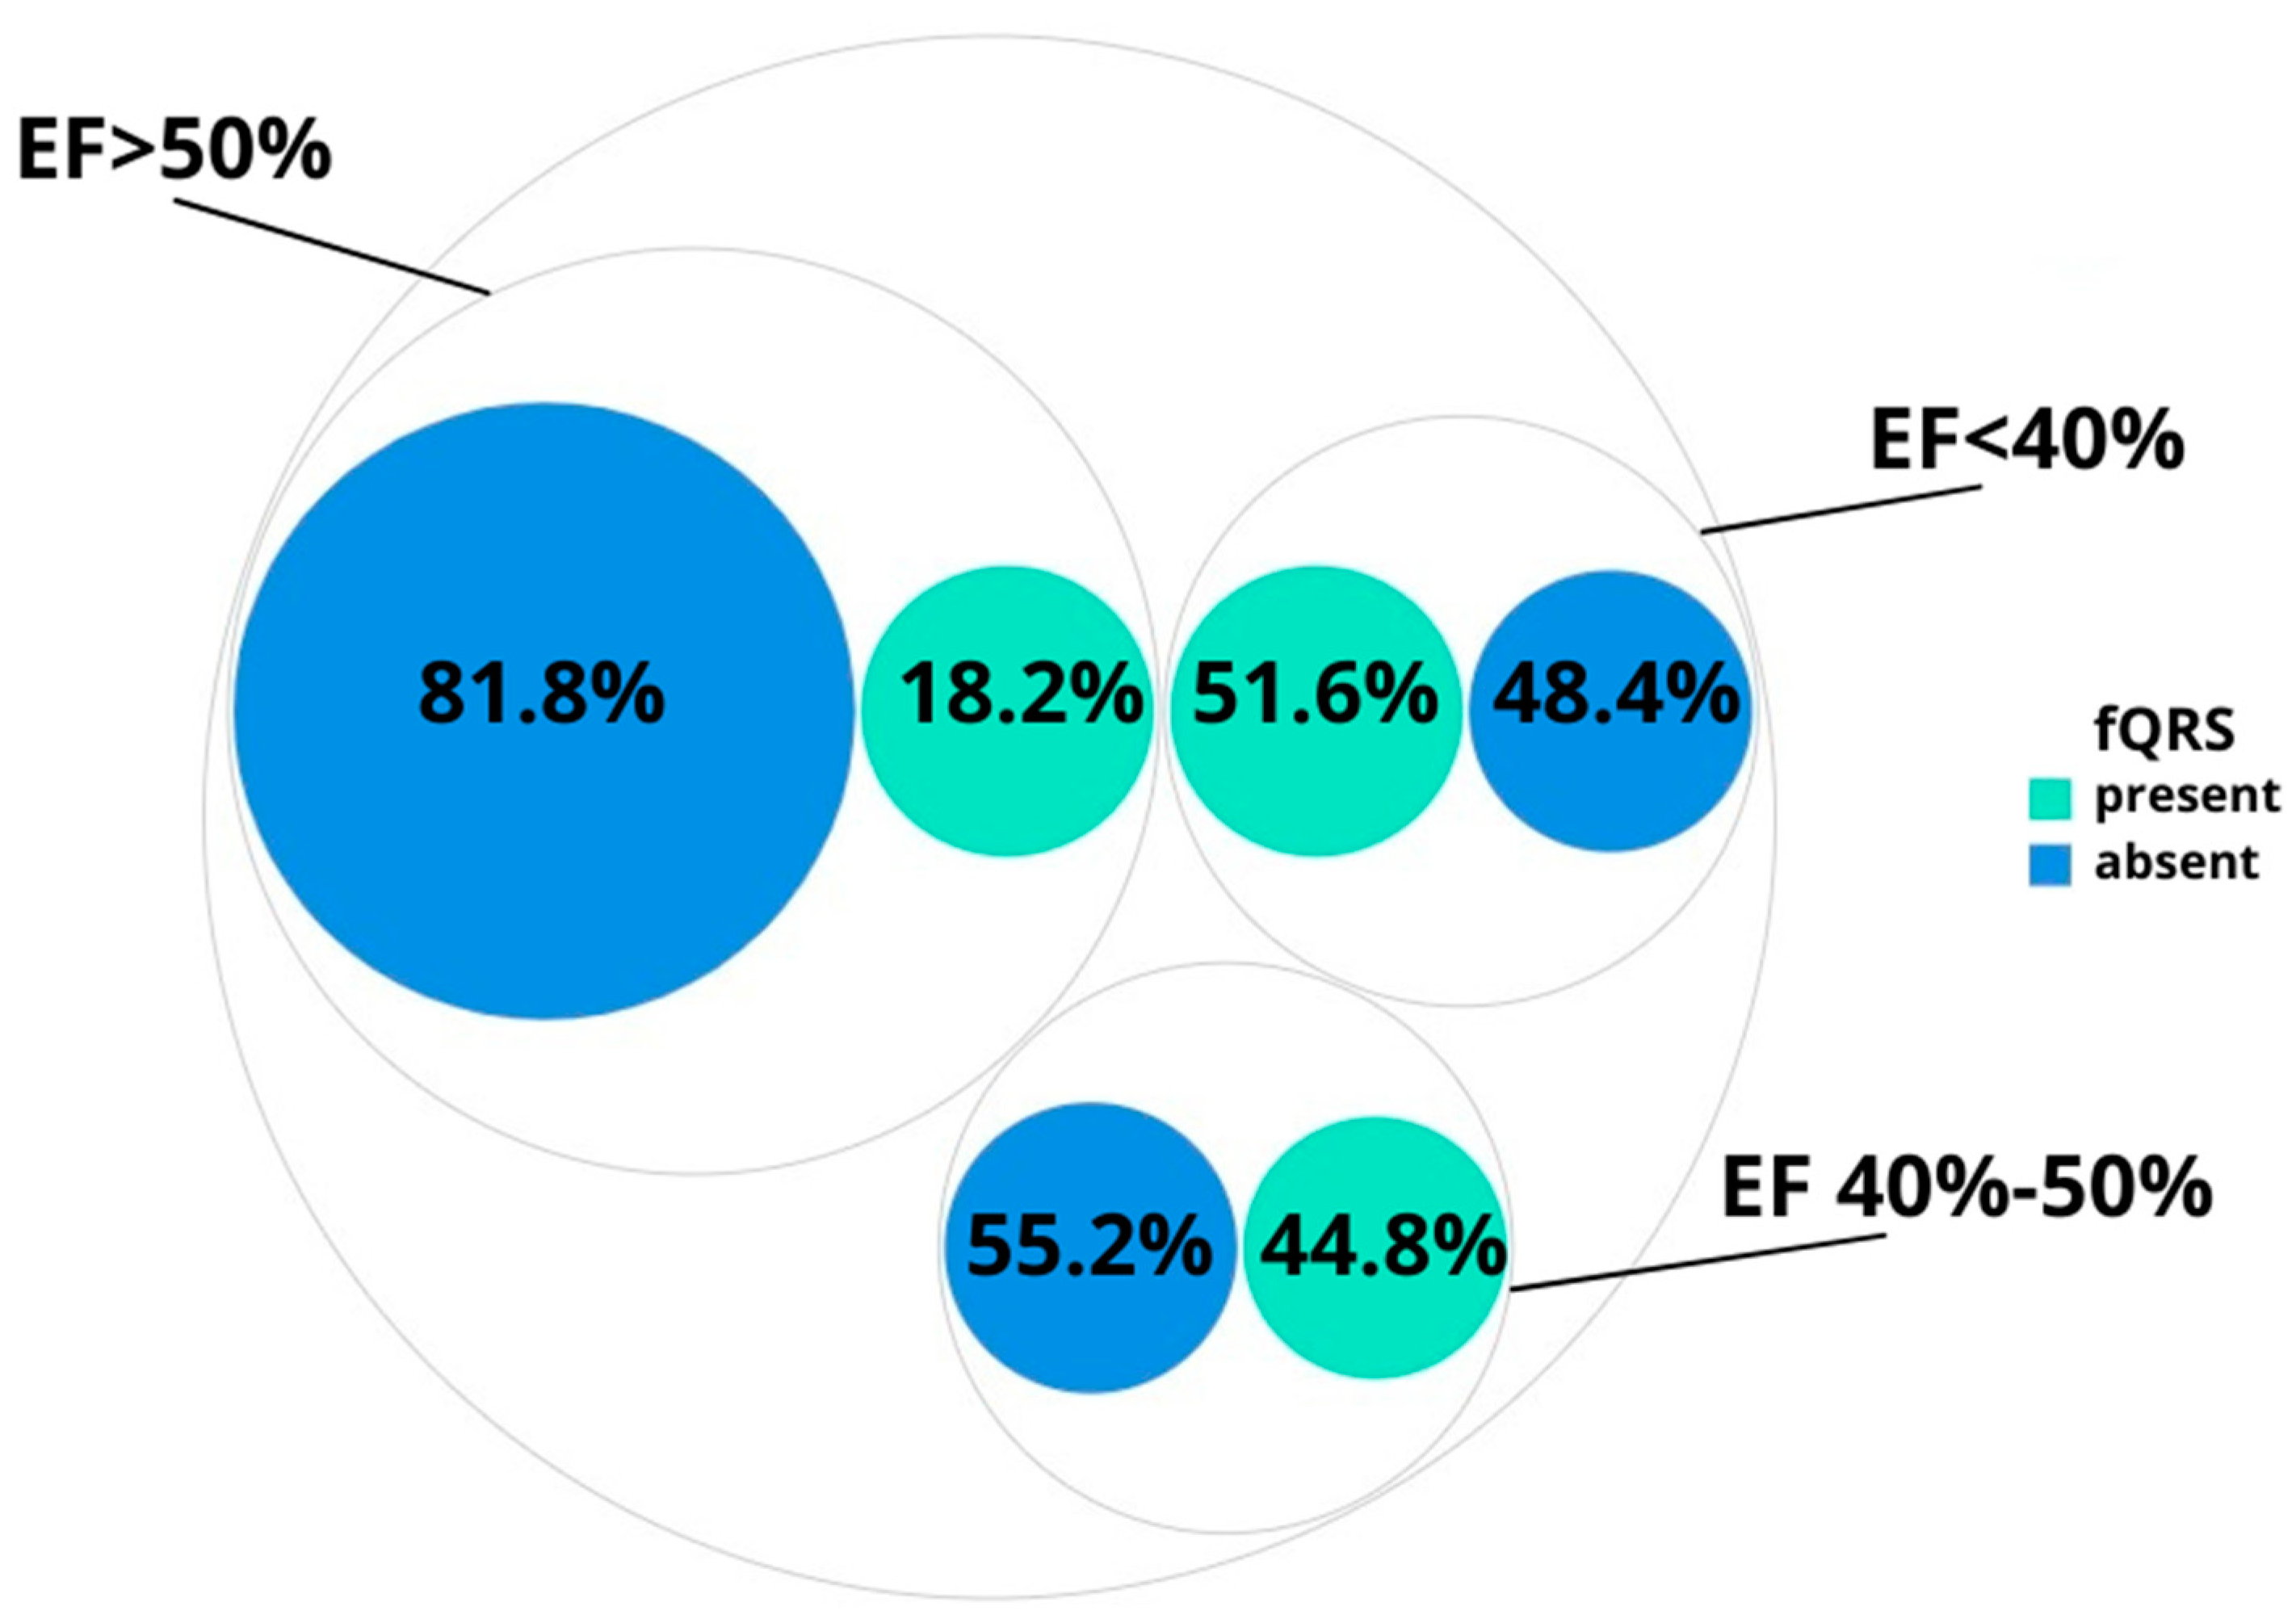
| fQRS | Registered | 16 (51.6%) | 13 (44.8%) | 16 (18.2%) | ||||
| Localization of changes | LV anterior wall | 7 (43.75) | 4 (30.70) | 5 (31.25) | ||||
| LV lateral wall | 3 (18.75) | 5 (38.46) | 1 (6.25) | |||||
| LV inferior wall | 6 (37.5) | 4 (30.70) | 10 (62.50) | |||||
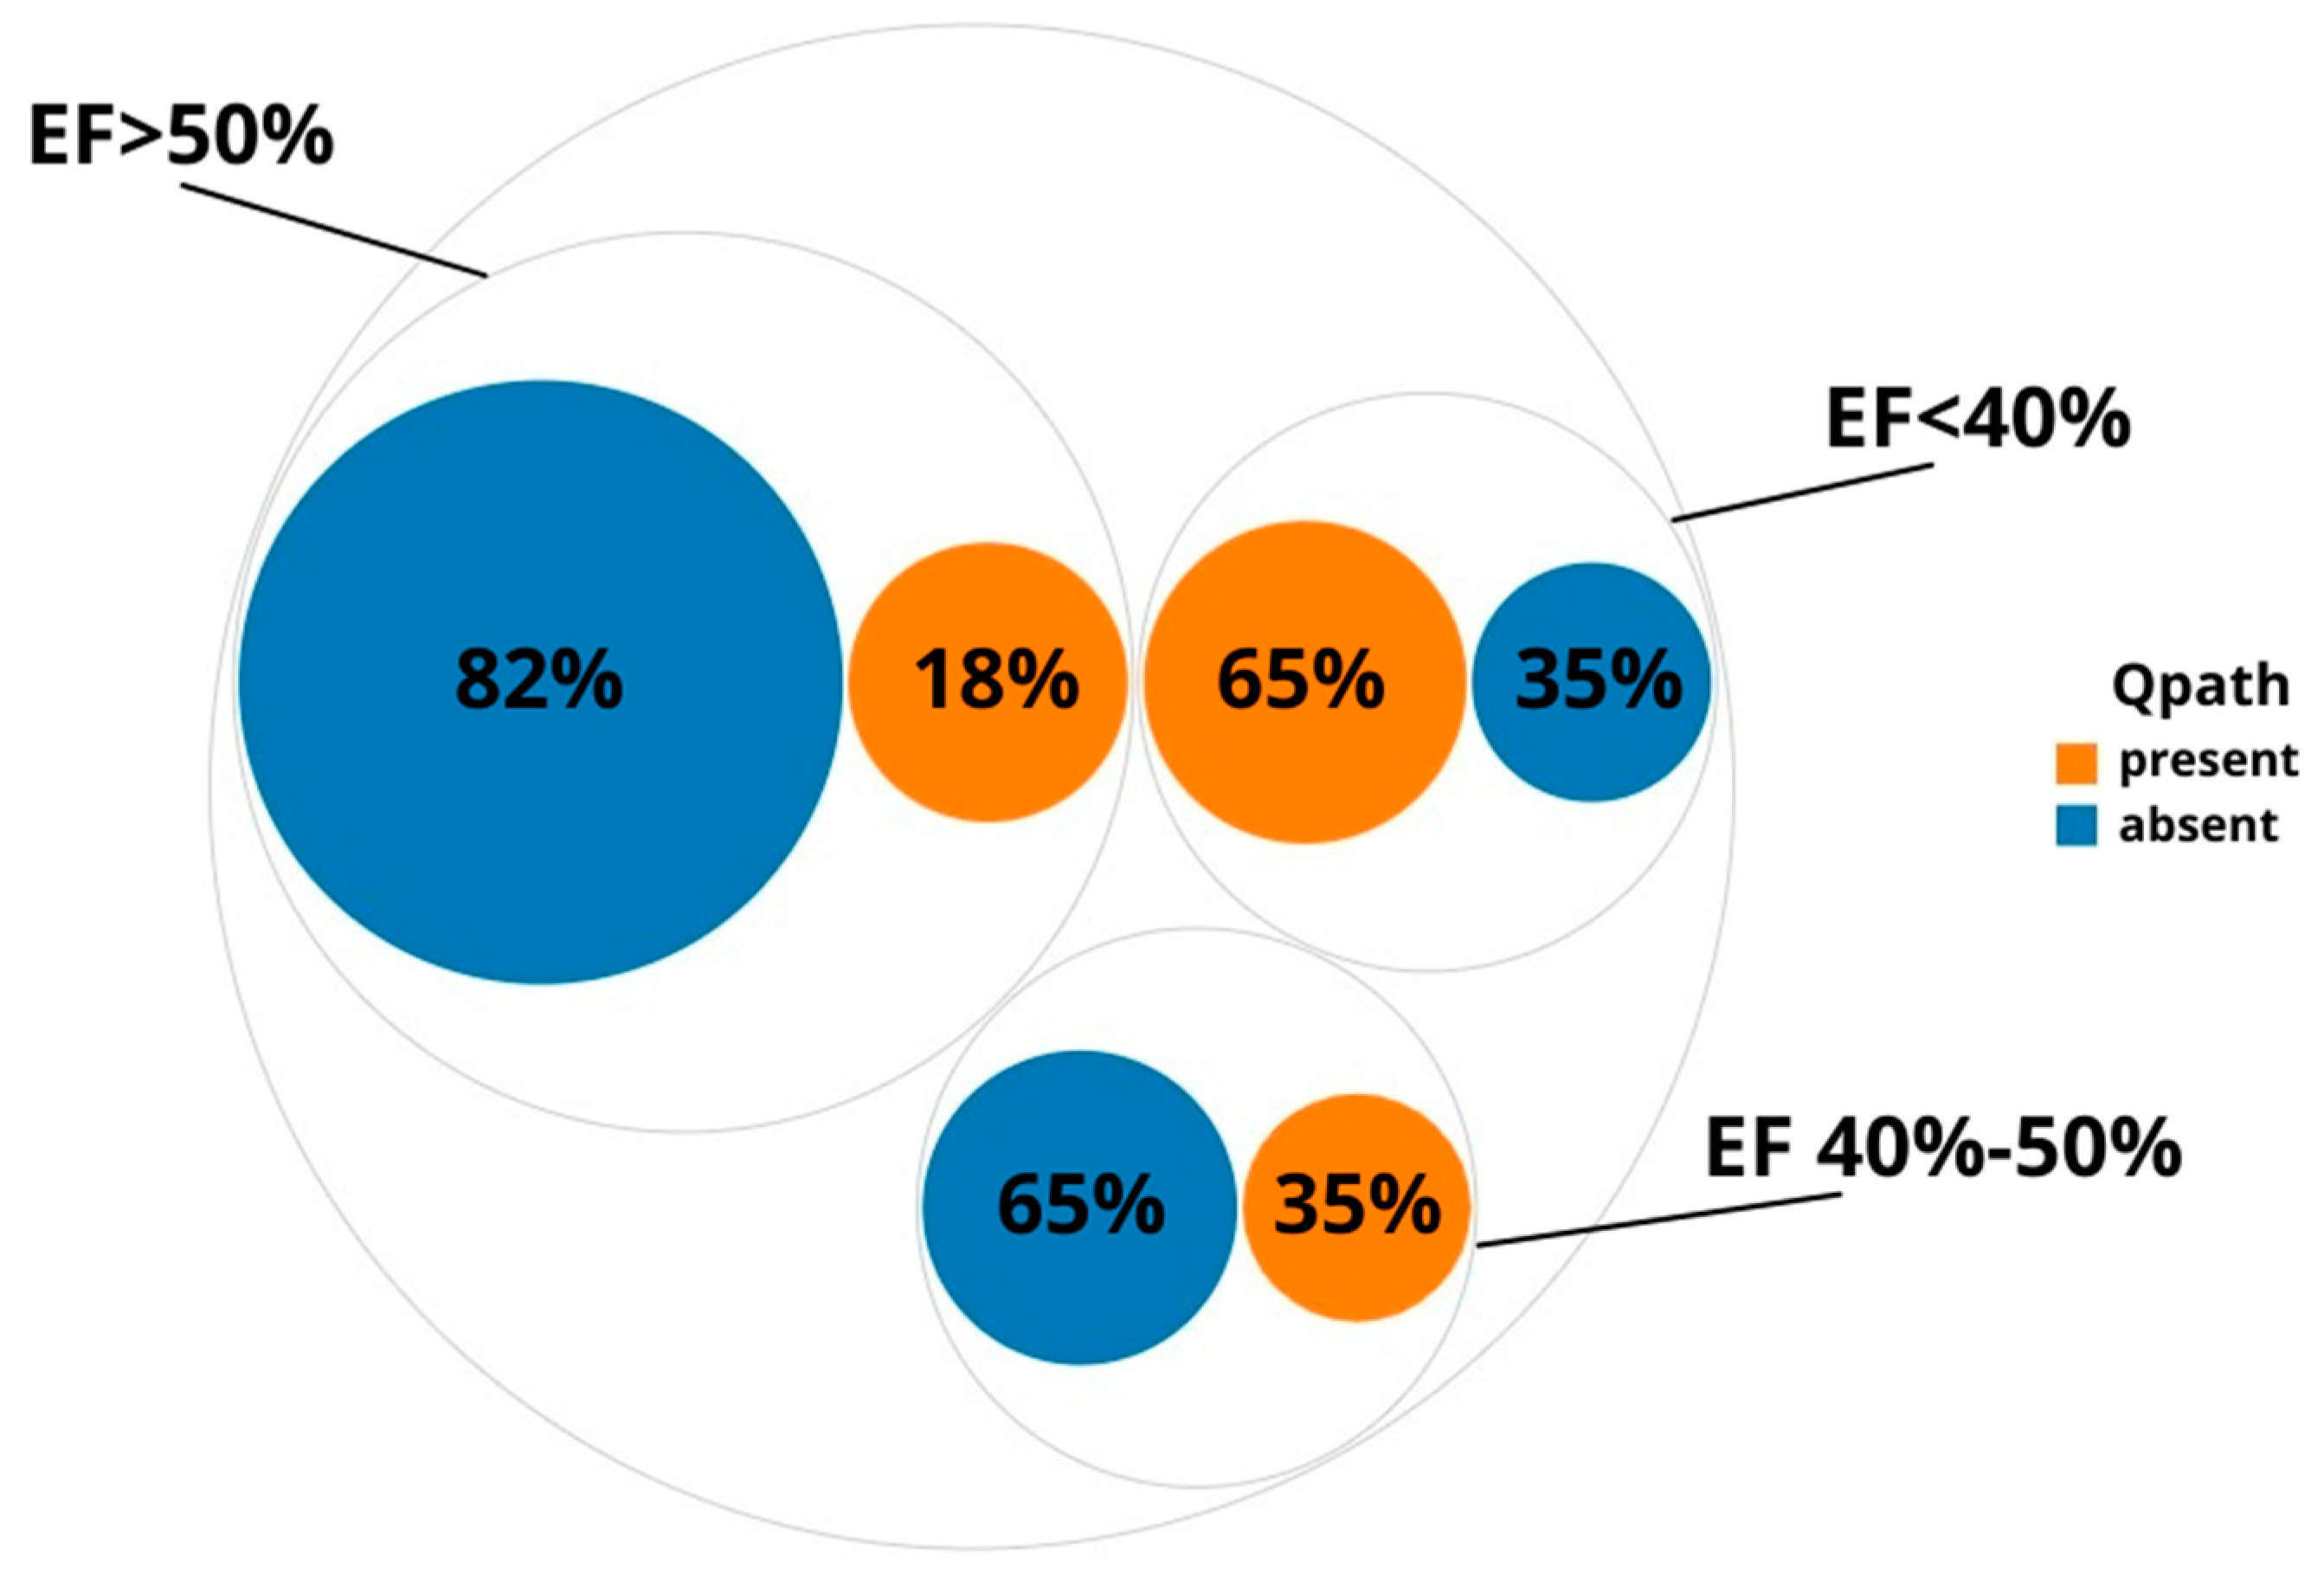
| Pathological Q wave (registered) | 20 (65%) | 10 (35%) | 15 (18%) | |||||
| ERP | Registered | 2 (6.5%) | 2 (6.9%) | 11 (12.5%) | ||||
| Localization of changes | LV anterior wall | 0 | 1 (50) | 2 (20) | ||||
| LV lateral wall | 0 | 0 | 1 (10) | |||||
| LV inferior wall | 2 (100) | 1 (50) | 7 (70) | |||||
| Morphology | wave | notch | wave | notch | wave | notch | ||
| 1 (50%) | 1 (50%) | 1 (50%) | 1 (50%) | 9 (81.8%) | 2 (18.2%) | |||
| QRS | Average value (ms) | 117.3 | 108.3 | 100 | ||||
| MSD (ms) | 30.9 | 21.8 | 18.6 | |||||
| Minimal value (ms) | 60 | 80 | 68 | |||||
| Maximal value (ms) | 190 | 152 | 172 | |||||
| Confidence interval 95% (top and bottom values) (ms) | 106 | 129 | 100 | 116.6 | 96 | 104 | ||
Publisher’s Note: MDPI stays neutral with regard to jurisdictional claims in published maps and institutional affiliations. |
© 2022 by the authors. Licensee MDPI, Basel, Switzerland. This article is an open access article distributed under the terms and conditions of the Creative Commons Attribution (CC BY) license (https://creativecommons.org/licenses/by/4.0/).
Share and Cite
Gordeeva, M.; Serdiukova, I.; Krasichkov, A.; Parmon, E. Electrocardiographic Patterns of Depolarization Abnormalities Help to Identify Reduced Left Ventricular Ejection Fraction. Diagnostics 2022, 12, 2020. https://doi.org/10.3390/diagnostics12082020
Gordeeva M, Serdiukova I, Krasichkov A, Parmon E. Electrocardiographic Patterns of Depolarization Abnormalities Help to Identify Reduced Left Ventricular Ejection Fraction. Diagnostics. 2022; 12(8):2020. https://doi.org/10.3390/diagnostics12082020
Chicago/Turabian StyleGordeeva, Maria, Irina Serdiukova, Alexander Krasichkov, and Elena Parmon. 2022. "Electrocardiographic Patterns of Depolarization Abnormalities Help to Identify Reduced Left Ventricular Ejection Fraction" Diagnostics 12, no. 8: 2020. https://doi.org/10.3390/diagnostics12082020