
Imperative Role of Machine Learning Algorithm for Detection of Parkinson’s Disease: Review, Challenges and Recommendations

 , , and
Abstract
:1. Introduction
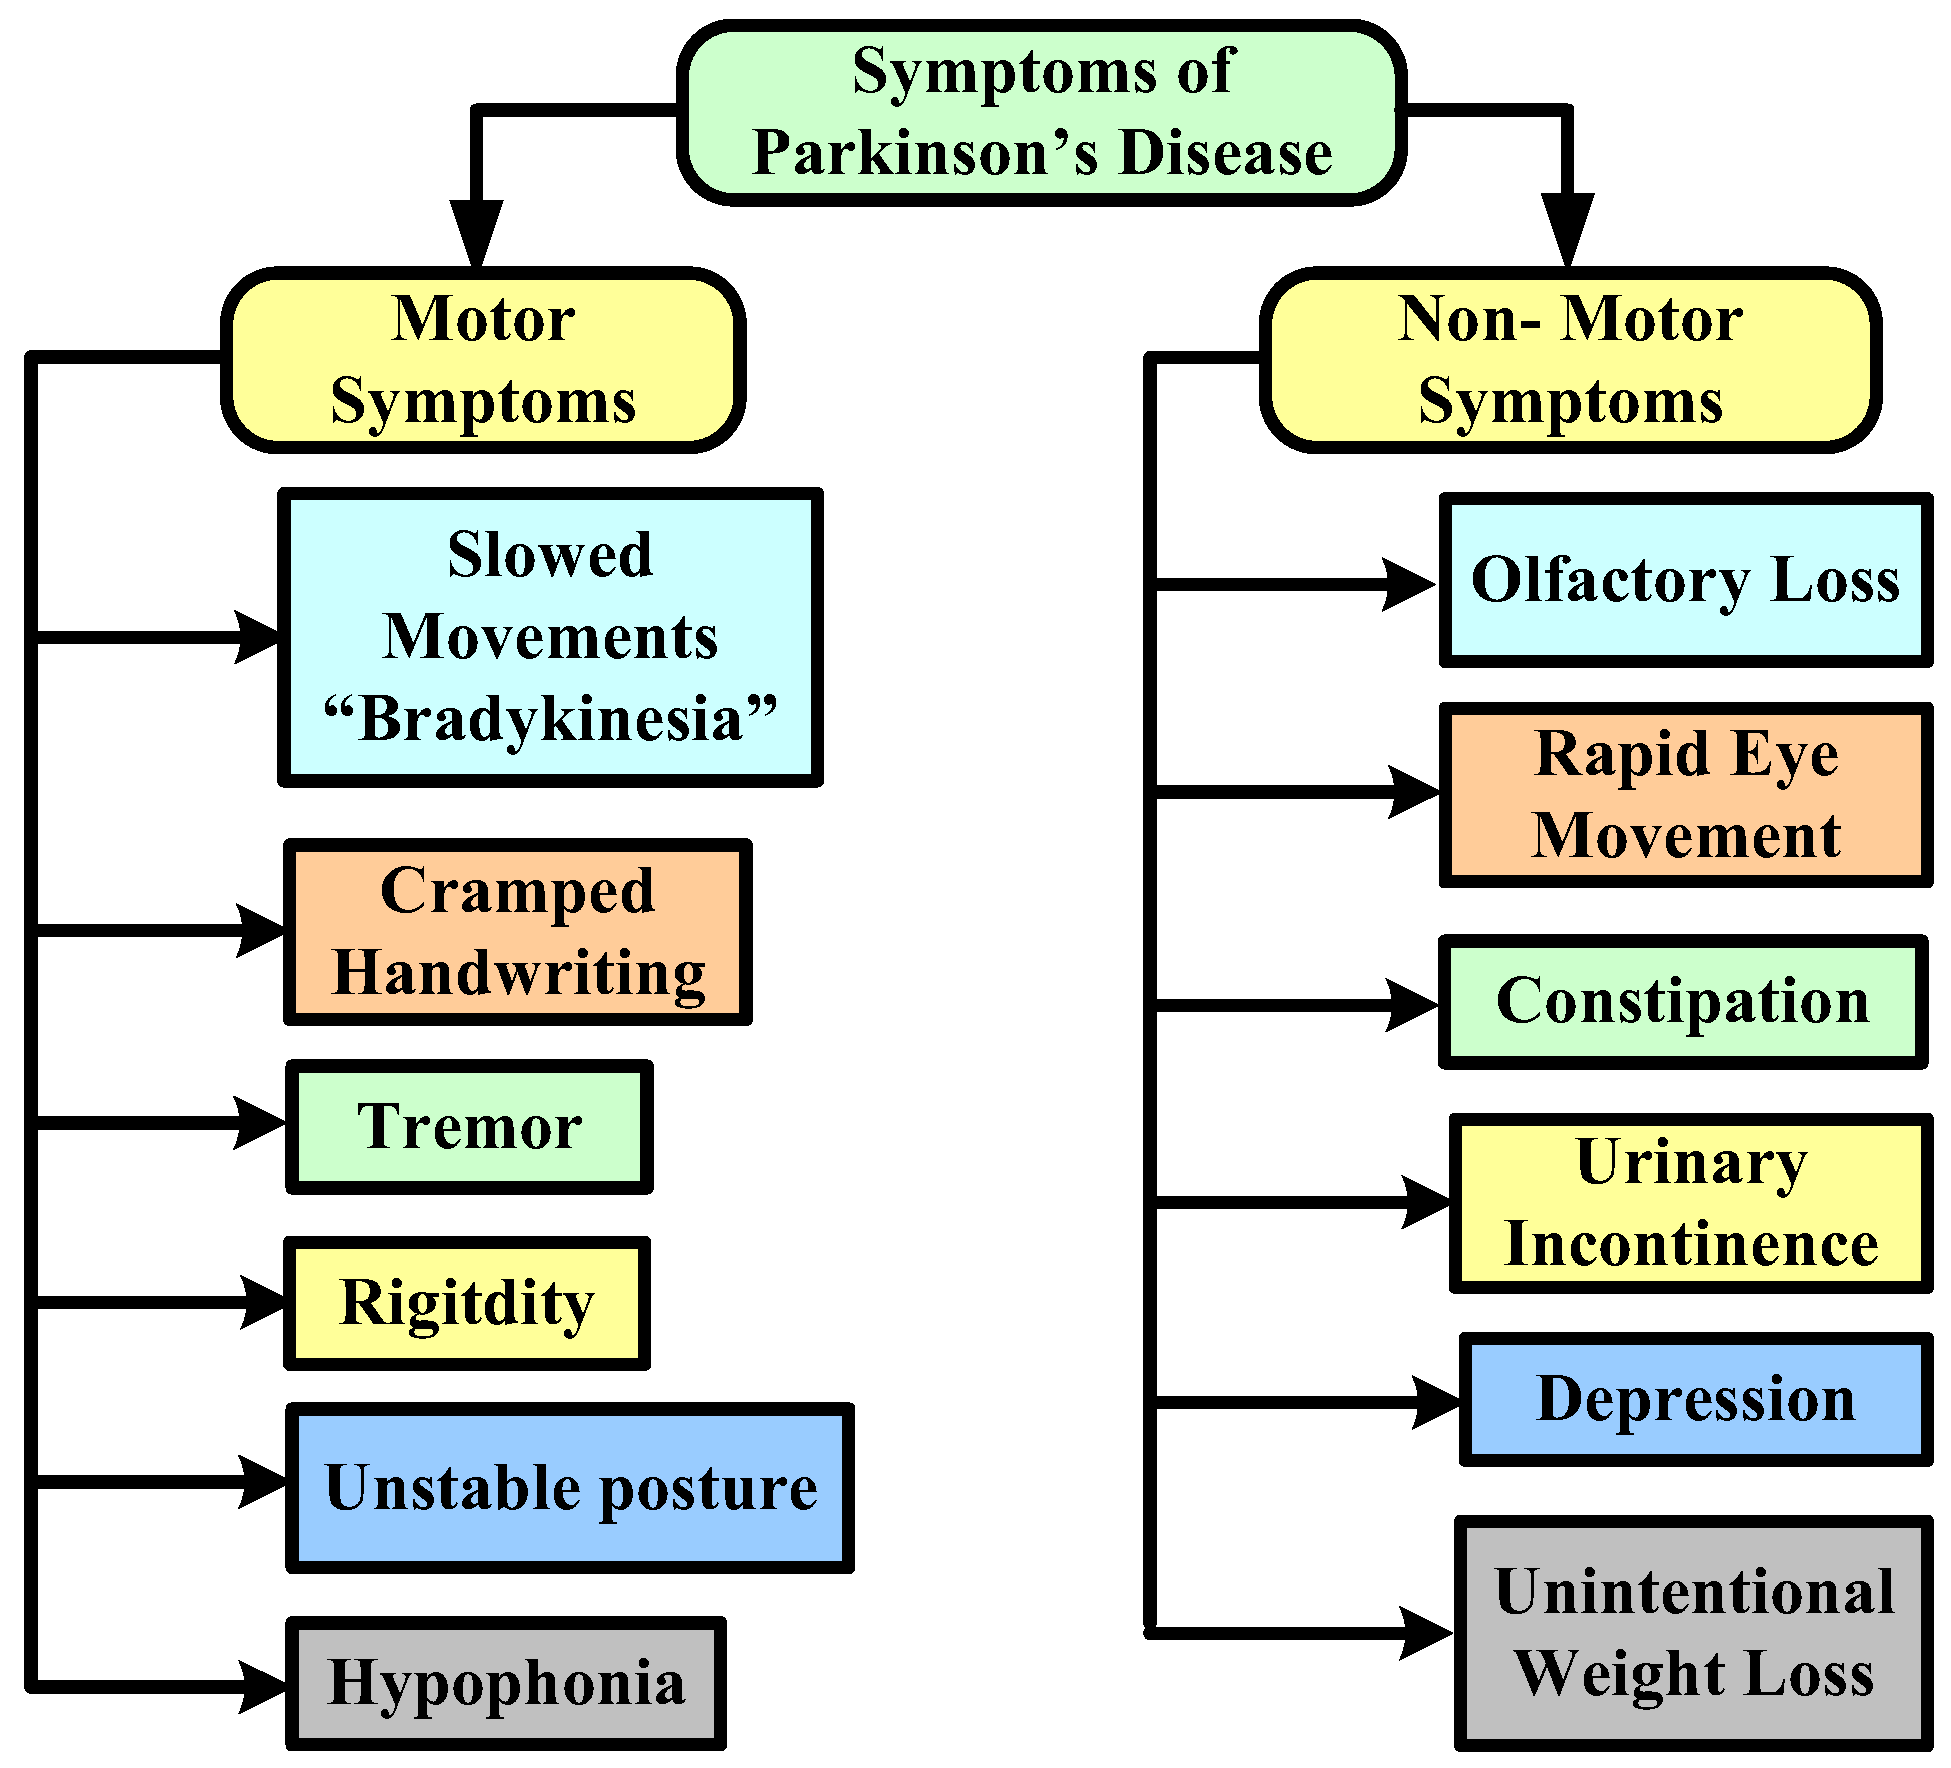
- We introduce the background knowledge of Parkinson disease with main characteristics and major motor and non-motor symptoms.
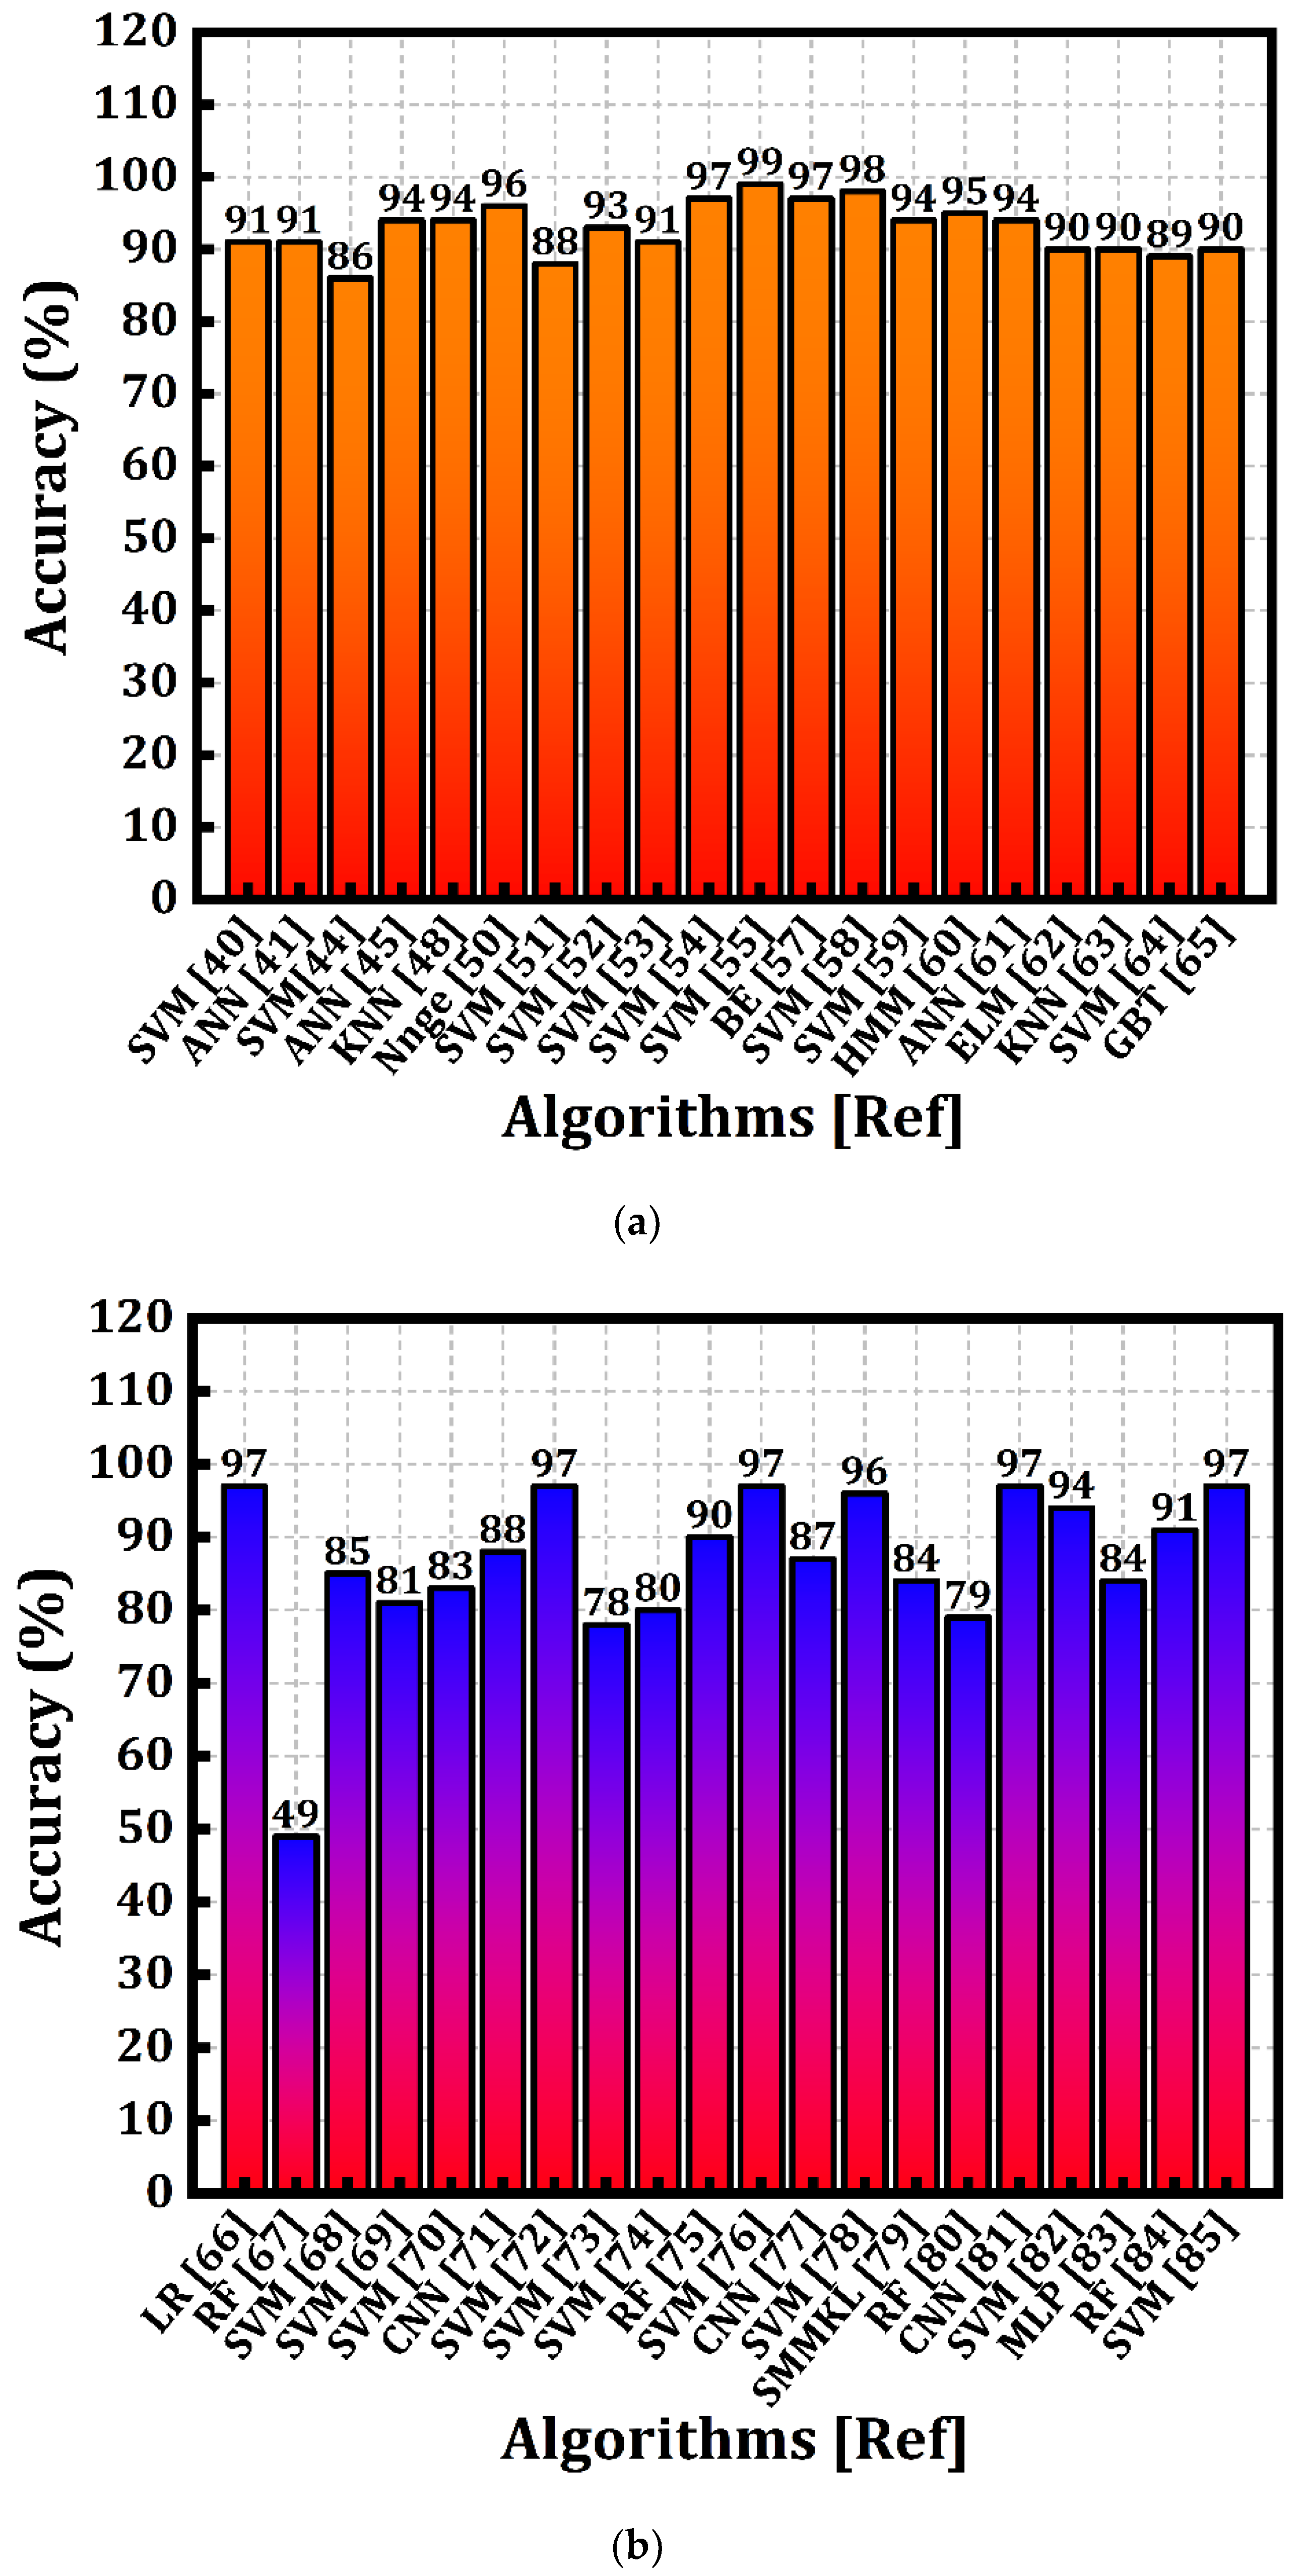
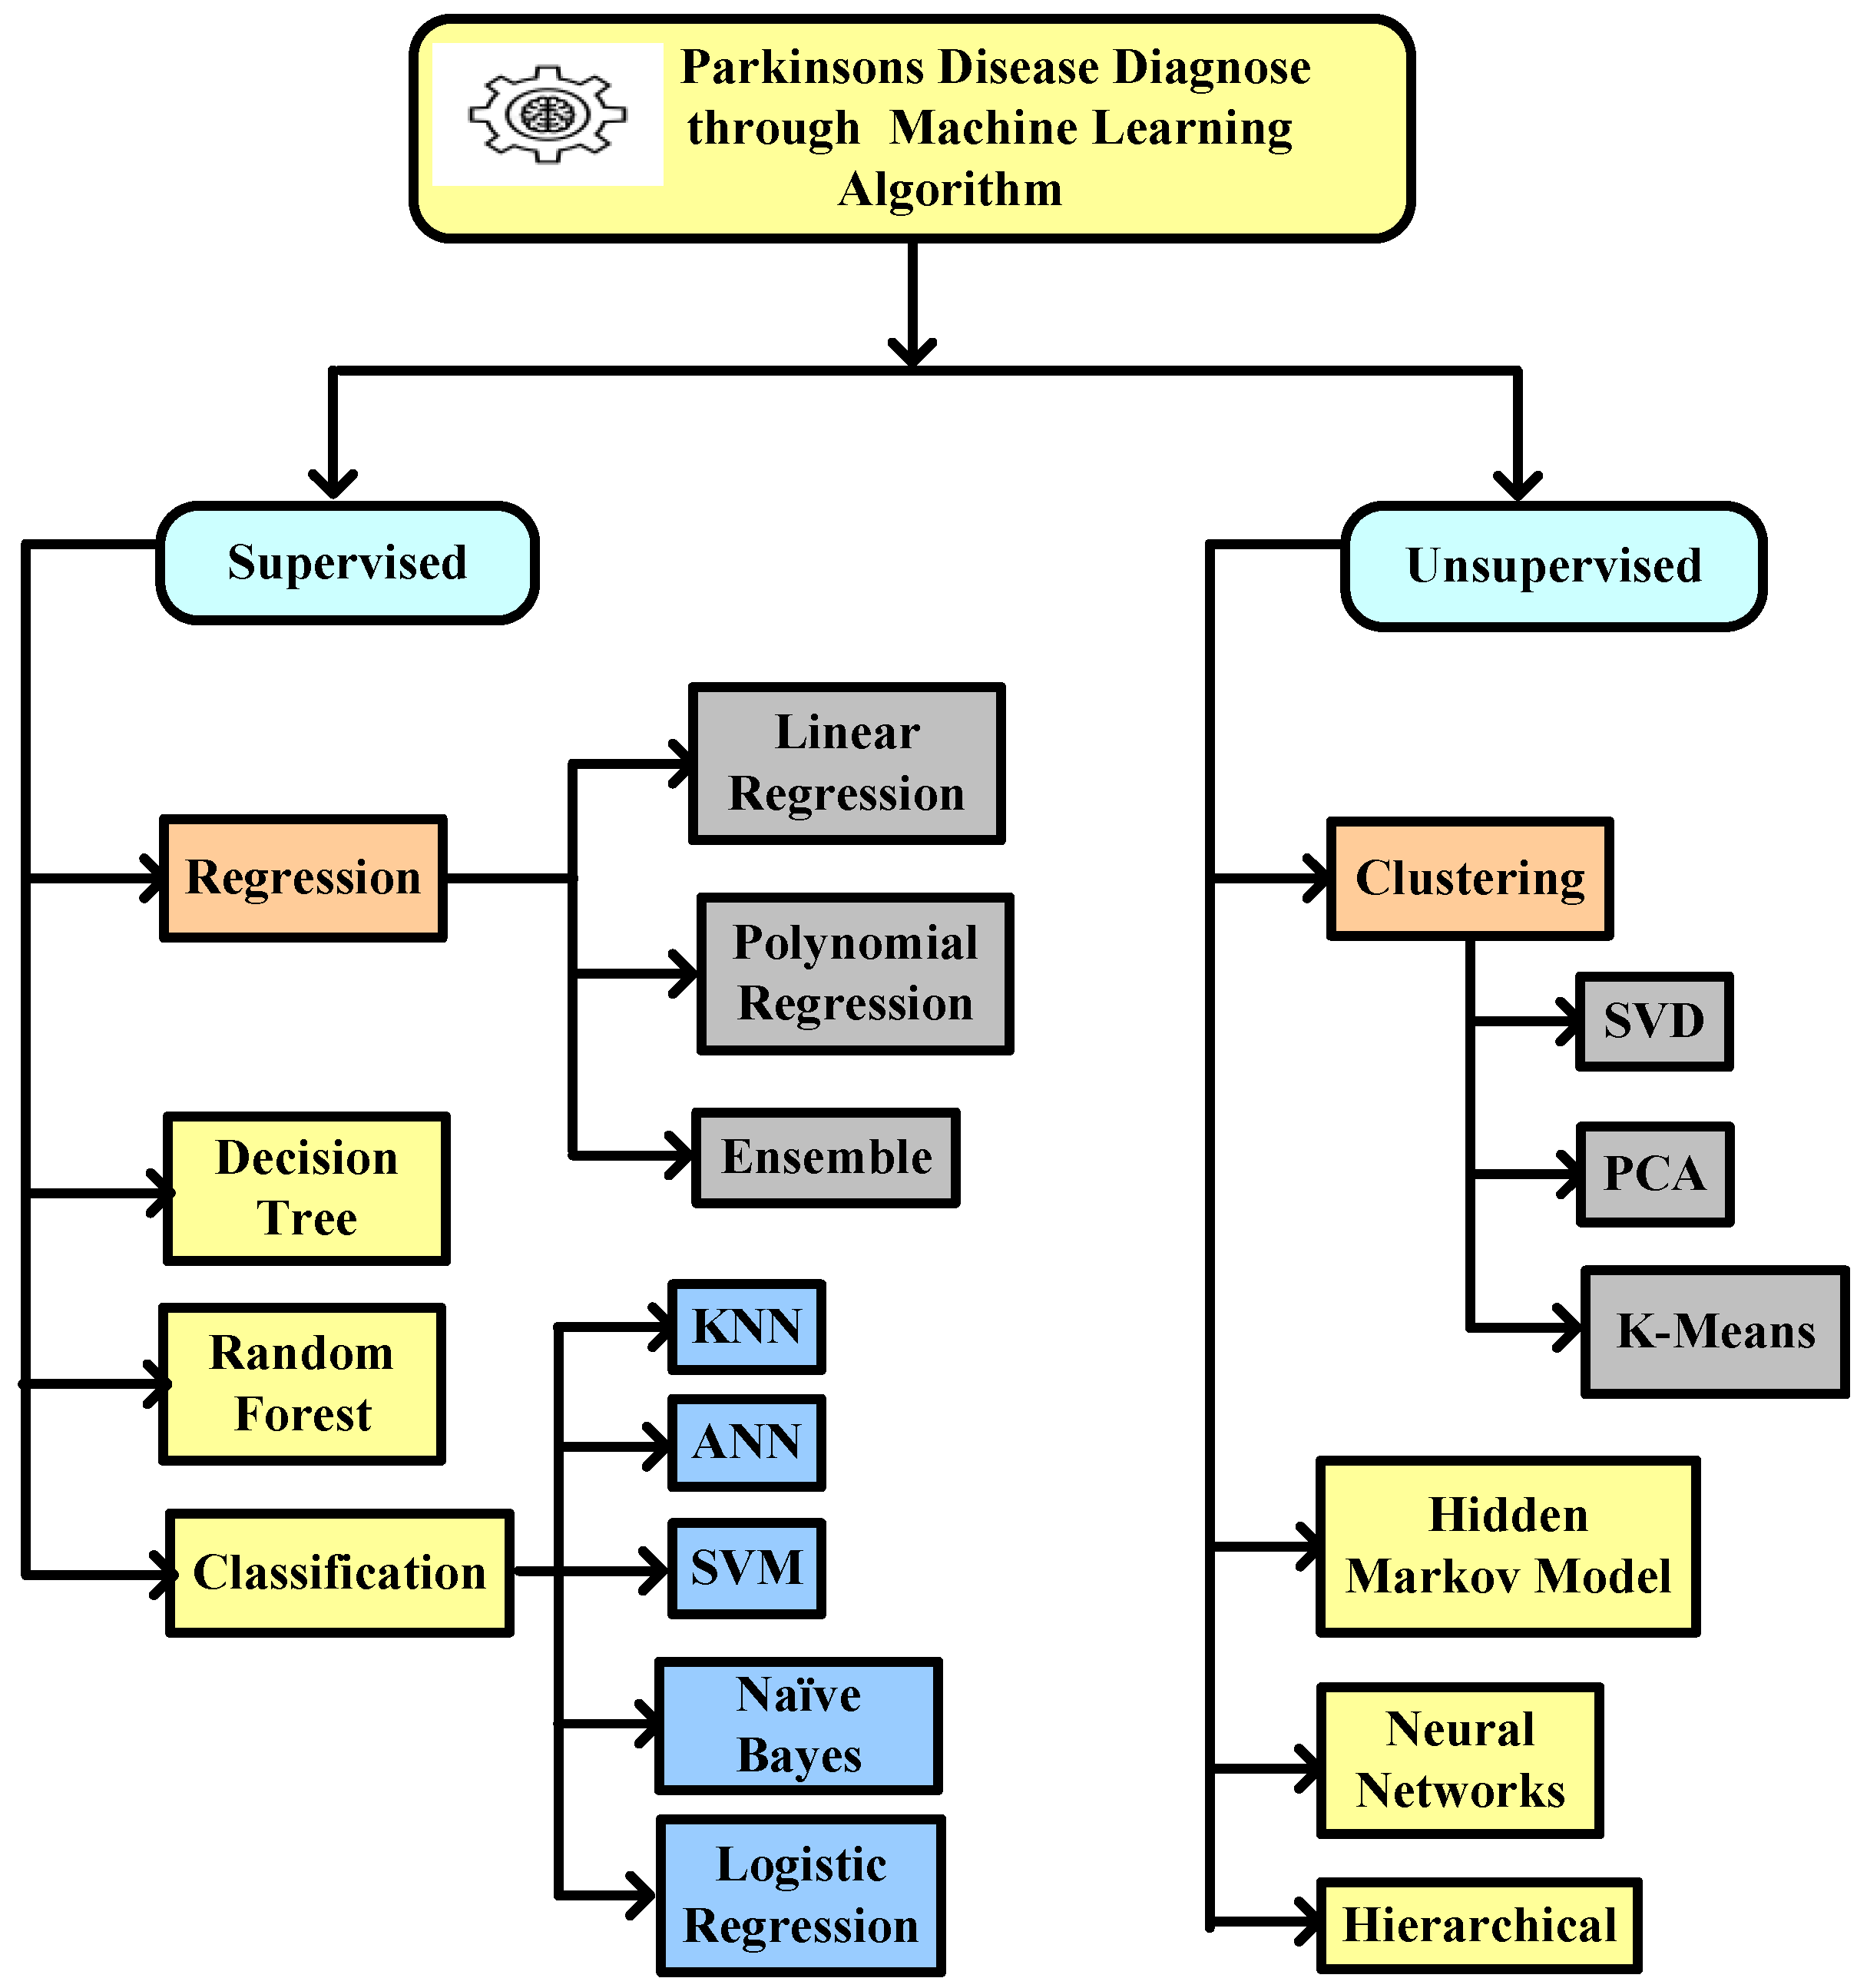
- We classified ML models and also analyzed the accuracy of ML models for the diagnosis of Parkinson disease on the basis of speech, handwriting, and gait parameters.
- In this paper, a different ML-based framework for the diagnosis of Parkinson disease is also discussed, with the objective of enhancing Parkinson disease data.
- Finally, the article highlights the challenges and discusses the recommendations for the future work.
2. Methodology of the Study
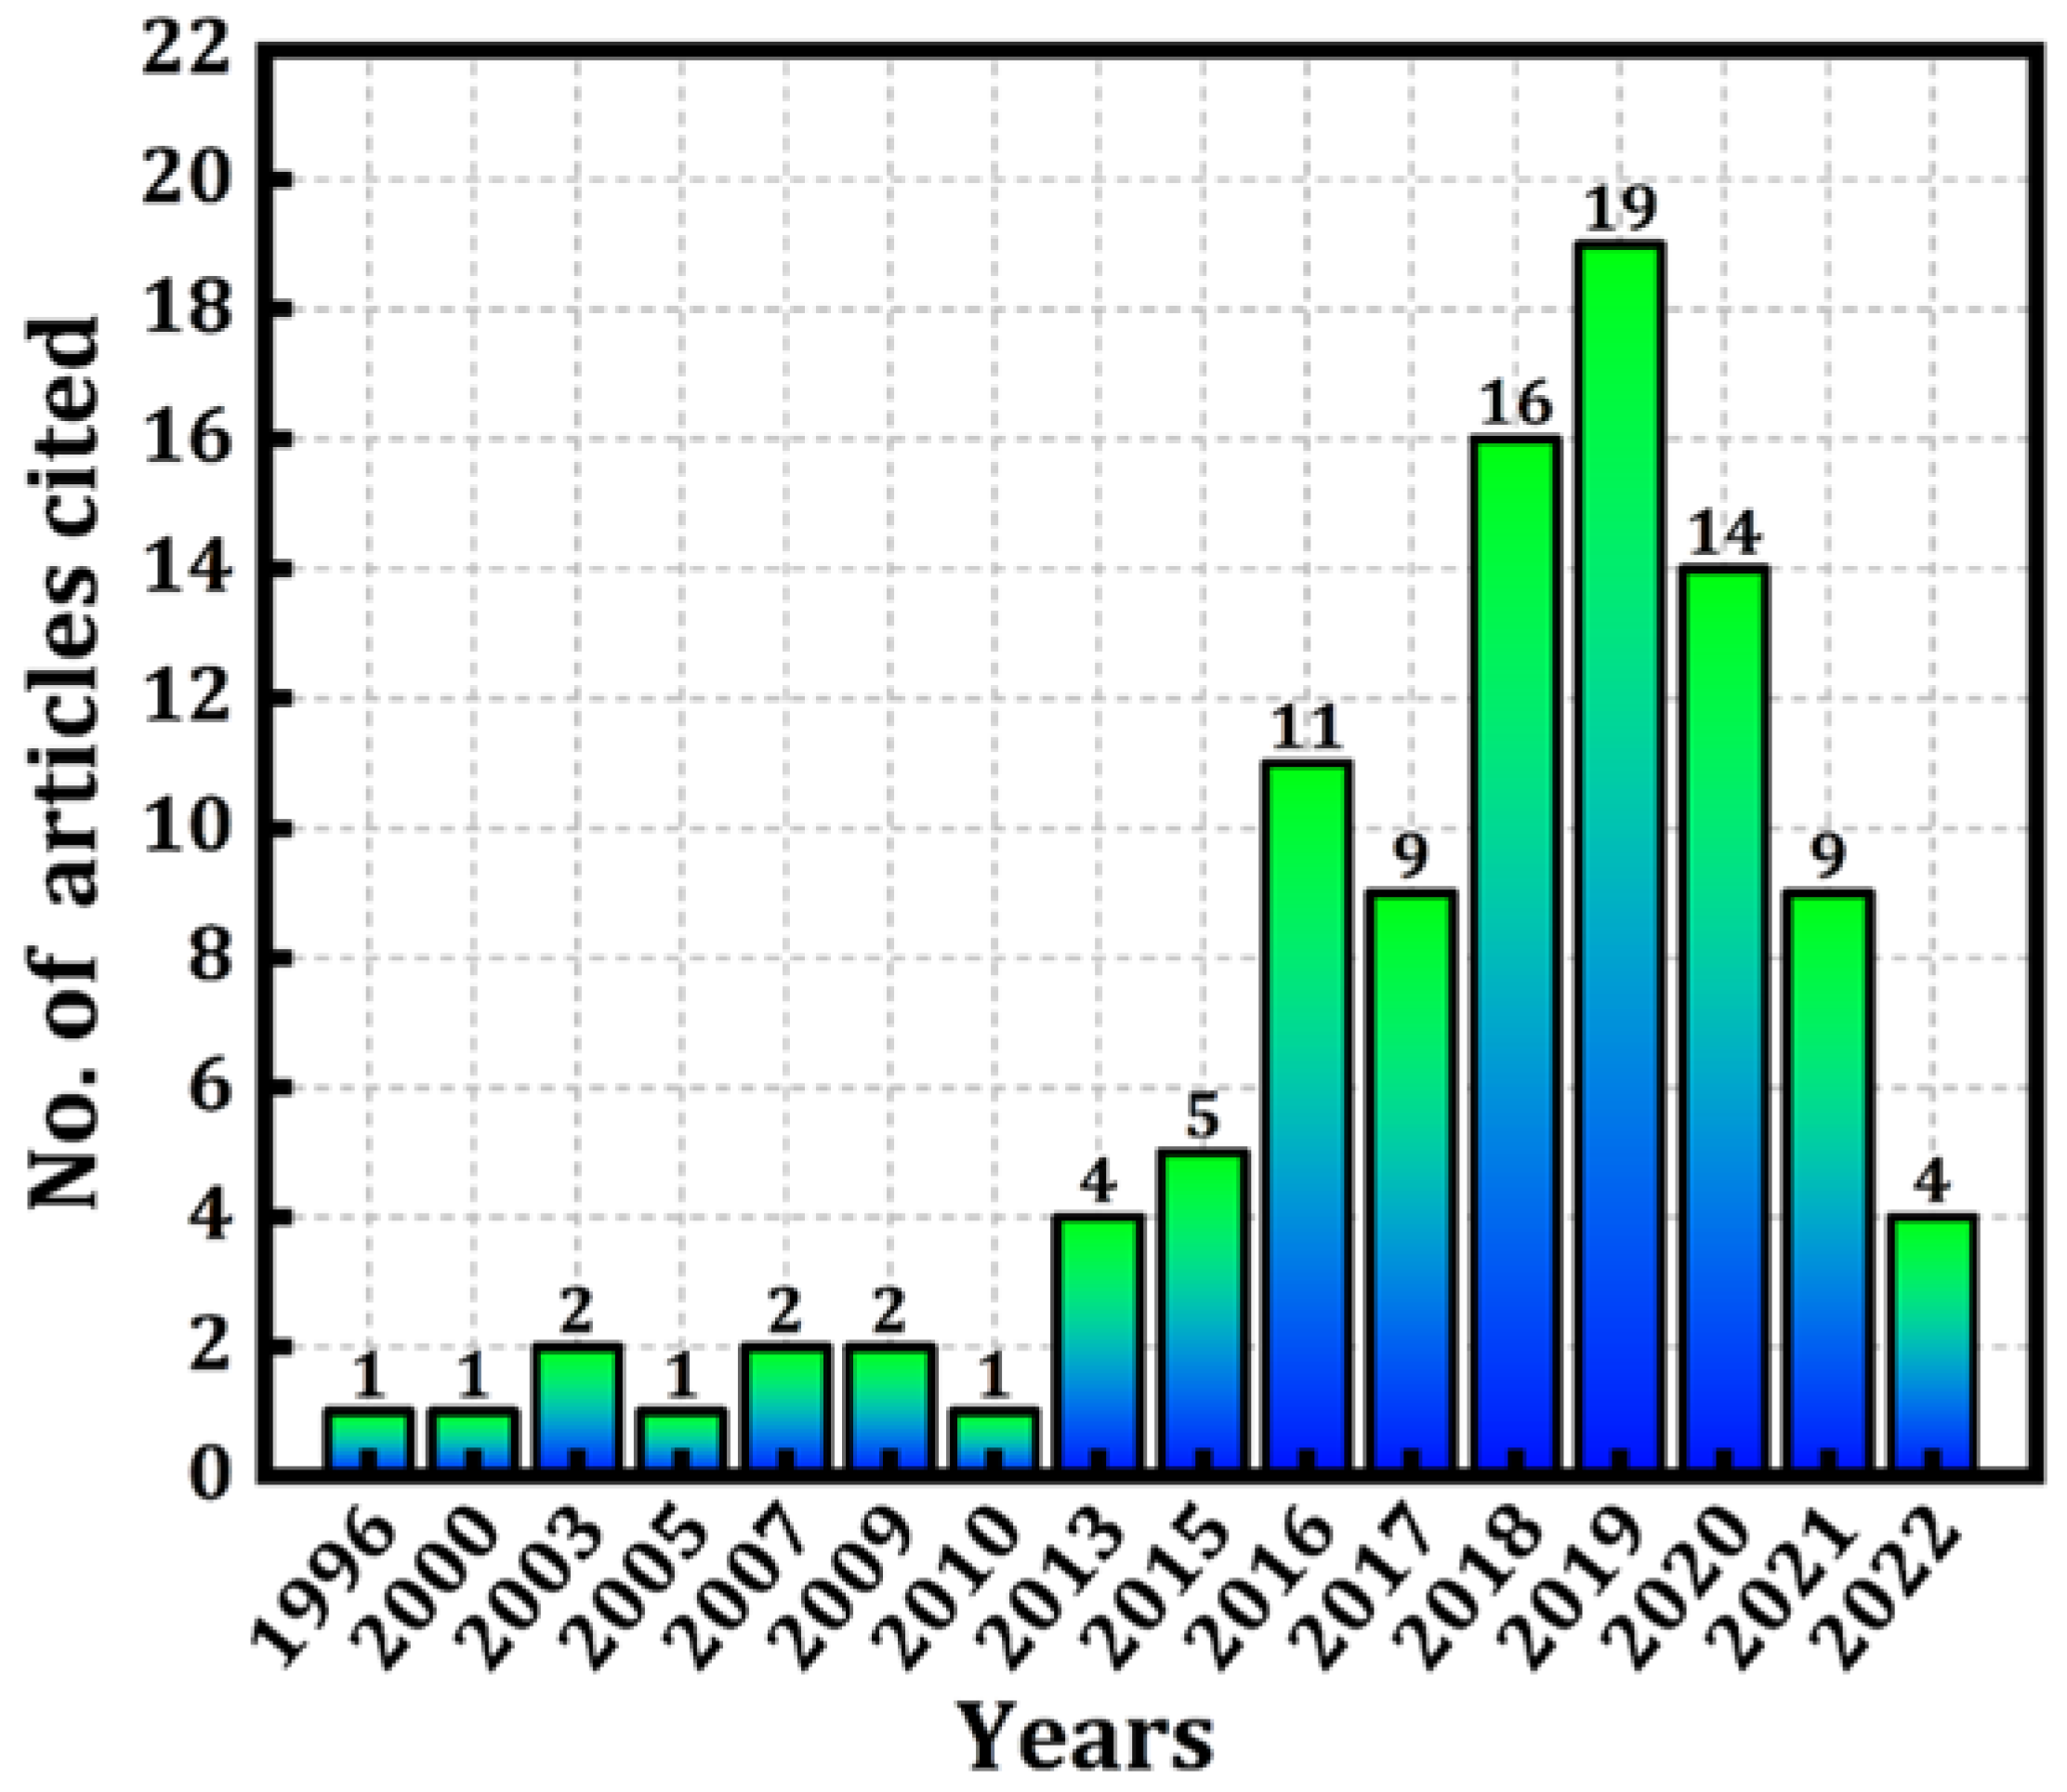
2.1. Data Acquisition
2.2. Journals
3. Parkinson’s Disease: Background
Clinical Methods Used to Diagnose Parkinson’s Disease
- a.
- Medical Treatment
- b.
- COMT Inhibitors
- c.
- Anticholinergic medications
- d.
- Amantadine
4. Machine Learning Techniques Used to Diagnose Parkinson’s Disease
5. Adaptation of the ML Framework
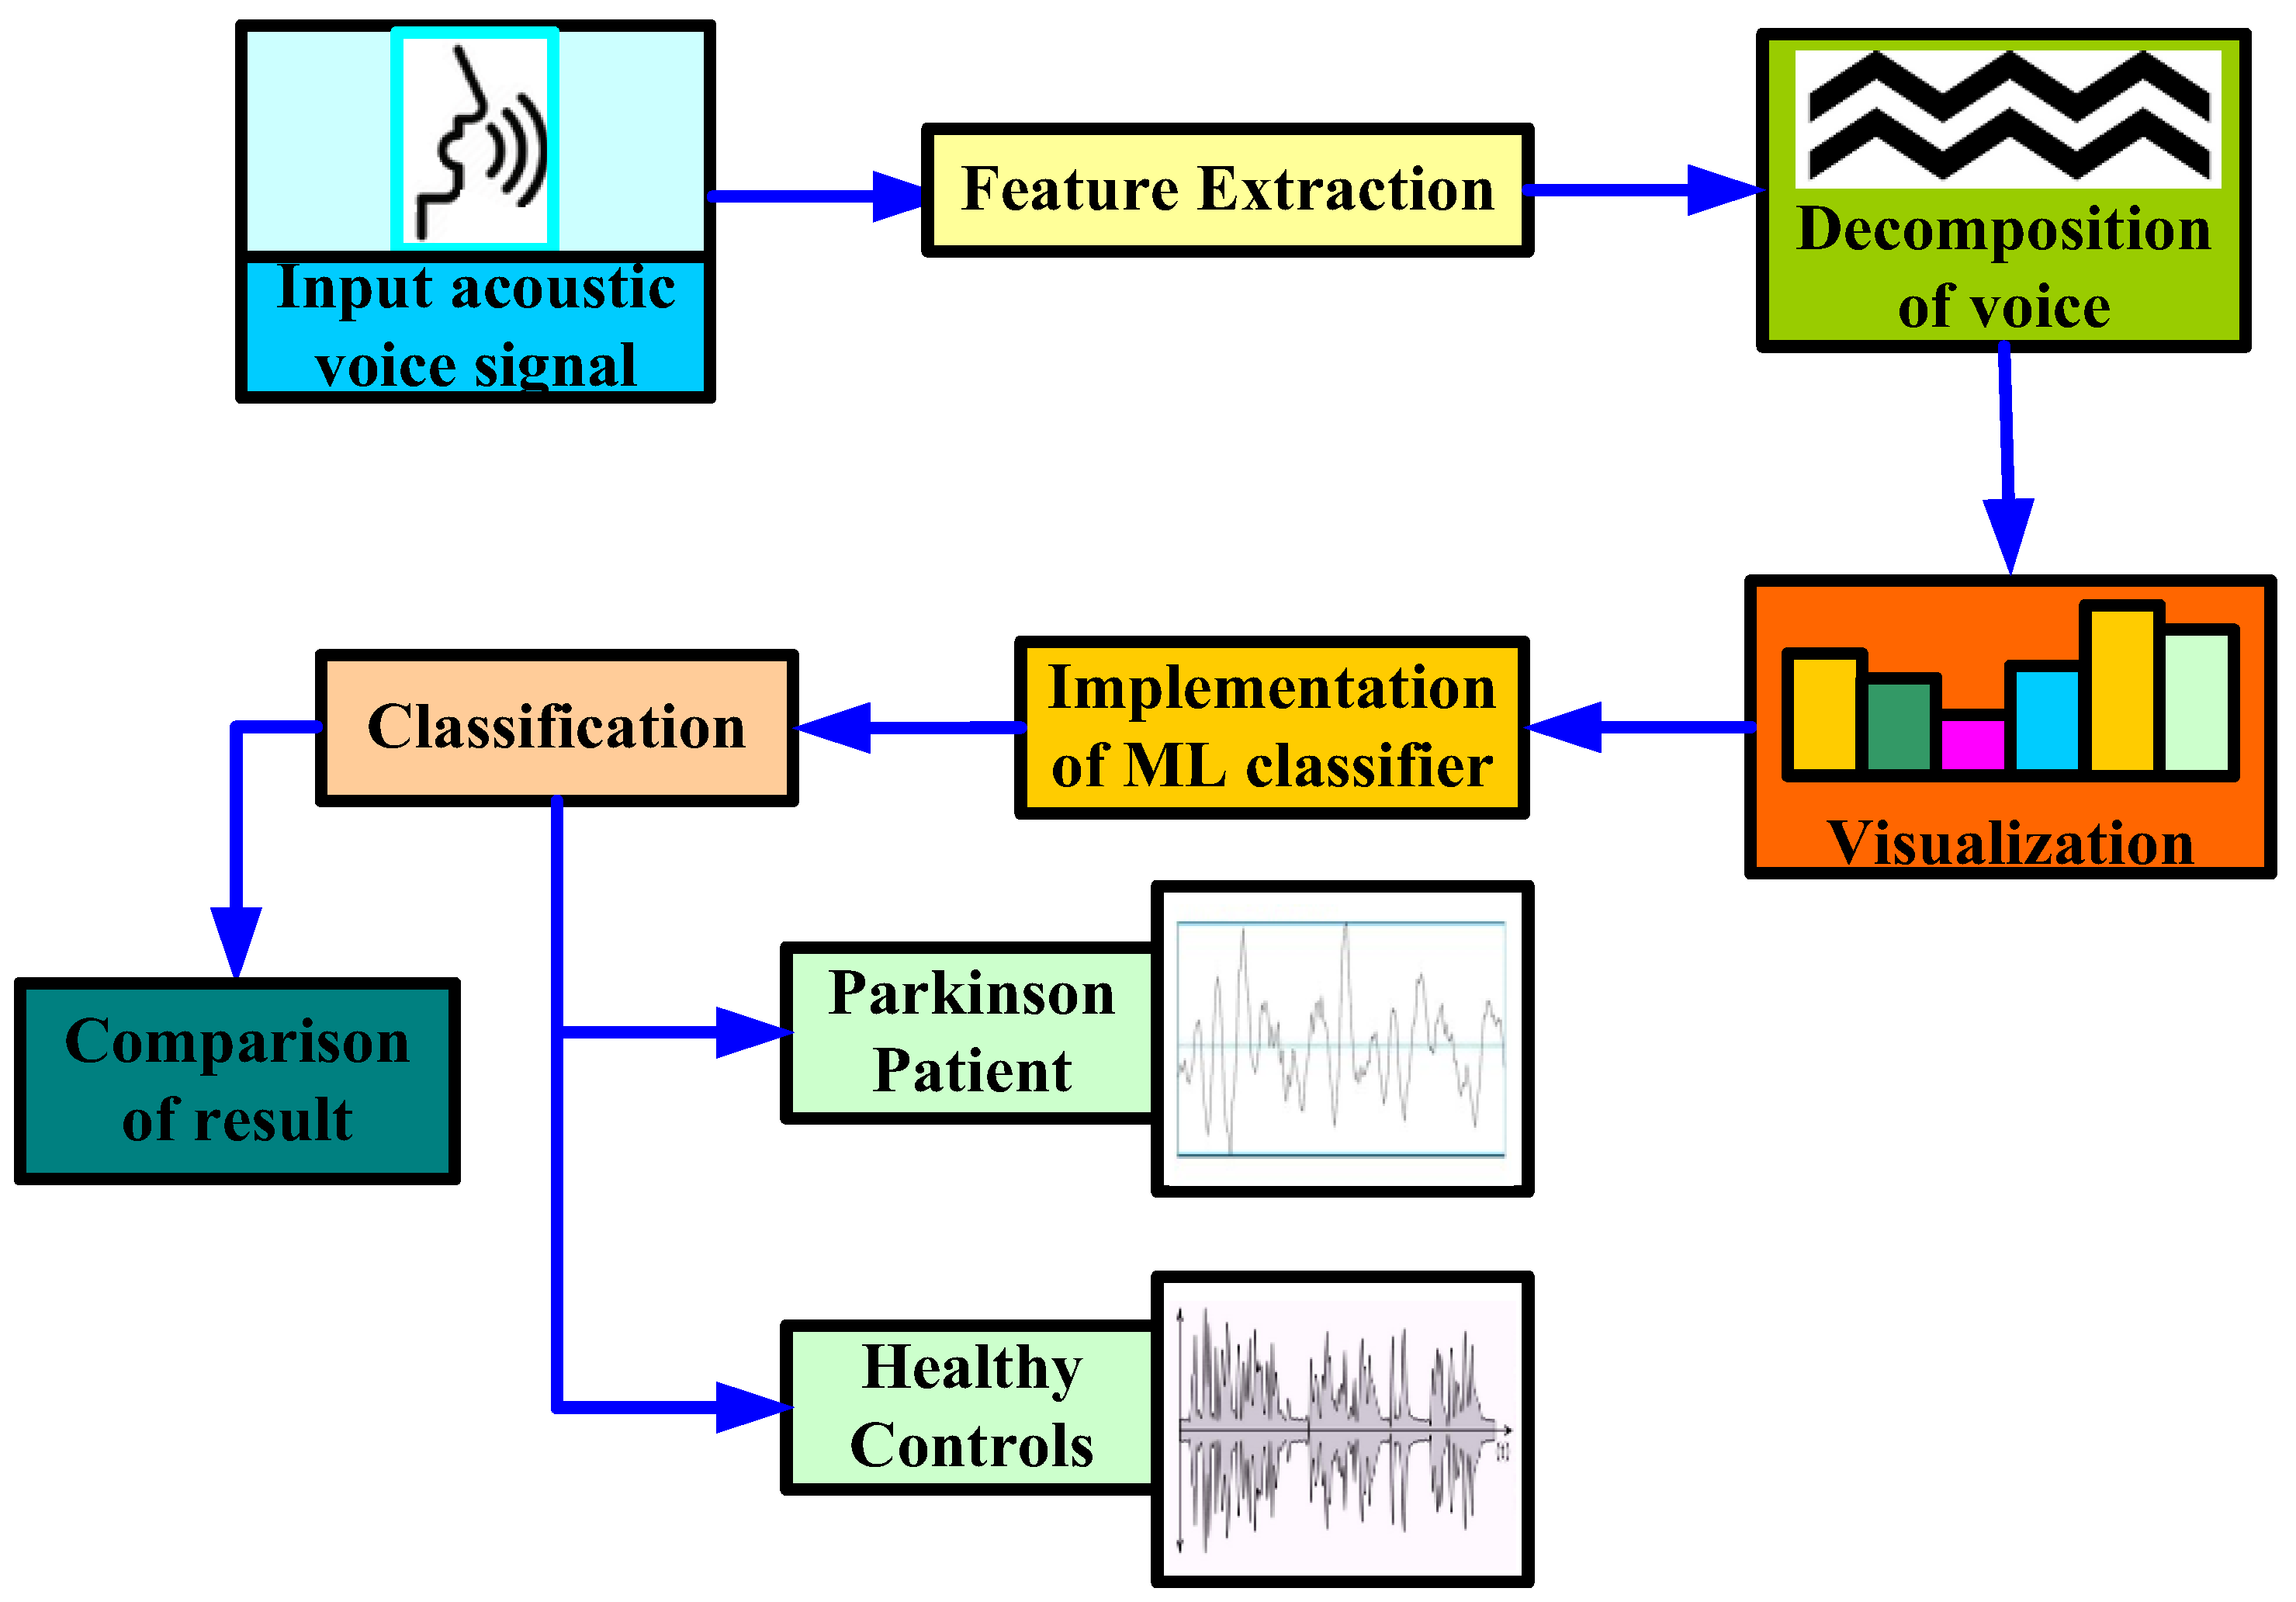
5.1. Architecture Based on Acoustic Voice Dataset as Input
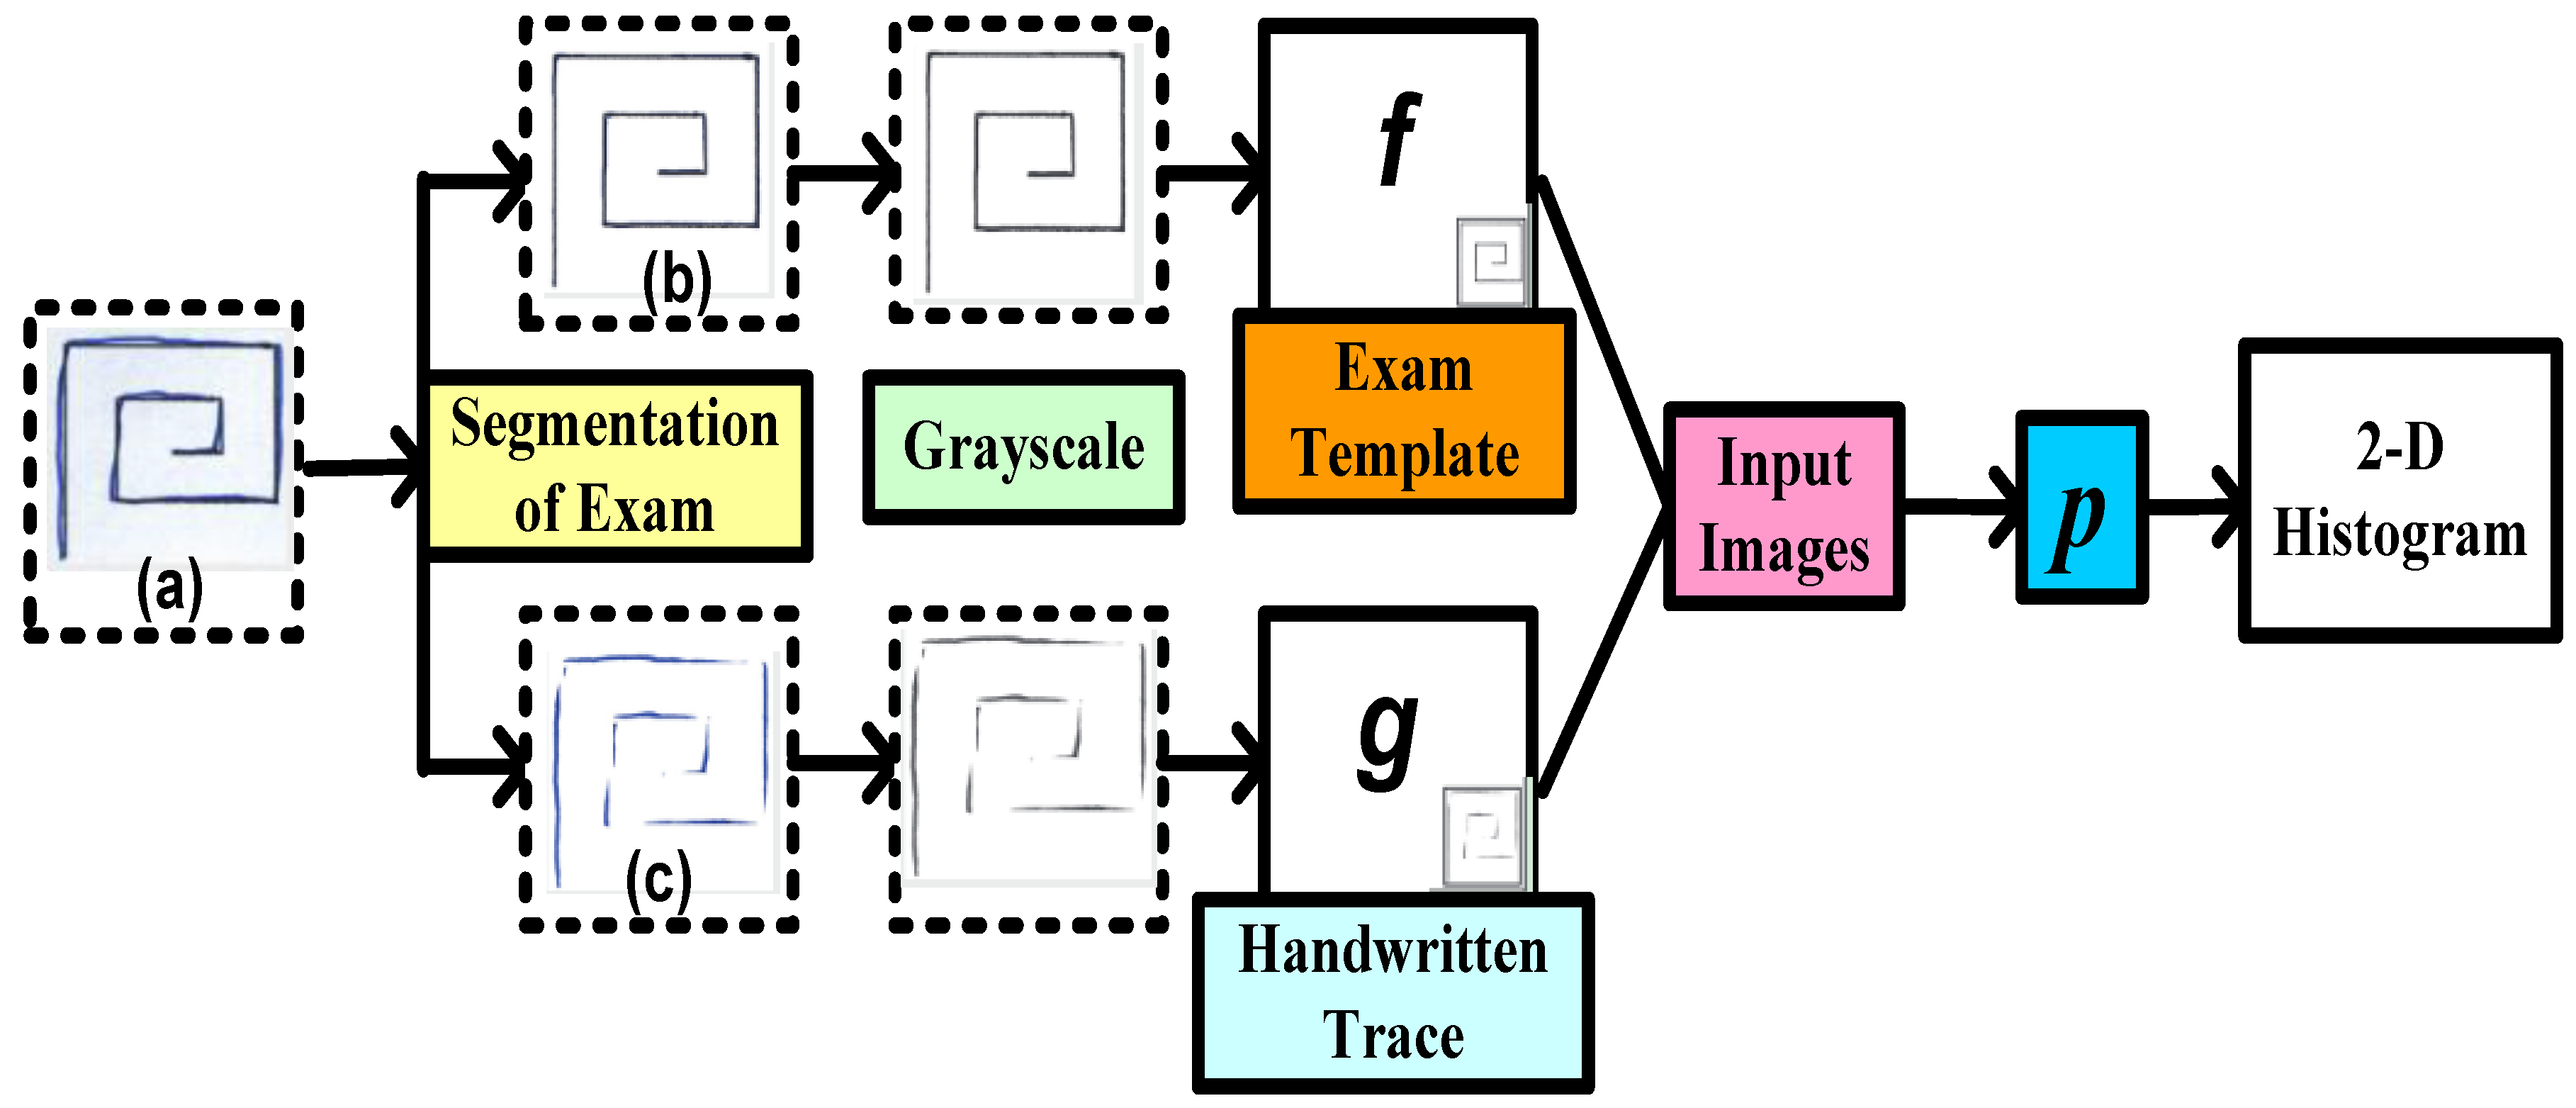
5.2. Architecture Based on Handwritten Patterns as Input
5.3. Architecture Based on Gait Dataset as Input
6. Discussion: Challenges and Recommendations
6.1. Challenges
- Manifold modeling
- Model Interpretation
6.2. Recommendations
- The adoption of real-time and customized based devices with an advanced computing unit is necessary to diagnosis Parkinson’s disease in real-time data through image and sensory data. It has already been proven that ML models have the capability to detect any anomalies of real-time data generated from the IoT-based devices. Edge computing can be integrated with customized devices to compute data at the edge network and provide the results at the same time.
- At present, the researchers have realized different ML models that diagnose Parkinson’s disease on the basis of individual symptoms. The researchers need to focus on developing an ML model that combinedly uses all the symptoms as input parameters for Parkinson’s disease. A light-weight portable device can be used to diagnose the various symptoms of PD by measuring several parameters such as accuracy, precision, sensitivity, recall, etc. This device should be easily wearable and washable, and it should be able to identify the different stages of the disease, along with analyze the changes due to medication treatment.
- Currently wearable sensors are limited to the diagnosis of Parkinson’s disease on the basis of gait parameters. There is a need for embedding the other modules in the wearable device that is capable of detecting Parkinson’s disease. Researchers need to focus on developing wearable sensor devices not only for one symptom but also for diagnosing the other symptoms as well. For instance, a wrist-worn device may be developed and it may be able to collect data continuously over a long period of time and identify different PD symptoms.
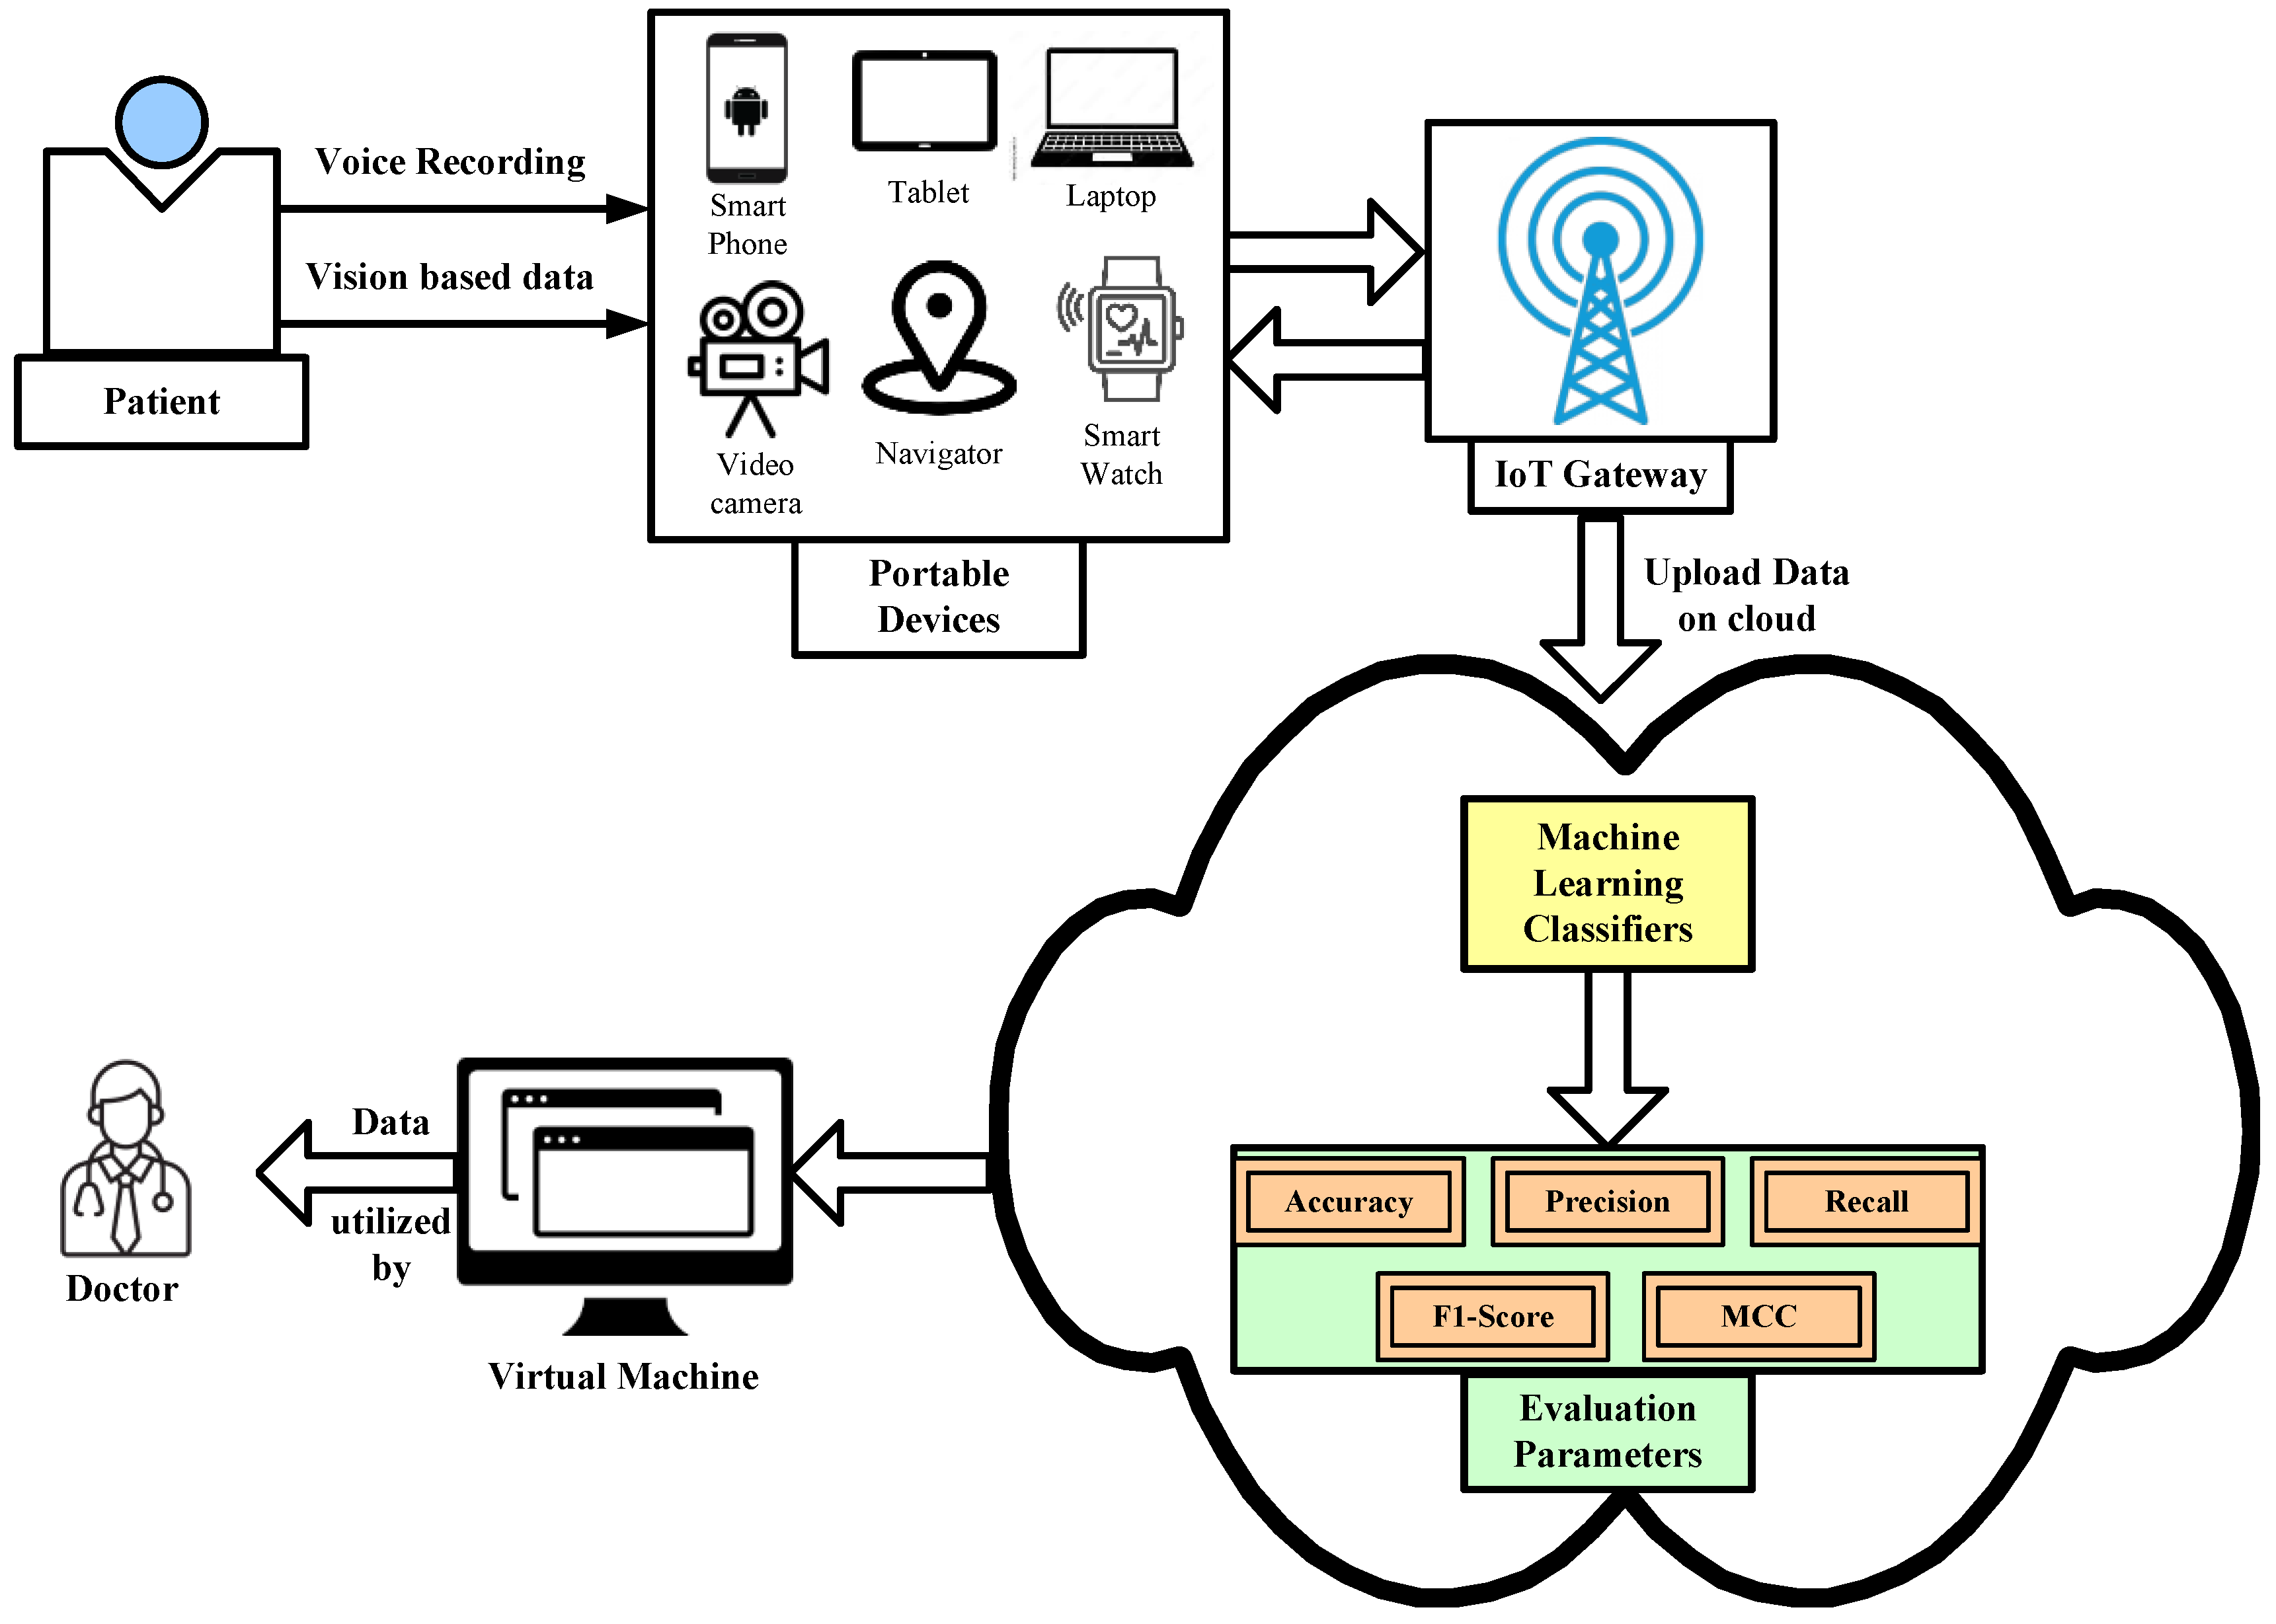
- Cloud- and ML-based frame works diagnose Parkinson’s disease by analyzing individual speech disorders, handwriting parameters, and many more symptoms of the subjective disease based on a cloud computing platform. Here, a patient’s file will be stored in the cloud database where patients can give their sample in the form of a voice recording based through a portable device as shown in Figure 7. The data will then be uploaded in the cloud platform for analysis and classification by using different ML classifier models. Once the patients’ data (based on various symptoms) are diagnosed by the ML classifiers in the cloud platform, the system will automatically generate a decision on whether the patient has symptoms related to PD or not. If the patient’s sample is positive based on PD symptoms, then the system will directly send information to the concerned physician. Once the physician checks all the reports, he will then upload his advice and recommendations to the cloud platform, and patients can easily receive them by their portable device.
- As future work, we intend to study the utilization of big data analytics tools along with AI approaches to diagnose more severe infections and control their spread in a timely manner.
7. Conclusions
Author Contributions
Funding
Conflicts of Interest
References
- Alzubaidi, M.S.; Shah, U.; DhiaZubaydi, H.; Dolaat, K.; Abd-Alrazaq, A.A.; Ahmed, A.; Househ, M. The Role of Neural Network for the Detection of Parkinson’s disease: A Scoping Review. Healthcare 2021, 9, 740. [Google Scholar] [CrossRef] [PubMed]
- Maitín, A.M.; García-Tejedor, A.J.; Muñoz, J.P.R. Machine Learning Approaches for Detecting Parkinson’s Disease from EEG Analysis: A Systematic Review. Appl. Sci. 2020, 10, 8662. [Google Scholar] [CrossRef]
- Maserejian, N.; Vinikoor-Imler, L.; Dilley, A. Estimation of the 2020 Global Population of Parkinson’s Disease (PD) [abstract]. Mov. Disord. 2020, 35 (Suppl. S1), 198. Available online: https://www.mdsabstracts.org/abstract/estimation-of-the-2020-global-population-of-parkinsons-disease-pd/ (accessed on 7 June 2022).
- Van Den Eeden, S.K.; Tanner, C.M.; Bernstein, A.L.; Fross, R.D.; Leimpeter, A.; Bloch, D.A.; Nelson, L.M. Incidence of Parkinson’s disease: Variation by age, gender, and race/ethnicity. Am J Epidemiol. 2003, 157, 1015–1022. [Google Scholar] [CrossRef] [PubMed]
- Gunduz, H. Deep Learning-Based Parkinson’s Disease Classification Using Vocal Feature Sets. IEEE Access 2019, 7, 115540–115551. [Google Scholar] [CrossRef]
- Quan, C.; Ren, K.; Luo, Z. A Deep Learning-Based Method for Parkinson’s Disease Detection Using Dynamic Features of Speech. IEEE Access 2021, 9, 10239–10252. [Google Scholar] [CrossRef]
- Braak, H.; Del Tredici, K.; Rüb, U.; De Vos, R.A.; Steur, E.N.J.; Braak, E. Staging of brain pathology related to sporadic Parkinson’s disease. Neurobiol. Aging 2003, 24, 197–211. [Google Scholar] [CrossRef]
- Sveinbjornsdottir, S. The clinical symptoms of Parkinson’s disease. J. Neurochem. 2016, 139, 318–324. [Google Scholar] [CrossRef]
- Tsanas, A.; Little, M.A.; McSharry, P.E.; Ramig, L.O. Accurate telemonitoring of Parkinson’s disease progression by non-invasive speech tests. IEEE Trans. Biomed. Eng. 2009, 57, 884–893. [Google Scholar] [CrossRef]
- Perez, K.S.; Ramig, L.O.; Smith, M.E.; Dromey, C. The Parkinson larynx: Tremor and video stroboscopic findings. J. Voice 1996, 10, 354–361. [Google Scholar] [CrossRef]
- Bugalho, P.; Viana-Baptista, M. REM sleep behavior disorder and motor dysfunction in Parkinson’s diseas—A longitudinal study. Parkinsonism Relat. Disord. 2013, 19, 1084–1087. [Google Scholar] [CrossRef] [PubMed]
- Balestrino, R.; Schapira, A.H. Parkinson disease. Eur. J. Neurol. 2020, 27, 27–42. [Google Scholar] [CrossRef] [PubMed]
- Rahn, D.A.; Chou, M.; Jiang, J.J.; Zhang, Y. Phonatory impairment in Parkinson’s disease: Evidence from nonlinear dynamic analysis and perturbation analysis. J. Voice 2007, 21, 64–71. [Google Scholar] [CrossRef] [PubMed]
- Ahlrichs, C.; Lawo, M. Parkinson’s Disease Motor Symptoms in Machine Learning: A Review. Health Inform. Int. J. 2013, 2, 4. [Google Scholar] [CrossRef]
- Mei, J.; Desrosiers, C.; Frasnelli, J. Machine Learning for the Diagnosis of Parkinson’s Disease: A Review of Literature. Front. Aging Neurosci. 2021, 13, 633752. [Google Scholar] [CrossRef]
- Battineni, G.; Chintalapudi, N.; Amenta, F. Comparative Machine Learning Approach in Dementia Patient Classification using Principal Component Analysis. In Proceedings of the 12th International Conference on Agents and Artificial Intelligence, Valletta, Malta, 22–24 February 2020. [Google Scholar]
- Toth, C.; Rajput, M.; Rajput, A.H. Anomalies of asymmetry of clinical signs in parkinsonism. Mov. Disord. 2004, 19, 51–57. [Google Scholar] [CrossRef]
- Zappia, M.; Annesi, G.; Nicoletti, G.; Arabia, G.; Annesi, F.; Messina, D.; Pugliese, P.; Spadafora, P.; Tarantino, P.; Carrideo, S. Sex differences in clinical and genetic determinants of levodopa peak-dose dyskinesias in Parkinson disease: An exploratory study. Arch. Neurol. 2005, 62, 601–605. [Google Scholar] [CrossRef]
- Little, M.A.; McSharry, P.E.; Roberts, S.J.; Costello, D.A.E.; Moroz, I.M. Exploiting nonlinear recurrence and fractal scaling properties for voice disorder detection. Nat. Prec. 2007, 6, 23. [Google Scholar]
- Surathi, P.; Jhunjhunwala, K.; Yadav, R.; Pal, P.K. Research in Parkinson’s disease in India: A review. Ann. Indian. Acad. Neurol. 2016, 19, 9–20. [Google Scholar] [CrossRef]
- Available online: https://www.healthcareradius.in/clinical/28890-parkinsons-disease-and-the-ageing-indian-population (accessed on 11 June 2022).
- Available online: https://www.parkinson.org/understanding-parkinsons/causes/genetics (accessed on 6 August 2022).
- Kalinderi, K.; Bostantjopoulou, S.; Fidani, L. The genetic background of Parkinson’s dis-ease: Current progress and future prospects. Acta Neurol. Scand. 2016, 134, 314–326. [Google Scholar] [CrossRef]
- Gasser, T. Genomic and proteomic biomarkers for Parkinson disease. Neurology 2009, 72 (Suppl. S2), S27–S31. [Google Scholar] [CrossRef] [PubMed]
- Available online: https://www.mayoclinic.org/diseases-conditions/parkinsons-disease/symptoms-causes/syc-20376055 (accessed on 11 June 2022).
- Martin-Bastida, A.; Pietracupa, S.; Piccini, P. Neuromelanin in parkinsonian disorders: An update. Int. J. Neurosci. 2017, 127, 1116–1123. [Google Scholar] [CrossRef] [PubMed]
- Available online: https://www.aans.org/en/Patients/Neurosurgical-Conditions-and-Treatments/Parkinsons-Disease (accessed on 12 June 2022).
- Das, S.; Zhang, Z.; Ang, L.C. Clinicopathological overlap of neurodegenerative diseases: A comprehensive review. J. Clin. Neurosci. 2020, 78, 30–33. [Google Scholar] [CrossRef] [PubMed]
- Iarkov, A.; Barreto, G.E.; Grizzell, J.A.; Echeverria, V. Strategies for the Treatment of Parkinson’s Disease: Beyond Dopamine. Front. Aging Neurosci. 2020, 12, 4. [Google Scholar] [CrossRef]
- Salamon, A.; Zádori, D.; Szpisjak, L.; Klivényi, P.; Vécsei, L. What is the Impact of Catechol-O-Methyltransferase (COMT) on Parkinson’s Disease Treatment? In Expert Opinion on Pharmacotherapy; Taylor & Francis: Abingdon, UK, 2022. [Google Scholar] [CrossRef]
- Gallazzi, M.; Mauri, M.; Bianchi, M.L.; Riboldazzi, G.; PrinciottaCariddi, L.; Carimati, F.; Rebecchi, V.; Versino, M. Selegiline reduces daytime sleepiness in patients with Parkinson’s disease. Brain Behav. 2021, 11, e01880. [Google Scholar] [CrossRef]
- Marzoughi, S.; Banerjee, A.; Jutzeler, C.R.; Prado, M.A.; Rosner, J.; Cragg, J.J.; Cashman, N. Tardive neurotoxicity of anticholinergic drugs: A review. J. Neurochem. 2021, 158, 1334–1344. [Google Scholar] [CrossRef]
- Marmol, S.; Feldman, M.; Singer, C.; Margolesky, J. Amantadine Revisited: A Contender for Initial Treatment in Parkinson’s Disease? CNS Drugs 2021, 35, 1141–1152. [Google Scholar] [CrossRef]
- Park, H.; Kim, H.J.; Jeon, B.S. Parkinsonism in spinocerebellar ataxia. BioMed Res. Int. 2015, 2015, 125273. [Google Scholar] [CrossRef]
- Rawat, A.S.; Rana, A.; Kumar, A.; Bagwari, A. Application of multi layer artificial neural network in the diagnosis system: A systematic review. IAES Int. J. Artif. Intell. 2018, 7, 138. [Google Scholar] [CrossRef]
- Rana, A.; Rawat, A.S.; Bijalwan, A.; Bahuguna, H. Application of Multi Layer (Perceptron) Artificial Neural Network in the Diagnosis System: A Systematic Review. In Proceedings of the 2018 International Conference on Research in Intelligent and Computing in Engineering (RICE), San Salvador, El Salvador, 22–24 August 2018; pp. 1–6. [Google Scholar] [CrossRef]
- Al-Wahishi, A.; Belal, N.; Ghanem, N. Diagnosis of Parkinson’s Disease by Deep Learning Techniques Using Handwriting Dataset. In Proceedings of the International Symposium on Signal Processing and Intelligent Recognition Systems, Chennai, India, 14–17 October 2020. [Google Scholar]
- Neharika, D.B.; Anusuya, S. Machine Learning Algorithms for Detection of Parkinson’s Disease using Motor Symptoms: Speech and Tremor. IJRTE 2020, 8, 47–50. [Google Scholar]
- Little, M.A.; McSharry, P.E.; Hunter, E.J.; Spielman, J.; Ramig, L.O. Suitability of dysphonia measurements for telemonitoring of Parkinson’s disease. IEEE Trans. Biomed. Eng. 2009, 56, 1015. [Google Scholar] [CrossRef] [PubMed]
- Benba, A.; Jilbab, A.; Hammouch, A.; Sandabad, S. Voiceprints analysis using MFCC and SVM for detecting patients with Parkinson’s disease. In Proceedings of the IEEE 2015 International Conference on Electrical and Information Technologies (ICEIT), Marrakech, Morocco, 25–27 March 2015; pp. 300–304. [Google Scholar]
- Bhattacharya, I.; Bhatia, M.P.S. SVM classification to distinguish Parkinson disease patients. In Proceedings of the 1st Amrita ACM-WCelebration on Women in Computing in India, Tamilnadu, India, 16–17 September 2010; p. 14. [Google Scholar]
- Mathur, R.; Pathak, V.; Bandil, D. Parkinson Disease Prediction Using Machine Learning Algorithm. In Emerging Trends in Expert Applications and Security; Springer: Singapore, 2019; pp. 357–363. [Google Scholar]
- Sakar, B.E.; Isenkul, M.E.; Sakar, C.O.; Sertbas, A.; Gurgen, F.; Delil, S.; Apaydin, H.; Kursun, O. Collection and analysis of a Parkinson speech dataset with multiple types of sound recordings. IEEE J. Biomed. Health Inform. 2013, 17, 828–834. [Google Scholar] [CrossRef] [PubMed]
- Sakar, C.O.; Serbes, G.; Gunduz, A.; Tunc, H.C.; Nizam, H.; Sakar, B.E.; Tutuncu, M.; Aydin, T.; Isenkul, M.E.; Apaydin, H. A comparative analysis of speech signal processing algorithms for Parkinson’s disease classification and the use of the tunable-factor wavelet transform. Appl. Soft Comput. 2019, 74, 255–263. [Google Scholar] [CrossRef]
- Yasar, A.; Saritas, I.; Sahman, M.A.; Cinar, A.C. Classification of Parkinson Disease Data with Artificial Neural Networks. In IOP Conference Series: Materials Science and Engineering; IOP Publishing: Bristol, UK, 2019; Volume 675, p. 012031. [Google Scholar]
- Poewe, W.; Seppi, K.; Tanner, C.M.; Halliday, G.M.; Brundin, P.; Volkmann, J.; Schrag, A.E.; Lang, A.E. Parkinson disease. Nat. Rev. Dis. Primers 2017, 3, 17013. [Google Scholar] [CrossRef]
- Yao, L.; Brown, P.; Shoaran, M. Resting Tremor Detection in Parkinson’s Disease with Machine Learning and Kalman Filtering. In Proceedings of the IEEE Biomedical Circuits and Systems Conference: Healthcare Technology, Cleveland, OH, USA, 17–19 October 2018. [Google Scholar] [CrossRef]
- Almeida, J.S.; RebouçasFilho, P.P.; Carneiro, T.; Wei, W.; Damaševičius, R.; Maskeliūnas, R.; de Albuquerque, V.H.C. Detecting Parkinson’s disease with sustained phonation and speech signals using machine learning techniques. Pattern Recognit. Lett. 2019, 125, 55–62. [Google Scholar] [CrossRef]
- Almalaq, A.; Dai, X.; Zhang, J.; Hanrahan, S.; Nedrud, J.; Hebb, A. Causality graph learning on cortical information flow in Parkinson’s disease patients during behaviour tests. In Proceedings of the 2015 49th Asilomar Conference on Signals, Systems and Computers, Pacific Grove, CA, USA, 8–11 November 2015; pp. 925–929. [Google Scholar] [CrossRef]
- Alqahtani, E.J.; Alshamrani, F.H.; Syed, H.F.; Olatunji, S.O. Classification of Parkinson’s Disease Using NNge Classification Algorithm. In Proceedings of the 2018 21st Saudi Computer Society National Computer Conference (NCC), Riyadh, Saudi Arabia, 25–26 April 2018; pp. 1–7. [Google Scholar] [CrossRef]
- Avuçlu, E.; Elen, A. Evaluation of traisn and test performance of machine learning algorithms and Parkinson diagnosis with statistical measurements. Med. Biol. Eng. Comput. 2020, 58, 2775–2788. [Google Scholar] [CrossRef]
- Senturk, Z.K. Early diagnosis of Parkinson’s disease using machine learning algorithms. Med. Hypotheses 2020, 138, 109603. [Google Scholar] [CrossRef]
- Yaman, O.; Ertam, F.; Tuncer, T. Automated Parkinson’s disease recognition based on statistical pooling method using acoustic features. Med. Hypotheses 2020, 135, 109483. [Google Scholar] [CrossRef]
- Aich, S.; Kim, H.; Younga, K.; Hui, K.L.; Al-Absi, A.A.; Sain, M. A Supervised Machine Learning Approach using Different Feature Selection Techniques on Voice Datasets for Prediction of Parkinson’s Disease. In Proceedings of the 2019 21st International Conference on Advanced Communication Technology (ICACT), PyeongChang, Korea, 17–20 February 2019; pp. 1116–1121. [Google Scholar] [CrossRef]
- Haq, A.U.; Li, J.P.; Memon, M.H.; Malik, A.; Ahmad, T.; Ali, A.; Nazir, S.; Ahad, I.; Shahid, M. Feature Selection Based on L1-Norm Support Vector Machine and Effective Recognition System for Parkinson’s Disease Using Voice Recordings. IEEE Access 2019, 7, 37718–37734. [Google Scholar] [CrossRef]
- Khachnaoui, H.; Khlifa, N.; Mabrouk, R. Machine Learning for Early Parkinson’s Disease Identification within SWEDD Group Using Clinical and DaTSCAN SPECT Imaging Features. J. Imaging 2022, 8, 97. [Google Scholar] [CrossRef]
- Wu, Y.; Chen, P.; Yao, Y.; Ye, X.; Xiao, Y.; Liao, L.; Wu, M.; Chen, J. Dysphonic voice pattern analysis of patients in Parkinson’s disease using minimum interclass probability risk feature selection and bagging ensemble learning methods. Comput. Math. Methods Med. 2017, 2017, 4201984. [Google Scholar] [CrossRef] [PubMed]
- Peker, M. A decision support system to improve medical diagnosis using a combination of k-medoids clustering based attribute weighting and SVM. J. Med. Syst. 2016, 40, 116. [Google Scholar] [CrossRef] [PubMed]
- Montaña, D.; Campos-Roca, Y.; Pérez Carlos, J. A Diadochokinesis-based expert system considering articulatory features of plosive consonants for early detection of Parkinson’s disease. Comput. Methods Programs Biomed. 2018, 154, 89–97. [Google Scholar] [CrossRef] [PubMed]
- Kuresan, H.; Samiappan, D.; Masunda, S. Fusion of WPT and MFCC feature extraction in Parkinson’s disease diagnosis. Technol. Health Care. 2019, 27, 363–372. [Google Scholar] [CrossRef]
- Marar, S.; Swain, D.; Hiwarkar, V.; Motwani, N.; Awari, A. Predicting the occurrence of Parkinson’s Disease using various Classification Models. In Proceedings of the 2018 International Conference on Advanced Computation and Telecommunication (ICACAT), Bhopal, India, 28–29 December 2018; pp. 1–5. [Google Scholar] [CrossRef]
- Sheibani, R.; Nikookar, E.; Alavi, S.E. An Ensemble Method for Diagnosis of Parkinson’s Disease Based on Voice Measurements. J. Med. Signals Sens. 2019, 24, 221–226. [Google Scholar] [CrossRef]
- Moharkan, Z.A.; Garg, H.; Chodhury, T.; Kumar, P. A classification based Parkinson detection system. In Proceedings of the 2017 International Conference on Smart Technologies for Smart Nation (SmartTechCon), Bengaluru, India, 17–19 August 2017; pp. 1509–1513. [Google Scholar] [CrossRef]
- Sztahó, D.; Valálik, I.; Vicsi, K. Parkinson’s Disease Severity Estimation on Hungarian Speech Using Various Speech Tasks. In Proceedings of the 2019 International Conference on Speech Technology and Human-Computer Dialogue (SpeD), Timisoara, Romania, 10–12 October 2019; pp. 1–6. [Google Scholar] [CrossRef]
- Tracy, J.M.; Özkanca, Y.; Atkins, D.C.; Ghomi, R.H. Investigating voice as a biomarker: Deep phenotyping methods for early detection of Parkinson’s disease. J. Biomed. Inform. 2020, 104, 103362. [Google Scholar] [CrossRef]
- Taylor, J.C.; Fenner, J.W. Comparison of machine learning and semi-quantification algorithms for (I123)FP-CIT classification: The beginning of the end for semi-quantification? EJNMMI Phys. 2017, 4, 29. [Google Scholar] [CrossRef]
- Oliveira, F.P.; Faria, D.B.; Costa, D.C.; Castelo-Branco, M.; Tavares, J.M.R. Extraction, selection and comparison of features for an effective automated computer-aided diagnosis of Parkinson’s disease based on [123I]FP-CIT SPECT images. Eur. J. Nucl. Med. Mol. Imaging 2018, 45, 1052–1062. [Google Scholar] [CrossRef]
- De Souza, J.W.; Alves, S.S.; Rebouças, E.D.S.; Almeida, J.S.; RebouçasFilho, P.P. A New Approach to Diagnose Parkinson’s Disease Using a Structural Cooccurrence Matrix for a Similarity Analysis. Comput. Intell. Neurosci. 2018, 2018, 7613282. [Google Scholar] [CrossRef]
- Drotár, P.; Mekyska, J.; Rektorová, I.; Masarová, L.; Smékal, Z.; Faundez-Zanuy, M. Evaluation of handwriting kinematics and pressure for differential diagnosis of Parkinson’s disease. Artif. Intell. Med. 2016, 67, 39–46. [Google Scholar] [CrossRef]
- Hsu, S.Y.; Lin, H.C.; Chen, T.B.; Du, W.C.; Hsu, Y.H.; Wu, Y.C.; Tu, P.W.; Huang, Y.H.; Chen, H.Y. Feasible Classified Models for Parkinson Disease from 99mTc-TRODAT-1 SPECT Imaging. Sensors 2019, 19, 1740. [Google Scholar] [CrossRef] [PubMed]
- Khatamino, P.; Cantürk, İ.; Özyılmaz, L. A Deep Learning-CNN Based System for Medical Diagnosis: An Application on Parkinson’s Disease Handwriting Drawings. In Proceedings of the 2018 6th International Conference on Control Engineering & Information Technology (CEIT), Istanbul, Turkey, 25–27 October 2018; pp. 1–6. [Google Scholar] [CrossRef]
- Kurt, İ.; Ulukaya, S.; Erdem, O. Classification of Parkinson’s Disease Using Dynamic Time Warping. In Proceedings of the 2019 27th Telecommunications Forum (TELFOR), Belgrade, Serbia, 26–27 November 2019; pp. 1–4. [Google Scholar] [CrossRef]
- Mabrouk, R.; Chikhaoui, B.; Bentabet, L. Machine Learning Based Classification Using Clinical and DaTSCAN SPECT Imaging Features: A Study on Parkinson’s Disease and SWEDD. IEEE Trans. Radiat. Plasma Med. Sci. 2019, 3, 170–177. [Google Scholar] [CrossRef]
- Maass, F.; Michalke, B.; Willkommen, D.; Leha, A.; Schulte, C.; Tönges, L.; Mollenhauer, B.; Trenkwalder, C.; Rückamp, D.; Börger, M.; et al. Elemental fingerprint: Reassessment of a cerebrospinal fluid biomarker for Parkinson’s disease. Neurobiol. Dis. 2020, 134, 104677. [Google Scholar] [CrossRef] [PubMed]
- Mucha, J.; Mekyska, J.; Faundez-Zanuy, M.; Lopez-De-Ipina, K.; Zvoncak, V.; Galaz, Z.; Kiska, T.; Smekal, Z.; Brabenec, L.; Rektorova, I. Advanced Parkinson’s Disease Dysgraphia Analysis Based on Fractional Derivatives of Online Handwriting. In Proceedings of the 2018 10th International Congress on Ultra Modern Telecommunications and Control Systems and Workshops (ICUMT), Moscow, Russia, 5–9 November 2018; pp. 1–6. [Google Scholar] [CrossRef]
- Cibulka, M.; Brodnanova, M.; Grendar, M.; Grofik, M.; Kurca, E.; Pilchova, I.; Osina, O.; Tatarkova, Z.; Dobrota, D.; Kolisek, M. SNPs rs11240569, rs708727, and rs823156 in SLC41A1 Do Not Discriminate Between Slovak Patients with Idiopathic Parkinson’s Disease and Healthy Controls: Statistics and Machine-Learning Evidence. Int. J. Mol. Sci. 2019, 20, 4688. [Google Scholar] [CrossRef] [PubMed]
- Pereira, C.R.; Weber, S.A.T.; Hook, C.; Rosa, G.H.; Papa, J.P. Deep Learning-Aided Parkinson’s Disease Diagnosis from Handwritten Dynamics. In Proceedings of the 2016 29th SIBGRAPI Conference on Graphics. Patterns and Images (SIBGRAPI), Sao Paulo, Brazil, 4–7 October 2016; pp. 340–346. [Google Scholar] [CrossRef]
- Prashanth, R.; Roy, S.D.; Mandal, P.K.; Ghosh, S. High-Accuracy Detection of Early Parkinson’s Disease through Multimodal Features and Machine Learning. Int. J. Med. Inform. 2016, 90, 13–21. [Google Scholar] [CrossRef]
- Shi, J.; Yan, M.; Dong, Y.; Zheng, X.; Zhang, Q.; An, H. Multiple Kernel Learning Based Classification of Parkinson’s Disease with Multi-Modal TranscranialSonography. In Proceedings of the 2018 40th Annual International Conference of the IEEE Engineering in Medicine and Biology Society (EMBC), Honolulu, HI, USA, 18–21 July 2018; pp. 61–64. [Google Scholar] [CrossRef]
- Trezzi, J.P.; Galozzi, S.; Jaeger, C.; Barkovits, K.; Brockmann, K.; Maetzler, W.; Mollenhauer, B. Distinct metabolomic signature in cerebrospinal fluid in early Parkinson’s Disease. Mov. Disord. 2017, 32, 1401–1408. [Google Scholar] [CrossRef]
- Wenzel, M.; Milletari, F.; Krüger, J.; Lange, C.; Schenk, M.; Apostolova, I.; Klutmann, S.; Ehrenburg, M.; Buchert, R. Automatic classification of dopamine transporter SPECT: Deep convolutional neural networks can be trained to be robust with respect to variable image characteristics. Eur. J. Nucl. Med. Mol. Imaging 2019, 46, 2800–2811. [Google Scholar] [CrossRef]
- Segovia, F.; Górriz, J.M.; Ramírez, J.; Martínez-Murcia, F.J.; Castillo-Barnes, D. Assisted diagnosis of Parkinsonism based on the striatal morphology. Int. J. Neural Syst. 2019, 29, 1950011. [Google Scholar] [CrossRef]
- Memedi, M.; Sadikov, A.; Groznik, V.; Žabkar, J.; Možina, M.; Bergquist, F.; Johansson, A.; Haubenberger, D.; Nyholm, D. Automatic Spiral Analysis for Objective Assessment of Motor Symptoms in Parkinson’s Disease. Sensors 2015, 15, 23727–23744. [Google Scholar] [CrossRef]
- Nõmm, S.; Bardõš, K.; Toomela, A.; Medijainen, K.; Taba, P. Detailed Analysis of the Luria’s Alternating SeriesTests for Parkinson’s Disease Diagnostics. In Proceedings of the 2018 17th IEEE International Conference on Machine Learning and Applications (ICMLA), Orlando, FL, USA, 17–20 December 2018; pp. 1347–1352. [Google Scholar] [CrossRef]
- Challa, K.N.R.; Pagolu, V.S.; Panda, G.; Majhi, B. An improved approach for prediction of Parkinson’s disease using machine learning techniques. In Proceedings of the 2016 International Conference on Signal Processing, Communication, Power and Embedded System (SCOPES), Paralakhemundi, India, 3–5 October 2016; pp. 1446–1451. [Google Scholar] [CrossRef]
- Paul, S.; Maindarkar, M.; Saxena, S.; Saba, L.; Turk, M.; Kalra, M.; Krishnan, P.R.; Suri, J.S. Bias Investigation in Artificial Intelligence Systems for Early Detection of Parkinson’s Disease: A Narrative Review. Diagnostics 2022, 12, 166. [Google Scholar] [CrossRef]
- Ahmed, I.; Aljahdali, S.; Khan, M.S.; Kaddoura, S. Classification of Parkinson disease based on patient’s voice signal using machine learning. Intell. Autom. Soft Comput. 2021, 32, 705–722. [Google Scholar] [CrossRef]
- Pereira, C.R.; Pereira, D.R.; Silva, F.A.; Masieiro, J.P.; Weber, S.A.; Hook, C.; Papa, J.P. A new computer vision-based approach to aid the diagnosis of Parkinson’s disease. Comput. Methods Programs Biomed. 2016, 136, 79–88. [Google Scholar] [CrossRef] [PubMed]
- Abdulhay, E.; Arunkumar, N.; Narasimhan, K.; Vellaiappan, E.; Venkatraman, V. Gait and tremor investigation using machine learning techniques for the diagnosis of Parkinson disease. Future Gener. Comput. Syst. 2018, 83, 366–373. [Google Scholar] [CrossRef]
- Ye, Q.; Xia, Y.; Yao, Z. Classification of gait patterns in patients with neurodegenerative disease using adaptive neuro-fuzzy inference system. Comput. Math. Methods Med. 2018, 2018, 9831252. [Google Scholar] [CrossRef] [PubMed]
- Hausdorff, J.M.; Lertratanakul, A.; Cudkowicz, M.E.; Peterson, A.L.; Kaliton, D.; Goldberger, A.L. Dynamic markers of altered gait rhythm in amyotrophic lateral sclerosis. J.Appl. Physiol. 2000, 88, 2045–2053. [Google Scholar] [CrossRef] [PubMed]
- Wahid, F.; Begg, R.K.; Hass, C.J.; Halgamuge, S.; Ackland, D.C. Classification of Parkinson’s Disease Gait Using Spatial-Temporal Gait Features. IEEE J. Biomed. Health Inform. 2015, 19, 1794–1802. [Google Scholar] [CrossRef] [PubMed]
- Pham, T.D.; Yan, H. Tensor Decomposition of Gait Dynamics in Parkinson’s Disease. IEEE Trans. Biomed. Eng. 2018, 65, 1820–1827. [Google Scholar] [CrossRef]
- Mittra, Y.; Rustagi, V. Classification of Subjects with Parkinson’s Disease Using Gait Data Analysis. In Proceedings of the 2018 International Conference on Automation and Computational Engineering (ICACE), Greater Noida, India, 3–4 October 2018; pp. 84–89. [Google Scholar] [CrossRef]
- Klomsae, A.; Auephanwiriyakul, S.; Theera-Umpon, N. String grammar unsupervised possibilistic fuzzy c-medians for gait pattern classification in patients with neurodegenerative diseases. Comput. Intell. Neurosci. 2018, 2018, 1869565. [Google Scholar] [CrossRef]
- Djurić-Jovičić, M.; Belić, M.; Stanković, I.; Radovanović, S.; Kostić, V.S. Selection of gait parameters for differential diagnostics of patients with de novo Parkinson’s disease. Neurol. Res. 2017, 39, 853–861. [Google Scholar] [CrossRef]
- Cuzzolin, F.; Sapienza, M.; Esser, P.; Saha, S.; Franssen, M.M.; Collett, J.; Dawes, H. Metric learning for Parkinsonian identification from IMU gait measurements. Gait Posture 2017, 54, 127–132. [Google Scholar] [CrossRef]
- Felix, J.P.; Vieira, F.H.; Cardoso, Á.A.; Ferreira, M.V.; Franco, R.A.; Ribeiro, M.A.; Araújo, S.G.; Corrêa, H.P.; Carneiro, M.L. A Parkinson’s Disease Classification Method: An Approach Using Gait Dynamics and Detrended Fluctuation Analysis. In Proceedings of the 2019 IEEE Canadian Conference of Electrical and Computer Engineering (CCECE), Edmonton, AB, Canada, 5–8 May 2019; pp. 1–4. [Google Scholar] [CrossRef]
- Baby, M.S.; Saji, A.J.; Kumar, C.S. Parkinsons disease classification using wavelet transform based feature extraction of gait data. In Proceedings of the 2017 International Conference on Circuit Power and Computing Technologies (ICCPCT), Kollam, India, 20–21 April 2017; pp. 1–6. [Google Scholar] [CrossRef]
- Andrei, A.-G.; Tăuțan, A.-M.; Ionescu, B. Parkinson’s Disease Detection from Gait Patterns. In Proceedings of the 2019 E-Health and Bioengineering Conference (EHB), Iasi, Romania, 21–23 November 2019; pp. 1–4. [Google Scholar] [CrossRef]
- Priya, S.J.; Rani, A.J.; Subathra, M.S.P.; Mohammed, M.A.; Damaševičius, R.; Ubendran, N. Local Pattern Transformation Based Feature Extraction for Recognition of Parkinson’s Disease Based on Gait Signals. Diagnostics 2021, 11, 1395. [Google Scholar] [CrossRef]
- Perumal, S.V.; Sankar, R. Gait and tremor assessment for patients with Parkinson’s disease using wearable sensors. ICT Express 2016, 2, 168–174. [Google Scholar] [CrossRef]
- Jane, Y.N.; Nehemiah, H.K.; Arputharaj, K. A Q-backpropagated time delay neural network for diagnosing severity of gait disturbances in Parkinson’s disease. J. Biomed. Inform. 2016, 60, 169–176. [Google Scholar] [CrossRef] [PubMed]
- Yurdakul, O.C.; Subathra, M.S.P.; George, S.T. Detection of Parkinson’s Disease from gait using Neighborhood Representation Local Binary Patterns. Biomed. Signal Processing Control. 2020, 62, 102070. [Google Scholar] [CrossRef]
- Li, B.; Yao, Z.; Wang, J.; Wang, S.; Yang, X.; Sun, Y. Improved Deep Learning Technique to Detect Freezing of Gait in Parkinson’s Disease Based on Wearable Sensors. Electronics 2020, 9, 1919. [Google Scholar] [CrossRef]
- Gao, C.; Sun, H.; Wang, T.; Tang, M.; Bohnen, N.I.; Müller, M.L.; Herman, T.; Giladi, N.; Kalinin, A.; Spino, C.; et al. Model-based and Model-free Machine Learning Techniques for Diagnostic Prediction and Classification of Clinical Outcomes in Parkinson’s Disease. Sci. Rep. 2018, 8, 7129. [Google Scholar] [CrossRef] [PubMed]
- Rehman, R.Z.U.; Del Din, S.; Guan, Y.; Yarnall, A.J.; Shi, J.Q.; Rochester, L. Selecting Clinically Relevant Gait Characteristics for Classification of Early Parkinson’s Disease: A Comprehensive Machine Learning Approach. Sci. Rep. 2019, 9, 17269. [Google Scholar] [CrossRef] [PubMed]
- Kleanthous, N.; Hussain, A.J.; Khan, W.; Liatsis, P. A new machine learning based approach to predict Freezing of Gait. Pattern Recognit. Lett. 2020, 140, 119–126. [Google Scholar] [CrossRef]
- Landers, M.; Saria, S.; Espay, A.J. Will Artificial Intelligence Replace the Movement Disorders Specialist for Diagnosing and Managing Parkinson’s Disease? J. Parkinsons Dis. 2021, 11 (Suppl. S1), S117–S122. [Google Scholar] [CrossRef]
- Taylor, J.; Fenner, J. The challenge of clinical adoption—the insurmountable obstacle that will stop machine learning? BJR Open 2018, 1, 20180017. [Google Scholar] [CrossRef]
- Varghese, J. Artificial intelligence in medicine: Chances and challenges for wide clinical adoption. Visc. Med. 2020, 36, 443–449. [Google Scholar] [CrossRef] [PubMed]
- Paré, G.; Trudel, M.C.; Jaana, M.; Kitsiou, S. Synthesizing information systems knowledge: A typology of literature reviews. Inf. Manag. 2015, 52, 183–199. [Google Scholar] [CrossRef]


| Reference | Machine Learning Algorithms Used | Objective | Tools Used | Source of Data | No. of Subjects | Outcomes |
|---|---|---|---|---|---|---|
| Benba, A. et al., 2015 [40] | Linear kernel SVM | Classification of PD from HC | Not mentioned | Department of Neurology Cerrahpas‚ a Faculty of Medicine, Istanbul University | 34, 17 PD + 17 HC | Classification Accuracy = 91.17% |
| Mathur, R. et al., 2019 [41] | ANN, KNN with K-fold cross validation; K = 10 | Classification of PD from HC | Weka | UCI machine learning repository | 195 instances, 24 attributes | Accuracy of: KNN with Adaboosta.M1—91.28% KNN with Bagging—90.76% KNN with MLP—91.28% |
| Sakar et al., 2019 [44] | Naïve Bayes, Logistic regression, SVM (RBF and Linear), KNN, random Forest, MLP | Classification of PD from HC | JupyterLab with python programming language | Collected from participants | 252, 188 PD + 64 HC | Highest accuracy obtained from SVM (RBF)—86% |
| Yasar, A. et al., 2019 [45] | Artificial Neural Network | Classification of PD from HC | MATLAB | Collected from participants | 80, 40 PD + 40 HC | Accuracy of ANN—94.93% |
| Almeida, J.S. et al., 2019 [48] | KNN, MLP, Optimum Path Forest (OPF), SVM with RBF, Linear and Polynomial kernel | Classification of PD from HC | OpenCV-2.49 | UCI machine learning repository | 98, 63 PD + 35 HC | acoustic cardioid (AC) accuracy—94.55% |
| Alqahtani, E.J. et al., 2018 [50] | NNge and ensemble algorithm, AdaBoostM1 with 10- fold cross validation | Classification of PD from HC | Weka | Collected from participants | 31, 23 PD + 8 HC | Accuracy—96.30% |
| Avuçlu, E., Elen, A., 2020 [51] | KNN, random forest, naïve Bayes, SVM | Classification of PD from HC | JupyterLab with python programming language | UCI machine learning repository | 31, 23 PD + 8 HC | Highest accuracy achieved from SVM—88.72% and lowest accuracy from naïve Bayes—70.26% |
| Zehra Karapinar, 2020 [52] | CART, ANN, SVM | Classification of PD from HC | Weka | Collected from participants | 31, 23 PD + 8 HC | Highest accuracy from SVM—93.84% |
| Yaman, O. et al., 2019 [53] | SVM, KNN | Classification of PD from HC | MATLAB | Collected from participants | 31, 23 PD + 8 HC | Accuracy rate of SVM—91.25% and KNN—91.23% |
| Aich, S. et al., 2019 [54] | Random forest, Bagging CART, SVM, Boosted C5.0 | Classification of PD from HC | Not mentioned | Collected from participants | 31, 23 PD + 8 HC | Highest accuracy obtained from SVM with RBF kernel—97.57% |
| Haq, A.U. et al., 2019 [55] | L1-Norm SVM with K- fold cross validation; K = 10 | Classification of PD from HC | Python | University of Oxford (UO) | 31, 23 PD + 8 HC | Accuracy rate—99% |
| Wu et al., 2017 [57] | Generalized Logistic Regression Analysis (GLRA), SVM, Bagging ensemble | Classification of PD from HC | Not mentioned | Collected from participants | 31, 23 PD + 8 Healthy control (HC) | Optimal result obtained from bagging ensemble; sensitivity—97.96%, specificity—68.75% |
| Peker, 2016 [58] | SVM with RBF kernel | Classification of PD from HC | Weka | University of Oxford (UO) | 31, 23 PD + 8 HC | Accuracy—98.95% |
| Montaña et al., 2018 [59] | SVM with k-fold cross validation; k = 10 | Classification of PD from HC | Weka | UCI machine learning repository | 54, 27 PD + 27 HC | Accuracy—94.4% |
| Kuresan et al., 2019 [60] | Hidden Markov Models (HMM), SVM | Classification of PD from HC | MATLAB | Collected from participants | 40, 20 PD + 20 HC | Highest accuracy obtained from HMM with accuracy—95.16%, sensitivity—93.55%, specificity—91.67% |
| Marar et al., 2018 [61] | Naïve Bayes, ANN, KNN, random forest, SVM, logistic regression, decision tree (DT) | Classification of PD from HC | R programming | Collected from participants | 31, 23 PD + 8 HC | Highest accuracy obtained from ANN—94.87% |
| Sheibani, R. et al., 2019 [62] | Ensemble-based method | Classification of PD from HC | JupyterLab with python programming language | UCI machine learning repository | 31, 23 PD + 8 HC | Accuracy obtained from ensemble learning—90.6%, |
| Moharkan et al., 2017 [63] | KNN | Classification of PD from HC | Python | Collected from participants | 31, 23 PD + 8 HC | Accuracy obtained from KNN—90%, |
| Sztahó, D. et al., 2019 [64] | ANN, KNN, SVM with RBF and linear kernel, DNN | Classification of PD from HC | Not mentioned | UCI machine learning repository | 88, 55 PD + 33 HC | Highest accuracy obtained from SVM with RBF kernel—89.3%, sensitivity—90.2%, specificity—87.9% |
| Tracy, J.M. et al., 2020 [65] | Logistic regression (L2- Regularized), random forest, Gradient Boosted trees | Classification of PD from HC | Python | mPower database | 2289, 246 PD + 2023 HC | Highest accuracy obtained from gradient boosted trees recall—79.7%, precision—90.1%, F1-score—83.6% |
| Reference | Machine Learning Algorithms Used | Objective | Tools Used | Source of Data | No. of Subjects | Outcomes |
|---|---|---|---|---|---|---|
| Taylor, J.C. and Fenner, 2017 [66] | SVM with 10-fold cross-validation | Classification of PD from HC | MATLAB | PPMI and local database | PPMI: 657, 448 PD + 209 HC and local: 304,191 PD + 113 HC | Local data: Accuracy for local data range between 88 to 92% and for PPMI range from 95 to 97% |
| Oliveira et al., 2017 [67] | SVM with linear kernel, logistic regression with LOOCV, KNN | Classification of PD from HC | C++ Programming language and MATLAB R2014a | PPMI database | 652, 443 PD + 209 HC | SVM (linear kernel) with highest accuracy rate—97.9% |
| de Souza et al., 2018 [68] | OPF, naïve Bayes, SVM (RBF) with cross validation | Classification of PD from HC | Python | HandPD | 92, 74 PD + 18 HC | Highest accuracy obtained from SVM with RBF kernel—85.54% |
| Drotár et al., 2016 [69] | SVM, KNN, Ensemble AdaBoost | Classification of PD from HC | MATLAB | PaHaW database | 75, 37 PD + 38 HC | Highest Accuracy obtained from SVM—81.3% with specificity—80.9% and sensitivity—87.4% |
| Hsu, S.-Y. et al., 2019 [70] | SVM with RBF kernel, logistic regression | Classification of PD from HC | Weka | PACS | 202, 94 Severe PD + 102 mild PD + 6 HC | Highest accuracy obtained from SVM-RBF 83.2%, having sensitivity 82.8%, specificity 100% |
| Khatamino et al., 2018 [71] | Convolutional Neural Network (CNN) | Classification of PD from HC | Python Programming | Collected from participants | 72, 57 PD + 15 HC | Accuracy—88.89% |
| Kurt, İ.et al., 2019 [72] | SVM (linear and RBF kernel), KNN | Classification of PD from HC | Not mentioned | UCI machine learning repository | 72, 57 PD + 15 HC | Highest accuracy obtained from SVM (linear)—97.52%. |
| Mabrouk et al., 2019 [73] | Random forest, SVM, MLP, KNN | Classification of PD from HC | Not mentioned | PPMI Database | 550, 342 PD + 157 HC + 51 Scan without evidence of dopaminergic deficit (SWEDD) | For motor features, highest accuracy obtained from SVM—78.4%, and for non-motor features, highest accuracy obtained from KNN—82.2% |
| Fabian Maass et al., 2020 [74] | SVM | Classification of PD from HC | Weka | UCI machine learning repository | 157, 82 PD + 68 HC +7 Normal Pressure Hydrocephalus (NPH) | Sensitivity—80%, and specificity—83% |
| Mucha, J. et al., 2018 [75] | Random forest classifier | Classification of PD from HC | Python Programming | PaHaW Database | 69, 33 PD + 36 HC | Obtained classification accuracy—90% with sensitivity 89%, and specificity 91% |
| Cibulka et al., 2019 [76] | Random forest | Classification of PD from HC | Not mentioned | Collected from participants | 270, 150 PD + 120 HC | Classification error for rs11240569, rs708727, rs823156 is 49.6%, 44.8%, 49.3%, respectively. |
| Pereira, C.R. et al., 2016 [77] | CNN with cross validation | Classification of PD from HC | Not mentioned | Collected from participants | 35, 14 PD + 21 HC | Accuracy rate of CNN—87.14% |
| Prashanth, R. et al., 2016 [78] | Naïve Bayes, random forest SVM, boosted trees | Classification of PD from HC | MATLAB | PPMI database | 584, 401 PD + 183 HC | Highest accuracy obtained from SVM with RBF kernel—96.40% having sensitivity 97.03% and specificity 95.01% |
| Shi, et al., 2018 [79] | Soft margin multiple kernel learning (SMMKL) with LOOCV | Classification of PD from HC | Not mentioned | PPMI database | 33, 15 PD + 18 HC | Accuracy rate—84.85% with sensitivity 80% and specificity 88.89% |
| Trezzi, J. P et al., 2017 [80] | Logistic regression | Classification of PD from HC | Not mentioned | UCI machine learning repository | 87, 44 PD + 43 HC | Sensitivity 79.7% and specificity 80% |
| Wenzel et al., 2019 [81] | CNN | Classification of PD from HC | MATLAB | PPMI database | 645, 438 PD + 207 HC | Accuracy—97.2% |
| Segovia, F. et al., 2019 [82] | SVM with 10 cross validation | Classification of PD from HC | Python programming | Virgen De La Victoria Hospital, Malaga, Spain | 189, 95 PD + 94 HC | Accuracy—94.25% |
| Memedi, M. et al., 2015 [83] | Random forest, logistic regression, MLP and non-linear SVM | Classification of PD from HC | Weka | PPMI database | 75, 65 PD + 10 HC | Highest accuracy obtained from MLP—84% having sensitivity—75.7% and specificity—88.9% |
| Nõmm, S. et al., 2018 [84] | Random forest, decision tree, KNN, AdaBoost, SVM | Classification of PD from HC | Python programming (Scikit–Learn Library) | Collected from participants | 30, 15 PD + 15 HC | Highest accuracy obtained from Random forest—91% |
| Challa et al., 2016 [85] | MLP, BayesNet, boosted logistic regression, random forest | Classification of PD from HC | Weka | Parkinson’s Progression Markers Initiative (PPMI) database | 586, 402 PD + 184 HC | Optimal result obtained from boosted logistic regression having accuracy—97.16% |
| Reference | Machine Learning Algorithms Used | Objective | Tools Used | Source of Data | No. of Subjects | Outcomes |
|---|---|---|---|---|---|---|
| Ye, Q. et al., 2018 [90] | Least square (LS)—SVM, particle swarm optimization (PSO) | Classification of PD, ALS, HD from HC | Not mentioned | Neurology Outpatient Clinic at Massachusetts General Hospital, Boston, MA, USA [91] | 64, 15 PD + 16 HC + 13 (Amyotrophic lateral sclerosis disease (ALS)) + 20 (Huntington’s disease (HD)) | Accuracy to diagnose PD from HC—90.32%, accuracy to diagnose HD from HC—94.44%, accuracy to diagnose ALS from HC—93.10% |
| Wahid, F. et al., 2015 [92] | Random forest, SVM, kernel Fisher Discriminant (KFD) | Classification of PD from HC | MATLAB R2013b | Collected from participants | 49, 23 PD + 26 HC | The accuracy obtained from random forest, SVM, and KFD was 92.6%, 80.4% and 86.2%, respectively. |
| Pham, T.D.and Yan, H., 2018 [93] | LS-SVM | Classification of PD from HC | MATLAB | Laboratory for Gait and Neurodynamics | 166, 93 PD + 73 HC | Sensitivity—100% and specificity—100% |
| Y. Mittra and V. Rustagi, 2018 [94] | Logistic regression, decision tree, SVM (Linear, RBF, Poly kernel), KNN | Classification of PD from HC | Not mentioned | Collected from participants | 49, 23 PD + 26 HC | Highest accuracy obtained from SVM (RBF) and random forest—90.39% |
| Klomsae, A. et al., 2018 [95] | Fuzzy KNN | Classification of PD, ALS, HD from HC | Not mentioned | Neurology Outpatient Clinic at Massachusetts General Hospital, Boston, MA, USA [90] | 64, 15 PD + 20 HD + 13 ALS + 16 HC | Accuracy to diagnose PD from HC—96.43%, accuracy to diagnose HD from HC—97.22%, accuracy to diagnose ALS from HC—96.88% |
| Milica et al., 2017 [96] | SVM-RBF | Classification of PD from HC | Python | Collected from participants from Institute of Neurology CCS, School of Medicine, University of Belgrade | 80, 40 PD + 40 HC | Overall accuracy from SVM-RBF—85% |
| Cuzzolin, F. et al., 2017 [97] | HMM | Classification of PD from HC | Not mentioned | Collected from participants | 424, 156 PD + 268 HC | Accuracy—85.51% |
| Félix, J.P. et al., 2019 [98] | SVM, KNN, naïve Bayes, LDA, decision tree | Classification of PD from HC | MATLAB R2017a | Neurology Outpatient Clinic at Massachusetts General Hospital, Boston, MA, USA [90] | 31, 15 PD + 16 HC | Highest accuracy obtained from SVM, KNN, and decision tree—96.8% |
| Baby, M.S. et al., 2017 [99] | ANN | Classification of PD from HC | MATLAB | Laboratory for Gait and Neurodynamics | 166, 93 PD + 73 HC | Accuracy—86.75% |
| Andrei et al., 2019 [100] | SVM | Classification of PD from HC | Not mentioned | Laboratory for Gait and Neurodynamics | 166, 93 PD + 73 HC | Accuracy—100% |
| Priya, S.J. et al., 2021 [101] | ANN | Classification of PD from HC | MATLAB R2018b | Laboratory for Gait and Neurodynamics | 166, 93 PD + 73 HC | Accuracy—96.28% |
| Perumal, S.V. & Sankar, R., 2016 [102] | SVM, ANN | Classification of PD from HC | MATLAB | Laboratory for Gait and Neurodynamics | 166, 93 PD + 73 HC | Average Accuracy—86.9% |
| Nancy, Y. et al., 2016 [103] | Q-Backpropagated time delay neural network (Q-BTDNN) | Classification of PD from HC | MATLAB 2013 | Laboratory for Gait and Neurodynamics | 166, 93 PD + 73 HC | Accuracy—91.49% |
| Oğul, et al., 2020 [104] | ANN | Classification of PD from HC | MATLAB | Laboratory for Gait and Neurodynamics | 166, 93 PD + 73 HC | Classification accuracy—98.3% |
| Li, B. et al., 2020 [105] | Deep CNN | Classification of PD from HC | Not mentioned | Collected from participants | 20, 10 PD + 10 HC | Accuracy—91.9% |
| Gao, C. et al., 2018 [106] | Logistic regression, random forests, SVM, XGBoost | Classification of PD from HC | Not mentioned | University of Michigan | 80, 40 PD + 40 HC | Highest accuracy obtained from random forests—79.6% |
| Rehman et al., 2019 [107] | SVM, logistic regression | Classification of PD from HC | Python programming | Not mentioned | 303, 119 PD + 184 HC | Average accuracy—97% |
| Natasa et al., 2020 [108] | Random forest, XGBoosting, gradient boosting, SVM(RBF), neural networks | Classification of PD from HC | Not mentioned | Collected from the participants | 10 PD | Best performance obtained from SVM(RBF) with the sensitivity value 72.34%, 91.49%, 75.00% and specificity value 87.36%, 88.51% and 93.62%, for the FoG, transition and normal activity classes, respectively. |
Publisher’s Note: MDPI stays neutral with regard to jurisdictional claims in published maps and institutional affiliations. |
© 2022 by the authors. Licensee MDPI, Basel, Switzerland. This article is an open access article distributed under the terms and conditions of the Creative Commons Attribution (CC BY) license (https://creativecommons.org/licenses/by/4.0/).
Share and Cite
Rana, A.; Dumka, A.; Singh, R.; Panda, M.K.; Priyadarshi, N.; Twala, B. Imperative Role of Machine Learning Algorithm for Detection of Parkinson’s Disease: Review, Challenges and Recommendations. Diagnostics 2022, 12, 2003. https://doi.org/10.3390/diagnostics12082003
Rana A, Dumka A, Singh R, Panda MK, Priyadarshi N, Twala B. Imperative Role of Machine Learning Algorithm for Detection of Parkinson’s Disease: Review, Challenges and Recommendations. Diagnostics. 2022; 12(8):2003. https://doi.org/10.3390/diagnostics12082003
Chicago/Turabian StyleRana, Arti, Ankur Dumka, Rajesh Singh, Manoj Kumar Panda, Neeraj Priyadarshi, and Bhekisipho Twala. 2022. "Imperative Role of Machine Learning Algorithm for Detection of Parkinson’s Disease: Review, Challenges and Recommendations" Diagnostics 12, no. 8: 2003. https://doi.org/10.3390/diagnostics12082003