
Functional Evaluation of Major Salivary Glands Using Viscosity PLUS and 2D Shear-Wave PLUS Elastography Techniques in Healthy Subjects—A Pilot Study

 ,
,
Abstract
:1. Introduction
2. Materials and Methods
2.1. Imaging Protocol
2.2. Statistical Analysis
3. Results
4. Discussion
5. Conclusions
Author Contributions
Funding
Institutional Review Board Statement
Informed Consent Statement
Data Availability Statement
Conflicts of Interest
References
- Shiina, T.; Nightingale, K.R.; Palmeri, M.L.; Hall, T.J.; Bamber, J.C.; Barr, R.G.; Castera, L.; Choi, B.I.; Chou, Y.-H.; Cosgrove, D.; et al. WFUMB Guidelines and Recommendations for Clinical Use of Ultrasound Elastography: Part 1: Basic Principles and Terminology. Ultrasound Med. Biol. 2015, 41, 1126–1147. [Google Scholar] [CrossRef] [PubMed]
- Bamber, J.; Cosgrove, D.; Dietrich, C.F.; Fromageau, J.; Bojunga, J.; Calliada, F.; Cantisani, V.; Correas, J.-M.; D’Onofrio, M.; Drakonaki, E.E.; et al. EFSUMB Guidelines and Recommendations on the Clinical Use of Ultrasound Elastography. Part 1: Basic Principles and Technology. Ultraschall Med. 2013, 34, 169–184. [Google Scholar] [CrossRef] [PubMed]
- Sugimoto, K.; Moriyasu, F.; Oshiro, H.; Takeuchi, H.; Yoshimasu, Y.; Kasai, Y.; Furuichi, Y.; Itoi, T. Viscoelasticity Measurement in Rat Livers Using Shear-Wave US Elastography. Ultrasound Med. Biol. 2018, 44, 2018–2024. [Google Scholar] [CrossRef] [PubMed]
- Popa, A.; Bende, F.; Șirli, R.; Popescu, A.; Bâldea, V.; Lupușoru, R.; Cotrău, R.; Fofiu, R.; Foncea, C.; Sporea, I. Quantification of Liver Fibrosis, Steatosis, and Viscosity Using Multiparametric Ultrasound in Patients with Non-Alcoholic Liver Disease: A “Real-Life” Cohort Study. Diagnostics 2021, 11, 783. [Google Scholar] [CrossRef] [PubMed]
- Sugimoto, K.; Moriyasu, F.; Oshiro, H.; Takeuchi, H.; Yoshimasu, Y.; Kasai, Y.; Itoi, T. Clinical utilization of shear wave dispersion imaging in diffuse liver disease. Ultrasonography 2020, 39, 3–10. [Google Scholar] [CrossRef]
- Muntean, D.; Lenghel, M.; Ciurea, A.; Dudea, S. Viscosity Plane-wave UltraSound (ViPLUS) in the assessment of parotid and submandibular glands in healthy subjects—Preliminary results. Med. Ultrason. 2022. [Google Scholar] [CrossRef] [PubMed]
- Bădărînză, M.; Serban, O.; Maghear, L.; Bocsa, C.; Micu, M.; Damian, L.; Felea, I.; Fodor, D. Shear wave elastography as a new method to identify parotid lymphoma in primary Sjögren Syndrome patients: An observational study. Rheumatol. Int. 2020, 40, 1275–1281. [Google Scholar] [CrossRef]
- Bedewi, M.A.; Elsifey, A.A.; Nassir, E.M.; Elgazzar, H.M.; Alfawaz, A.F.; Hussein, R.S.; Moawad, K.; Bediwy, A.M.; Swify, S.M. Shear wave elastography of the submandibular gland in healthy individuals. J. Int. Med. Res. 2020, 48. [Google Scholar] [CrossRef]
- Herman, J.; Sedlackova, Z.; Vachutka, J.; Furst, T.; Salzman, R.; Vomacka, J.; Jan, H. Shear wave elastography parameters of normal soft tissues of the neck. Biomed. Pap. Med. Fac. Univ. Palacky Olomouc Czech Repub. 2017, 161, 320–325. [Google Scholar] [CrossRef] [PubMed]
- Kałużny, J.; Kopeć, T.; Szczepanek-Parulska, E.; Stangierski, A.; Gurgul, E.; Ruchała, M.; Milecki, P.; Wierzbicka, M. Shear Wave Elastography: A New Noninvasive Tool to Assess the Intensity of Fibrosis of Irradiated Salivary Glands in Head and Neck Cancer Patients. BioMed Res. Int. 2014, 2014. [Google Scholar] [CrossRef] [PubMed]
- Ferraioli, G.; Barr, R.G.; Farrokh, A.; Radzina, M.; Cui, X.W.; Dong, Y.; Rocher, L.; Cantisani, V.; Polito, E.; D’Onofrio, M.; et al. How to perform shear wave elastography. Part II. Med. Ultrason. 2022, 24, 196. [Google Scholar] [CrossRef]
- Chiu, T.-W.; Liu, Y.-J.; Chang, H.-C.; Lee, Y.-H.; Lee, J.-C.; Hsu, K.; Wang, C.-W.; Yang, J.-M.; Hsu, H.-H.; Juan, C.-J. Evaluating Instantaneous Perfusion Responses of Parotid Glands to Gustatory Stimulation Using High-Temporal-Resolution Echo-Planar Diffusion-Weighted Imaging. Am. J. Neuroradiol. 2016, 37, 1909–1915. [Google Scholar] [CrossRef]
- Kato, H.; Kanematsu, M.; Toida, M.; Kawaguchi, T.; Shibata, T.; Kajita, K.; Hoshi, H. Salivary gland function evaluated by diffusion-weighted MR imaging with gustatory stimulation: Preliminary results. J. Magn. Reson. Imaging 2011, 34, 904–909. [Google Scholar] [CrossRef]
- Habermann, C.; Gossrau, P.; Kooijman, H.; Graessner, J.; Cramer, M.; Kaul, M.; Reitmeier, F.; Jaehne, M.; Adam, G. Monitoring of Gustatory Stimulation of Salivary Glands by Diffusion-Weighted MR Imaging: Comparison of 1.5T and 3T. Am. J. Neuroradiol. 2007, 28, 1547–1551. [Google Scholar] [CrossRef]
- Manabe, N.; Haruma, K.; Kusunoki, H.; Kamada, T.; Hata, J. Differences in salivary secretory function between patients with erosive esophagitis and those with nonerosive reflux disease. J. Gastroenterol. Hepatol. 2017, 33, 807–813. [Google Scholar] [CrossRef]
- Tasdemir, B.; Goya, C.; Dostbil, Z.; Sengul, E.; Sezgin, I.; Hattapoglu, S. A comparison of acoustic radiation force impulse imaging and scintigraphy in the functional evaluation of the major salivary glands. Nucl. Med. Commun. 2015, 36, 1220–1226. [Google Scholar] [CrossRef]
- Xu, F.; Laguna, L.; Sarkar, A. Aging-related changes in quantity and quality of saliva: Where do we stand in our understanding? J. Texture Stud. 2018, 50, 27–35. [Google Scholar] [CrossRef]
- Pedersen, A.M.L.; Sørensen, C.E.; Proctor, G.B.; Carpenter, G.; Ekström, J. Salivary secretion in health and disease. J. Oral Rehabilit. 2018, 45, 730–746. [Google Scholar] [CrossRef]
- Tanaka, T.; Ono, K.; Habu, M.; Inoue, H.; Tominaga, K.; Okabe, S.; Kito, S.; Yokota, M.; Fukuda, J.; Inenaga, K.; et al. Functional evaluations of the parotid and submandibular glands using dynamic magnetic resonance sialography. Dentomaxillofac. Radiol. 2007, 36, 218–223. [Google Scholar] [CrossRef]
- Mantsopoulos, K.; Klintworth, N.; Iro, H.; Bozzato, A. Applicability of Shear Wave Elastography of the Major Salivary Glands: Values in Healthy Patients and Effects of Gender, Smoking and Pre-Compression. Ultrasound Med. Biol. 2015, 41, 2310–2318. [Google Scholar] [CrossRef]
- Badarinza, M.; Serban, O.; Maghear, L.; Bocsa, C.; Micu, M.; Porojan, M.D.; Chis, B.A.; Albu, A.; Fodor, D.; Badaranza, M.; et al. Multimodal ultrasound investigation (grey scale, Doppler and 2D-SWE) of salivary and lacrimal glands in healthy people and patients with diabetes mellitus and/or obesity, with or without sialosis. Med. Ultrason. 2019, 21, 257–264. [Google Scholar] [CrossRef] [PubMed]
- Rus, G.; Faris, I.H.; Torres, J.; Callejas, A.; Melchor, J. Why Are Viscosity and Nonlinearity Bound to Make an Impact in Clinical Elastographic Diagnosis? Sensors 2020, 20, 2379. [Google Scholar] [CrossRef] [PubMed]


| n (%)/Median [Range] | |
|---|---|
| Total no. subjects | 40 |
| Sex | |
| Female | 24 (60) |
| Male | 16 (40) |
| Age, years | 29 [25, 32] |
| BMI | 23 [19.5, 25.8] |
| Pre-Stimulation | Post-Stimulation | |||
|---|---|---|---|---|
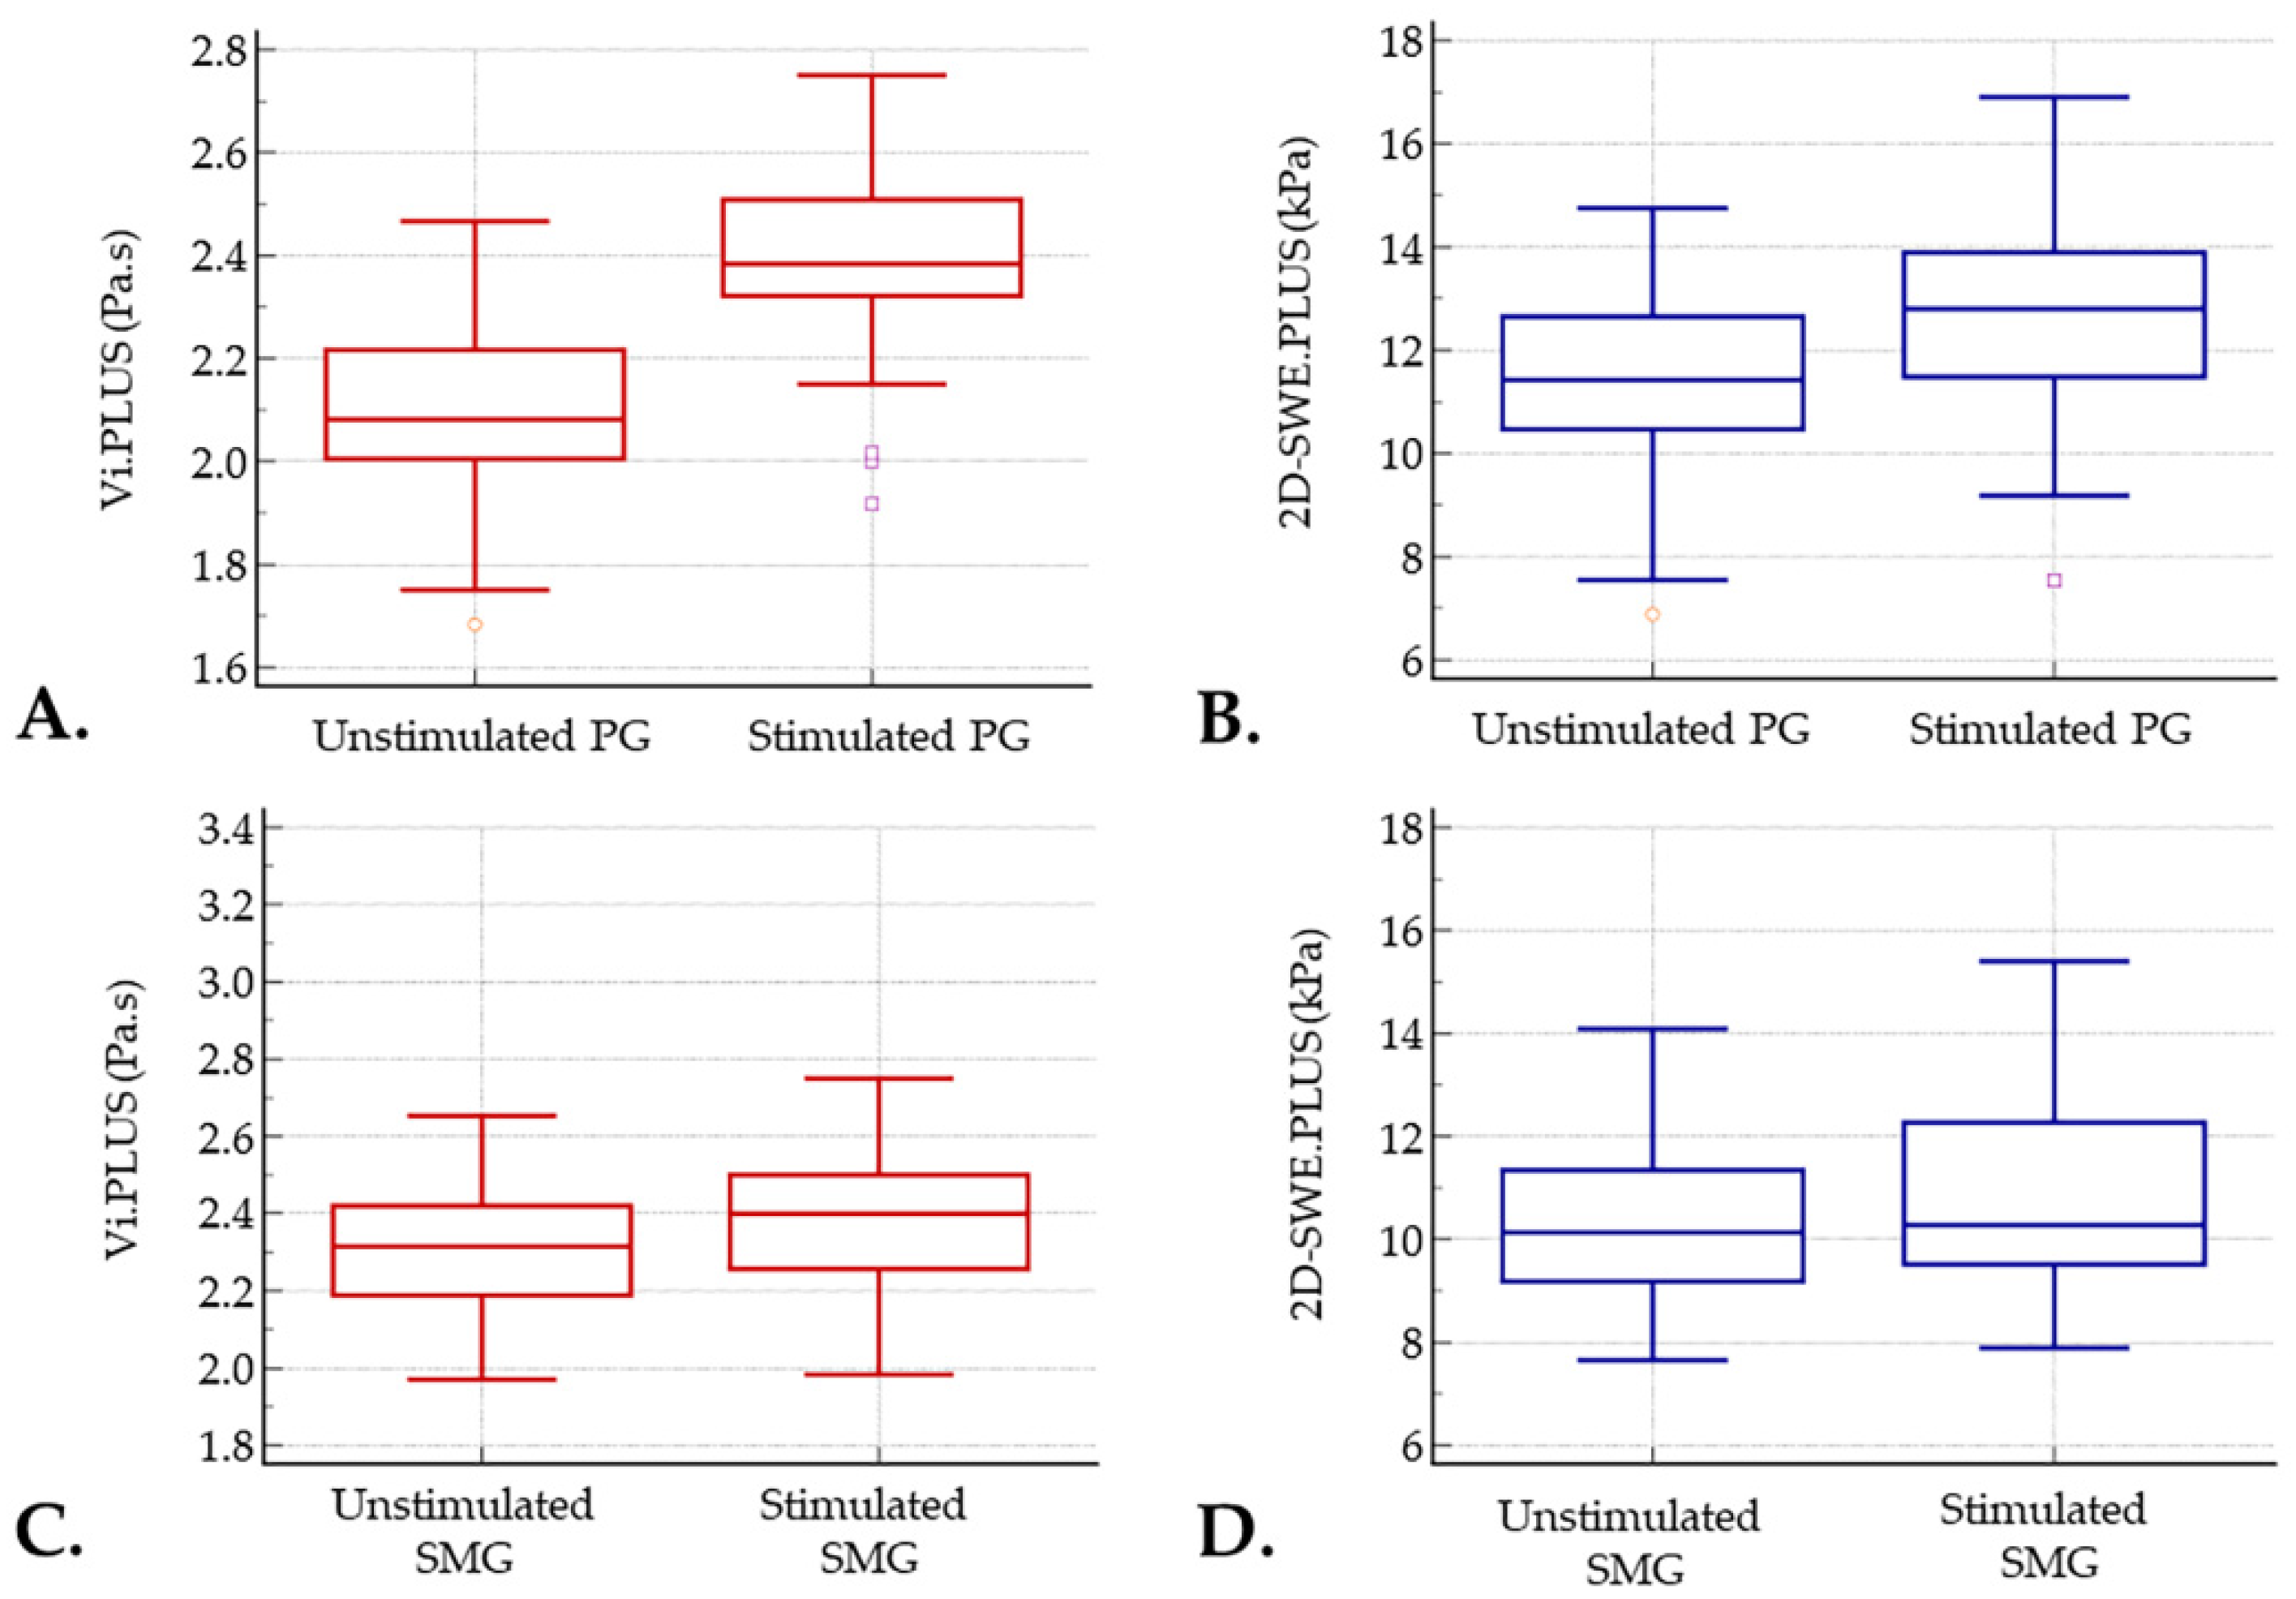
| Parotid gland | ||||
| Viscosity (Pa.s) | Mean | 2.10 | 2.39 | p < 0.001 |
| 95% CI | 2.04–2.16 | 2.33–2.44 | ||
| SD | 0.19 | 0.17 | ||
| 2D-SWE (kPa) | Mean | 11.32 | 12.58 | p < 0.001 |
| 95% CI | 10.71–11.94 | 11.96–13.20 | ||
| SD | 1.91 | 1.92 | ||
| Submandibular gland | ||||
| Viscosity (Pa.s) | Mean | 2.31 | 2.37 | p = 0.086 |
| 95% CI | 2.26–2.36 | 2.31–2.43 | ||
| SD | 0.15 | 0.18 | ||
| 2D-SWE (kPa) | Mean | 10.40 | 10.90 | p = 0.074 |
| 95% CI | 9.87–10.93 | 10.27–11.54 | ||
| SD | 1.64 | 1.98 |
| Pre-Stimulation | p | Post-Stimulation | p | ||||
|---|---|---|---|---|---|---|---|
| Female | Men | Female | Men | ||||
| Parotid gland | |||||||
| Viscosity (Pa.s) | Median | 2.07 | 2.09 | 0.464 | 2.38 | 2.38 | 0.750 |
| Q1, Q3 | 1.98, 2.20 | 2.02, 2.27 | 2.33, 2.50 | 2.30, 2.52 | |||
| 2D-SWE (kPa) | Median | 11.48 | 11.42 | 0.955 | 12.80 | 12.80 | 0.955 |
| Q1, Q3 | 10.46, 12.65 | 10.09, 12.59 | 11.48, 14.05 | 11.30, 13.36 | |||
| Submandibular gland | |||||||
| Viscosity (Pa.s) | Median | 2.30 | 2.33 | 0.257 | 2.39 | 2.40 | 0.911 |
| Q1, Q3 | 2.15, 2.40 | 2.26, 2.43 | 2.17, 2.52 | 2.3, 2.48 | |||
| 2D-SWE (kPa) | Median | 9.92 | 10.87 | 0.163 | 10.10 | 11.78 | 0.103 |
| Q1, Q3 | 8.92, 11.11 | 9.55, 11.74 | 8.89, 10.78 | 9.83, 12.61 | |||
| BMI | p | |||
|---|---|---|---|---|
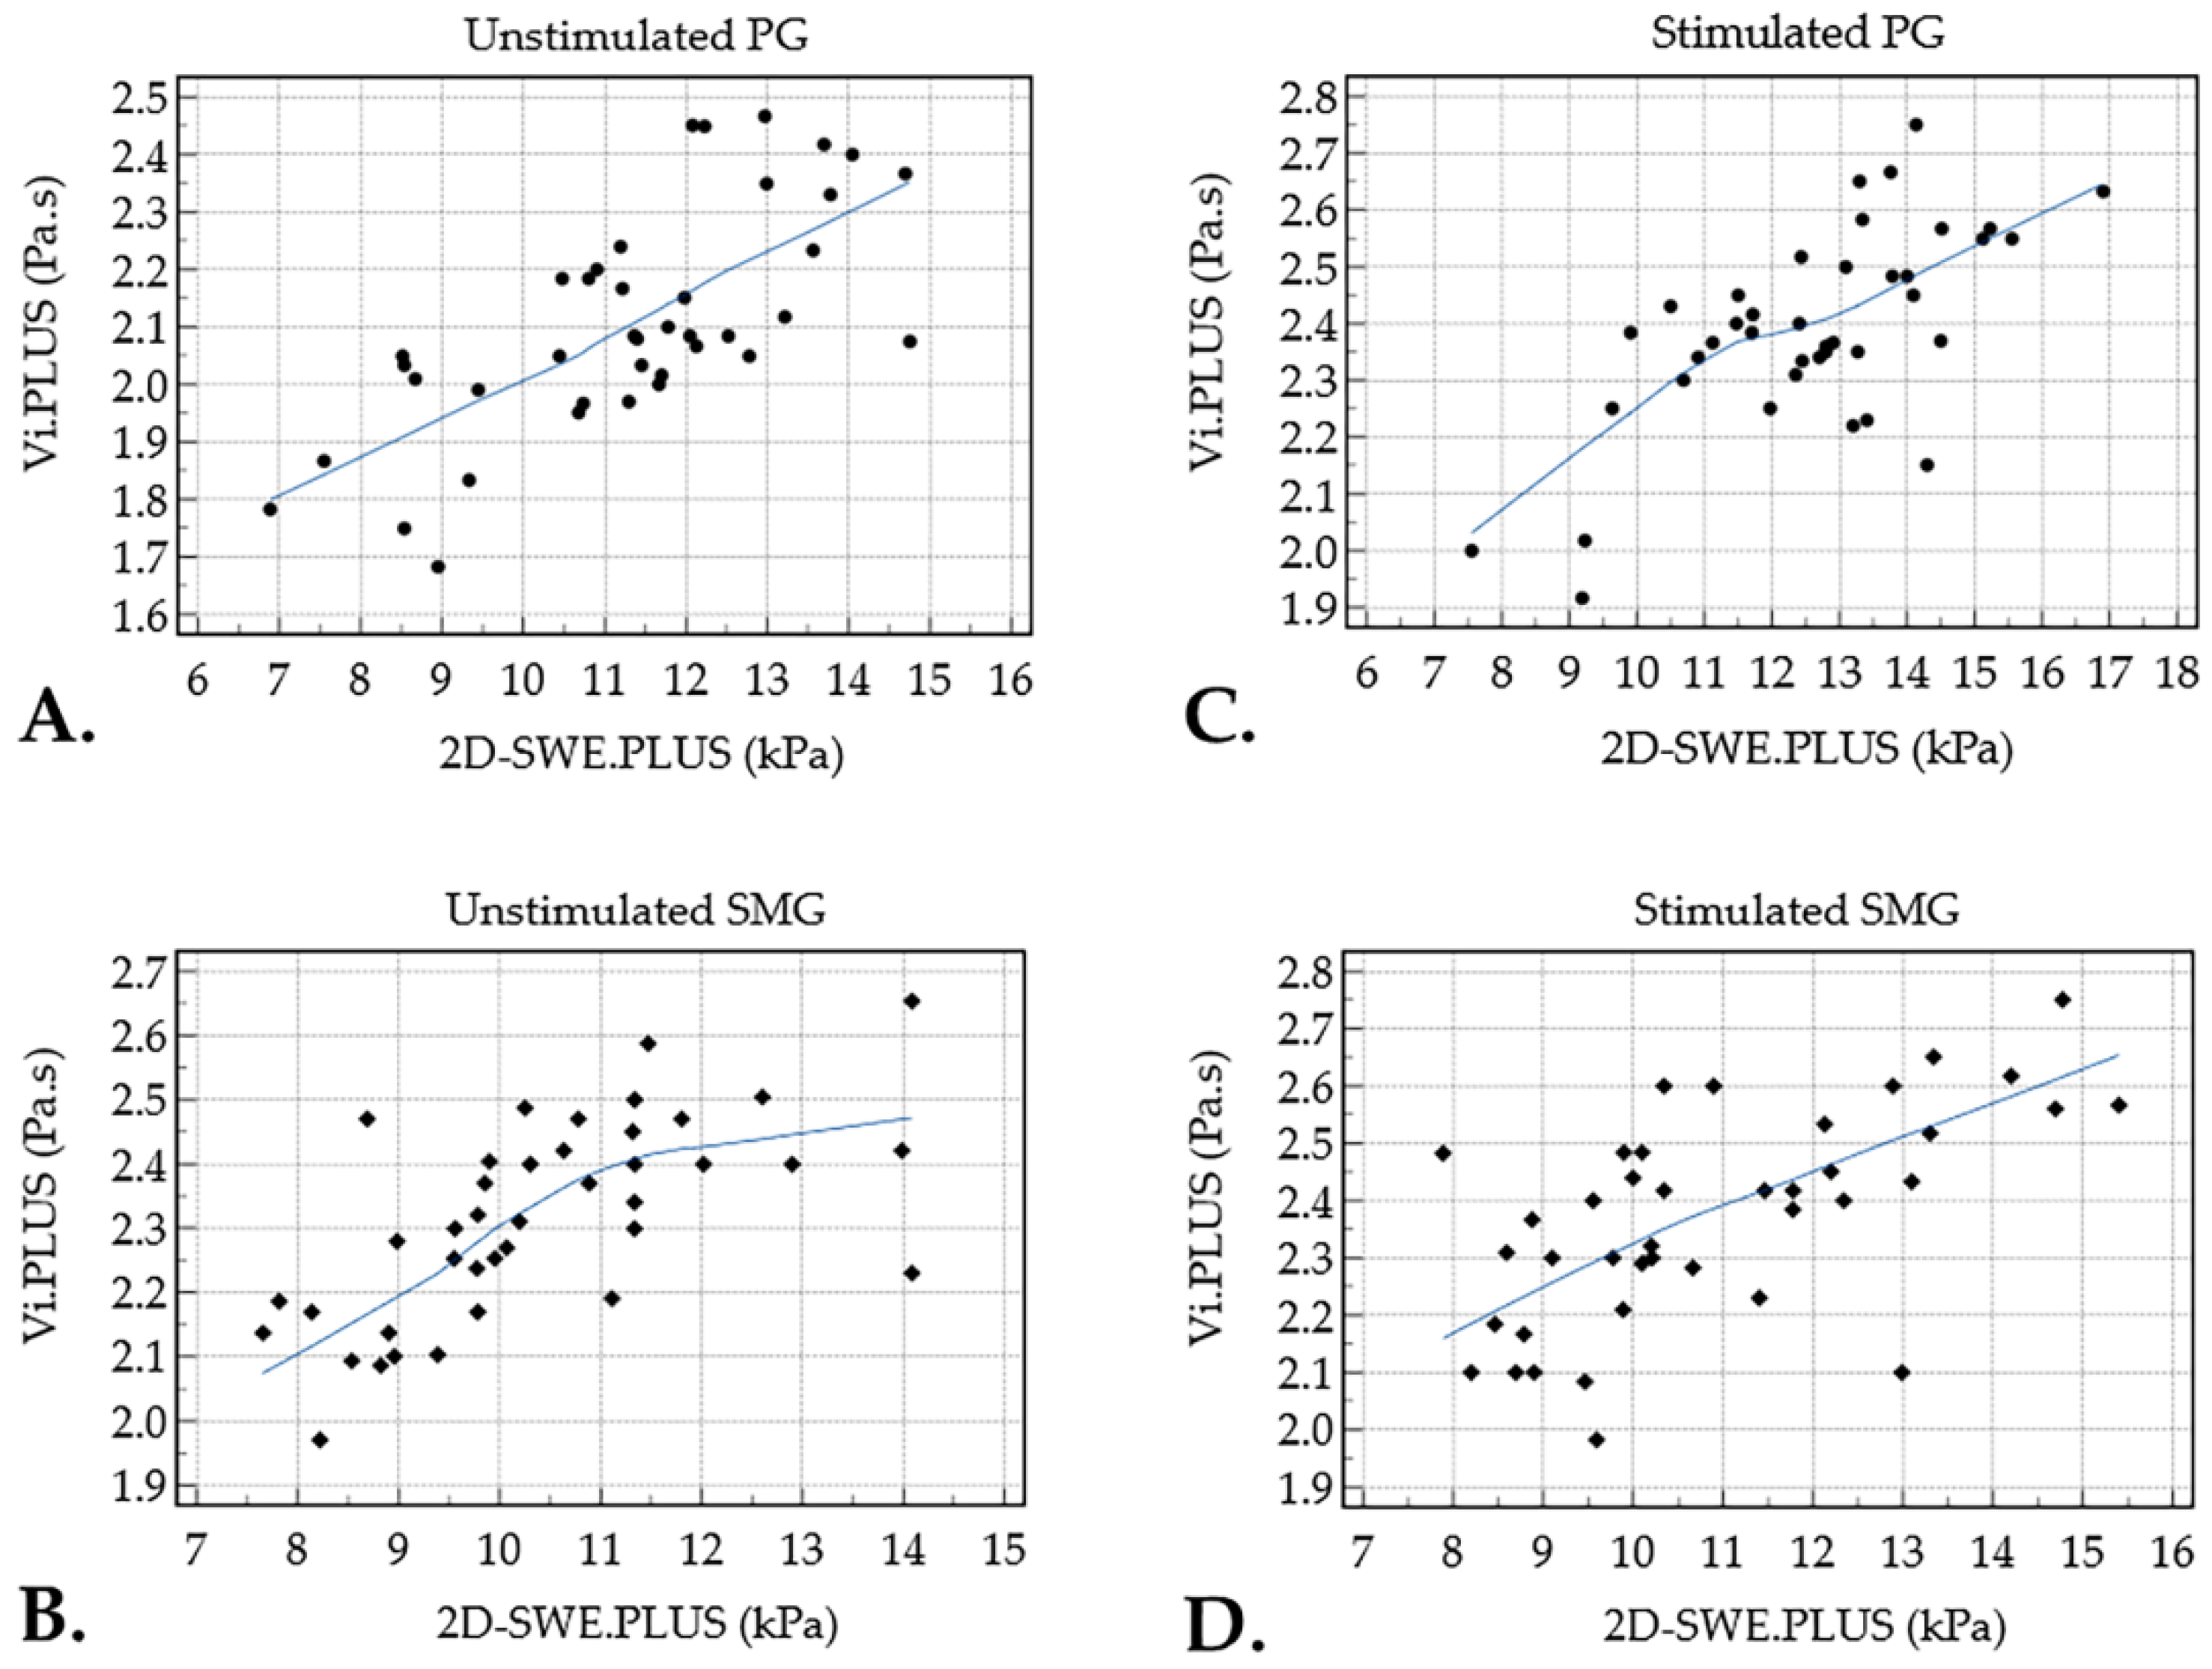
| Parotid gland | Viscosity | Pre-stimulation | r = 0.424 | 0.064 |
| Post-stimulation | r = 0.121 | 0.454 | ||
| 2D-SWE | Pre-stimulation | r = 0.213 | 0.186 | |
| Post-stimulation | r = -0.163 | 0.315 | ||
| Submandibular gland | Viscosity | Pre-stimulation | r = 0.038 | 0.185 |
| Post-stimulation | r = 0.242 | 0.132 | ||
| 2D-SWE | Pre-stimulation | r = 0.097 | 0.549 | |
| Post-stimulation | r = 0.116 | 0.474 |
Publisher’s Note: MDPI stays neutral with regard to jurisdictional claims in published maps and institutional affiliations. |
© 2022 by the authors. Licensee MDPI, Basel, Switzerland. This article is an open access article distributed under the terms and conditions of the Creative Commons Attribution (CC BY) license (https://creativecommons.org/licenses/by/4.0/).
Share and Cite
Muntean, D.D.; Lenghel, M.L.; Petea-Balea, D.-R.; Ciurea, A.I.; Solomon, C.; Dudea, S.M. Functional Evaluation of Major Salivary Glands Using Viscosity PLUS and 2D Shear-Wave PLUS Elastography Techniques in Healthy Subjects—A Pilot Study. Diagnostics 2022, 12, 1963. https://doi.org/10.3390/diagnostics12081963
Muntean DD, Lenghel ML, Petea-Balea D-R, Ciurea AI, Solomon C, Dudea SM. Functional Evaluation of Major Salivary Glands Using Viscosity PLUS and 2D Shear-Wave PLUS Elastography Techniques in Healthy Subjects—A Pilot Study. Diagnostics. 2022; 12(8):1963. https://doi.org/10.3390/diagnostics12081963
Chicago/Turabian StyleMuntean, Delia Doris, Manuela Lavinia Lenghel, Diana-Raluca Petea-Balea, Anca Ileana Ciurea, Carolina Solomon, and Sorin Marian Dudea. 2022. "Functional Evaluation of Major Salivary Glands Using Viscosity PLUS and 2D Shear-Wave PLUS Elastography Techniques in Healthy Subjects—A Pilot Study" Diagnostics 12, no. 8: 1963. https://doi.org/10.3390/diagnostics12081963