1. Introduction
Non-alcoholic fatty live disease (NAFLD) has become the most common chronic liver disease worldwide, with a prevalence in the adult population estimated at around 25% in 2015 and projected at 33.5% in 2030, an increase that parallels the epidemics of obesity, diabetes and metabolic syndrome [
1,
2]. NAFLD is an umbrella term that includes a spectrum of chronic liver disease, from simple steatosis (NAFL) to non-alcoholic steatohepatitis (NASH) that may lead to fibrosis, and eventually cirrhosis with its complications. It has been reported that about 20% of NAFLD patients will develop NASH [
2]. Therefore, a vast majority of patients have simple steatosis that generally does not require a histologic assessment.
However, a recent study in a nationwide adult cohort has reported an overall mortality significantly higher in all of the NAFLD patients, including those with simple steatosis, than in controls [
3]. The liver fat content is linked to the metabolic syndrome and the cardiovascular risk [
4]. Moreover, significant steatosis is associated with fibrosis progression in NAFLD patients [
5]. Therefore, a noninvasive method to quantify liver fat content is of great interest.
The controlled attenuation parameter (CAP), which measures the attenuation of the ultrasound beam and is obtained together with the liver stiffness measurement using the FibroScan device (Echosens, Paris, France), is a tool that has been available for more than a decade, and several studies have assessed its value in the quantification of liver fat content [
6].
In the last few years, several ultrasound (US) manufacturers have developed software for quantifying liver fat content by means of the attenuation coefficient [
7,
8,
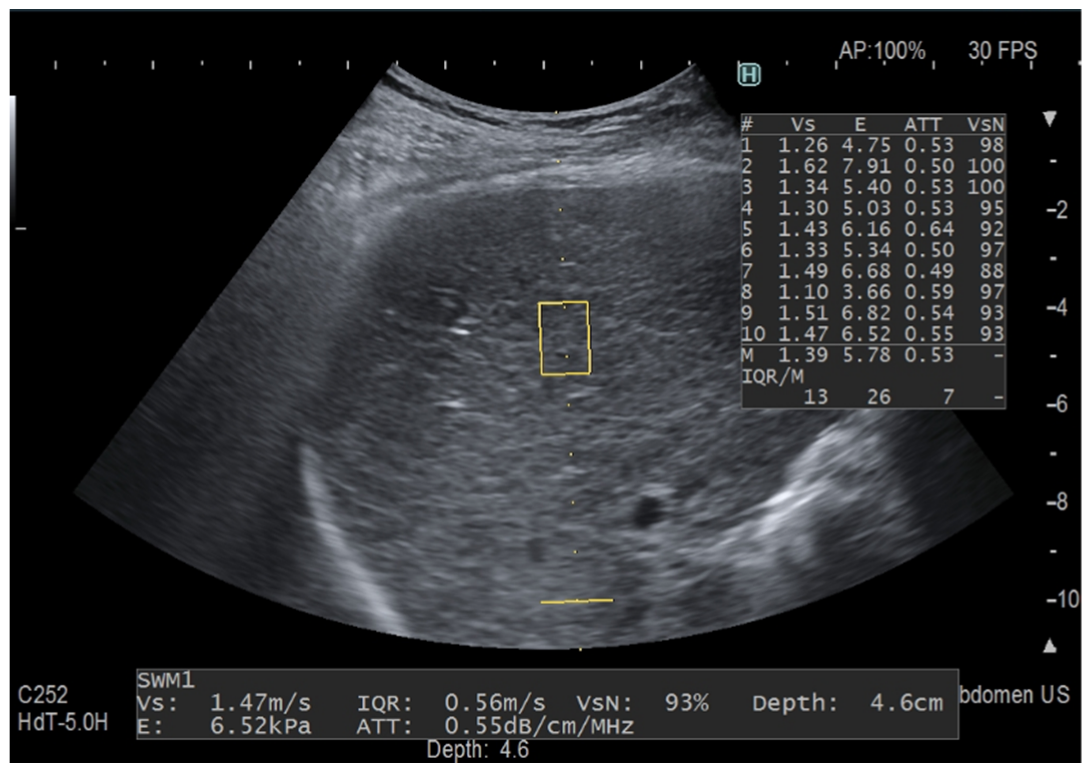
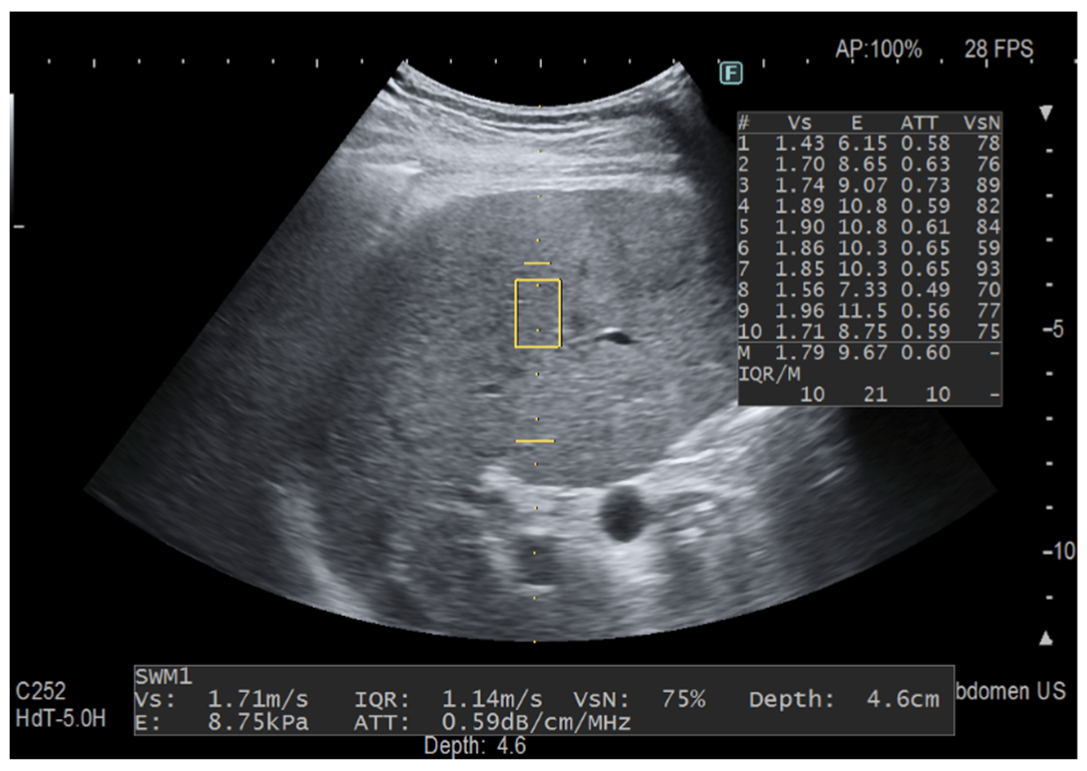
9]. Among them, iATT is the upgraded version of the ATT algorithm released by Fujifilm Healthcare, Tokyo, Japan (previously Hitachi Ltd., Tokyo, Japan) a few years ago. As with CAP, the attenuation coefficient is obtained together with the liver stiffness measurement, the iATT measurement area is not user-adjustable, and the assessment is made in a fixed area that is not color-coded. The manufacturer reports that, in the improved algorithm, the factors that caused signal deterioration in the far field have been eliminated and the calculation method has been modified. Moreover, the length of the measurement area has been narrowed and set at a distance of 35 mm from the skin in the near field to 75 mm in the far field, and two horizontal lines graphically show the width and the length of the measurement area (
Figure 1 and
Figure 2).
By using the previous version of the algorithm, a study reported a moderate correlation with CAP (
r = 0.55 for values obtained with the M probe of the Fibroscan and
r = 0.53 for values obtained with the XL probe) [
10].
The primary aim of our study was to assess the correlation between iATT and CAP values in a series of consecutive patients. The secondary aim was to assess whether focusing only on the iATT acquisition without following the strict protocol for liver stiffness measurements would affect the reproducibility of the iATT values.
2. Materials and Methods
This was a cross-sectional study. Between June 2021 and April 2022, consecutive adult individuals referred to the ultrasound unit of the department of medical sciences and infectious diseases of our institution for fat quantification with the CAP, and who voluntarily also accepted to undergo assessment with the iATT algorithm, were prospectively enrolled. The subject’s characteristics and bio-humoral tests, when available, were recorded. All of the individuals had an alcohol intake less than 20 g/day. The exclusion criteria were failure or unreliable results with the vibration controlled transient elastography (VCTE).
2.1. iATT Measurements
The examinations were performed by using the Arietta 850 US system (Fujifilm Healthcare, Tokyo, Japan) with a convex broadband probe. Steatosis with B-mode ultrasound was scored as follows: absent (score 0) when there was a normal liver echotexture; mild (score 1) steatosis, in case of a slight and diffuse increase in fine parenchymal echoes with normal visualization of diaphragm and portal vein borders; moderate (score 2) steatosis, in case of a moderate and diffuse increase in fine echoes with slightly impaired visualization of portal vein borders and diaphragm; severe (score 3) steatosis, in case of marked increase of fine echoes with poor or no visualization of portal vein borders, diaphragm, and posterior portion of the right liver lobe [
9]. Since the attenuation coefficient is obtained together with liver stiffness, the protocol required for accurate liver stiffness values was followed [
11,
12,
13]. Ten valid measurements were obtained and the median value in kiloPascal (kPa) for stiffness and in decibel/meter/megahertz (dB/m/MHz) for fat quantification, as well as the interquartile range/median (IQR/M) ratios, were used for statistical analysis. The validity of each measurement was assessed using the manufacturer’s quality criterion, i.e., a VsN ≥ 50% [
14]. If this criterion was not fulfilled, the examination was considered a failure. This set of measurements took up to 4 minutes.
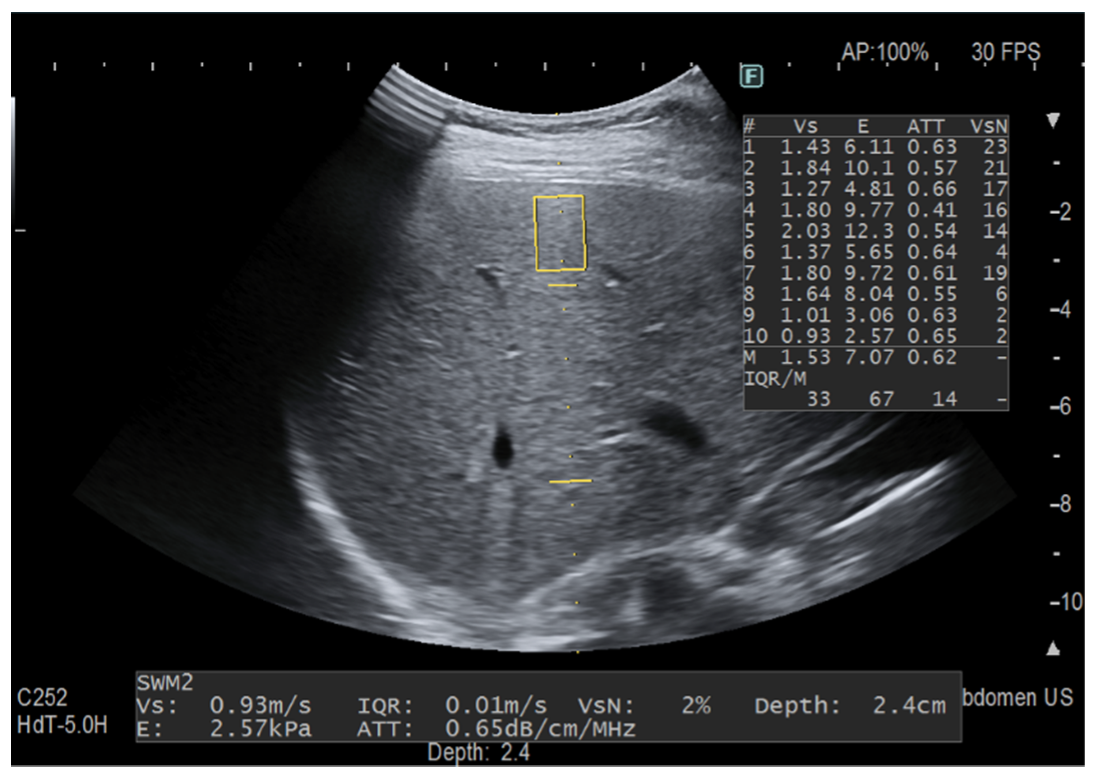
Another set of 10 “only iATT” measurements were obtained. Since the size of ROI for the stiffness measurement is smaller than that for fat quantification, this time we focused only on the best image for iATT, i.e., the homogenous liver parenchyma without any vessel inside the measurement area of the attenuation coefficient and without taking into account the VsN (
Figure 3). This set of measurement took less than one minute in all of the individuals. The median value in dB/m/MHz and the IQR/M were used for statistical analysis.
In all of the individuals, the skin-to-liver capsule distance was measured.
2.2. Controlled Attenuation Parameter Measurements
The CAP was obtained by using the FibroScan 502 Touch system. The 3.5 MHz M probe was used when the skin to liver capsule distance, estimated with ultrasound, was ≤ 25 mm, otherwise the 2.5 MHz XL probe was used. The FibroScan estimates both the liver stiffness in kPa and the liver attenuation coefficient in decibel/meter (dB/m). The principles of CAP have been described elsewhere [
15]. The FibroScan computes CAP only when the associated liver stiffness measurement (LSM) is valid, and it uses the same signal as the one used to measure liver stiffness. As recommended, only the LSM with 10 validated measurements and an IQR/M ≤ 30% were considered reliable [
11]. There are no recommendations for successful CAP measurement.
All of the subjects gave their informed consent for inclusion before they participated in the study. The study was conducted in accordance with the Declaration of Helsinki, and the protocol was approved by the Ethics Committee of Fondazione IRCCS Policlinico San Matteo (P-20170022247).
2.3. Statistical Analysis
The descriptive statistics were produced for the demographic characteristics for this study sample of patients. The Shapiro–Wilk test was used to test the normal distribution of quantitative variables. When quantitative variables were normally distributed, the results were expressed as the mean value and standard deviation (SD), otherwise the median and the IQR (25th–75th percentile) were reported. The qualitative variables were summarized as counts and percentages. Pearson’s
r was used to test the correlation between iATT and CAP values. The concordance between iATT and CAP was tested using Lin’s concordance correlation coefficient (CCC) [
16]. To assess the concordance between the two methods, the iATT measurement was converted in the same unit of measure of CAP multiplying the value by 100 (centimeter to meter) and by 3.5, which is the ultrasound frequency at which the CAP is computed, regardless of the ultrasound frequency of the probe being used.
CCC and Pearson’s
r range in values from 0 to +1. The Bland and Altman limits of agreement (LOA), with their 95% confidence interval (CI), were also calculated. The correlation and concordance were classified as poor (0.00 to 0.20), fair (0.21 to 0.40), moderate (0.41 to 0.60), good (0.61 to 0.80), or excellent (0.81 to 1.00) [
17].
p < 0.05 was considered statistically significant. All of the tests were two-sided. The data analysis was performed with the STATA statistical package (release 17.0, 2021, Stata Corporation, College Station, TX, USA).
3. Results
Three hundred and fifty-four patients (203 males and 151 females) were studied. One hundred and forty-six patients were affected by chronic hepatitis C; 80 patients by NAFLD; 48 patients by chronic hepatitis B; the remaining patients had other etiologies of liver disease. The main clinical and demographic characteristics of the study cohort are reported in
Table 1. The XL probe was used in 46 (13%) of the patients because the skin-to-liver capsule distance was higher than 25 mm.
Failures with liver stiffness measurement and iATT were observed in 74 (20.9%) of the cases. The main determinant of the failures was the skin-to-liver capsule distance (odds ratio: 25.5; 95% confidence interval: 11.6–56.1).
Correlation and Concordance Analysis
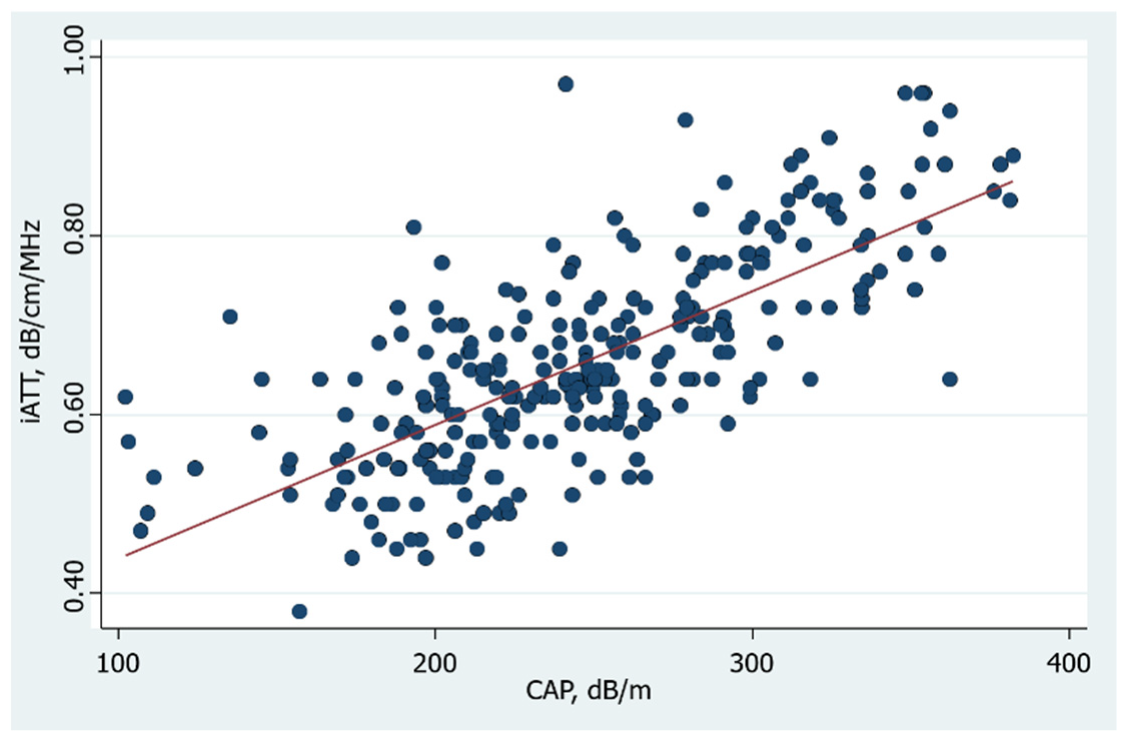
The overall Pearson correlation between CAP and iATT values obtained following the liver stiffness measurement protocol was
r = 0.73 (
p = 10
−5) (
Figure 4), and it was
r = 0.71 (
p = 10
−5) when the iATT measurement was obtained without following the stiffness protocol.
The correlation was affected by the IQR/M of the 10 measurements: it was
r = 0.75 (
p = 10
−5) in the 203 cases showing an IQR/M of the iATT value ≤ 15%, and the correlation was the same (
r = 0.75,
p = 10
−5) in the 130 cases with an IQR/M ≤ 10%, whereas it was
r = 0.60 (
p = 10
−5) in the 77 cases with an IQR/M >15% (
Table 2).
Lin’s CCC analysis showed that there was a moderate to good concordance between the iATT and CAP values (
Table 2).
The iATT values obtained without following the strict protocol for liver stiffness measurements were obtained in 220 patients of this cohort, and there was no statistically significant difference with the remaining patients of the study cohort. The Pearson correlation was r = 0.71 (p = 10−5).
4. Discussion
The results of this study show a good correlation between the improved iATT algorithm for the assessment of the attenuation coefficient and CAP, with a progressive and linear increase in the values up to the grade of severe liver steatosis. This correlation is higher than that reported in a published study, which was performed with a previous version of the algorithm [
10], and seems to indicate that iATT is a promising tool in the evaluation of patients with suspected fatty liver. The correlation was not affected by changing the acquisition plane and without following the recommended protocol for stiffness measurement. It must be highlighted that, in this latter case, the time required for a set of 10 measurement was less than one minute. This result shows that the attenuation coefficient is easier to obtain in relation to the liver stiffness measurement and seems to indicate that the strict protocol that must be followed for liver stiffness measurements is not required.
It is worth noting that the attenuation coefficient with iATT is obtained in a fixed area and the depth of the measurement cannot be changed. It is likely that there is a depth dependence of the attenuation coefficient measurement that should be assessed in future studies, as recently recommended by the American Institute of Ultrasound in Medicine (AIUM)-RSNA Quantitative Imaging Biomarkers Alliance (QIBA) Pulse-Echo Quantitative Ultrasound (PEQUS) initiative for fat quantification [
8].
Our data show that the strength and direction of the linear relationship between iATT and CAP was good, however the agreement between the measurements was only moderate. This study, which was specifically designed to compare the results obtained with iATT to those obtained with CAP in order to assess the correlation, did not evaluate the performance of the upgraded algorithm using CAP as reference standard.
This study simply assessed the relationship between the two variables, i.e., iATT and CAP. No gold standard was used and both of these algorithms may not be optimal in quantifying liver fat content. CAP has been available for more than a decade and has become a point-of-care technique due in part to its easy use. However, the performance of CAP seems suboptimal and the cutoffs for detecting and grading liver steatosis vary considerably between studies, ranging from 219 dB/m in a cohort of patients with chronic hepatitis C to 294 dB/m in a metanalysis of NAFLD patients [
18,
19]. It must be underscored that the prevalence of the disease, i.e., the presence of fatty liver in the studied populations, rather than the etiology of liver disease might likely explains this variability [
20]. Both the recent position paper of the World Federation for Ultrasound in Medicine and Biology on liver fat quantification and the AIUM-RSNA QIBA initiative article have highlighted that CAP is not an adequate reference standard for evaluating the accuracy of the emerging ultrasound techniques for fat quantification with attenuation coefficients [
7,
8].
There are some limitations to this study. First, we did not assess the performance of iATT. Second, we did not compare the results obtained with iATT with those of other algorithms by other vendors that are also based on the attenuation coefficient. Third, the agreement between the readers was not assessed.
In conclusion, iATT shows a strong correlation with CAP that seems not to be decreased when the protocol for liver stiffness acquisition is not followed. The correlation of iATT with CAP values seems affected by the variability between measurements and it is higher when the IQR/M ≤ 15%.
Author Contributions
Conceptualization, G.F.; methodology, G.F.; formal analysis, A.D.S.; investigation, A.R. and L.M.; data curation, G.F., A.R. and A.D.S.; writing—original draft preparation, G.F. writing; review and editing, G.F., A.R., L.M., A.D.S. and C.F.; supervision, G.F. All authors have read and agreed to the published version of the manuscript.
Funding
This research received no external funding.
Institutional Review Board Statement
The study was conducted in accordance with the Declaration of Helsinki, and the protocol was approved by the Ethics Committee of Fondazione IRCCS Policlinico San Matteo (P-20170022247, approved on 23 October 2017).
Informed Consent Statement
Informed consent was obtained from all subjects involved in the study.
Data Availability Statement
The data presented in this study are available on request from the corresponding author. The data are not publicly available due to the privacy of the patients.
Acknowledgments
The authors would like to thank Nadia Locatelli for her valuable help in carrying out the study.
Conflicts of Interest
G.F.: speaker for Canon Medical Systems, Fujifilm Healthcare, Mindray Bio-Medical Electronics Co., Philips Healthcare, Siemens Healthineers and is advisory board member of Philips Healthcare and Siemens Healthineers. A.R.: No conflict to disclose. L.M.: No conflict to disclose. A.D.S.: No conflict to disclose. C.F.: unrestricted research grant from Canon Medical Systems, Esaote SpA, Fujifilm Healthcare, Mindray Bio-Medical Electronics Co.
References
- Estes, C.; Razavi, H.; Loomba, R.; Younossi, Z.; Sanyal, A.J. Modeling the epidemic of nonalcoholic fatty liver disease demonstrates an exponential increase in burden of disease. Hepatology 2018, 67, 123–133. [Google Scholar] [CrossRef] [PubMed]
- Younossi, Z.M.; Koenig, A.B.; Abdelatif, D.; Fazel, Y.; Henry, L.; Wymer, M. Global epidemiology of nonalcoholic fatty liver disease-Meta-analytic assessment of prevalence, incidence, and outcomes. Hepatology 2016, 64, 73–84. [Google Scholar] [CrossRef] [PubMed] [Green Version]
- Simon, T.G.; Roelstraete, B.; Khalili, H.; Hagström, H.; Ludvigsson, J.F. Mortality in biopsy-confirmed nonalcoholic fatty liver disease: Results from a nationwide cohort. Gut 2021, 70, 1375–1382. [Google Scholar] [CrossRef] [PubMed]
- Arulanandan, A.; Ang, B.; Bettencourt, R.; Hooker, J.; Behling, C.; Lin, G.Y.; Valasek, M.A.; Ix, J.H.; Schnabl, B.; Sirlin, C.B.; et al. Association Between Quantity of Liver Fat and Cardiovascular Risk in Patients with Nonalcoholic Fatty Liver Disease Independent of Nonalcoholic Steatohepatitis. Clin. Gastroenterol. Hepatol. 2015, 13, 1513–1520. [Google Scholar] [CrossRef] [PubMed]
- Ajmera, V.; Park, C.C.; Caussy, C.; Singh, S.; Hernandez, C.; Bettencourt, R.; Hooker, J.; Sy, E.; Behling, C.; Xu, R.; et al. Magnetic Resonance Imaging Proton Density Fat Fraction Associates with Progression of Fibrosis in Patients with Nonalcoholic Fatty Liver Disease. Gastroenterology 2018, 155, 307–310. [Google Scholar] [CrossRef] [PubMed]
- Ferraioli, G. Quantitative assessment of liver steatosis using ultrasound controlled attenuation parameter (Echosens). J. Med. Ultrason. 2021, 48, 489–495. [Google Scholar] [CrossRef] [PubMed]
- Ferraioli, G.; Berzigotti, A.; Barr, R.G.; Choi, B.I.; Cui, X.W.; Dong, Y.; Gilja, O.H.; Lee, J.Y.; Lee, D.H.; Moriyasu, F.; et al. Quantification of Liver Fat Content with Ultrasound: A WFUMB Position Paper. Ultrasound Med. Biol. 2021, 47, 2803–2820. [Google Scholar] [CrossRef] [PubMed]
- Ferraioli, G.; Kumar, V.; Ozturk, A.; Nam, K.; de Korte, C.; Barr, R.G. Ultrasound Attenuation for Liver Fat Quantification: An AIUM-RSNA QIBA Pulse Echo Quantitative Ultrasound (PEQUS) initiative. Radiology 2022, 302, 495–506. [Google Scholar] [CrossRef] [PubMed]
- Ferraioli, G.; Soares Monteiro, L.B. Ultrasound-based techniques for the diagnosis of liver steatosis. World J. Gastroenterol. 2019, 25, 6053–6062. [Google Scholar] [CrossRef] [PubMed]
- Koizumi, Y.; Hirooka, M.; Tamaki, N.; Yada, N.; Nakashima, O.; Izumi, N.; Kudo, M.; Hiasa, Y. New diagnostic technique to evaluate hepatic steatosis using the attenuation coefficient on ultrasound B mode. PLoS ONE 2019, 14, e0221548. [Google Scholar] [CrossRef] [PubMed]
- Dietrich, C.F.; Bamber, J.; Berzigotti, A.; Bota, S.; Cantisani, V.; Castera, L.; Cosgrove, D.; Ferraioli, G.; Friedrich-Rust, M.; Gilja, O.H.; et al. EFSUMB Guidelines and Recommendations on the Clinical Use of Liver Ultrasound Elastography, Update 2017 (Short Version). Ultraschall Med. 2017, 38, 377–394. [Google Scholar] [CrossRef] [PubMed] [Green Version]
- Ferraioli, G.; Wong, V.W.; Castera, L.; Berzigotti, A.; Sporea, I.; Dietrich, C.F.; Choi, B.I.; Wilson, S.R.; Kudo, M.; Bar, R.G. Liver Ultrasound Elastography: An Update to the World Federation for Ultrasound in Medicine and Biology Guidelines and Recommendations. Ultrasound Med. Biol. 2018, 44, 2419–2440. [Google Scholar] [CrossRef] [PubMed] [Green Version]
- Barr, R.G.; Wilson, S.R.; Rubens, D.; Garcia-Tsao, G.; Ferraioli, G. Update to the Society of Radiologists in Ultrasound Liver Elastography Consensus Statement. Radiology 2020, 296, 263–274. [Google Scholar] [CrossRef] [PubMed]
- Ferraioli, G.; Maiocchi, L.; Lissandrin, R.; Tinelli, C.; De Silvestri, A.; Filice, C. Ruling-in and Ruling-out Significant Fibrosis and Cirrhosis in Patients with Chronic Hepatitis C Using a Shear Wave Measurement Method. J. Gastrointestin. Liver Dis. 2017, 26, 139–143. [Google Scholar] [CrossRef] [PubMed] [Green Version]
- Sasso, M.; Beaugrand, M.; de Ledinghen, V.; Douvin, C.; Marcellin, P.; Poupon, R.; Sandrin, L.; Miette, V. Controlled attenuation parameter (CAP): A novel VCTE™ guided ultrasonic attenuation measurement for the evaluation of hepatic steatosis: Preliminary study and validation in a cohort of patients with chronic liver disease from various causes. Ultrasound Med. Biol. 2010, 36, 1825–1835. [Google Scholar] [CrossRef] [PubMed]
- Lin, L.I. A concordance correlation coefficient to evaluate reproducibility. Biometrics 1989, 45, 255–268. [Google Scholar] [CrossRef] [PubMed]
- Altman, D.G. Practical Statistics for Medical Research; Chapman & Hall: London, UK, 1997. [Google Scholar]
- Ferraioli, G.; Tinelli, C.; Lissandrin, R.; Zicchetti, M.; Dal Bello, B.; Filice, G.; Filice, C. Controlled attenuation parameter for evaluating liver steatosis in chronic viral hepatitis. World J. Gastroenterol. 2014, 20, 6626–6631. [Google Scholar] [CrossRef] [PubMed]
- Petroff, D.; Blank, V.; Newsome, P.N.; Shalimar; Voican, C.S.; Thiele, M.; de Lédinghen, V.; Baumeler, S.; Chan, W.K.; Perlemuter, G.; et al. Assessment of hepatic steatosis by controlled attenuation parameter using the M and XL probes: An individual patient data meta-analysis. Lancet Gastroenterol. Hepatol. 2021, 6, 185–198. [Google Scholar] [CrossRef]
- Ferraioli, G. CAP for the detection of hepatic steatosis in clinical practice. Lancet Gastroenterol. Hepatol. 2021, 6, 151–152. [Google Scholar] [CrossRef]
| Publisher’s Note: MDPI stays neutral with regard to jurisdictional claims in published maps and institutional affiliations. |
© 2022 by the authors. Licensee MDPI, Basel, Switzerland. This article is an open access article distributed under the terms and conditions of the Creative Commons Attribution (CC BY) license (https://creativecommons.org/licenses/by/4.0/).


 ,
, 


