
The Role of 3D CT Imaging in the Accurate Diagnosis of Lung Function in Coronavirus Patients

 ,
,  ,
,  , , , , , , , , and
Abstract
:1. Introduction
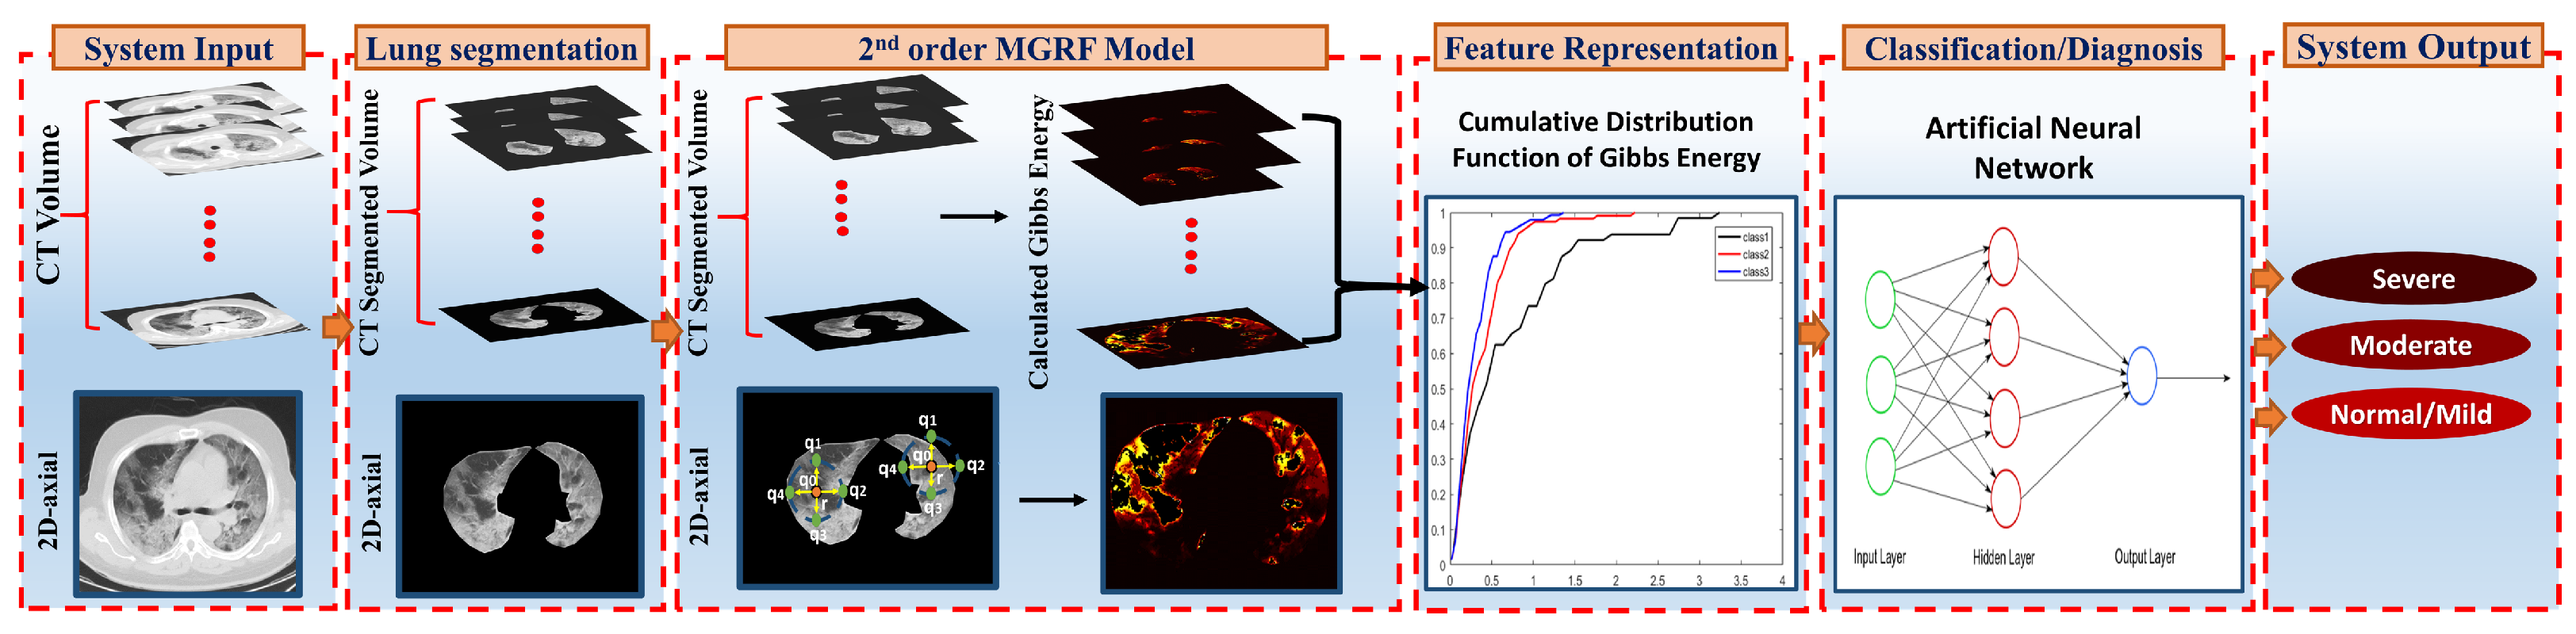
2. Methods
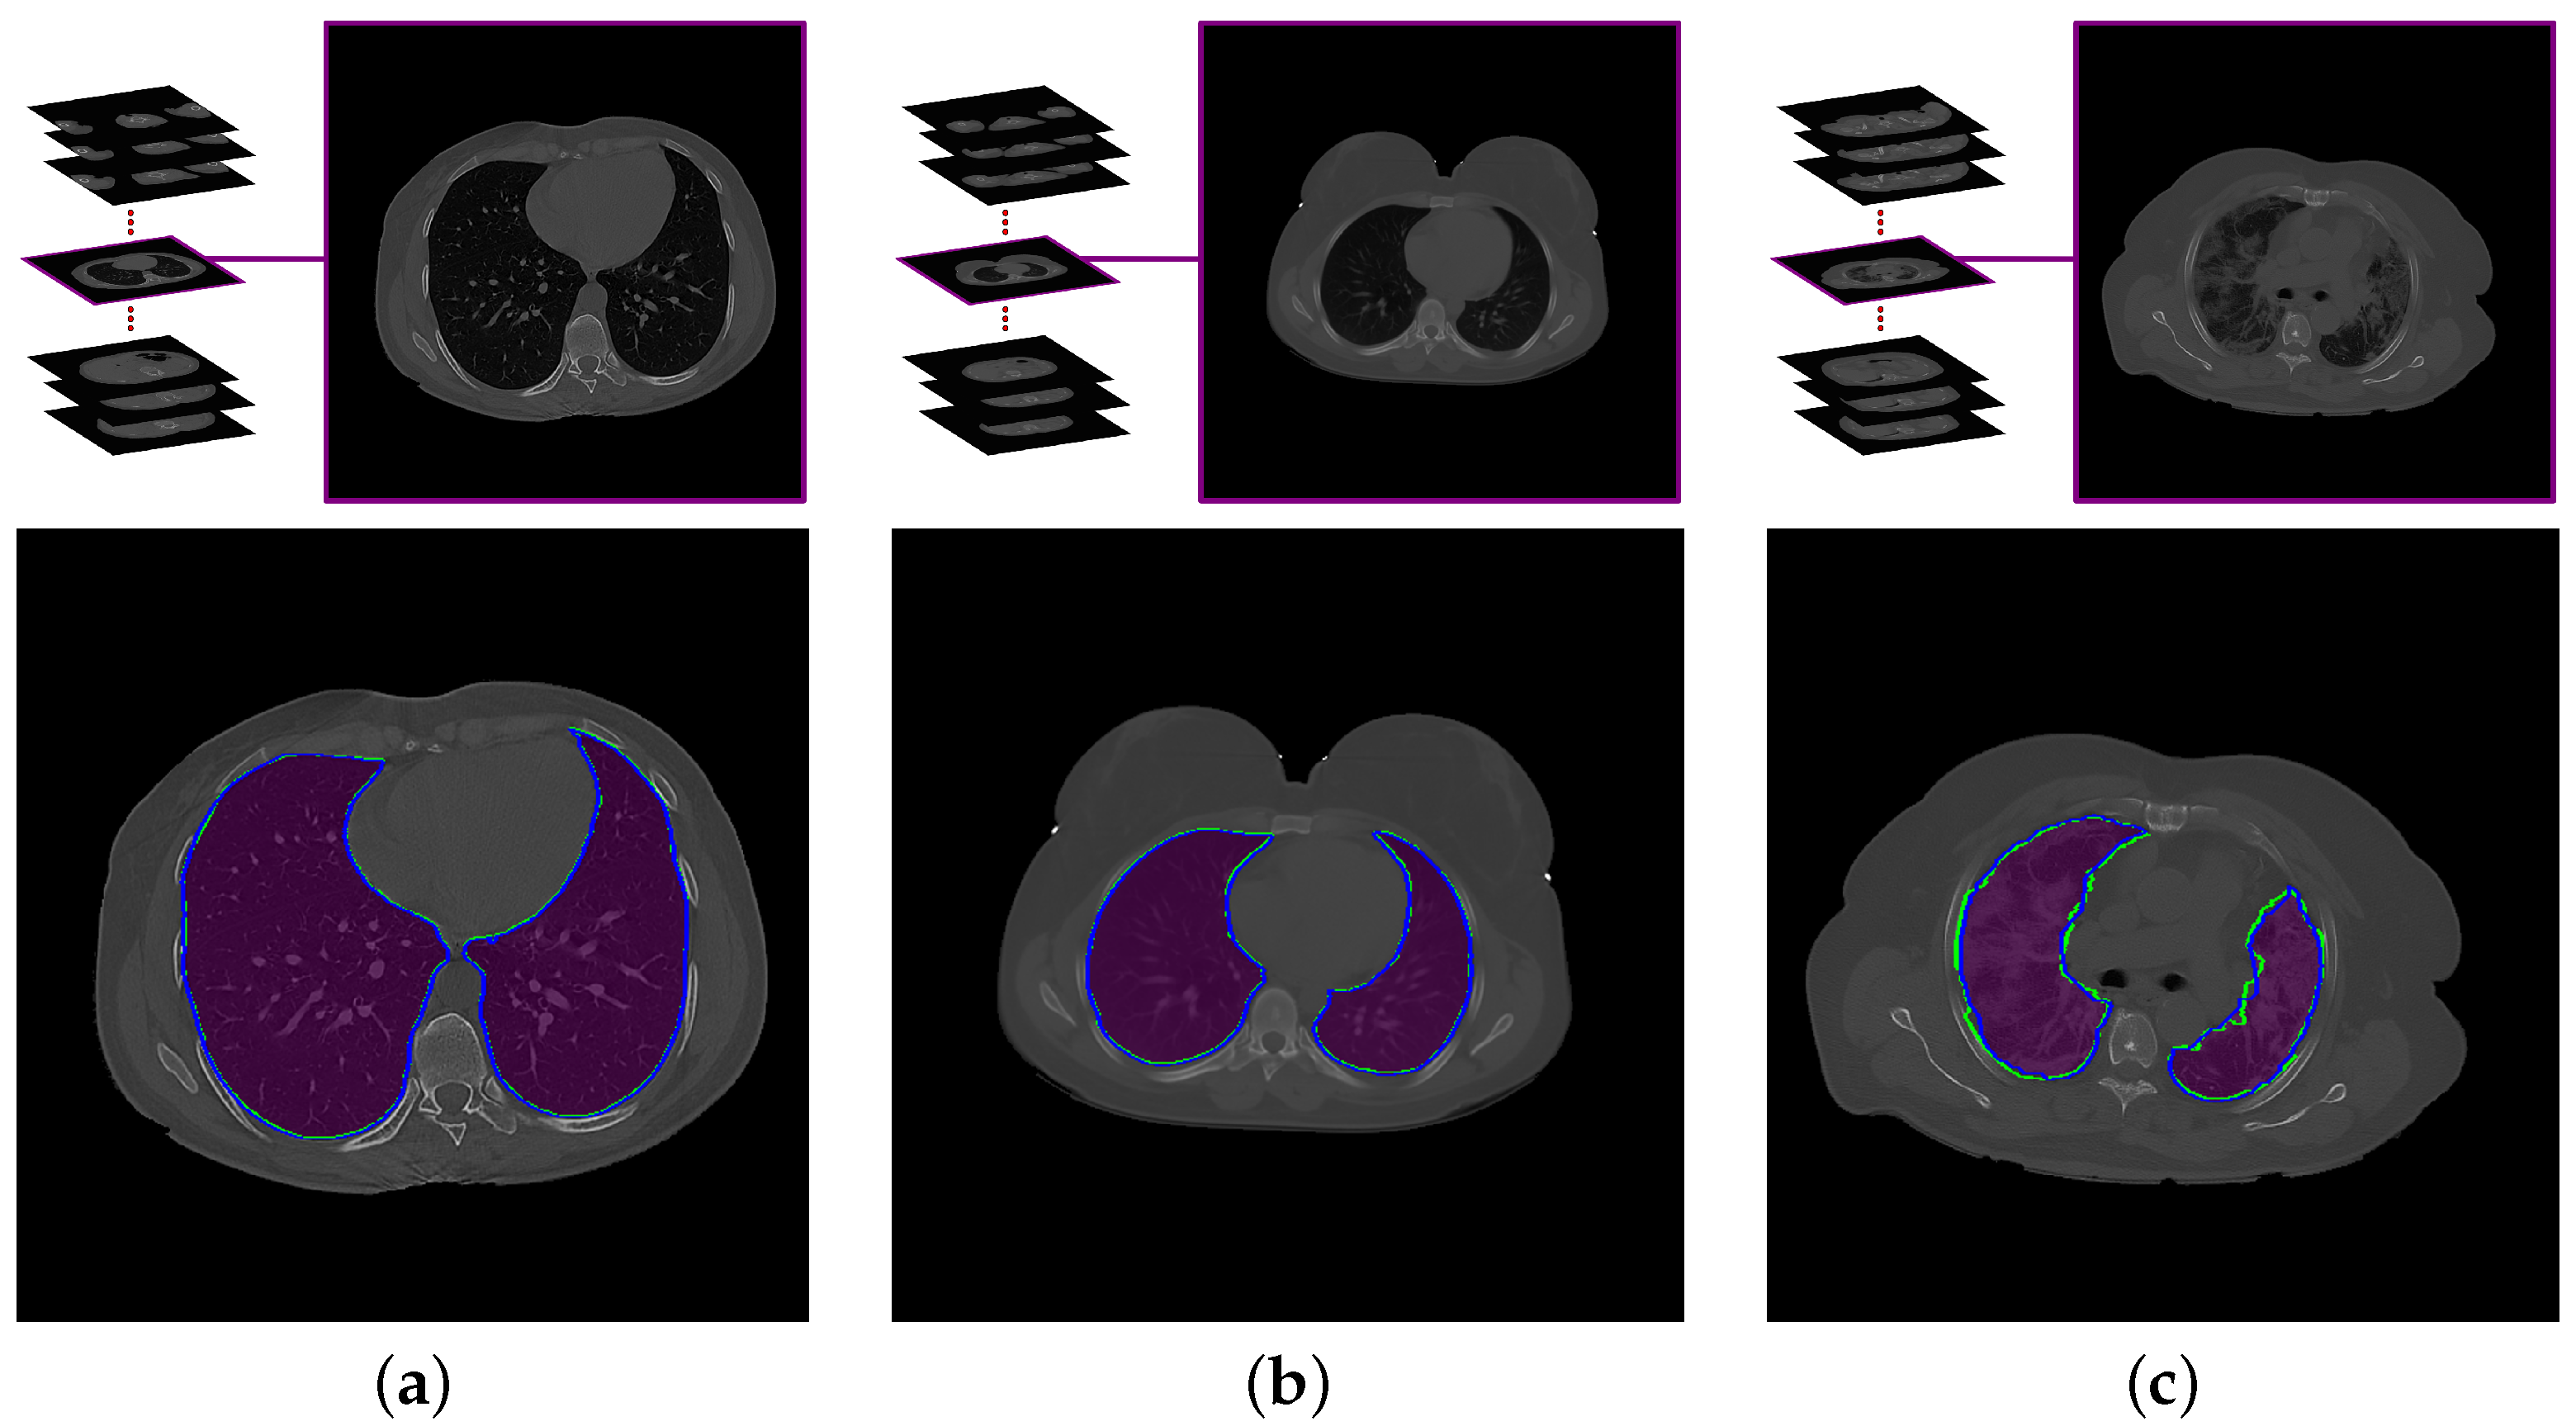
2.1. Lung Segmentation
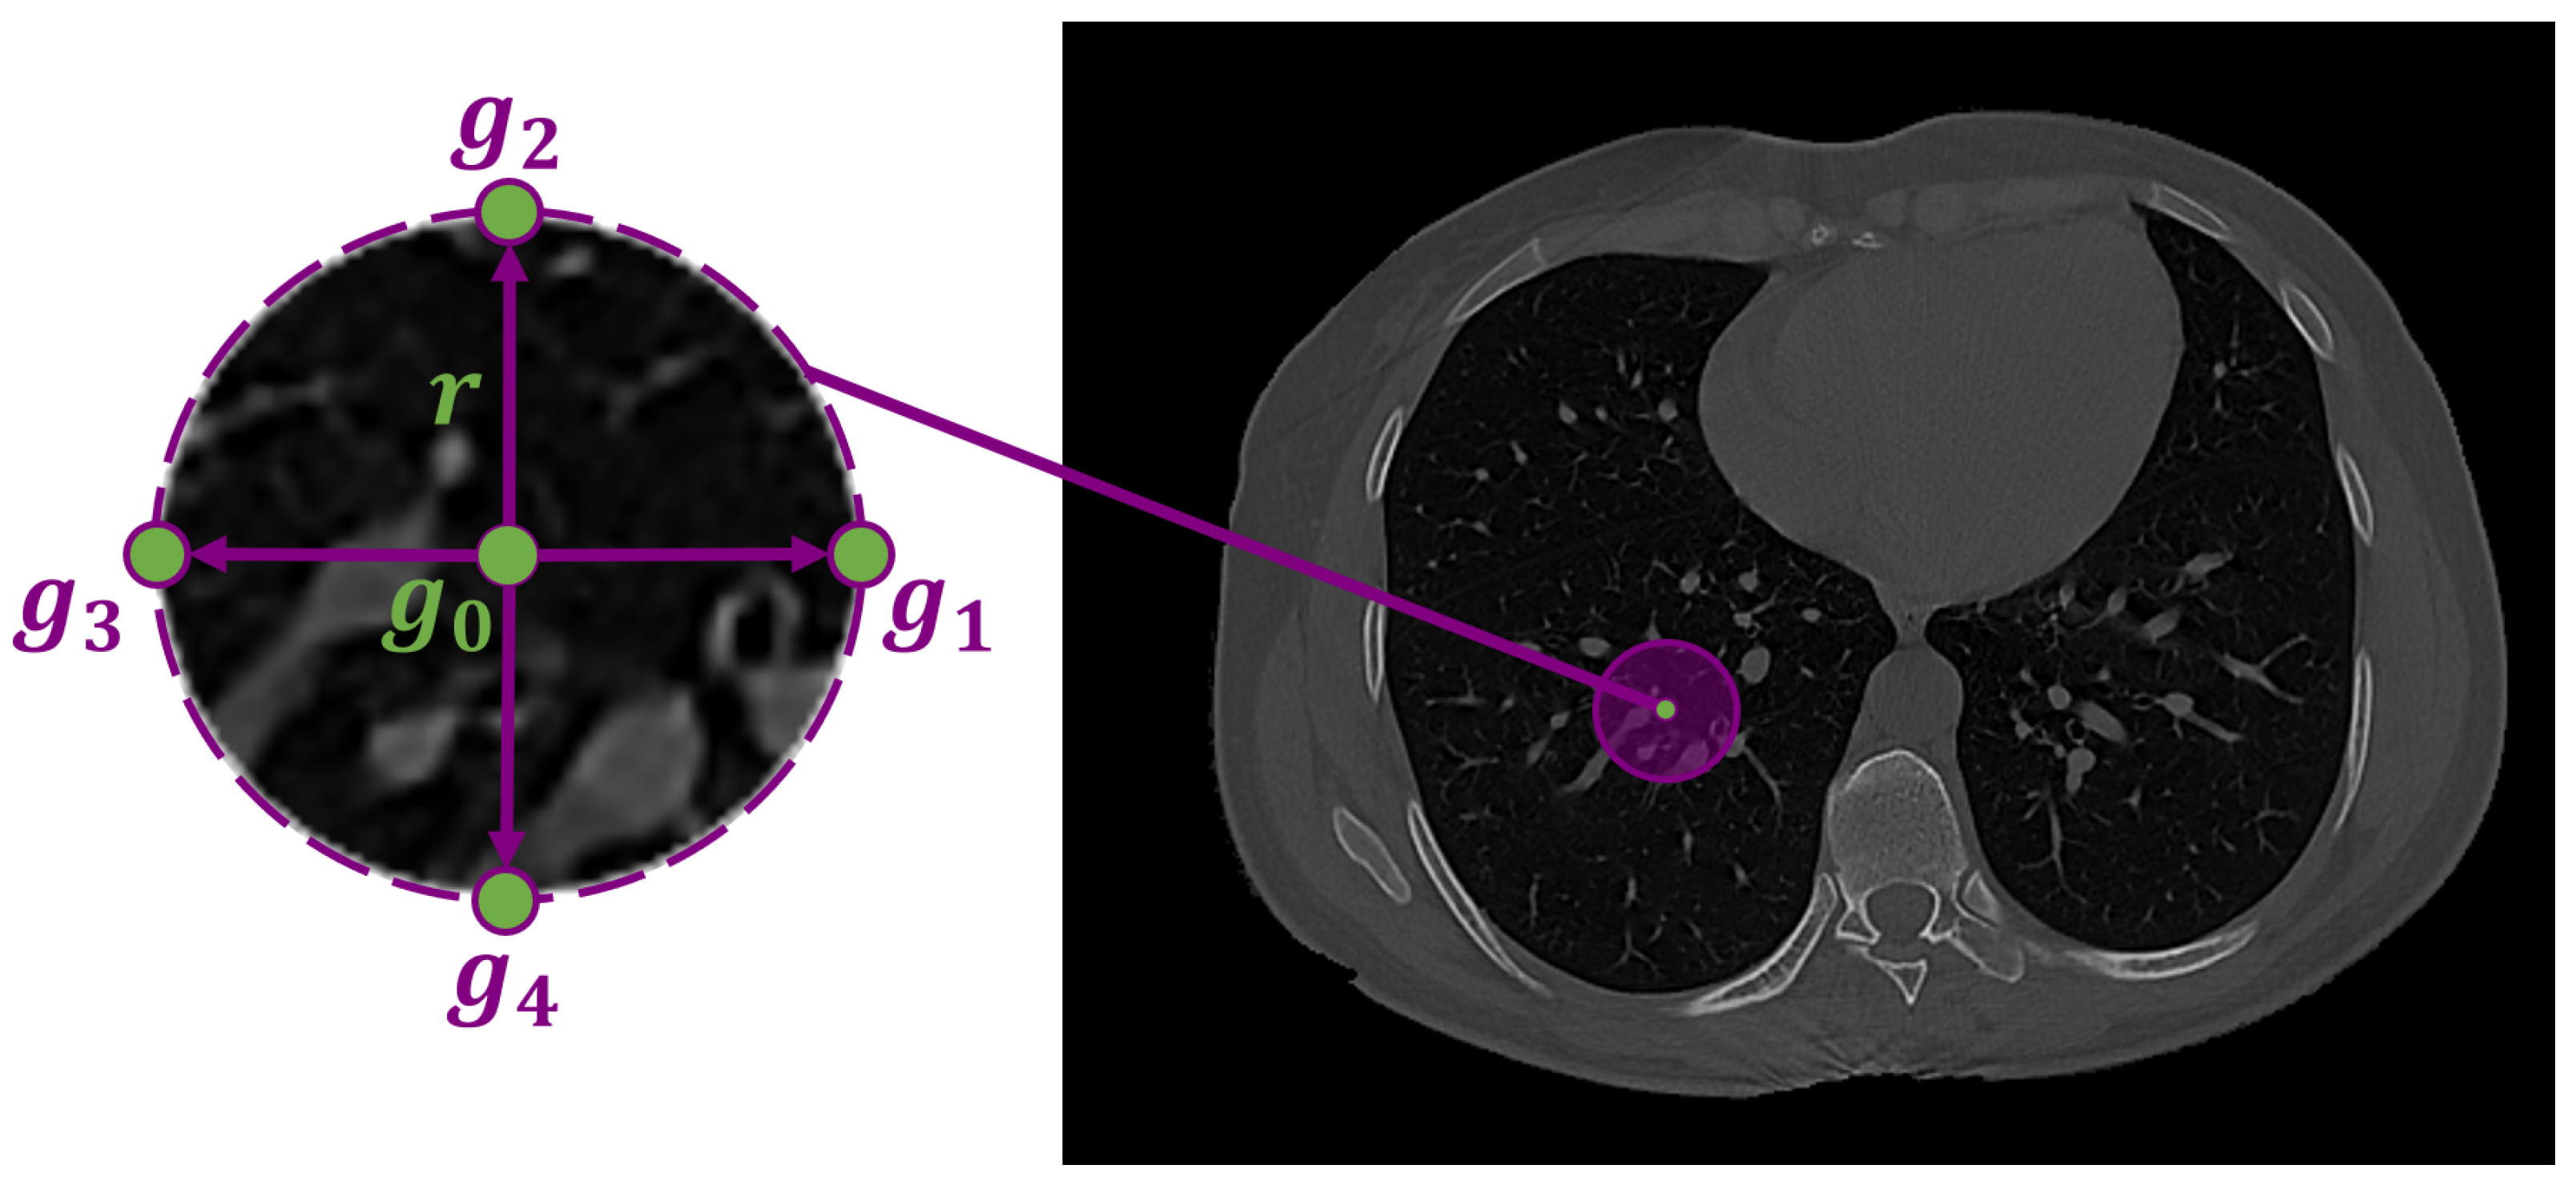
2.2. MGRF-Based Severity Detection Model
| Algorithm 1: Learning the 4th-order LBPs. |
|
2.3. Feature Representation and Classification System
| Algorithm 2: Backpropagation algorithm. |
|
3. Experimental Results
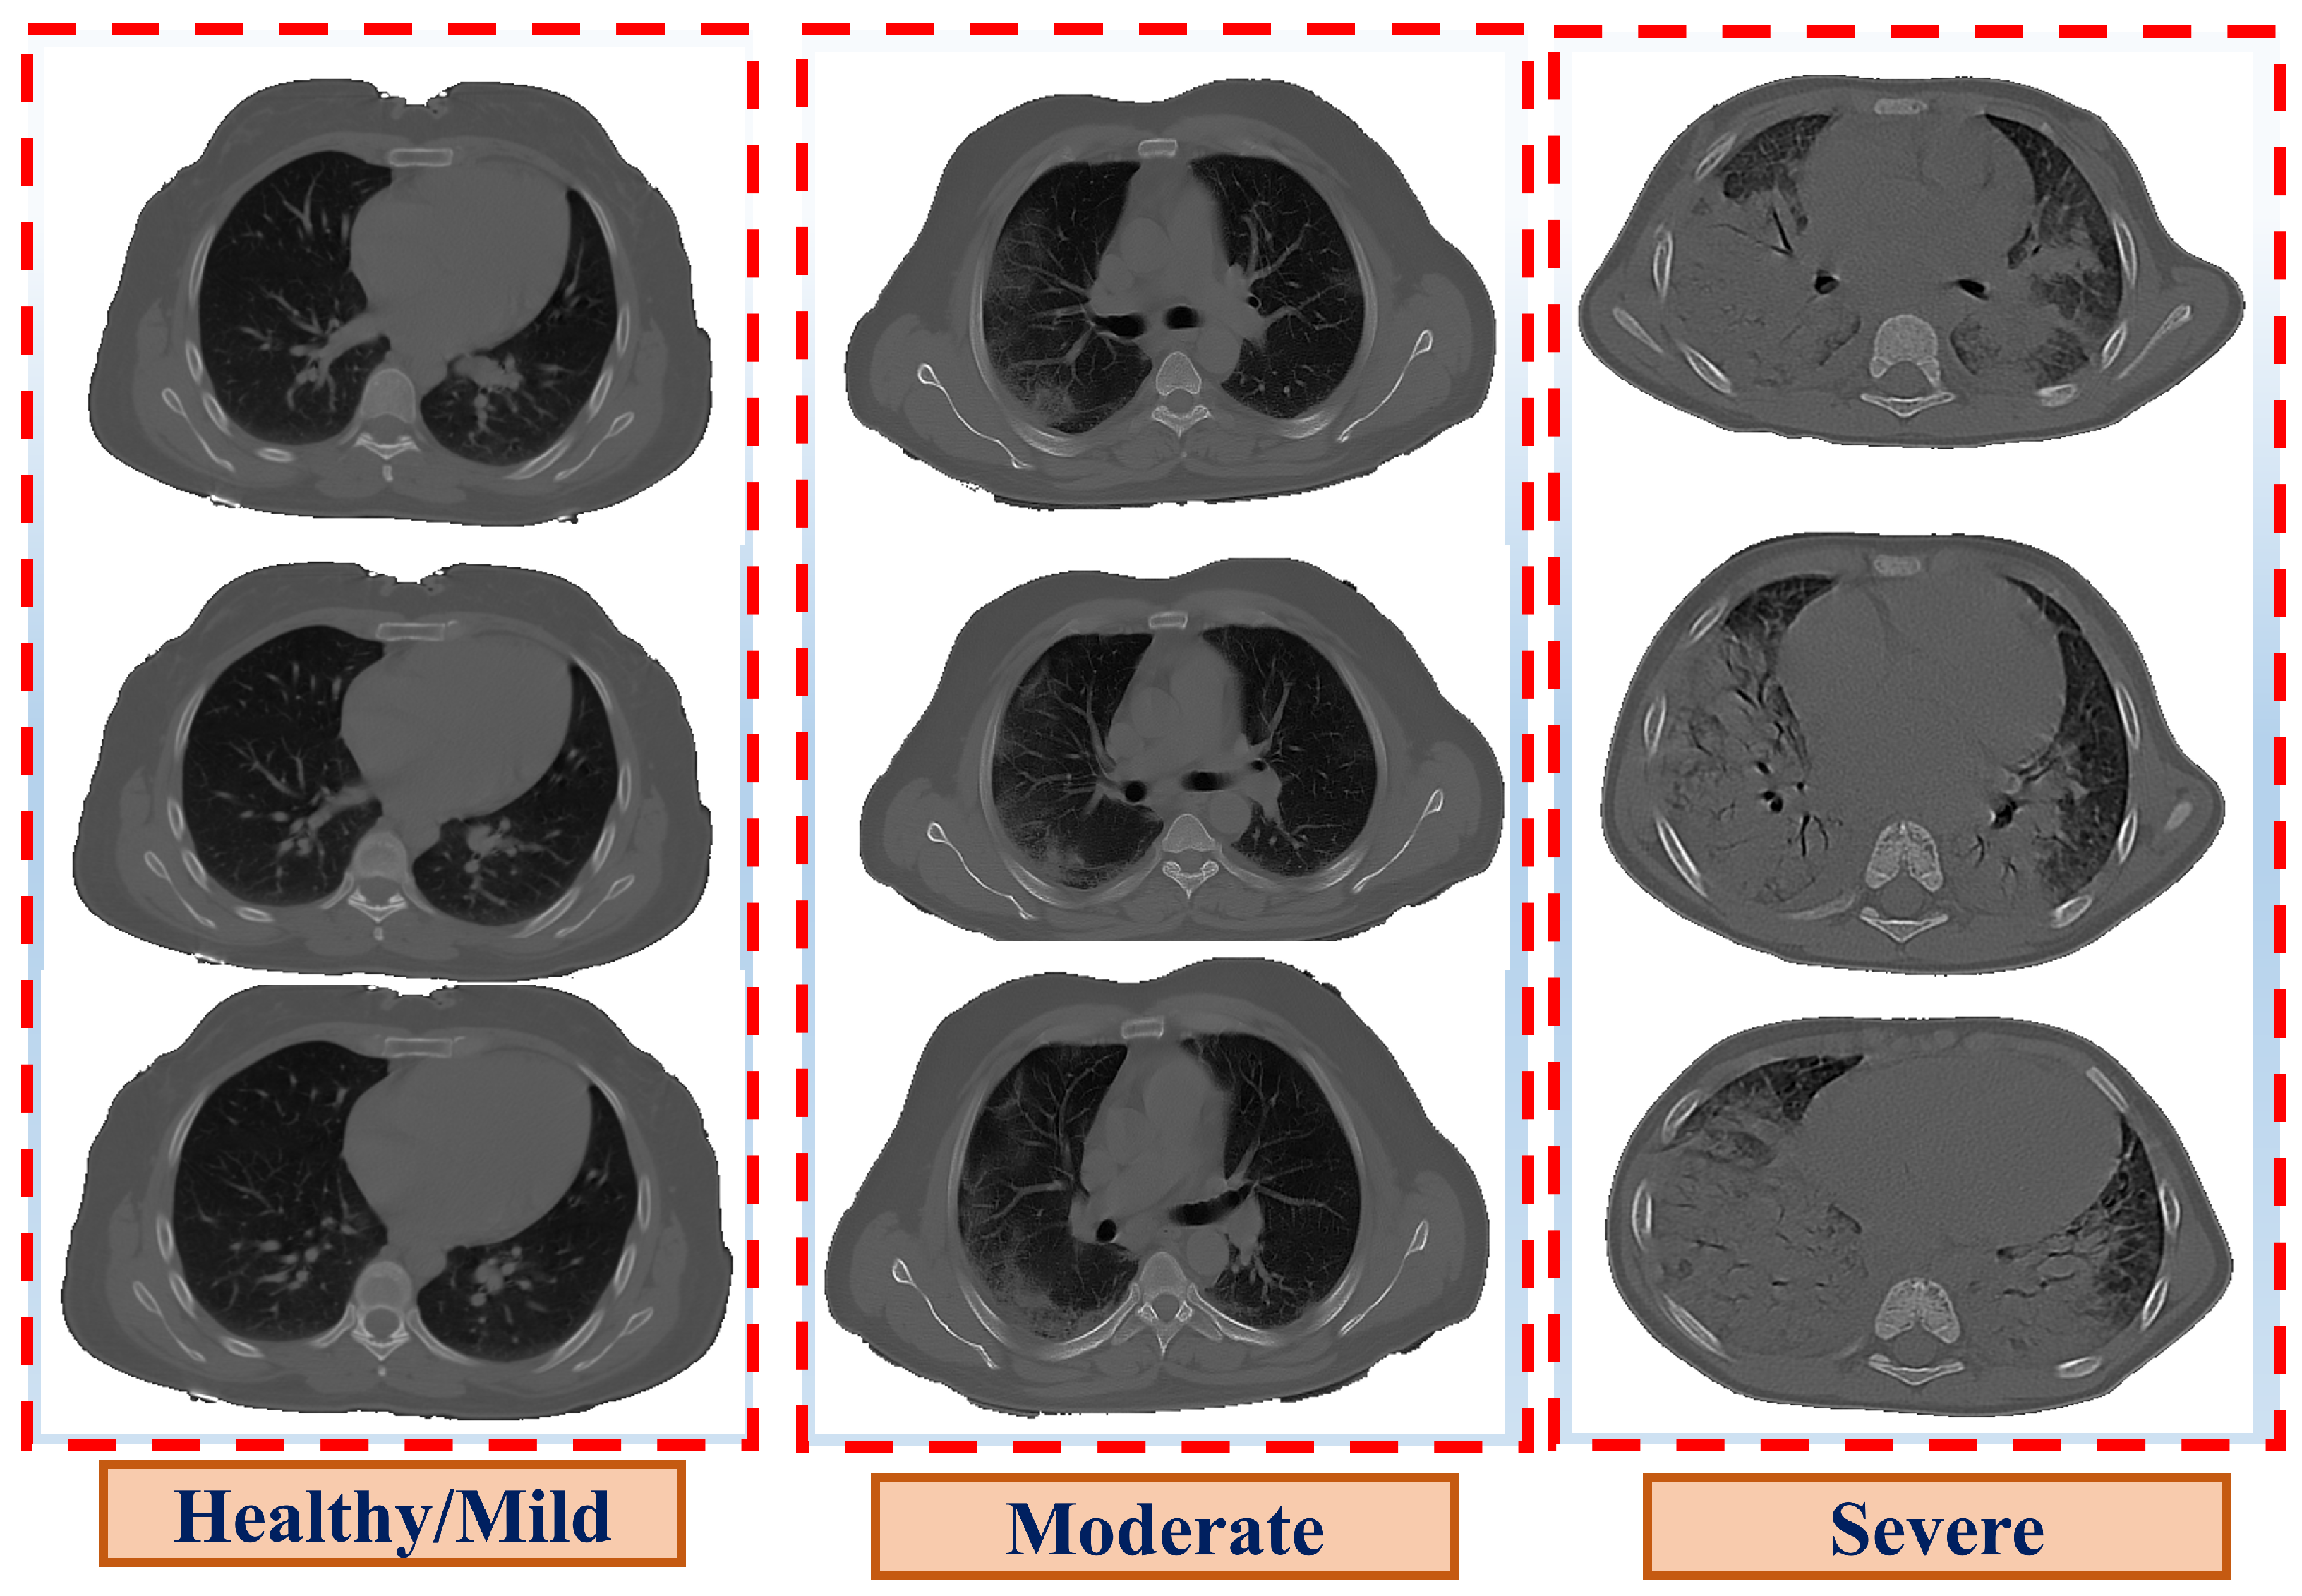
3.1. Patient Data
3.2. Evaluation Metrics
3.3. The Performance of the Proposed System
4. Discussion
5. Conclusions
Author Contributions
Funding
Institutional Review Board Statement
Informed Consent Statement
Data Availability Statement
Conflicts of Interest
References
- Wang, C.; Horby, P.W.; Hayden, F.G.; Gao, G.F. A novel coronavirus outbreak of global health concern. Lancet 2020, 395, 470–473. [Google Scholar] [CrossRef] [Green Version]
- World Health Organization. Transmission of SARS-CoV-2: Implications for Infection Prevention Precautions: Scientific Brief, 09 July 2020; Technical Report; World Health Organization: Geneva, Switzerland, 2020. [Google Scholar]
- Xu, M.; Wang, D.; Wang, H.; Zhang, X.; Liang, T.; Dai, J.; Li, M.; Zhang, J.; Zhang, K.; Xu, D.; et al. COVID-19 diagnostic testing: Technology perspective. Clin. Transl. Med. 2020, 10, e158. [Google Scholar] [CrossRef] [PubMed]
- COVID-19 Pandemic Planning Scenarios. 2021. Available online: https://www.cdc.gov/coronavirus/2019-ncov/hcp/planning-scenarios.html (accessed on 30 December 2021).
- Coronavirus Cases. 2021. Available online: https://www.worldometers.info/coronavirus/ (accessed on 3 January 2022).
- Moghanloo, E.; Rahimi-Esboei, B.; Mahmoodzadeh, H.; Hadjilooei, F.; Shahi, F.; Heidari, S.; Almassian, B. Different Behavioral Patterns of SARS-CoV-2 in Patients with Various Types of Cancers: A Role for Chronic Inflammation Induced by Macrophages [Preprint]. 2021. Available online: https://www.researchsquare.com/article/rs-238224/v1 (accessed on 15 December 2021).
- Elsharkawy, M.; Sharafeldeen, A.; Taher, F.; Shalaby, A.; Soliman, A.; Mahmoud, A.; Ghazal, M.; Khalil, A.; Alghamdi, N.S.; Razek, A.A.K.A.; et al. Early assessment of lung function in coronavirus patients using invariant markers from chest X-rays images. Sci. Rep. 2021, 11, 1–11. [Google Scholar] [CrossRef]
- Zu, Z.Y.; Jiang, M.D.; Xu, P.P.; Chen, W.; Ni, Q.Q.; Lu, G.M.; Zhang, L.J. Coronavirus disease 2019 (COVID-19): A perspective from China. Radiology 2020, 296, E15–E25. [Google Scholar] [CrossRef] [Green Version]
- Bernheim, A.; Mei, X.; Huang, M.; Yang, Y.; Fayad, Z.A.; Zhang, N.; Diao, K.; Lin, B.; Zhu, X.; Li, K.; et al. Chest CT findings in coronavirus disease-19 (COVID-19): Relationship to duration of infection. Radiology 2020, 295, 200463. [Google Scholar] [CrossRef] [Green Version]
- Li, M.; Lei, P.; Zeng, B.; Li, Z.; Yu, P.; Fan, B.; Wang, C.; Li, Z.; Zhou, J.; Hu, S.; et al. Coronavirus disease (COVID-19): Spectrum of CT findings and temporal progression of the disease. Acad. Radiol. 2020, 27, 603–608. [Google Scholar] [CrossRef] [Green Version]
- Ai, T.; Yang, Z.; Hou, H.; Zhan, C.; Chen, C.; Lv, W.; Tao, Q.; Sun, Z.; Xia, L. Correlation of chest CT and RT-PCR testing for coronavirus disease 2019 (COVID-19) in China: A report of 1014 cases. Radiology 2020, 296, E32–E40. [Google Scholar] [CrossRef] [Green Version]
- Barstugan, M.; Ozkaya, U.; Ozturk, S. Coronavirus (COVID-19) Classification using CT Images by Machine Learning Methods. arXiv 2020, arXiv:2003.09424. [Google Scholar]
- Ardakani, A.A.; Acharya, U.R.; Habibollahi, S.; Mohammadi, A. COVIDiag: A clinical CAD system to diagnose COVID-19 pneumonia based on CT findings. Eur. Radiol. 2021, 31, 121–130. [Google Scholar] [CrossRef]
- Zhang, Y.; Wu, H.; Song, H.; Li, X.; Suo, S.; Yin, Y.; Xu, J. COVID-19 Pneumonia Severity Grading: Test of a Trained Deep Learning Model. 2020. Available online: https://www.researchsquare.com/article/rs-29538/latest.pdf (accessed on 12 December 2021).
- Ni, Q.; Sun, Z.Y.; Qi, L.; Chen, W.; Yang, Y.; Wang, L.; Zhang, X.; Yang, L.; Fang, Y.; Xing, Z.; et al. A deep learning approach to characterize 2019 coronavirus disease (COVID-19) pneumonia in chest CT images. Eur. Radiol. 2020, 30, 6517–6527. [Google Scholar] [CrossRef]
- Çiçek, Ö.; Abdulkadir, A.; Lienkamp, S.S.; Brox, T.; Ronneberger, O. 3D U-Net: Learning dense volumetric segmentation from sparse annotation. In International Conference on Medical Image Computing and Computer-Assisted Intervention; Springer: Berlin/Heidelberg, Germany, 2016; pp. 424–432. [Google Scholar]
- Li, Z.; Zhang, S.; Zhang, J.; Huang, K.; Wang, Y.; Yu, Y. MVP-Net: Multi-view FPN with position-aware attention for deep universal lesion detection. In International Conference on Medical Image Computing and Computer-Assisted Intervention; Springer: Berlin/Heidelberg, Germany, 2019; pp. 13–21. [Google Scholar]
- Goncharov, M.; Pisov, M.; Shevtsov, A.; Shirokikh, B.; Kurmukov, A.; Blokhin, I.; Chernina, V.; Solovev, A.; Gombolevskiy, V.; Morozov, S.; et al. Ct-based covid-19 triage: Deep multitask learning improves joint identification and severity quantification. Med. Image Anal. 2021, 71, 102054. [Google Scholar] [CrossRef] [PubMed]
- Ghafoor, K. COVID-19 Pneumonia Level Detection Using Deep Learning Algorithm. 2020. Available online: https://www.techrxiv.org/articles/preprint/COVID-19_Pneumonia_Level_Detection_using_Deep_Learning_Algorithm/12619193 (accessed on 1 January 2022).
- Shakarami, A.; Menhaj, M.B.; Tarrah, H. Diagnosing COVID-19 disease using an efficient CAD system. Optik 2021, 241, 167199. [Google Scholar] [CrossRef] [PubMed]
- Krizhevsky, A.; Sutskever, I.; Hinton, G.E. ImageNet classification with deep convolutional neural networks. Commun. ACM 2017, 60, 84–90. [Google Scholar] [CrossRef]
- Zheng, C.; Deng, X.; Fu, Q.; Zhou, Q.; Feng, J.; Ma, H.; Liu, W.; Wang, X. Deep learning-based detection for COVID-19 from chest CT using weak label. medRxiv 2020. [Google Scholar] [CrossRef] [Green Version]
- Wang, B.; Jin, S.; Yan, Q.; Xu, H.; Luo, C.; Wei, L.; Zhao, W.; Hou, X.; Ma, W.; Xu, Z.; et al. AI-assisted CT imaging analysis for COVID-19 screening: Building and deploying a medical AI system. Appl. Soft Comput. 2021, 98, 106897. [Google Scholar] [CrossRef]
- Zhou, Z.; Siddiquee, M.M.R.; Tajbakhsh, N.; Liang, J. UNet++: A Nested U-Net Architecture for Medical Image Segmentation. In Deep Learning in Medical Image Analysis and Multimodal Learning for Clinical Decision Support; Springer International Publishing: Berlin/Heidelberg, Germany, 2018; pp. 3–11. [Google Scholar] [CrossRef] [Green Version]
- Milletari, F.; Navab, N.; Ahmadi, S.A. V-Net: Fully Convolutional Neural Networks for Volumetric Medical Image Segmentation. In Proceedings of the 2016 Fourth International Conference on 3D Vision (3DV), Stanford, CA, USA, 25–28 October 2016. [Google Scholar]
- Long, J.; Shelhamer, E.; Darrell, T. Fully convolutional networks for semantic segmentation. In Proceedings of the 2015 IEEE Conference on Computer Vision and Pattern Recognition (CVPR), Boston, MA, USA, 7–12 June 2015. [Google Scholar]
- Szegedy, C.; Vanhoucke, V.; Ioffe, S.; Shlens, J.; Wojna, Z. Rethinking the Inception Architecture for Computer Vision. In Proceedings of the 2016 IEEE Conference on Computer Vision and Pattern Recognition (CVPR), Las Vegas, NV, USA, 27–30 June 2016. [Google Scholar]
- Chen, Y.; Li, J.; Xiao, H.; Jin, X.; Yan, S.; Feng, J. Dual Path Networks. Adv. Neural Inf. Process. Syst. 2017, 30, 32. [Google Scholar]
- Wang, F.; Jiang, M.; Qian, C.; Yang, S.; Li, C.; Zhang, H.; Wang, X.; Tang, X. Residual Attention Network for Image Classification. In Proceedings of the 2017 IEEE Conference on Computer Vision and Pattern Recognition (CVPR), Honolulu, HI, USA, 21–26 July 2017. [Google Scholar]
- Sharafeldeen, A.; Elsharkawy, M.; Alghamdi, N.S.; Soliman, A.; El-Baz, A. Precise Segmentation of COVID-19 Infected Lung from CT Images Based on Adaptive First-Order Appearance Model with Morphological/Anatomical Constraints. Sensors 2021, 21, 5482. [Google Scholar] [CrossRef]
- El-Baz, A.S.; Gimel’farb, G.L.; Suri, J.S. Stochastic Modeling for Medical Image Analysis; CRC Press: Boca Raton, FL, USA, 2016. [Google Scholar]
- Sharafeldeen, A.; Elsharkawy, M.; Khalifa, F.; Soliman, A.; Ghazal, M.; AlHalabi, M.; Yaghi, M.; Alrahmawy, M.; Elmougy, S.; Sandhu, H.S.; et al. Precise higher-order reflectivity and morphology models for early diagnosis of diabetic retinopathy using OCT images. Sci. Rep. 2021, 11, 4730. [Google Scholar] [CrossRef]
- Elsharkawy, M.; Sharafeldeen, A.; Soliman, A.; Khalifa, F.; Ghazal, M.; El-Daydamony, E.; Atwan, A.; Sandhu, H.S.; El-Baz, A. A Novel Computer-Aided Diagnostic System for Early Detection of Diabetic Retinopathy Using 3D-OCT Higher-Order Spatial Appearance Model. Diagnostics 2022, 12, 461. [Google Scholar] [CrossRef]
- Ranganathan, A. The levenberg-marquardt algorithm. Tutoral Algorithm 2004, 11, 101–110. [Google Scholar]
- Biau, G.; Scornet, E. A random forest guided tour. Test 2016, 25, 197–227. [Google Scholar] [CrossRef] [Green Version]
- Loh, W.Y. Classification and regression trees. Wiley Interdiscip. Rev. 2011, 1, 14–23. [Google Scholar] [CrossRef]
- Murphy, K.P. Naive bayes classifiers. Univ. Br. Columbia 2006, 18, 1–8. [Google Scholar]
- Noble, W.S. What is a support vector machine? Nat. Biotechnol. 2006, 24, 1565–1567. [Google Scholar] [CrossRef] [PubMed]
- Guo, G.; Wang, H.; Bell, D.; Bi, Y.; Greer, K. KNN model-based approach in classification. In OTM Confederated International Conferences “On the Move to Meaningful Internet Systems”; Springer: Berlin/Heidelberg, Germany, 2003; pp. 986–996. [Google Scholar]
- Wu, C.; Chen, X.; Cai, Y.; Zhou, X.; Xu, S.; Huang, H.; Zhang, L.; Zhou, X.; Du, C.; Zhang, Y.; et al. Risk factors associated with acute respiratory distress syndrome and death in patients with coronavirus disease 2019 pneumonia in Wuhan, China. JAMA Intern. Med. 2020, 180, 934–943. [Google Scholar] [CrossRef] [Green Version]
- Arentz, M.; Yim, E.; Klaff, L.; Lokhandwala, S.; Riedo, F.X.; Chong, M.; Lee, M. Characteristics and outcomes of 21 critically ill patients with COVID-19 in Washington State. JAMA 2020, 323, 1612–1614. [Google Scholar] [CrossRef] [Green Version]
- Richardson, S.; Hirsch, J.S.; Narasimhan, M.; Crawford, J.M.; McGinn, T.; Davidson, K.W.; Barnaby, D.P.; Becker, L.B.; Chelico, J.D.; Cohen, S.L.; et al. Presenting characteristics, comorbidities, and outcomes among 5700 patients hospitalized with COVID-19 in the New York City area. JAMA 2020, 323, 2052–2059. [Google Scholar] [CrossRef]
- Jiang, X.; Coffee, M.; Bari, A.; Wang, J.; Jiang, X.; Huang, J.; Shi, J.; Dai, J.; Cai, J.; Zhang, T.; et al. Towards an artificial intelligence framework for data-driven prediction of coronavirus clinical severity. Comput. Mater. Contin. 2020, 63, 537–551. [Google Scholar] [CrossRef]
- Marcos, M.; Belhassen-García, M.; Sánchez-Puente, A.; Sampedro-Gomez, J.; Azibeiro, R.; Dorado-Díaz, P.I.; Marcano-Millán, E.; García-Vidal, C.; Moreiro-Barroso, M.T.; Cubino-Bóveda, N.; et al. Development of a severity of disease score and classification model by machine learning for hospitalized COVID-19 patients. PLoS ONE 2021, 16, e0240200. [Google Scholar] [CrossRef]
- Ronneberger, O.; Fischer, P.; Brox, T. U-Net: Convolutional Networks for Biomedical Image Segmentation. In Lecture Notes in Computer Science; Springer International Publishing: Berlin/Heidelberg, Germany, 2015; pp. 234–241. [Google Scholar] [CrossRef] [Green Version]
- Wu, X.; Chen, C.; Zhong, M.; Wang, J.; Shi, J. COVID-AL: The diagnosis of COVID-19 with deep active learning. Med. Image Anal. 2021, 68, 101913. [Google Scholar] [CrossRef]
- Zhang, K.; Liu, X.; Shen, J.; Li, Z.; Sang, Y.; Wu, X.; Zha, Y.; Liang, W.; Wang, C.; Wang, K.; et al. Clinically applicable AI system for accurate diagnosis, quantitative measurements, and prognosis of COVID-19 pneumonia using computed tomography. Cell 2020, 181, 1423–1433. [Google Scholar] [CrossRef] [PubMed]
- Ardakani, A.A.; Kanafi, A.R.; Acharya, U.R.; Khadem, N.; Mohammadi, A. Application of deep learning technique to manage COVID-19 in routine clinical practice using CT images: Results of 10 convolutional neural networks. Comput. Biol. Med. 2020, 121, 103795. [Google Scholar] [CrossRef] [PubMed]
- He, K.; Zhang, X.; Ren, S.; Sun, J. Deep Residual Learning for Image Recognition. In Proceedings of the 2016 IEEE Conference on Computer Vision and Pattern Recognition (CVPR), Las Vegas, NV, USA, 27– 30 June 2016. [Google Scholar]
- Chollet, F. Xception: Deep Learning with Depthwise Separable Convolutions. In Proceedings of the 2017 IEEE Conference on Computer Vision and Pattern Recognition (CVPR), Honolulu, HI, USA, 21–26 July 2017. [Google Scholar]
- Lehmann, T.; Gonner, C.; Spitzer, K. Survey: Interpolation methods in medical image processing. IEEE Trans. Med. Imaging 1999, 18, 1049–1075. [Google Scholar] [CrossRef] [PubMed] [Green Version]
- Song, Y.; Zheng, S.; Li, L.; Zhang, X.; Zhang, X.; Huang, Z.; Chen, J.; Wang, R.; Zhao, H.; Zha, Y.; et al. Deep learning Enables Accurate Diagnosis of Novel Coronavirus (COVID-19) with CT images. IEEE/ACM Trans. Comput. Biol. Bioinform. 2021, 18, 2775–2780. [Google Scholar] [CrossRef]
- Yang, Z.; Luo, T.; Wang, D.; Hu, Z.; Gao, J.; Wang, L. Learning to Navigate for Fine-Grained Classification. In Computer Vision–ECCV 2018; Springer International Publishing: Berlin/Heidelberg, Germany, 2018; pp. 438–454. [Google Scholar] [CrossRef] [Green Version]
- Wu, X.; Hui, H.; Niu, M.; Li, L.; Wang, L.; He, B.; Yang, X.; Li, L.; Li, H.; Tian, J.; et al. Deep learning-based multi-view fusion model for screening 2019 novel coronavirus pneumonia: A multicentre study. Eur. J. Radiol. 2020, 128, 109041. [Google Scholar] [CrossRef]


| Class Evaluation | Overall Evaluation | ||||||
|---|---|---|---|---|---|---|---|
| Classifier | Class | Recall | Precision | 1- | Overall Accuracy | Kappa | |
| Lung Model | Random Forest [35] | Healthy/Mild | 80% | % | % | % | % |
| Moderate | % | % | % | ||||
| Severe | % | 100% | % | ||||
| Decision Trees [36] | Healthy/Mild | 80% | % | % | % | % | |
| Moderate | % | 70% | % | ||||
| Severe | % | % | % | ||||
| Naive Bayes [37] | Healthy/Mild | 100% | % | % | % | % | |
| Moderate | % | 50% | % | ||||
| Severe | % | 70% | % | ||||
| SVM [38] | Healthy/Mild | 100% | % | % | % | % | |
| Moderate | % | % | % | ||||
| Severe | % | 70% | % | ||||
| KNN [39] | Healthy/Mild | 60% | 75% | % | % | % | |
| Moderate | % | % | 80% | ||||
| Severe | 75% | 100% | % | ||||
| Proposed System | Healthy/Mild | 100% | 100% | 100% | % | % | |
| Moderate | 100% | % | % | ||||
| Severe | % | 100% | % | ||||
| Hybrid Model | Random Forest [35] | Healthy/Mild | 40% | % | 50% | 75% | % |
| Moderate | % | % | % | ||||
| Severe | 75% | 100% | % | ||||
| Decision Trees [36] | Healthy/Mild | 20% | 50% | % | % | % | |
| Moderate | % | % | % | ||||
| Severe | % | % | % | ||||
| Naive Bayes [37] | Healthy/Mild | 80% | % | % | % | % | |
| Moderate | % | 60% | % | ||||
| Severe | % | 70% | % | ||||
| SVM [38] | Healthy/Mild | 80% | 80% | 80% | % | % | |
| Moderate | % | % | % | ||||
| Severe | % | % | 70% | ||||
| KNN [39] | Healthy/Mild | 60% | % | 50% | % | % | |
| Moderate | % | % | 60% | ||||
| Severe | % | % | % | ||||
| Proposed System | Healthy/Mild | 100% | 100% | 100% | % | % | |
| Moderate | 100% | % | % | ||||
| Severe | 75% | 100% | % | ||||
| Lesion Model | Random Forest [35] | Healthy/Mild | 100% | 100% | 100% | % | % |
| Moderate | 100% | % | 88% | ||||
| Severe | % | 100% | % | ||||
| Decision Trees [36] | Healthy/Mild | 80% | 100% | % | % | % | |
| Moderate | % | % | 80% | ||||
| Severe | % | % | % | ||||
| Naive Bayes [37] | Healthy/Mild | 100% | 100% | 100% | % | % | |
| Moderate | % | 100% | 90% | ||||
| Severe | 100% | 80% | % | ||||
| SVM [38] | Healthy/Mild | 80% | 100% | % | % | % | |
| Moderate | % | 75% | % | ||||
| Severe | 75% | 75% | 75% | ||||
| KNN [39] | Healthy/Mild | 100% | 100% | 100% | % | % | |
| Moderate | % | 80% | % | ||||
| Severe | 75% | % | % | ||||
| Proposed System | Healthy/Mild | 100% | 100% | 100% | % | % | |
| Moderate | 100% | 100% | 100% | ||||
| Severe | 100% | 100% | 100% | ||||
Publisher’s Note: MDPI stays neutral with regard to jurisdictional claims in published maps and institutional affiliations. |
© 2022 by the authors. Licensee MDPI, Basel, Switzerland. This article is an open access article distributed under the terms and conditions of the Creative Commons Attribution (CC BY) license (https://creativecommons.org/licenses/by/4.0/).
Share and Cite
Farahat, I.S.; Sharafeldeen, A.; Elsharkawy, M.; Soliman, A.; Mahmoud, A.; Ghazal, M.; Taher, F.; Bilal, M.; Abdel Razek, A.A.K.; Aladrousy, W.; et al. The Role of 3D CT Imaging in the Accurate Diagnosis of Lung Function in Coronavirus Patients. Diagnostics 2022, 12, 696. https://doi.org/10.3390/diagnostics12030696
Farahat IS, Sharafeldeen A, Elsharkawy M, Soliman A, Mahmoud A, Ghazal M, Taher F, Bilal M, Abdel Razek AAK, Aladrousy W, et al. The Role of 3D CT Imaging in the Accurate Diagnosis of Lung Function in Coronavirus Patients. Diagnostics. 2022; 12(3):696. https://doi.org/10.3390/diagnostics12030696
Chicago/Turabian StyleFarahat, Ibrahim Shawky, Ahmed Sharafeldeen, Mohamed Elsharkawy, Ahmed Soliman, Ali Mahmoud, Mohammed Ghazal, Fatma Taher, Maha Bilal, Ahmed Abdel Khalek Abdel Razek, Waleed Aladrousy, and et al. 2022. "The Role of 3D CT Imaging in the Accurate Diagnosis of Lung Function in Coronavirus Patients" Diagnostics 12, no. 3: 696. https://doi.org/10.3390/diagnostics12030696