
Evaluation and Modelling of the Performance of an Automated SARS-CoV-2 Antigen Assay According to Sample Type, Target Population and Epidemic Trends

 , ,
, ,
Abstract
:1. Introduction
2. Materials and Methods
2.1. Study Design, Population and Sample Collection
2.2. SARS-CoV-2 RT-PCR
2.3. SARS-CoV-2 Antigen Quantification
2.4. SARS-CoV-2 Variant Determination
2.5. Model
2.6. Statistical Analyses
2.7. Ethical Approval
3. Results
3.1. Population
3.2. Threshold Determination
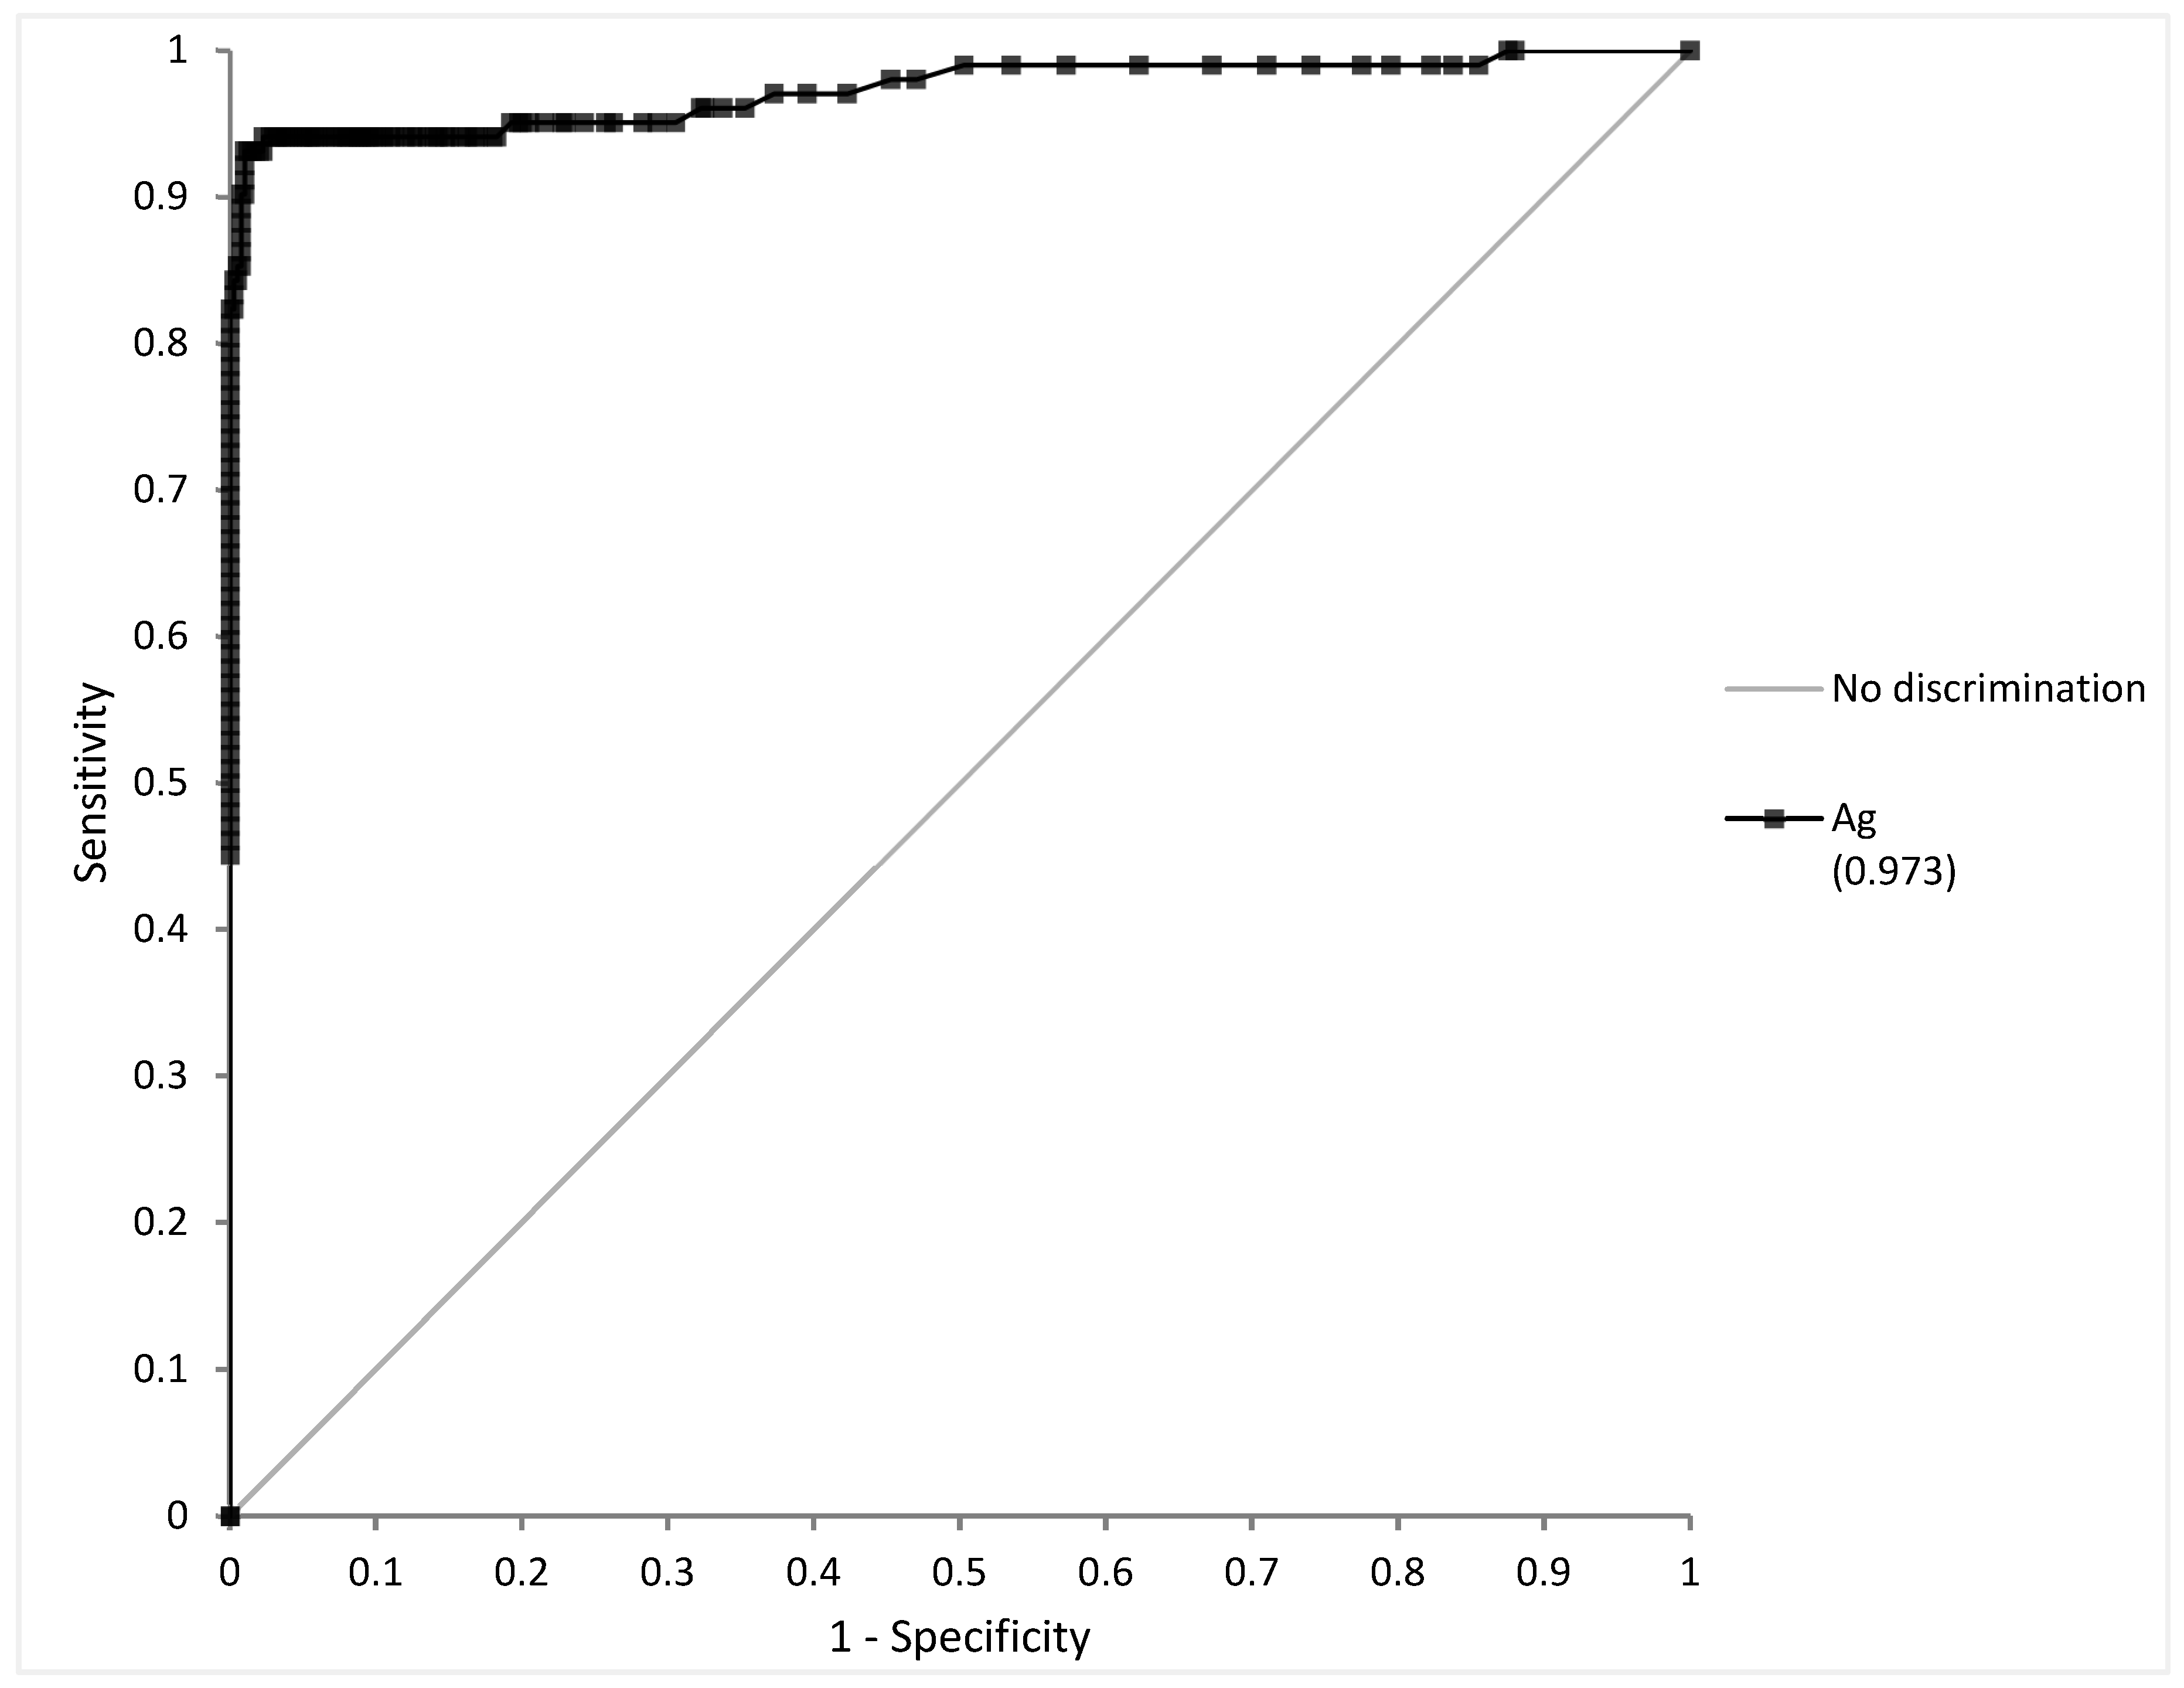
3.2.1. NPS
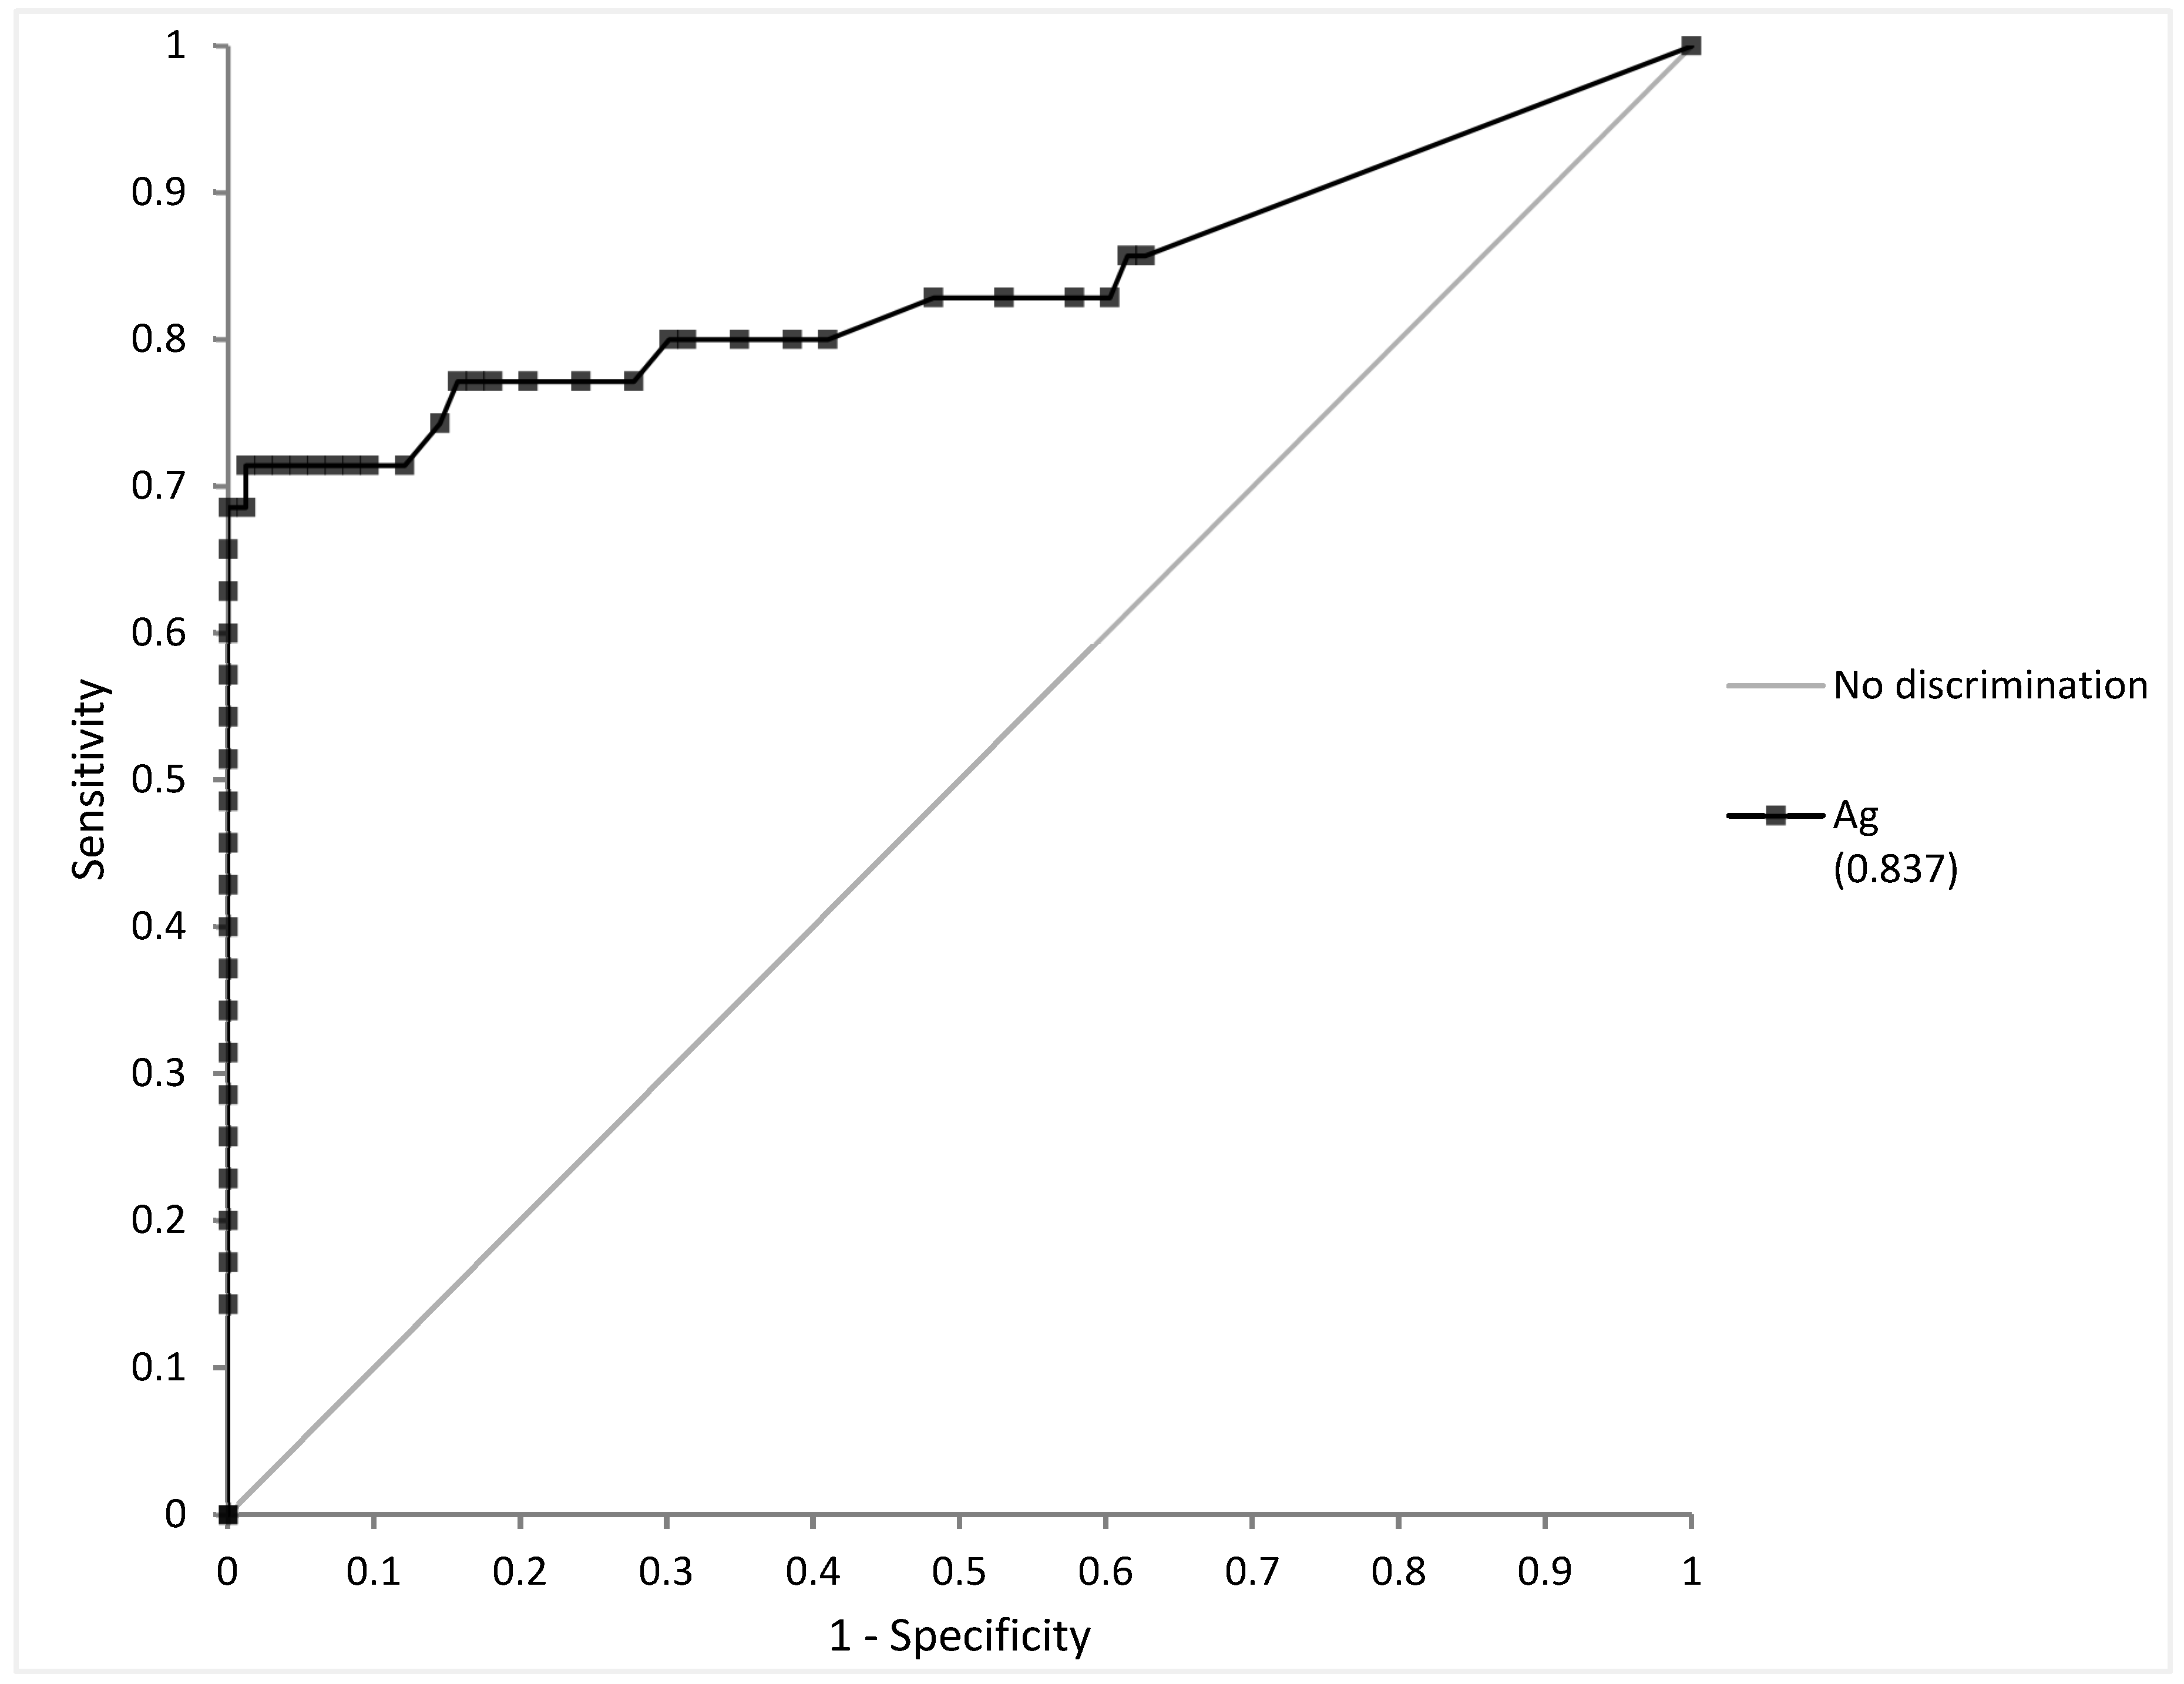
3.2.2. Saliva
3.3. Detection Limit Assessment
3.4. Variants of Interest
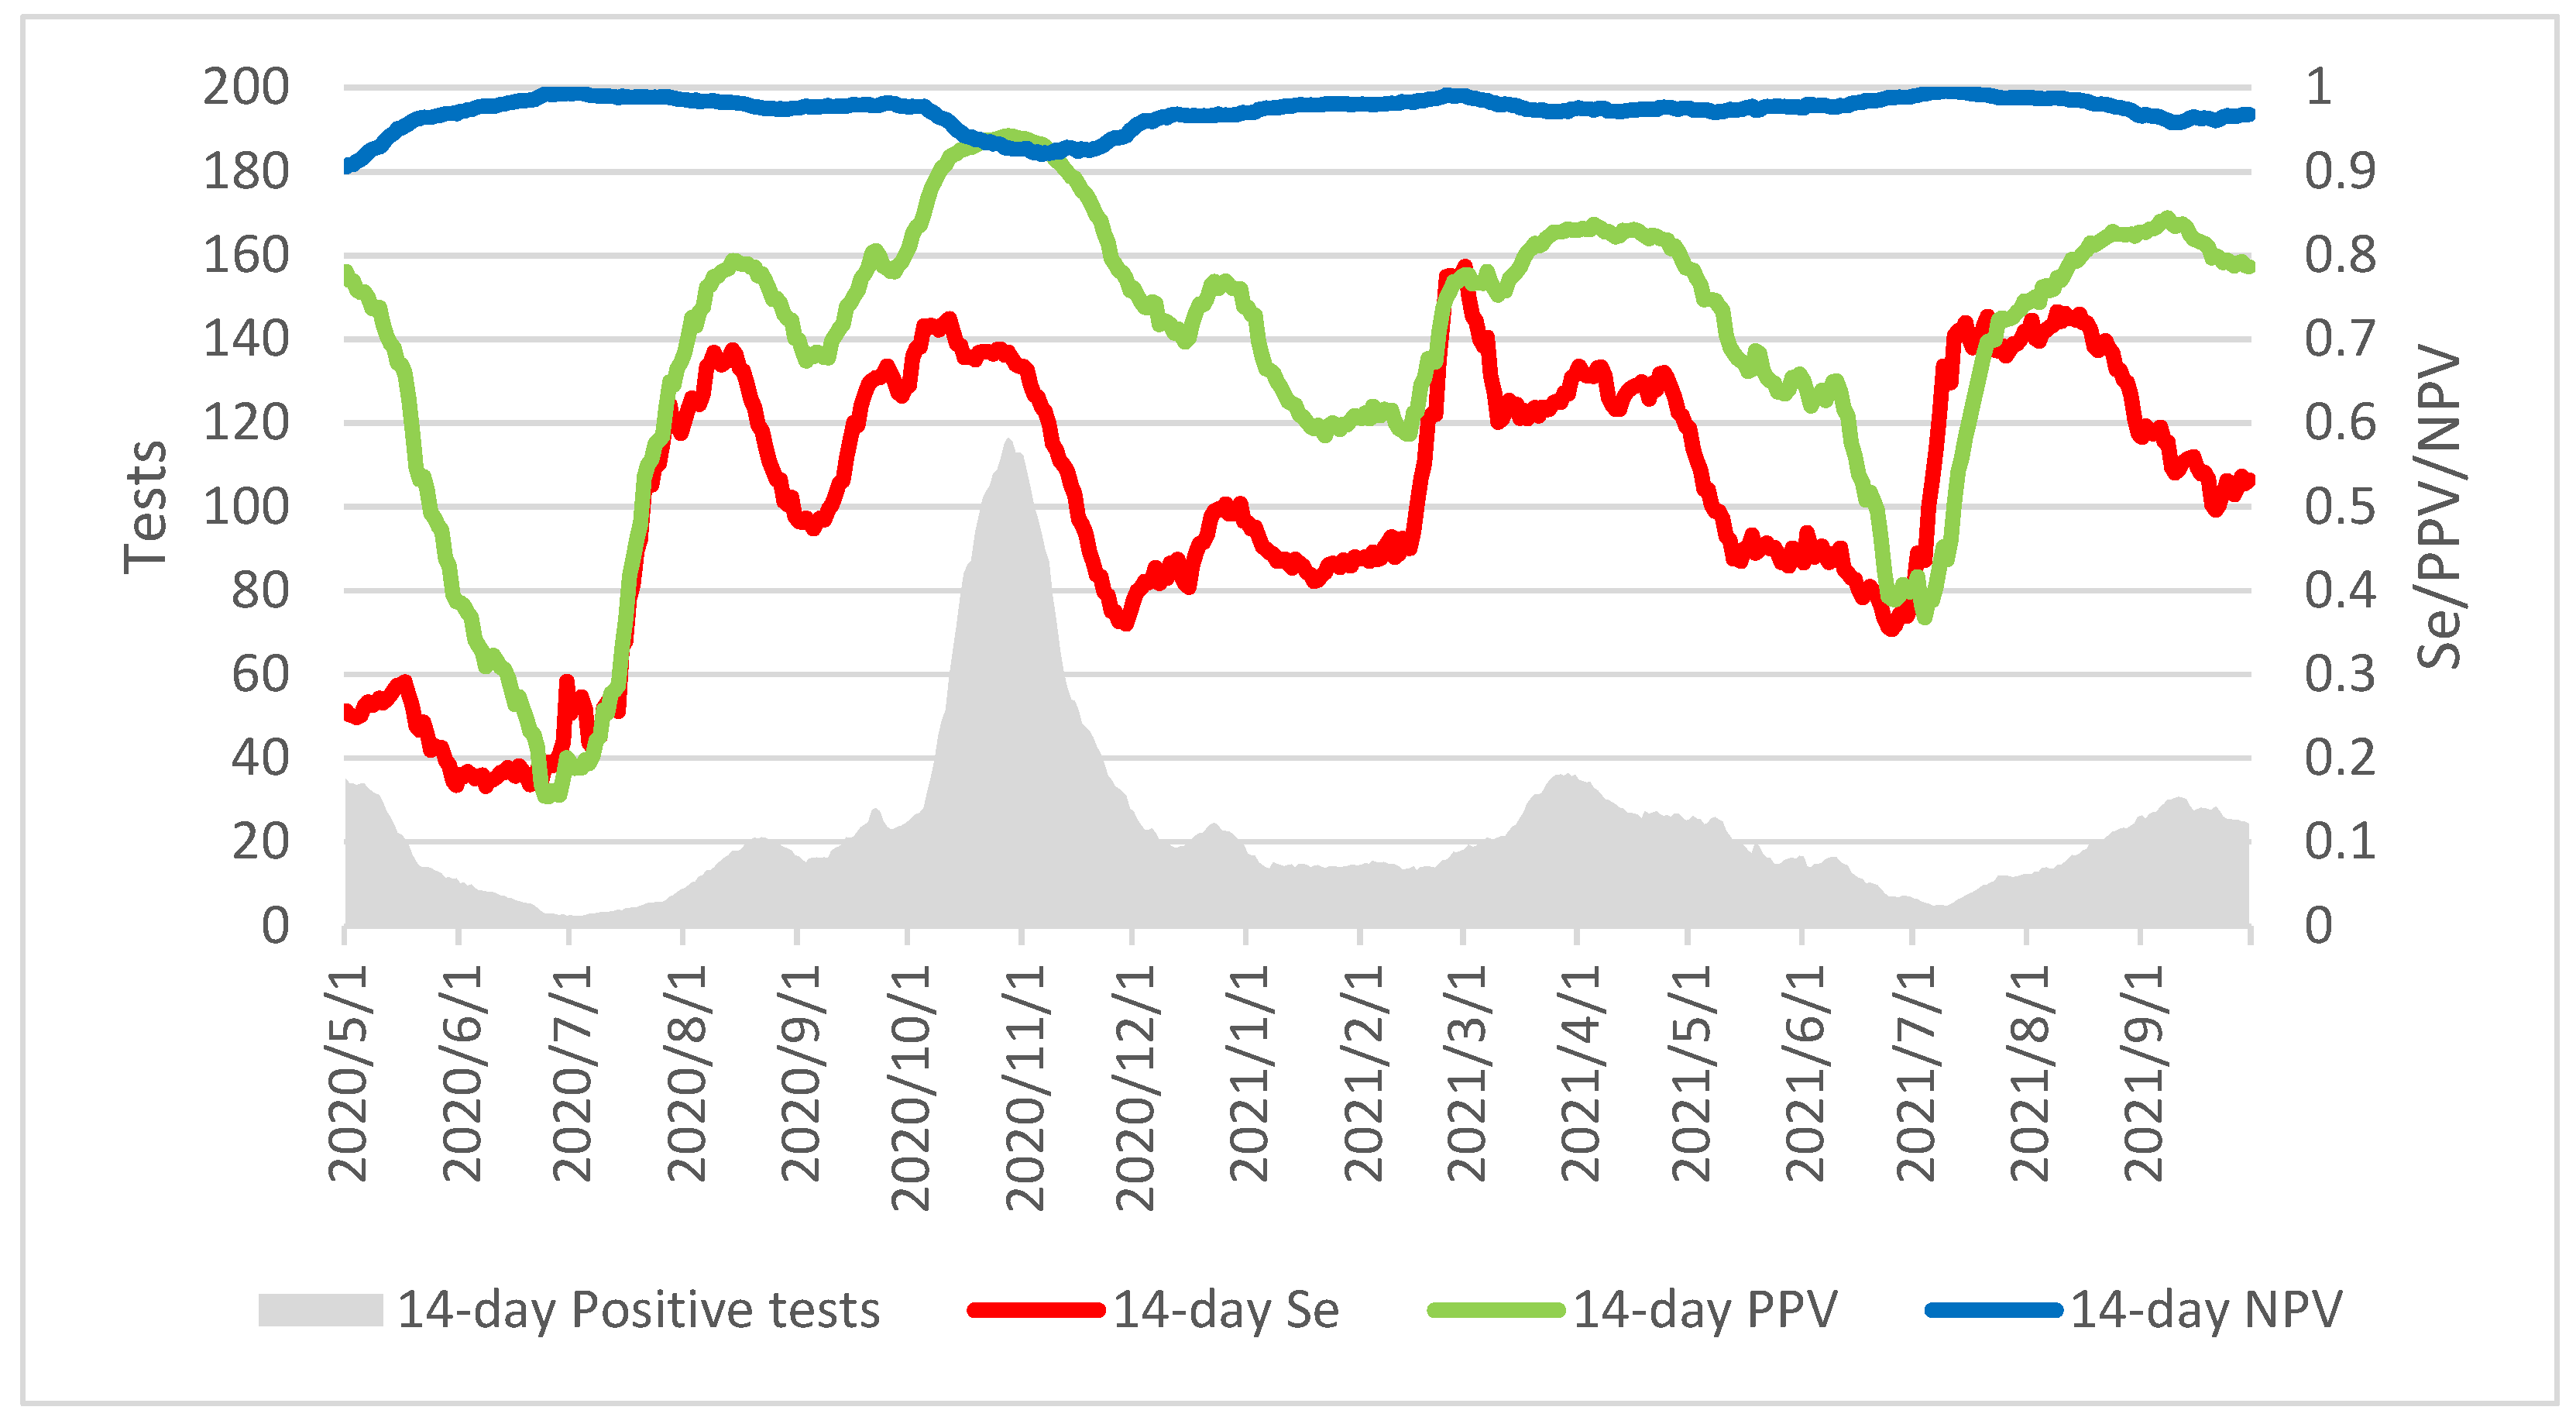
3.5. Modelling the Influence of Epidemic Trends on the Overall Performance of the Assay
4. Discussion
Supplementary Materials
Author Contributions
Funding
Institutional Review Board Statement
Informed Consent Statement
Data Availability Statement
Acknowledgments
Conflicts of Interest
References
- Williams, E.; Bond, K.; Zhang, B.; Putland, M.; Williamson, D.A. Saliva as a Noninvasive Specimen for Detection of SARS-CoV-2. J. Clin. Microbiol. 2020, 58, e00776-20. [Google Scholar] [CrossRef] [Green Version]
- Han, P.; Ivanovski, S. Saliva—Friend and Foe in the COVID-19 Outbreak. Diagnostics 2020, 10, 290. [Google Scholar] [CrossRef] [PubMed]
- World Health Organization. Antigen-Detection in the Diagnosis of SARS-CoV-2 Infection—Interim Guidance; World Health Organization: Geneva, Switzerland, 2021.
- European Centre for Disease Prevention and Control. Options for the Use of Rapid Antigen Tests for COVID-19 in the EU/EEA and the UK; European Centre for Disease Prevention and Control: Solna, Sweden, 2020.
- Hirotsu, Y.; Maejima, M.; Shibusawa, M.; Nagakubo, Y.; Hosaka, K.; Amemiya, K.; Sueki, H.; Hayakawa, M.; Mochizuki, H.; Tsutsui, T.; et al. Comparison of Automated SARS-CoV-2 Antigen Test for COVID-19 Infection with Quantitative RT-PCR Using 313 Nasopharyngeal Swabs, Including from Seven Serially Followed Patients. Int. J. Infect. Dis. 2020, 99, 397–402. [Google Scholar] [CrossRef] [PubMed]
- Yin, N.; Debuysschere, C.; Decroly, M.; Bouazza, F.-Z.; Collot, V.; Martin, C.; Ponthieux, F.; Dahma, H.; Gilbert, M.; Wautier, M.; et al. SARS-CoV-2 Diagnostic Tests: Algorithm and Field Evaluation From the Near Patient Testing to the Automated Diagnostic Platform. Front. Med. 2021, 8, 650581. [Google Scholar] [CrossRef] [PubMed]
- Yokota, I.; Shane, P.Y.; Okada, K.; Unoki, Y.; Yang, Y.; Iwasaki, S.; Fujisawa, S.; Nishida, M.; Teshima, T. A Novel Strategy for SARS-CoV-2 Mass Screening with Quantitative Antigen Testing of Saliva: A Diagnostic Accuracy Study. Lancet Microbe 2021, 2, e397–e404. [Google Scholar] [CrossRef]
- Basso, D.; Aita, A.; Padoan, A.; Cosma, C.; Navaglia, F.; Moz, S.; Contran, N.; Zambon, C.-F.; Maria Cattelan, A.; Plebani, M. Salivary SARS-CoV-2 Antigen Rapid Detection: A Prospective Cohort Study. Clin. Chim. Acta Int. J. Clin. Chem. 2021, 517, 54–59. [Google Scholar] [CrossRef] [PubMed]
- Burton, J.; Love, H.; Richards, K.; Burton, C.; Summers, S.; Pitman, J.; Easterbrook, L.; Davies, K.; Spencer, P.; Killip, M.; et al. The Effect of Heat-Treatment on SARS-CoV-2 Viability and Detection. J. Virol. Methods 2021, 290, 114087. [Google Scholar] [CrossRef] [PubMed]
- Risk Assessment Group RAG. Interpretation and Reporting of SARS-CoV-2 PCR Results; Risk Assessment Group RAG: Brussels, Belgium, 2020. [Google Scholar]
- Lefever, S.; Indevuyst, C.; Cuypers, L.; Dewaele, K.; Yin, N.; Cotton, F.; Padalko, E.; Oyaert, M.; Descy, J.; Cavalier, E.; et al. Comparison of the Quantitative DiaSorin Liaison Antigen Test to Reverse Transcription-PCR for the Diagnosis of COVID-19 in Symptomatic and Asymptomatic Outpatients. J. Clin. Microbiol. 2021, 59, e00374-21. [Google Scholar] [CrossRef] [PubMed]
- Favresse, J.; Gillot, C.; Oliveira, M.; Cadrobbi, J.; Elsen, M.; Eucher, C.; Laffineur, K.; Rosseels, C.; Van Eeckhoudt, S.; Nicolas, J.-B.; et al. Head-to-Head Comparison of Rapid and Automated Antigen Detection Tests for the Diagnosis of SARS-CoV-2 Infection. J. Clin. Med. 2021, 10, 265. [Google Scholar] [CrossRef]
- Amendola, A.; Sberna, G.; Lalle, E.; Colavita, F.; Castilletti, C.; Menchinelli, G.; Posteraro, B.; Sanguinetti, M.; Ippolito, G.; Bordi, L.; et al. Saliva Is a Valid Alternative to Nasopharyngeal Swab in Chemiluminescence-Based Assay for Detection of SARS-CoV-2 Antigen. J. Clin. Med. 2021, 10, 1471. [Google Scholar] [CrossRef]
- Centogene to Offer Fujirebio SARS-CoV-2 Antigen Test at German Airports. 360Dx. 2020. Available online: https://www.360dx.com/infectious-disease/centogene-offer-fujirebio-sars-cov-2-antigen-test-german-airports#.X99e_NJKhhE (accessed on 20 December 2020).
- Bordi, L.; Parisi, G.; Sberna, G.; Amendola, A.; Mariani, B.; Meoni, G.; Orazi, D.; Bartoletti, P.; Lombardozzi, L.; Barca, A.; et al. Effective Screening Strategy against SARS-CoV-2 on Self-Collected Saliva Samples in Primary School Setting: A Pilot Project. J. Infect. 2021, 83, e8–e10. [Google Scholar] [CrossRef]


| Semi-Quantification | Ct Values | Estimated Viral Load (RNA Copies/mL) |
|---|---|---|
| Weak | >29.9 | <103 |
| Mild | >23.3–29.9 | 103–<105 |
| Strong | >16.7–23.3 | 105–<107 |
| Very strong | ≤16.7 | ≥107 |
| Samples Collected | N | Ag (NPS) | Ag (Saliva) |
|---|---|---|---|
| Overall | 632 | 605 | 144 |
| Negative RT-PCR | 408 | 400 | 83 |
| Outpatients | 304 | 300 | 76 |
| Inpatients | 104 | 100 | 7 |
| Positive RT-PCR | 224 | 205 | 61 |
| ≤7 DSO | 116 | 102 | 35 |
| >7 DSO or unknown | 108 | 103 | 26 |
| Samples Collected | Ag (NPS, T = 2.47 pg/mL) | Ag (Saliva, T = 0.60 pg/mL) | ||
|---|---|---|---|---|
| N | % (Wilson 95% CI) | N | % (Wilson 95% CI) | |
| Sensitivity (DSO ≤ 7) | 95/102 | 93.1 (86.5–96.6) | 25/35 | 71.4 (54.9–83.7) |
| Specificity (overall) | 396/400 | 99.0 (97.5–99.6) | 82/83 | 98.8 (93.5–99.8) |
| Outpatients | 298/300 | 99.3 (97.6–99.8) | 75/76 | 98.7 (92.9–99.8) |
| Inpatients | 98/100 | 98.0 (93.0–99.4) | 7/7 | 100 (64.6–100) |
| Estimated Viral Load (RNA Copies/mL) | Ag (NPS, T = 2.47 pg/mL) | Ag (Saliva, T = 0.60 pg/mL) | ||
|---|---|---|---|---|
| N | % (Wilson 95% CI) | N | % (Wilson 95% CI) | |
| <103 (Ct > 29.9) | 4/38 | 10.5 (4.2–24.1) | 5/8 | 62.5 (30.6–86.3) |
| ≥103 (Ct ≤ 29.9) | 141/167 | 96.4 (92.4–98.3) | 32/46 | 69.6 (55.2–80.9) |
| 103–<105 (Ct > 23.3–29.9) | 36/41 | 87.8 (74.5–94.7) | 8/19 | 42.1 (23.1–63.7) |
| 105–<107 (Ct > 16.7–23.3) | 70/71 | 98.6 (92.4–99.8) | 12/15 | 80.0 (54.8–93.0) |
| ≥107 (Ct ≤ 16.7) | 55/55 | 100 (93.5–100) | 12/12 | 100 (75.8–100) |
Publisher’s Note: MDPI stays neutral with regard to jurisdictional claims in published maps and institutional affiliations. |
© 2022 by the authors. Licensee MDPI, Basel, Switzerland. This article is an open access article distributed under the terms and conditions of the Creative Commons Attribution (CC BY) license (https://creativecommons.org/licenses/by/4.0/).
Share and Cite
Yin, N.; Debuysschere, C.; Daubie, V.; Hildebrand, M.; Martin, C.; Curac, S.; Ponthieux, F.; Payen, M.-C.; Vandenberg, O.; Hallin, M. Evaluation and Modelling of the Performance of an Automated SARS-CoV-2 Antigen Assay According to Sample Type, Target Population and Epidemic Trends. Diagnostics 2022, 12, 447. https://doi.org/10.3390/diagnostics12020447
Yin N, Debuysschere C, Daubie V, Hildebrand M, Martin C, Curac S, Ponthieux F, Payen M-C, Vandenberg O, Hallin M. Evaluation and Modelling of the Performance of an Automated SARS-CoV-2 Antigen Assay According to Sample Type, Target Population and Epidemic Trends. Diagnostics. 2022; 12(2):447. https://doi.org/10.3390/diagnostics12020447
Chicago/Turabian StyleYin, Nicolas, Cyril Debuysschere, Valery Daubie, Marc Hildebrand, Charlotte Martin, Sonja Curac, Fanny Ponthieux, Marie-Christine Payen, Olivier Vandenberg, and Marie Hallin. 2022. "Evaluation and Modelling of the Performance of an Automated SARS-CoV-2 Antigen Assay According to Sample Type, Target Population and Epidemic Trends" Diagnostics 12, no. 2: 447. https://doi.org/10.3390/diagnostics12020447