
Diffusion Tensor and Dynamic Contrast-Enhanced Magnetic Resonance Imaging Correlate with Molecular Markers of Inflammation in the Synovium

 ,
,
Abstract
:1. Introduction
2. Materials and Methods
2.1. Patients
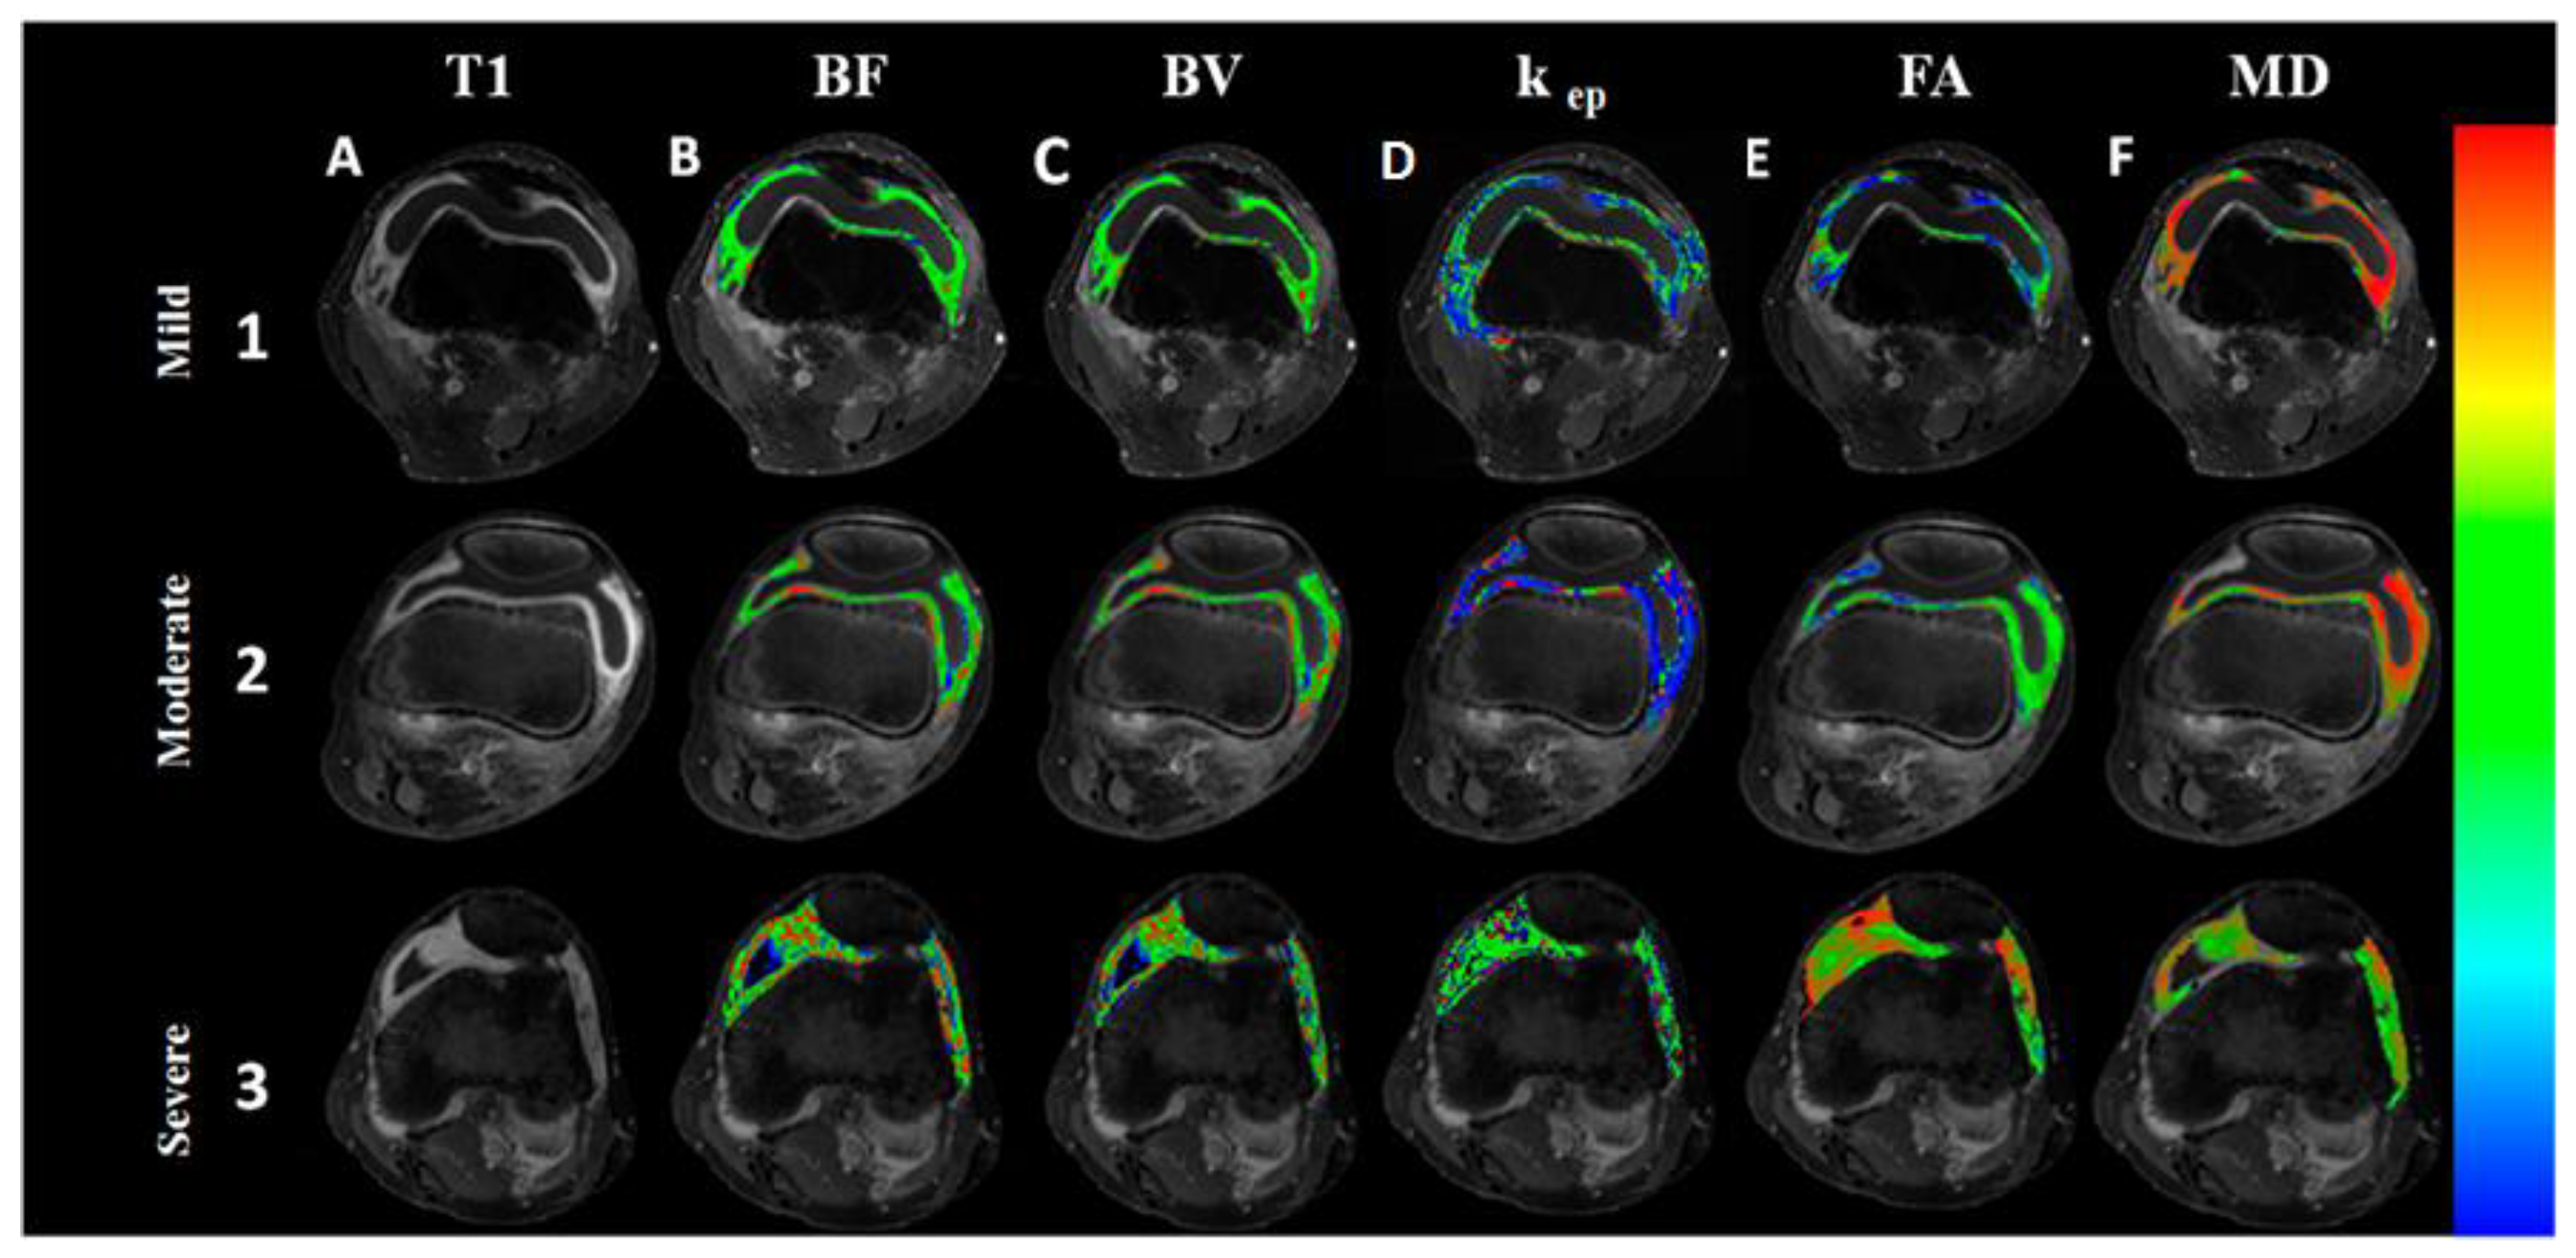
2.2. Magnetic Resonance Imaging
2.3. Data Quantification
2.4. Arthroscopic Biopsy and Histopathology
2.5. Histopathology and Synovitis Severity Grading
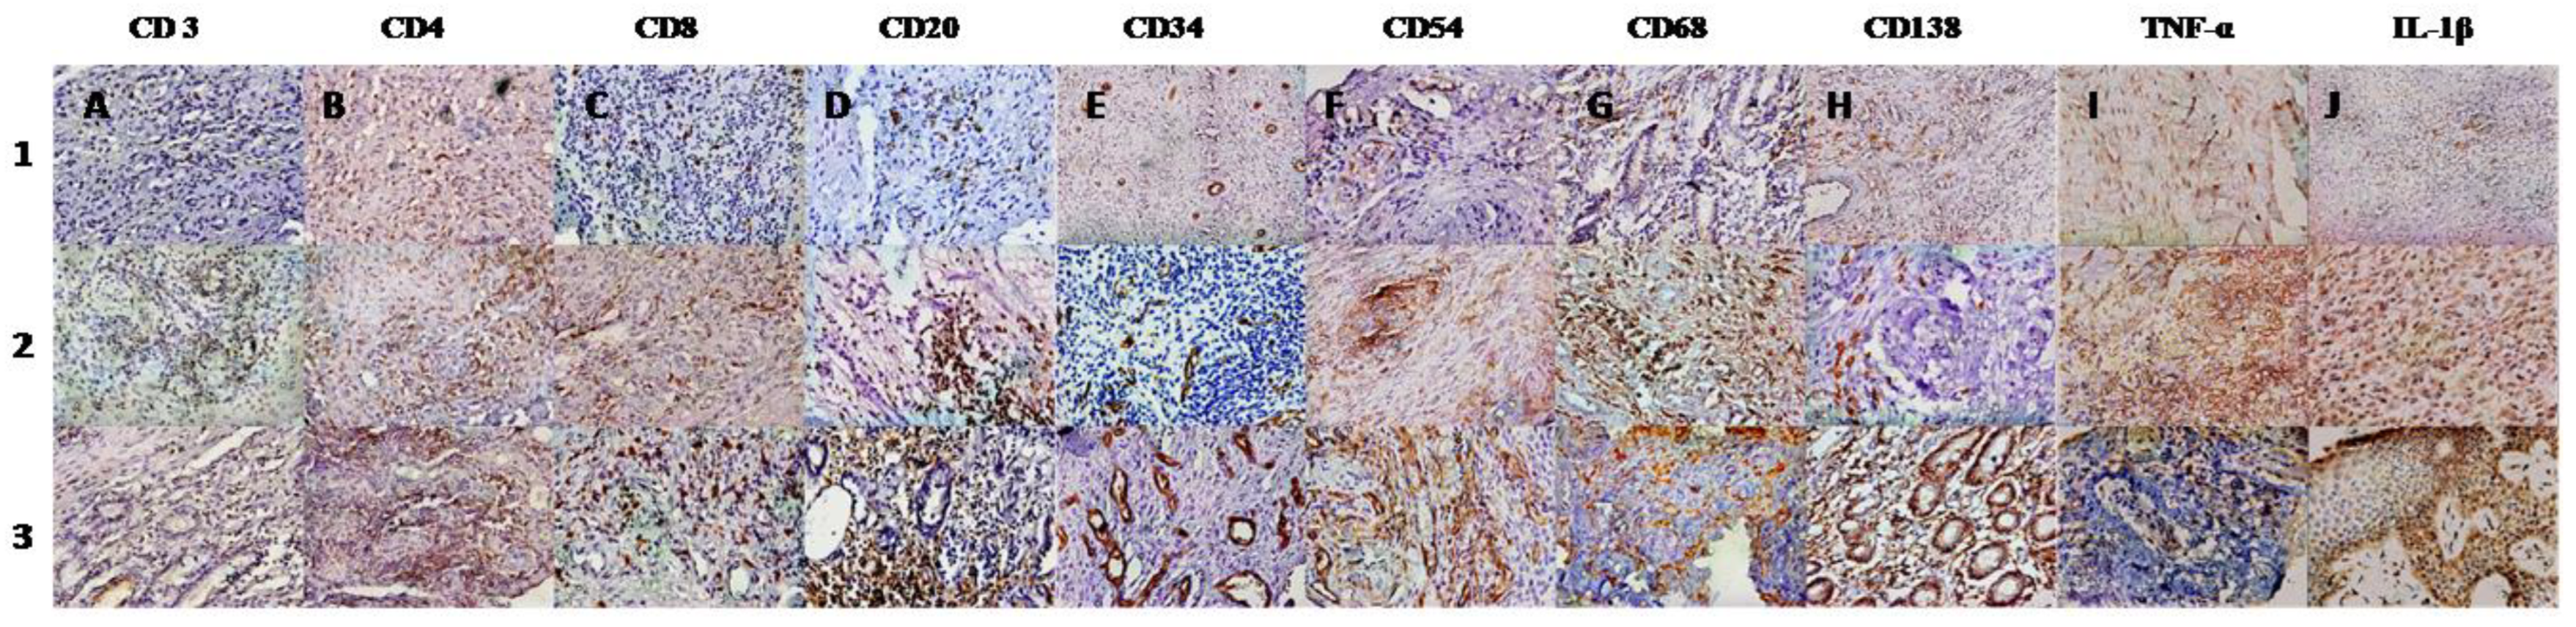
2.6. Immunohistochemistry and Microscopic Analysis
2.7. Quantitation of Inflammatory Cytokines from Synovial Fluid
2.8. Statistical Analysis
2.9. Sample Size Estimation
3. Results
4. Predicting the Values of IHC Parameters in the Synovium of Arthritis Patients Using Various DTI and DCE Metrics
5. Discussion
Supplementary Materials
Author Contributions
Funding
Institutional Review Board Statement
Informed Consent Statement
Data Availability Statement
Acknowledgments
Conflicts of Interest
References
- Tarner, I.H.; Härle, P.; Müller-Ladner, U.; Gay, R.E.; Gay, S. The different stages of synovitis: Acute vs chronic, early vs. late and non-erosive vs erosive. Best Pr. Res. Clin. Rheumatol. 2005, 19, 19–35. [Google Scholar] [CrossRef] [PubMed]
- Melchiorri, C.; Meliconi, R.; Frizziero, L.; Silvestri, T.; Pulsatelli, L.; Mazzetti, I.; Borzì, R.M.; Uguccioni, M.; Facchini, A. Enhanced and coordinated in vivo expression of inflammatory cytokines and nitric oxide synthase by chondrocytes from patients with osteoarthritis. Arthritis Rheum. 1998, 41, 2165–2174. [Google Scholar] [CrossRef] [PubMed]
- Kirkham, B.W.; Lassere, M.N.; Edmonds, J.P.; Juhasz, K.M.; Bird, P.A.; Lee, C.S.; Shnier, R.; Portek, I.J. Synovial membrane cytokine expression is predictive of joint damage progression in rheumatoid arthritis: A two-year prospective study (the DAMAGE study cohort). Arthritis Rheum. 2006, 54, 1122–1131. [Google Scholar] [CrossRef] [PubMed]
- Hodgson, R.J.; O’Connor, P.; Moots, R. MRI of rheumatoid arthritis image quantitation for the assessment of disease activity, progression and response to therapy. Rheumatology 2008, 47, 13–21. [Google Scholar] [CrossRef] [PubMed] [Green Version]
- Grassi, W.; Cervini, C. Ultrasonography in rheumatology: An evolving technique. Ann. Rheum. Dis. 1998, 57, 268–271. [Google Scholar] [CrossRef] [PubMed]
- Navalho, M.; Resende, C.; Rodrigues, A.M.; Gaspar, A.; Fonseca, J.E.; Canhão, H.; Campos, J. Dynamic contrast-enhanced 3-T magnetic resonance imaging: A method for quantifying disease activity in early polyarthritis. Skelet. Radiol. 2012, 41, 51–59. [Google Scholar] [CrossRef] [PubMed]
- Krasnokutsky, S.; Belitskaya-Lévy, I.; Bencardino, J.; Samuels, J.; Attur, M.; Regatte, R.; Rosenthal, P.; Greenberg, J.; Schweitzer, M.; Abramson, S.B.; et al. Quantitative magnetic resonance imaging evidence of synovial proliferation is associated with radiographic severity of knee osteoarthritis. Arthritis Rheum. 2011, 63, 2983–2991. [Google Scholar] [CrossRef] [Green Version]
- Taouli, B.; Zaim, S.; Peterfy, C.G.; Lynch, J.A.; Stork, A.; Guermazi, A.; Fan, B.; Fye, K.H.; Genant, H.K. Rheumatoid arthritis of the hand and wrist: Comparison of three imaging techniques. AJR Am. J. Roentgenol. 2004, 182, 937–943. [Google Scholar] [CrossRef]
- Farrant, J.M.; O’Connor, P.J.; Grainger, A.J. Advanced imaging in rheumatoid arthritis. Part 1: Synovitis. Skelet. Radiol. 2007, 36, 269–279. [Google Scholar] [CrossRef]
- Narváez, J.A.; Narváez, J.; De Lama, E.; De Albert, M. MR imaging of early rheumatoid arthritis. Radiogr. Rev. Publ. Radiol. Soc. N. Am. Inc. 2010, 30, 143–163; discussion 163–165. [Google Scholar] [CrossRef]
- Frick, M.A.; Wenger, D.E.; Adkins, M. MR imaging of synovial disorders of the knee: An update. Radiol. Clin. N. Am. 2007, 45, 1017–1031. [Google Scholar] [CrossRef] [PubMed]
- Ostergaard, M.; Stoltenberg, M.; Løvgreen-Nielsen, P.; Volck, B.; Jensen, C.H.; Lorenzen, I. Magnetic resonance imaging-determined synovial membrane and joint effusion volumes in rheumatoid arthritis and osteoarthritis: Comparison with the macroscopic and microscopic appearance of the synovium. Arthritis Rheum. 1997, 40, 1856–1867. [Google Scholar] [CrossRef] [PubMed]
- Emery, P.; van der Heijde, D.; Ostergaard, M.; Conaghan, P.G.; Genovese, M.C.; Keystone, E.C.; Fleischmann, R.; Hsia, E.C.; Xu, W.; Xu, S.; et al. Exploratory analyses of the association of MRI with clinical, laboratory and radiographic findings in patients with rheumatoid arthritis. Ann. Rheum. Dis. 2011, 70, 2126–2130. [Google Scholar] [CrossRef] [PubMed]
- Axelsen, M.B.; Stoltenberg, M.; Poggenborg, R.P.; Kubassova, O.; Boesen, M.; Bliddal, H.; Hørslev-Petersen, K.; Hanson, L.G.; Østergaard, M. Dynamic gadolinium-enhanced magnetic resonance imaging allows accurate assessment of the synovial inflammatory activity in rheumatoid arthritis knee joints: A comparison with synovial histology. Scand. J. Rheumatol. 2012, 41, 89–94. [Google Scholar] [CrossRef]
- Basser, P.J.; Jones, D.K. Diffusion-tensor MRI: Theory, experimental design and data analysis—A technical review. NMR Biomed. 2002, 15, 456–467. [Google Scholar] [CrossRef] [Green Version]
- Beaulieu, C. The basis of anisotropic water diffusion in the nervous system-a technical review. NMR Biomed. 2002, 15, 435–455. [Google Scholar] [CrossRef]
- Gupta, R.K.; Nath, K.; Prasad, A.; Prasad, K.N.; Husain, M.; Rathore, R.K.S.; Husain, N.; Srivastava, C.; Khetan, P.; Trivedi, R.; et al. In vivo demonstration of neuroinflammatory molecule expression in brain abscess with diffusion tensor imaging. AJNR Am. J. Neuroradiol. 2008, 29, 326–332. [Google Scholar] [CrossRef] [Green Version]
- Agarwal, V.; Kumar, M.; Singh, J.K.; Rathore, R.K.S.; Misra, R.; Gupta, R.K. Diffusion tensor anisotropy magnetic resonance imaging: A new tool to assess synovial inflammation. Rheumatology 2009, 48, 378–382. [Google Scholar] [CrossRef] [Green Version]
- Chen, J.; Liu, W.; Zhang, H.; Lacy, L.; Yang, X.; Song, S.-K.; Wickline, S.A.; Yu, X. Regional ventricular wall thickening reflects changes in cardiac fiber and sheet structure during contraction: Quantification with diffusion tensor MRI. Am. J. Physiol. Heart Circ. Physiol. 2005, 289, H1898–H1907. [Google Scholar] [CrossRef]
- Hsu, E.W.; Setton, L.A. Diffusion tensor microscopy of the intervertebral disc anulus fibrosus. Magn. Reason. Med. 1999, 41, 992–999. [Google Scholar] [CrossRef]
- Ostergaard, M.; Stoltenberg, M.; Løvgreen-Nielsen, P.; Volck, B.; Sonne-Holm, S.; Lorenzen, I. Quantification of synovistis by MRI: Correlation between dynamic and static gadolinium-enhanced magnetic resonance imaging and microscopic and macroscopic signs of synovial inflammation. Magn. Reson. Imaging 1998, 16, 743–754. [Google Scholar] [CrossRef] [PubMed]
- Workie, D.W.; Dardzinski, B.J.; Graham, T.B.; Laor, T.; Bommer, W.A.; O’Brien, K.J. Quantification of dynamic contrast-enhanced MR imaging of the knee in children with juvenile rheumatoid arthritis based on pharmacokinetic modeling. Magn. Reson. Imaging 2004, 22, 1201–1210. [Google Scholar] [CrossRef] [PubMed]
- Hodgson, R.J.; Barnes, T.; Connolly, S.; Eyes, B.; Campbell, R.S.D.; Moots, R. Changes underlying the dynamic contrast-enhanced MRI response to treatment in rheumatoid arthritis. Skelet. Radiol. 2008, 37, 201–207. [Google Scholar] [CrossRef] [PubMed]
- Van der Leij, C.; van de Sande, M.G.H.; Lavini, C.; Tak, P.P.; Maas, M. Rheumatoid synovial inflammation: Pixel-by-pixel dynamic contrast-enhanced MR imaging time-intensity curve shape analysis—A feasibility study. Radiology 2009, 253, 234–240. [Google Scholar] [CrossRef] [PubMed] [Green Version]
- Singh, A.; Rathore, R.K.S.; Haris, M.; Verma, S.K.; Husain, N.; Gupta, R.K. Improved bolus arrival time and arterial input function estimation for tracer kinetic analysis in DCE-MRI. J. Magn. Reson. Imaging JMRI 2009, 29, 166–176. [Google Scholar] [CrossRef]
- Bezdek, J.C.; Hall, L.O.; Clarke, L.P. Review of MR image segmentation techniques using pattern recognition. Med. Phys. 1993, 20, 1033–1048. [Google Scholar] [CrossRef]
- Rooney, M.; Condell, D.; Quinlan, W.; Daly, L.; Whelan, A.; Feighery, C.; Feighery, C.; Bresnihan, B. Analysis of the histologic variation of synovitis in rheumatoid arthritis. Arthritis Rheum. 1988, 31, 956–963. [Google Scholar] [CrossRef]
- Bugatti, S.; Manzo, A.; Vitolo, B.; Benaglio, F.; Binda, E.; Scarabelli, M.; Humby, F.; Caporali, R.; Pitzalis, C.; Montecucco, C. High expression levels of the B cell chemoattractant CXCL13 in rheumatoid synovium are a marker of severe disease. Rheumatology 2014, 53, 1886–1895. [Google Scholar] [CrossRef] [Green Version]
- Page, G.; Lebecque, S.; Miossec, P. Anatomic localization of immature and mature dendritic cells in an ectopic lymphoid organ: Correlation with selective chemokine expression in rheumatoid synovium. J. Immunol. 2002, 168, 5333–5341. [Google Scholar] [CrossRef] [Green Version]
- Hasan, K.M.; Alexander, A.L.; Narayana, P.A. Does fractional anisotropy have better noise immunity characteristics than relative anisotropy in diffusion tensor MRI? An analytical approach. Magn. Reson. Med. 2004, 51, 413–417. [Google Scholar] [CrossRef]
- Pfefferbaum, A.; Sullivan, E.V. Disruption of brain white matter microstructure by excessive intracellular and extracellular fluid in alcoholism: Evidence from diffusion tensor imaging. Neuropsychopharmacology 2005, 30, 423–432. [Google Scholar] [CrossRef] [PubMed]
- Wang, S.; Kim, S.; Chawla, S.; Wolf, R.L.; Zhang, W.-G.; O’Rourke, D.M.; Judy, K.D.; Melhem, E.R.; Poptani, H. Differentiation between glioblastomas and solitary brain metastases using diffusion tensor imaging. NeuroImage 2009, 44, 653–660. [Google Scholar] [CrossRef] [PubMed] [Green Version]
- Gupta, R.K.; Srivastava, S.; Saksena, S.; Rathore, R.K.S.; Awasthi, R.; Prasad, K.N.; Husain, M.; Pandey, C.M.; Husain, N. Correlation of DTI metrics in the wall and cavity of brain abscess with histology and immunohistochemistry. NMR Biomed. 2010, 23, 262–269. [Google Scholar] [CrossRef] [PubMed]
- Leddy, H.A.; Haider, M.A.; Guilak, F. Diffusional anisotropy in collagenous tissues: Fluorescence imaging of continuous point photobleaching. Biophys. J. 2006, 91, 311–316. [Google Scholar] [CrossRef] [PubMed] [Green Version]
- Kumar, M.; Gupta, R.K.; Nath, K.; Rathore, R.K.S.; Bayu, G.; Trivedi, R.; Husain, M.; Prasad, K.N.; Tripathi, R.P.; Narayana, A.P. Can we differentiate true white matter fibers from pseudofibers inside a brain abscess cavity using geometrical diffusion tensor imaging metrics? NMR Biomed. 2008, 21, 581–588. [Google Scholar] [CrossRef]
- Wenham, C.Y.J.; Conaghan, P.G. The Role of Synovitis in Osteoarthritis. Ther. Adv. Musculoskelet. Dis. 2010, 2, 349–359. [Google Scholar] [CrossRef] [Green Version]
- Kruithof, E.; Van den Bossche, V.; De Rycke, L.; Vandooren, B.; Joos, R.; Cañete, J.D.; Tak, P.P.; Boots, A.M.H.; Veys, E.M.; Baeten, D. Distinct synovial immunopathologic characteristics of juvenile-onset spondylarthritis and other forms of juvenile idiopathic arthritis. Arthritis Rheum. 2006, 54, 2594–2604. [Google Scholar] [CrossRef]
- Gibson, F.C.; Onderdonk, A.B.; Kasper, D.L.; Tzianabos, A.O. Cellular mechanism of intraabdominal abscess formation by Bacteroides fragilis. J. Immunol. 1998, 160, 5000–5006. [Google Scholar]
- Moese, S.; Selbach, M.; Meyer, T.F.; Backert, S. cag+ Helicobacter pylori induces homotypic aggregation of macrophage-like cells by up-regulation and recruitment of intracellular adhesion molecule 1 to the cell surface. Infect. Immun. 2002, 70, 4687–4691. [Google Scholar] [CrossRef] [Green Version]
- Kielian, T.; Hickey, W.F. Proinflammatory cytokine, chemokine, and cellular adhesion molecule expression during the acute phase of experimental brain abscess development. Am. J. Pathol. 2000, 157, 647–658. [Google Scholar] [CrossRef]


| Total Arthritis Patients (n = 80) | Different Groups of Arthritis Patients | ||||||
|---|---|---|---|---|---|---|---|
| RA (n = 6) | Infective Arthritis (n = 19) | USpA (n = 14) | UCMA (n = 31) | OA (n = 4) | Others (n = 6) | ||
| Age (Mean ± SD) | 39.78 ± 12.33 | 41.67 ± 6.77 | 39.16 ± 15.18 | 38.43 ± 13.11 | 41.52 ± 11.50 | 48.25 ± 4.85 | 38.33 ± 5.35 |
| M/F | 52/28 | 2/4 | 14/5 | 11/3 | 18/13 | 3/1 | 4/2 |
| Disease Duration (Mean ± SD) | 19.82 ± 14.22 | 17.66 ± 7.63 | 15.36 ± 10.50 | 20.85 ± 18.12 | 23.67 ± 16.46 | 15 ± 3.46 | 17.00 ± 7.01 |
| ESR (mm/h) (Mean ± SD) | 65.78 ± 30.98 | 36.50 ± 26.16 | 52.00 ± 25.07 | 62.20 ± 19.97 | 80.34 ± 29.84 | 32.00 ± 14.14 | 97.33 ± 17.21 |
| CRP (mg/dl) (Mean ± SD)/Median | 3.52 ± 6.86 (0.32–32.70) | 4.85 ± 5.43 /(1.01–8.70) | 1.56 ± 1.48 /(0.23–4.95) | 6.00 ± 10.95 /(0.32–34.50) | 2.57 ± 4.05 /(0.32–12.40) | 0.96 ± 0.63 /(0.41–1.61) | 1.60 ± 1.31 /(0.67–2.53) |
| Severity of Synovitis (Rooney Synovitis Score) | Knees (N) |
|---|---|
| Mild (0.0–1.5) | 16 |
| Moderate (1.6–3.0) | 27 |
| Severe (3.0–5.0) | 37 |
| DTI Indices (Mean ± SD) | Arthritis Patients (n = 80) | Different Groups of Arthritis Patients | |||||
|---|---|---|---|---|---|---|---|
| RA (n = 6) | Infective Arthritis (n = 19) | USpA (n = 14) | UCMA (n = 31) | OA (n = 4) | Others (n = 6) | ||
| FA | 0.22 ± 0.03 | 0.21 ± 0.02 | 0.25 ± 0.02 | 0.21 ± 0.02 | 0.21 ± 0.01 | 0.18 ± 0.01 | 0.22 ± 0.01 |
| MD (10−3 mm2s−1) | 1.62 ± 0.50 | 1.80 ± 0.28 | 1.28 ± 0.42 | 1.65 ± 0.66 | 1.78 ± 0.43 | 1.56 ± 0.25 | 1.88 ± 0.44 |
| CL | 0.05 ± 0.02 | 0.04 ± 0.01 | 0.08 ± 0.02 | 0.04 ± 0.01 | 0.05 ± 0.02 | 0.07 ± 0.02 | 0.05 ± 0.03 |
| CP | 0.14 ± 0.05 | 0.15 ± 0.06 | 0.16 ± 0.03 | 0.14 ± 0.05 | 0.14 ± 0.05 | 0.09 ± 0.06 | 0.16 ± 0.05 |
| CS | 0.5 ± 0.02 | 0.74 ± 0.01 | 0.73 ± 0.02 | 0.75 ± 0.01 | 0.75 ± 0.02 | 0.76 ± 0.01 | 0.75 ± 0.02 |
| DCE indices | |||||||
| BF (mL/100 gm/min) | 109.91 ± 42.83 | 78.90 ± 42.66 | 150.46 ± 35.42 | 106.97 ± 39.95 | 92.38 ± 26.95 | 72.99 ± 10.15 | 125.22 ± 49.16 |
| BV (mL/100 gm) | 9.54 ± 4.20 | 8.28 ± 3.36 | 12.50 ± 4.77 | 9.32 ± 4.15 | 8.24 ± 2.88 | 6.45 ± 2.65 | 9.85 ± 5.16 |
| kep (min−1) | 2.49 ± 1.00 | 2.27 ± 0.24 | 3.74 ± 0.83 | 2.27 ± 0.97 | 1.91 ± 0.50 | 1.94 ± 0.64 | 2.12 ± 0.42 |
| PCI | 1820.44 ± 211.64 | 1875.5 ± 153.3 | 1852.78 ± 183.33 | 1713.42 ± 240.11 | 1874.22 ± 211.84 | 1801.87 ± 245.50 | 1750 ± 213.81 |
| Immune cells in synovium (mean no. of cells/hpf) | |||||||
| CD3 | 154.93 ± 48.65 | 154.66 ± 38.38 | 210.75 ± 34.15 | 135.14 ± 41.87 | 142.25 ± 32.78 | 82.25 ± 14.88 | 141.00 ± 22.90 |
| CD4 | 63.41 ± 32.85 | 60.83 ± 23.70 | 104.31 ± 28.34 | 48.14 ± 24.56 | 52.65 ± 18.20 | 28.00 ± 7.16 | 49.80 ± 20.11 |
| CD8 | 53.58 ± 17.62 | 48.50 ± 17.81 | 77.31 ± 11.86 | 44.07 ± 12.90 | 47.15 ± 7.42 | 35.50 ± 5.44 | 50.60 ± 8.32 |
| CD20 | 39.33 ± 13.96 | 40.00 ± 15.12 | 44.56 ± 16.58 | 35.78 ± 13.90 | 39.45 ± 12.27 | 26.75 ± 12.84 | 41.40 ± 4.09 |
| CD34 | 52.93 ± 17.27 | 40.33 ± 16.00 | 64.50 ± 17.18 | 49.28 ± 18.75 | 48.90 ± 14.05 | 50.25 ± 11.08 | 59.60 ± 14.55 |
| CD54 | 36.35 ± 13.14 | 37.33 ± 16.05 | 44.62 ± 7.14 | 34.50 ± 10.63 | 30.90 ± 11.32 | 26.25 ± 12.81 | 43.80 ± 23.27 |
| CD68 | 163.20 ± 34.61 | 158.33 ± 10.93 | 197.62 ± 25.60 | 158.21 ± 37.74 | 153.25 ± 23.43 | 111.50 ± 27.04 | 154.00 ± 25.34 |
| CD138 | 36.06 ± 14.49 | 34.00 ± 11.61 | 43.43 ± 15.82 | 31.78 ± 14.78 | 39.60 ± 12.26 | 24.25 ± 10.65 | 22.20 ± 3.49 |
| Total Cells | 489.66 ± 106.38 | 464.66 ± 67.57 | 629.50 ± 56.20 | 446.14 ± 82.31 | 456.35 ± 55.83 | 321.25 ± 44.67 | 462.00 ± 67.53 |
| IL-1β | 31.09 ± 18.14 | 19.16 ± 7.02 | 51.62 ± 15.90 | 20.85 ± 9.23 | 30.40 ± 16.22 | 16.75 ± 5.56 | 22.60 ± 12.09 |
| TNF-α | 24.70 ± 11.51 | 15.00 ± 3.79 | 31.99 ± 9.40 | 17.92 ± 9.06 | 28.55 ± 12.56 | 17.50 ± 5.25 | 22.40 ± 9.44 |
| Cytokines in the Synovial fluid (pg/mL) | |||||||
| IL-6 | 9788.30 ± 474.44 | 8200.00 ± 373.01 | 10,763.75 ± 339.54 | 11,551.42 ± 485.83 | 9323.00 ± 593.67 | 8163.73 ± 510.23 | 6928.00 ± 398.16 |
| IL-1β | 25.46 ± 22.56 | 24.60 ± 18.80 | 37.77 ± 26.16 | 24.33 ± 2.34 | 17.18 ± 13.05 | 18.10 ± 4.65 | 29.30 ± 7.53 |
| TNF-α | 88.49 ± 57.25 | 46.29 ± 34.23 | 110.91 ± 59.55 | 126.10 ± 49.80 | 57.12 ± 36.10 | 74.56 ± 52.50 | 96.26 ± 79.43 |
| DTI-MRI Indices | Infiltrated Immune Cells in Synovium | ||||||||||
|---|---|---|---|---|---|---|---|---|---|---|---|
| CD3 | CD 4 | CD 8 | CD 20 | CD 34 | CD 68 | CD 138 | CD 54 | TNF-α | IL-1β | Total Inflammatory Cells | |
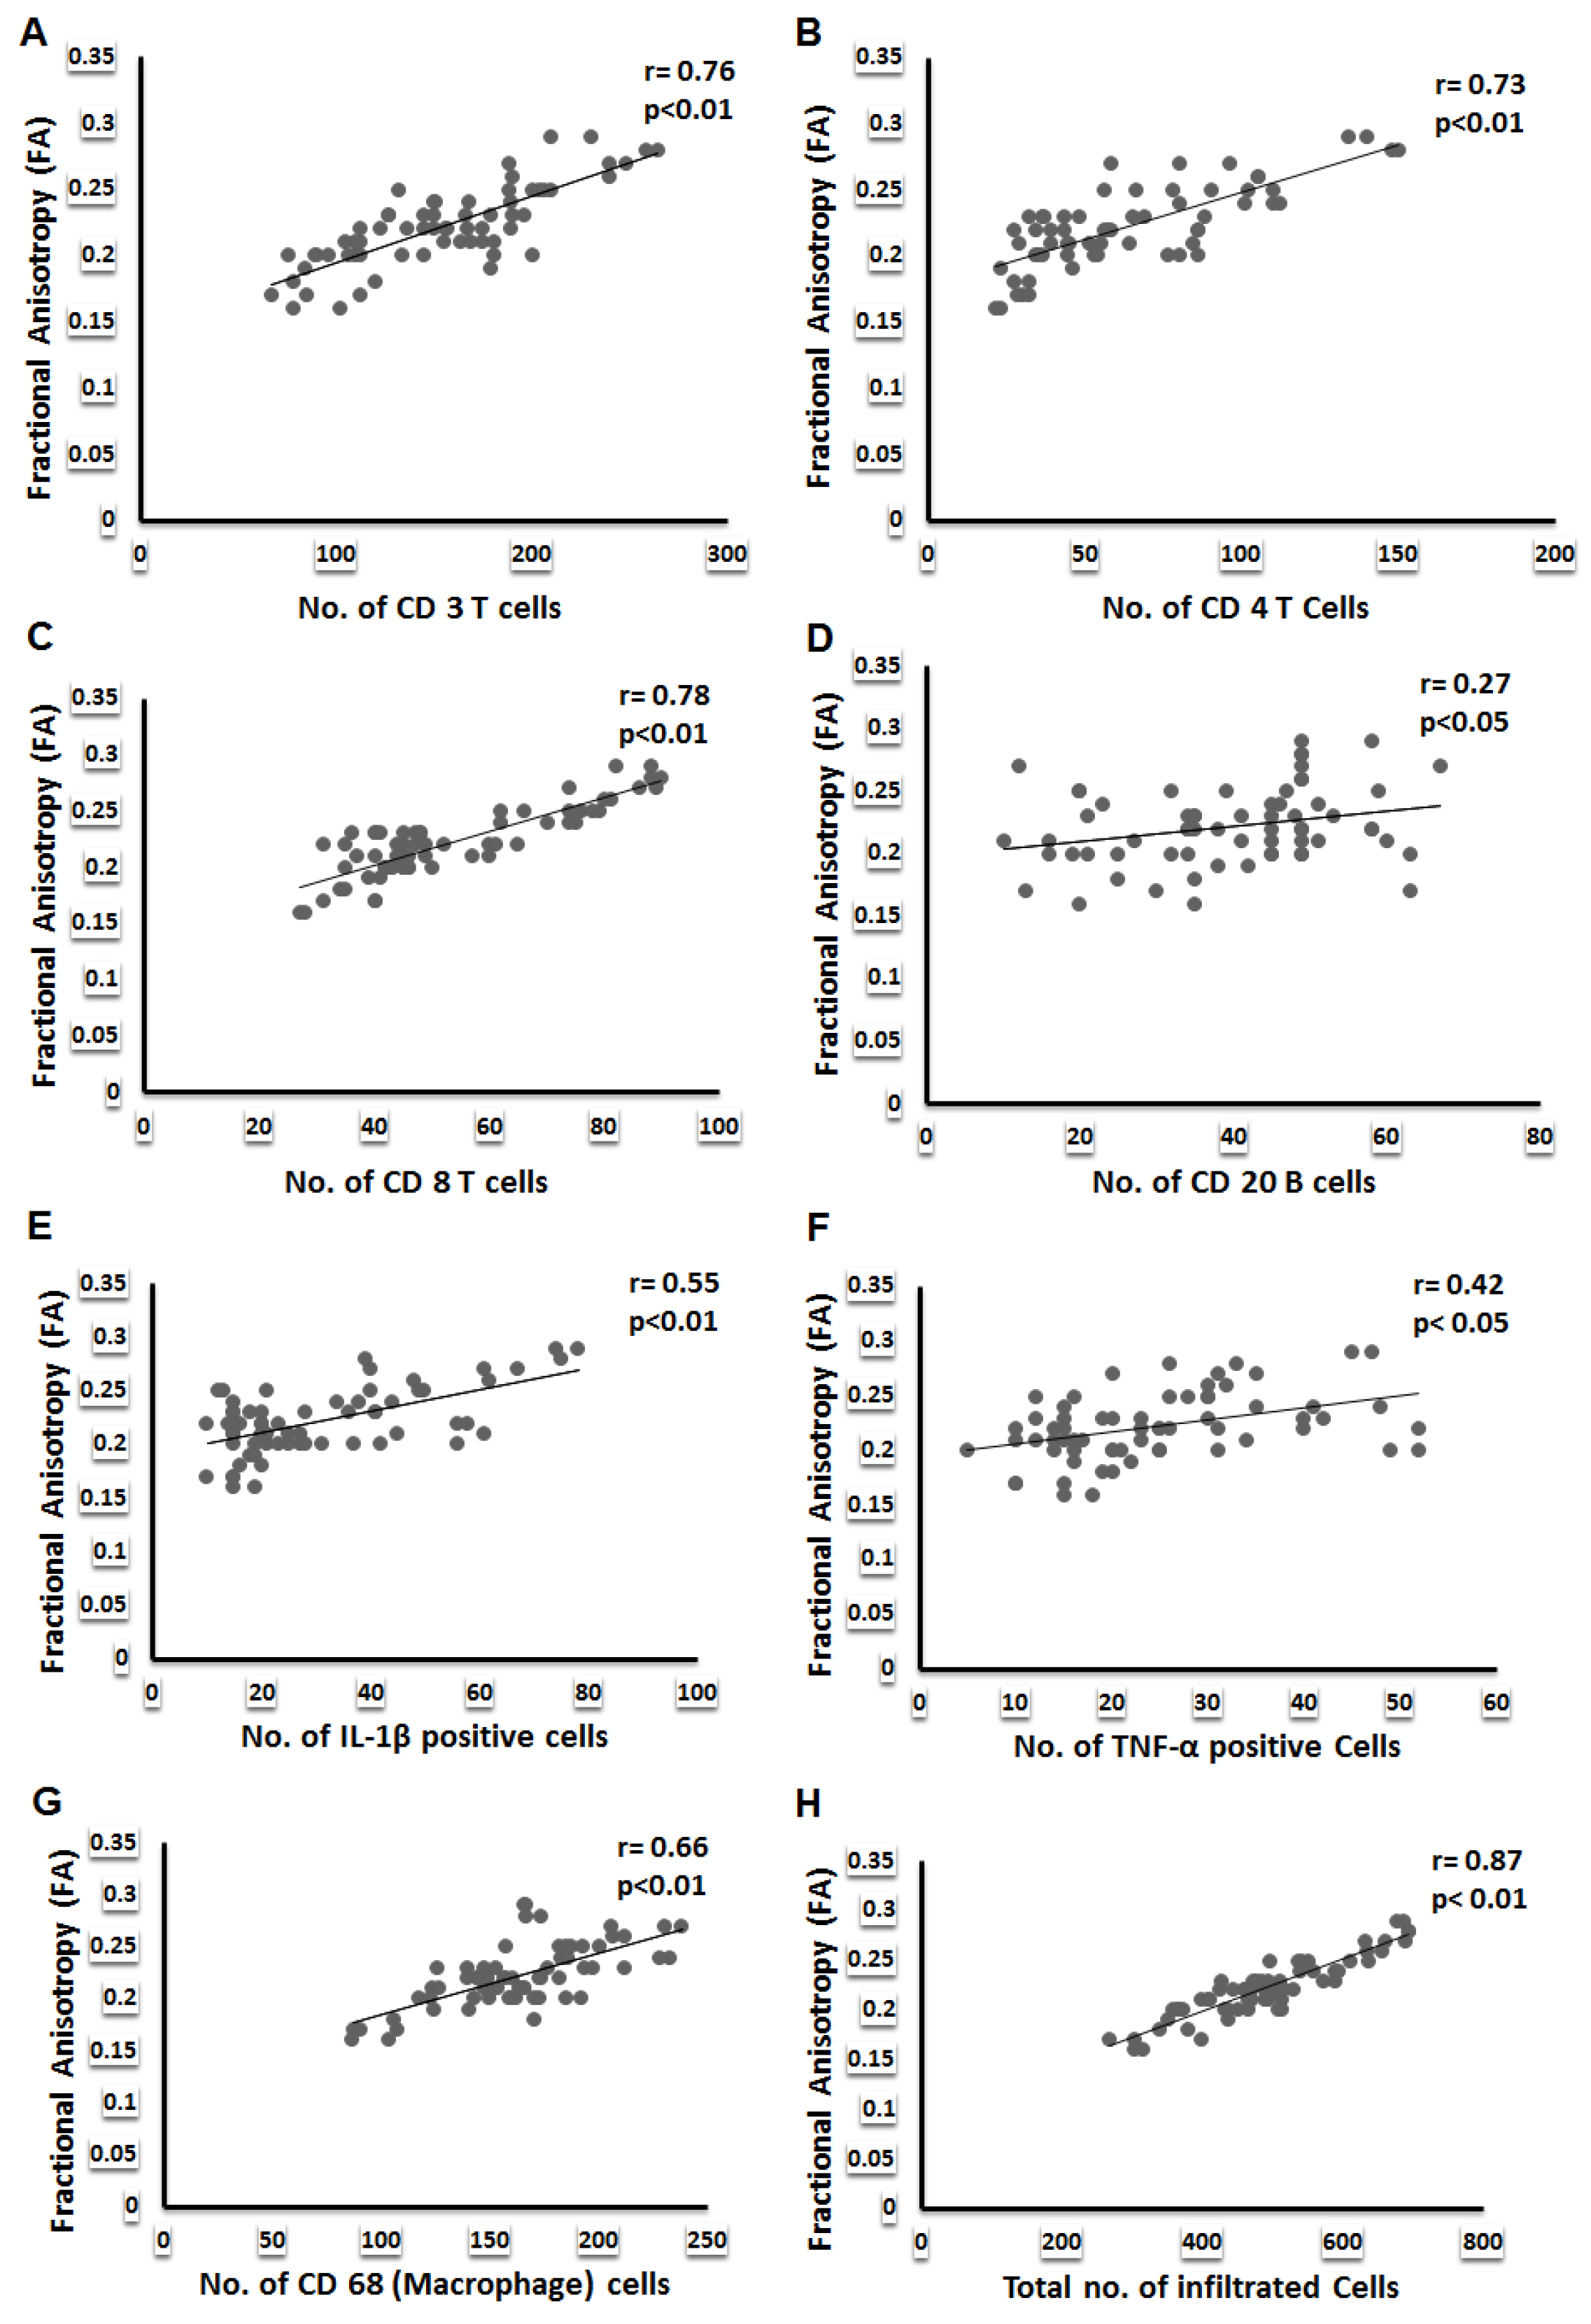
| FA | 0.76 ** | 0.73 ** | 0.78 ** | 0.27 * | 0.54 * | 0.66 ** | 0.30 * | 0.51 ** | 0.42 * | 0.55 ** | 0.87 ** |
| MD | −0.39 ** | −0.39 ** | −0.39 ** | −0.16 | −0.32 | −0.28 * | −0.07 | −0.20 | −0.02 | −0.22 | −0.43 ** |
| CL | 0.42 ** | 0.20 | 0.30 * | 0.27 * | 0.33 * | 0.19 | 0.19 | 0.26 * | 0.27 * | 0.42 ** | 0.40 ** |
| CP | 0.01 | 0.04 | 0.132 | 0.02 | 0.06 | 0.05 | 0.01 | 0.10 | 0.08 | 0.06 | 0.04 |
| CS | −0.31 * | −0.38 * | −0.29 ** | 0.06 | 0.02 | −0.29 | 0.34 | −0.15 | 0.15 | 0.11 | −0.29 ** |
| DCE-MRI Indices | |||||||||||
| BF | 0.54 | 0.48 | 0.57 * | 0.20 | 0.78 ** | 0.38 | 0.11 | 0.47 * | 0.25 | 0.47 * | 0.46 * |
| BV | 0.36 | 0.35 | 0.53 | 0.15 | 0.76 ** | 0.31 | 0.11 | 0.22 | 0.22 | 046 * | 0.49 |
| kep | 0.41 | 0.50 * | 0.53 * | 0.01 | 0.32 * | 0.38 * | 0.13 | 0.30 | 0.24 | 0.47 * | 0.48 * |
| PCI | −0.07 | 0.11 | 0.10 | 0.06 | 0.18 | −0.03 | 0.17 | −0.15 | 0.15 | 0.10 | 0.06 |
| DTI-MRI Indices | Total Arthritis Patients (n = 80) | ||
|---|---|---|---|
| TNF-α | IL-1β | IL-6 | |
| FA | 0.37 ** | 0.32 ** | 0.09 |
| MD | −0.38 * | −0.86 | −0.22 |
| CL | 0.47 * | 0.28 * | 0.13 |
| CP | −0.16 | −0.04 | −0.14 |
| CS | −0.06 | −0.06 | 0.10 |
| DCE-MRI Indices | |||
| BF | 0.32 | 0.12 | 0.22 |
| BV | 0.04 | 0.50 | 0.22 |
| kep | 0.03 | 0.34 | 0.32 |
| PCI | −0.05 | 0.27 * | 0.02 |
| a | ||||||
| IHC (T Cells) | DTI Metrices (Predictors) | β0 | β1 | R2 | Sig. | SE (Estimates) |
| CD 3 | FA | −126.66 | 1269.34 | 0.64 | <0.001 | 29.42 |
| MD | 216.97 | −38.06 | 0.15 | 0.001 | 45.02 | |
| CL | 108.49 | 798.55 | 0.20 | <0.001 | 43.73 | |
| CP | 149.10 | 39.51 | 0.00 | 0.729 | 48.99 | |
| CS | 653.69 | −663.50 | 0.09 | 0.01 | 46.66 | |
| PCI | 184.14 | −0.01 | 0.00 | 0.58 | 48.91 | |
| CD 4 | FA | −120.28 | 828.04 | 0.59 | <0.001 | 21.02 |
| MD | 104.73 | −25.35 | 0.15 | 0.001 | 30.48 | |
| CL | 40.86 | 387.82 | 0.10 | 0.008 | 31.31 | |
| CP | 58.54 | 32.99 | 0.00 | 0.66 | 33.07 | |
| CS | 475.06 | −547.63 | 0.14 | 0.002 | 30.69 | |
| PCI | 32.05 | 0.01 | 0.01 | 0.37 | 32.91 | |
| CD 8 | FA | −56.01 | 494.02 | 0.73 | <0.001 | 9.08 |
| MD | 80.15 | −16.30 | 0.21 | <0.001 | 15.70 | |
| CL | 38.32 | 262.46 | 0.16 | 0.001 | 16.20 | |
| CP | 47.47 | 41.41 | 0.01 | <0.001 | 17.62 | |
| CS | 261.52 | −276.63 | 0.12 | 0.004 | 16.61 | |
| PCI | 38.18 | 0.00 | 0.01 | 0.41 | 17.67 | |
| b | ||||||
| IHC (B Cells) | DTI Metrices (Predictors) | β0 | β1 | R2 | Sig. | SE (Estimates) |
| CD 20 | FA | 11.50 | 125.45 | 0.00 | 0.02 | 13.52 |
| MD | 43.24 | −2.39 | 0.00 | 0.49 | 14.01 | |
| CL | 31.73 | 130.72 | 0.06 | 0.03 | 13.59 | |
| CP | 38.39 | 6.36 | 0.00 | 0.84 | 14.06 | |
| CS | 7.13 | 42.83 | 0.00 | 0.58 | 14.04 | |
| PCI | 31.2 | 0.00 | 0.00 | 0.59 | 14.04 | |
| CD138 | FA | 3.79 | 145.44 | 0.09 | 0.01 | 13.89 |
| MD | 39.74 | −2.26 | 0.00 | 0.53 | 14.56 | |
| CL | 28.20 | 135.19 | 0.06 | 0.03 | 14.11 | |
| CP | 35.30 | 5.16 | 0.00 | 0.87 | 14.60 | |
| CS | −1.46 | 49.92 | 0.00 | 0.53 | 14.56 | |
| PCI | 13.98 | 0.01 | 0.031 | 0.15 | 14.37 | |
| c | ||||||
| IHC (Other Inflammatory Cells) | DTI Metrices (Predictors) | β0 | β1 | R2 | Sig. | SE (Estimates) |
| CD 68 | FA | −7.32 | 768.64 | 0.46 | <0.001 | 25.55 |
| MD | 194.73 | −19.34 | 0.08 | 0.020 | 33.46 | |
| CL | 152.87 | 177.52 | 0.02 | 0.26 | 34.54 | |
| CP | 153.13 | 68.23 | 0.01 | 0.40 | 34.69 | |
| CS | 568.98 | −539.83 | 0.12 | 0.004 | 32.66 | |
| PCI | 173.92 | −0.00 | 0.00 | 0.77 | 34.86 | |
| CD 54 | FA | −12.44 | 219.97 | 0.26 | <0.001 | 11.36 |
| MD | 44.94 | −5.27 | 0.04 | 0.10 | 12.96 | |
| CL | 31.58 | 81.98 | 0.03 | 0.17 | 13.04 | |
| CP | 33.36 | 20.25 | 0.00 | 0.51 | 13.19 | |
| CS | −106.14 | −92.85 | 0.02 | 0.20 | 13.07 | |
| PCI | 54.03 | −0.01 | 0.02 | 0.21 | 13.08 | |
| IL-1β | FA | −48.16 | 357.25 | 0.36 | <0.001 | 14.58 |
| MD | 48.93 | −10.94 | 0.09 | 0.013 | 17.41 | |
| CL | 11.56 | 335.76 | 0.26 | <0.001 | 15.73 | |
| CP | 27.78 | 22.39 | 0.00 | 0.599 | 18.25 | |
| CS | 240.32 | −278.34 | 0.11 | 0.005 | 17.16 | |
| PCI | 20.31 | 0.00 | 0.00 | 0.58 | 18.24 | |
| TNF-α | FA | −10.08 | 156.83 | 0.17 | 0.001 | 10.54 |
| MD | 25.42 | −0.44 | 0.00 | 0.87 | 11.60 | |
| CL | 18.94 | 99.11 | 0.05 | 0.050 | 11.27 | |
| CP | 21.95 | 18.61 | 0.00 | 0.49 | 11.56 | |
| CS | 82.60 | −77.02 | 0.02 | 0.23 | 11.47 | |
| PCI | 9.17 | 0.00 | 0.02 | 0.21 | 11.46 | |
| Total cells infiltrating the synovium | FA | −213.27 | 3168.58 | 0.83 | <0.001 | 43.67 |
| MD | 637.21 | −90.53 | 0.18 | <0.001 | 96.76 | |
| CL | 385.53 | 1790.49 | 0.21 | <0.001 | 95.00 | |
| CP | 468.73 | 141.85 | 0.00 | 0.56 | 106.95 | |
| CS | 1632.96 | −1520.97 | 0.10 | 0.009 | 101.50 | |
| PCI | 493.40 | −0.00 | 0.00 | 0.97 | 107.22 | |
| Dependent Variables (IHC) | DCE Metrices (Predictors) | β0 | β1 | R2 | Sig. | SE (Estimates) |
|---|---|---|---|---|---|---|
| CD 34 | BF | 16.83 | 0.32 | 0.66 | <0.001 | 10.10 |
| BV | 19.68 | 3.48 | 0.71 | <0.001 | 9.22 | |
| kep | 39.69 | 5.30 | 0.09 | 0.013 | 16.56 | |
| PCI | 0.01 | 29.71 | 0.02 | 0.214 | 17.20 |
Publisher’s Note: MDPI stays neutral with regard to jurisdictional claims in published maps and institutional affiliations. |
© 2022 by the authors. Licensee MDPI, Basel, Switzerland. This article is an open access article distributed under the terms and conditions of the Creative Commons Attribution (CC BY) license (https://creativecommons.org/licenses/by/4.0/).
Share and Cite
Tripathi, D.; Awasthi, R.; Agarwal, V.; Agrawal, V.; Rathore, R.K.S.; Sharma, K.; Pandey, C.M.; Gupta, R.K. Diffusion Tensor and Dynamic Contrast-Enhanced Magnetic Resonance Imaging Correlate with Molecular Markers of Inflammation in the Synovium. Diagnostics 2022, 12, 3041. https://doi.org/10.3390/diagnostics12123041
Tripathi D, Awasthi R, Agarwal V, Agrawal V, Rathore RKS, Sharma K, Pandey CM, Gupta RK. Diffusion Tensor and Dynamic Contrast-Enhanced Magnetic Resonance Imaging Correlate with Molecular Markers of Inflammation in the Synovium. Diagnostics. 2022; 12(12):3041. https://doi.org/10.3390/diagnostics12123041
Chicago/Turabian StyleTripathi, Deepak, Rishi Awasthi, Vikas Agarwal, Vinita Agrawal, Ram Kishore Singh Rathore, Kusum Sharma, Chandra Mani Pandey, and Rakesh Kumar Gupta. 2022. "Diffusion Tensor and Dynamic Contrast-Enhanced Magnetic Resonance Imaging Correlate with Molecular Markers of Inflammation in the Synovium" Diagnostics 12, no. 12: 3041. https://doi.org/10.3390/diagnostics12123041