
Feasibility of Arterial Spin Labeling Magnetic Resonance Imaging for Musculoskeletal Tumors with Optimized Post-Labeling Delay

Abstract
:1. Introduction
2. Materials and Methods
2.1. Subjects
2.2. Ethical Considerations
2.3. MRI Acquisition
2.4. Image Processing and Data Acquisition
2.5. Statistical Analysis
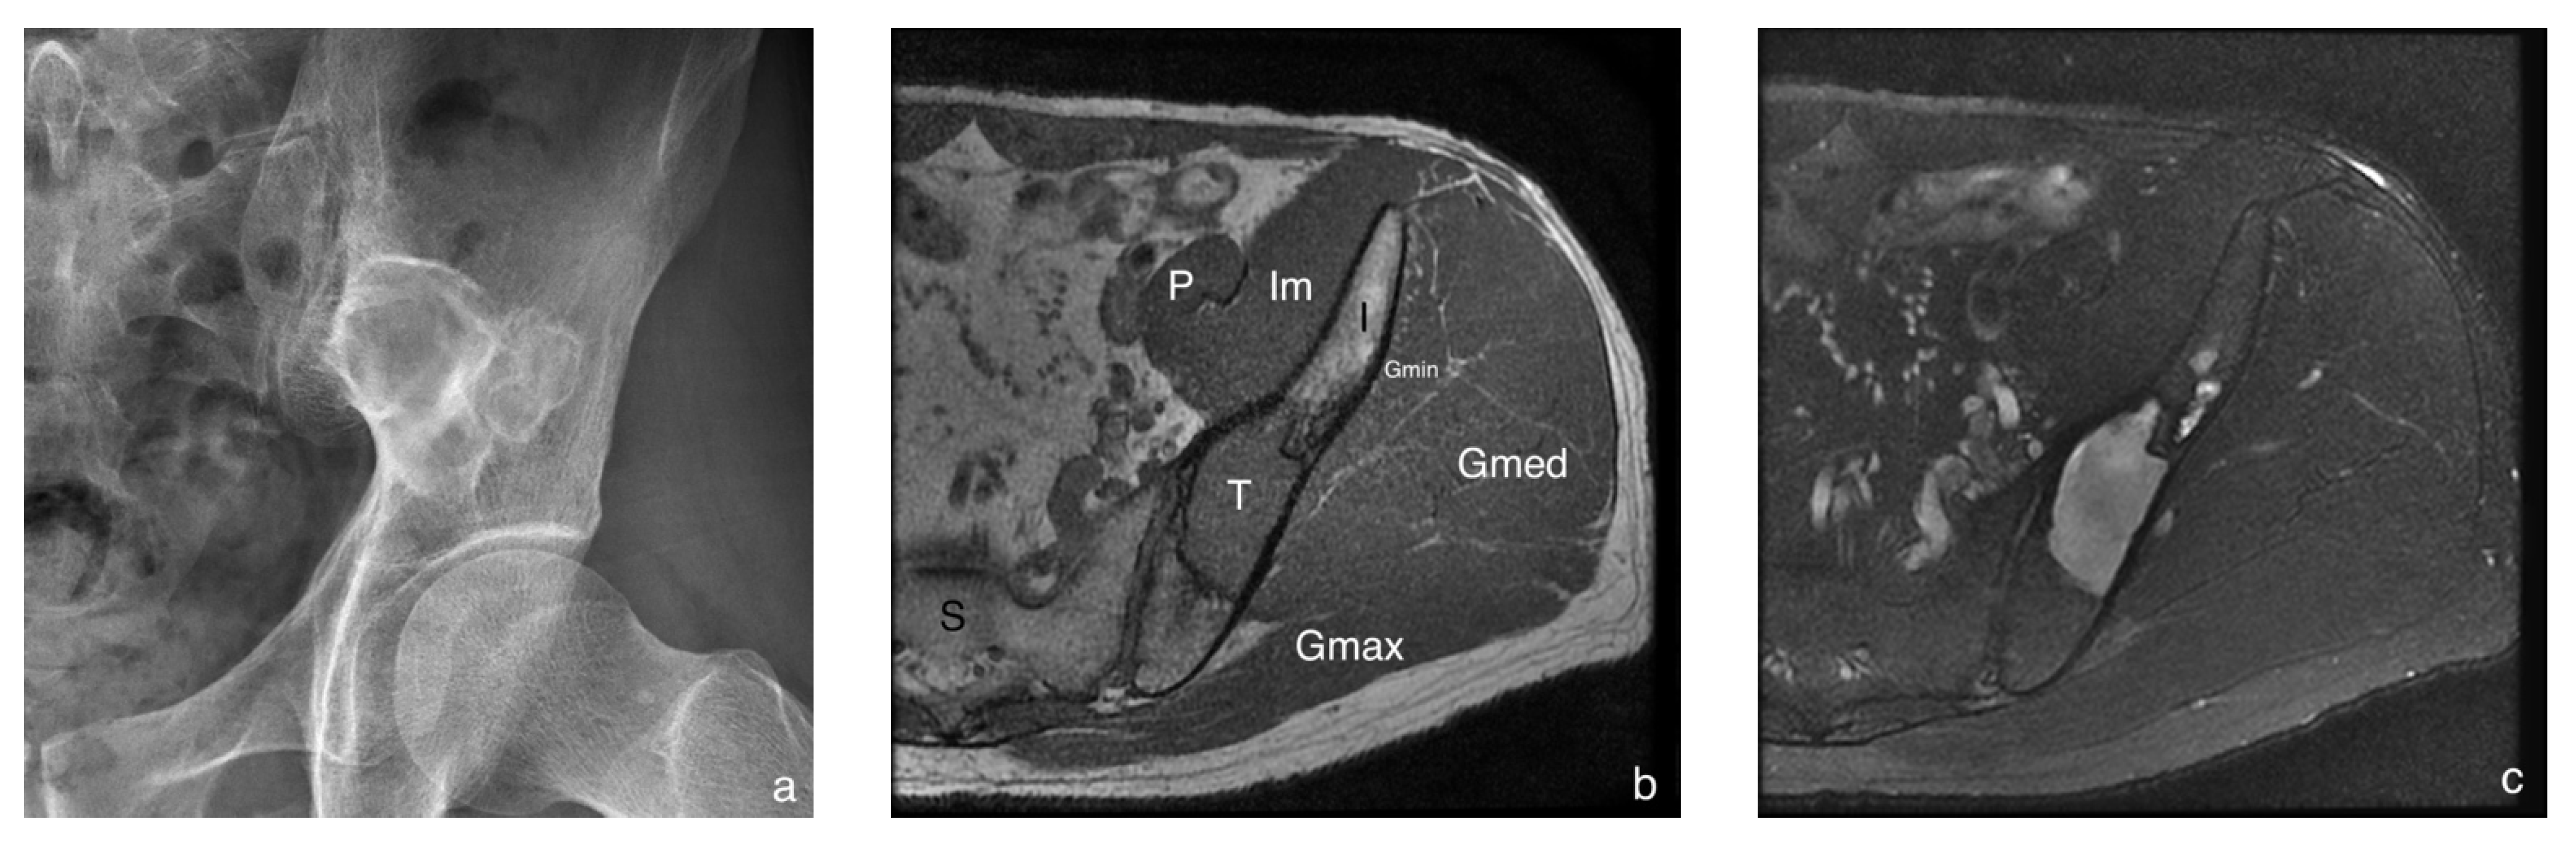
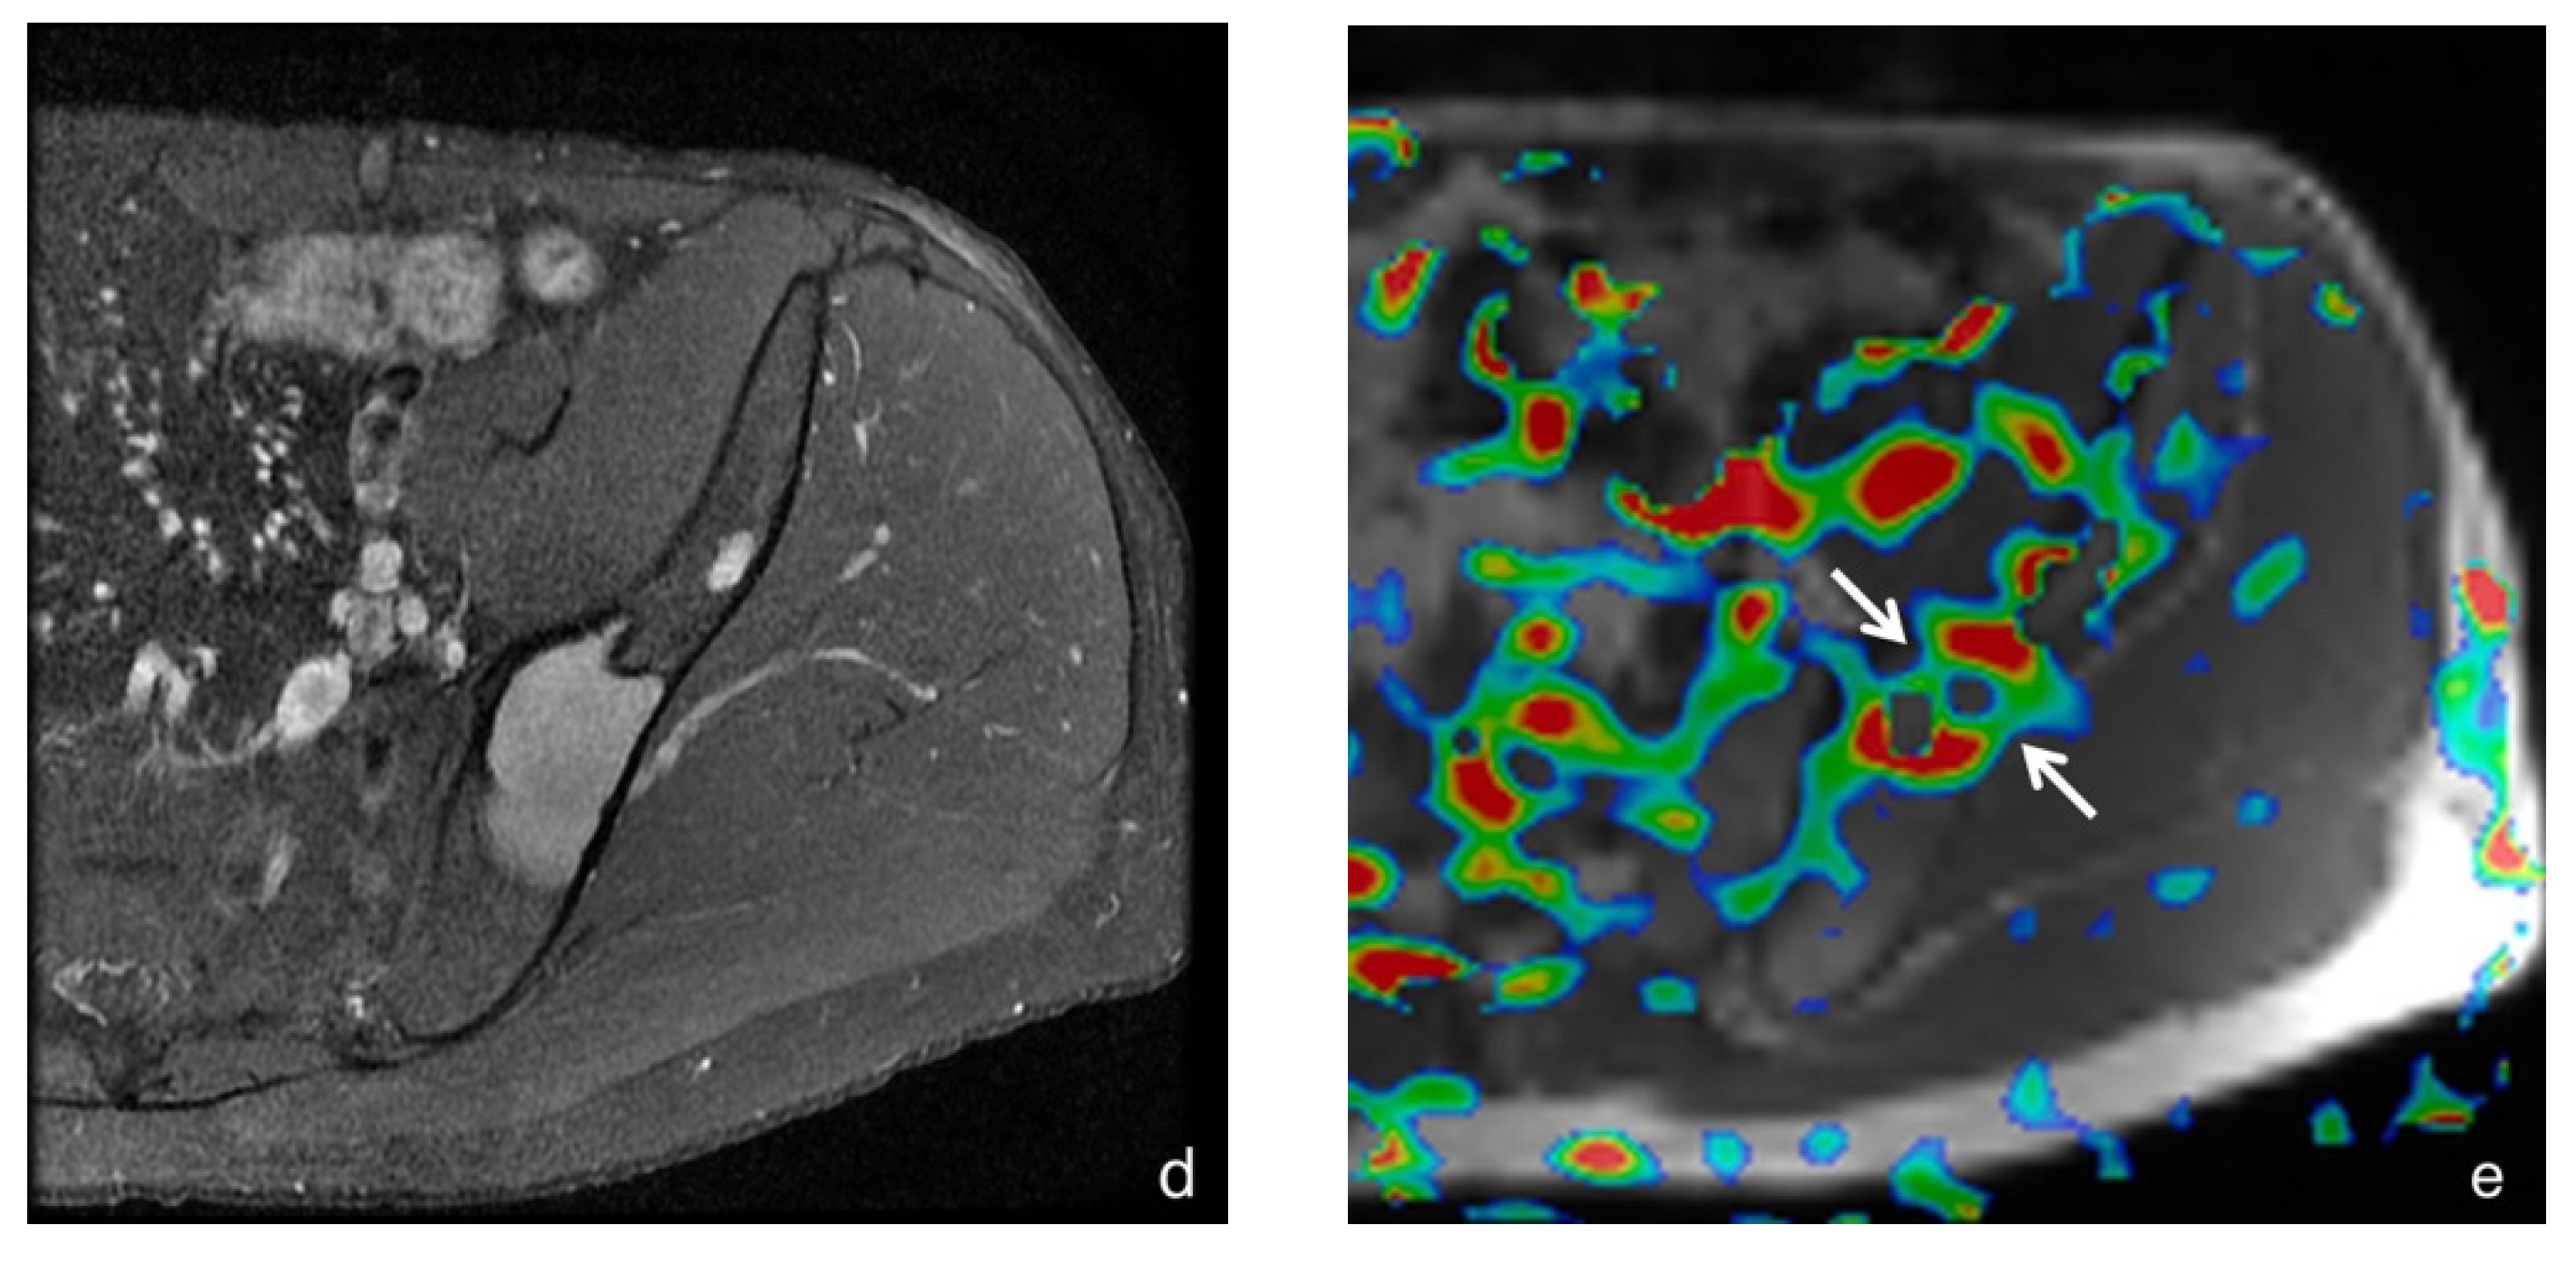
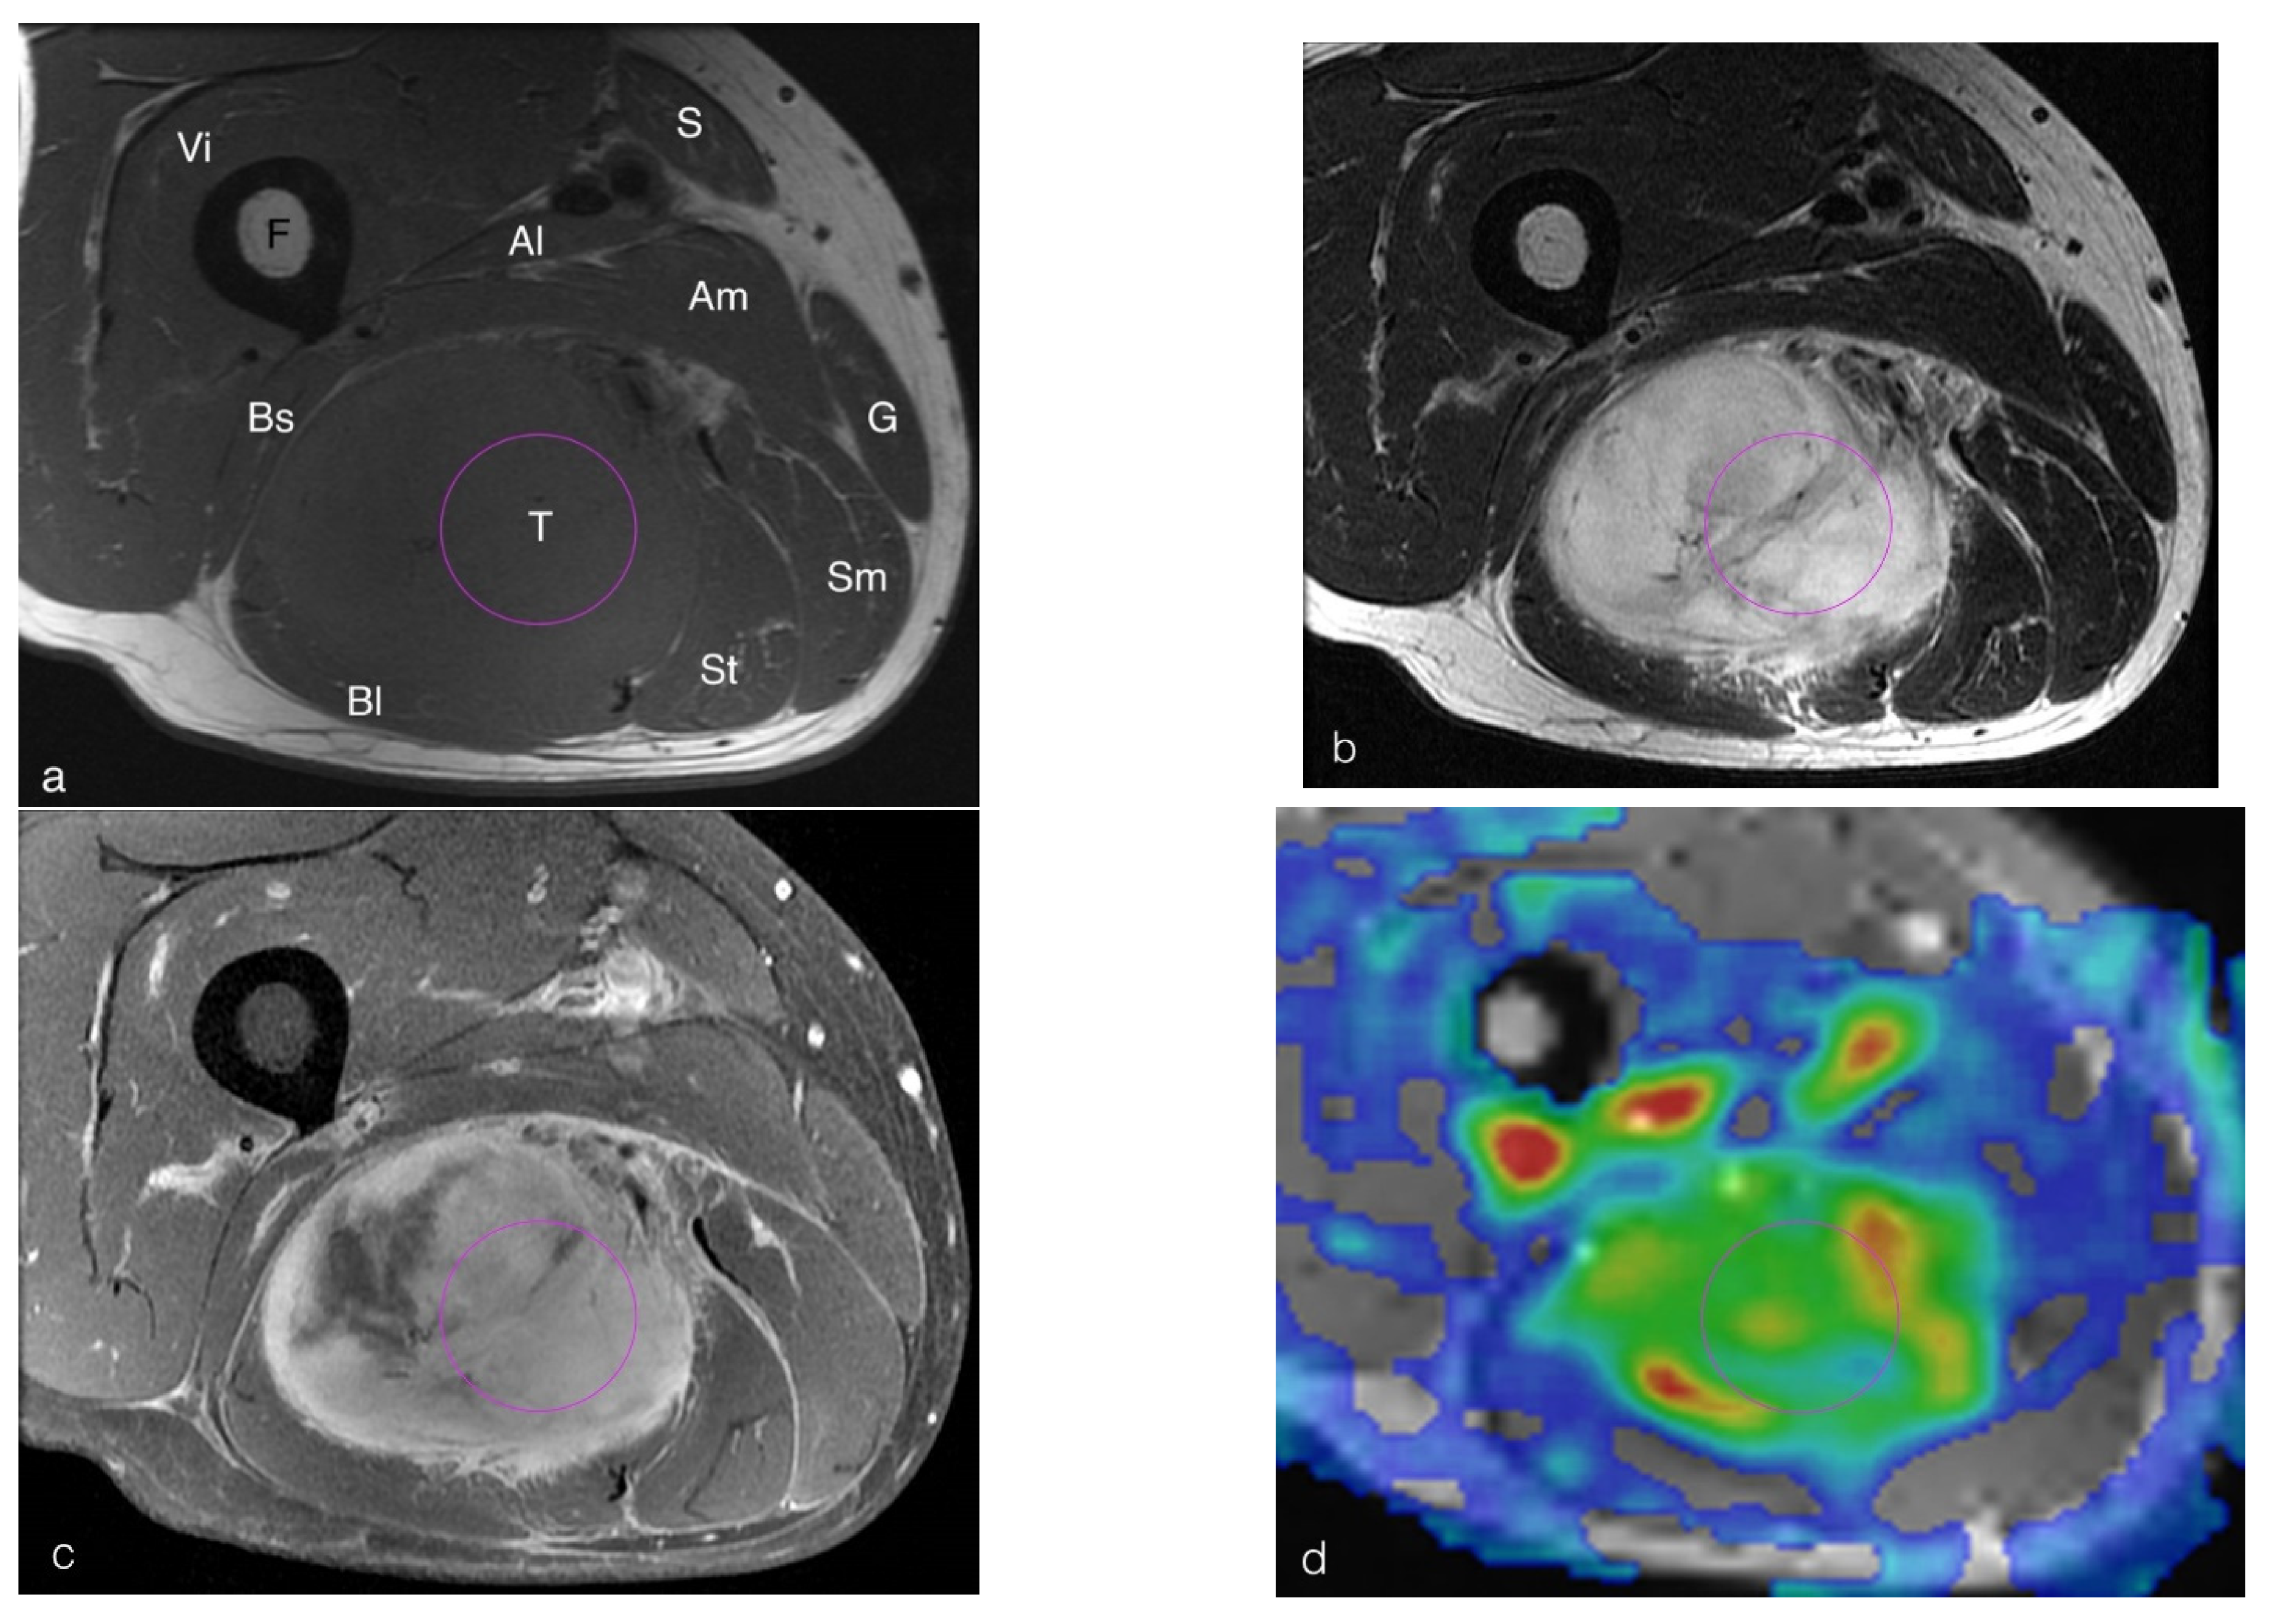
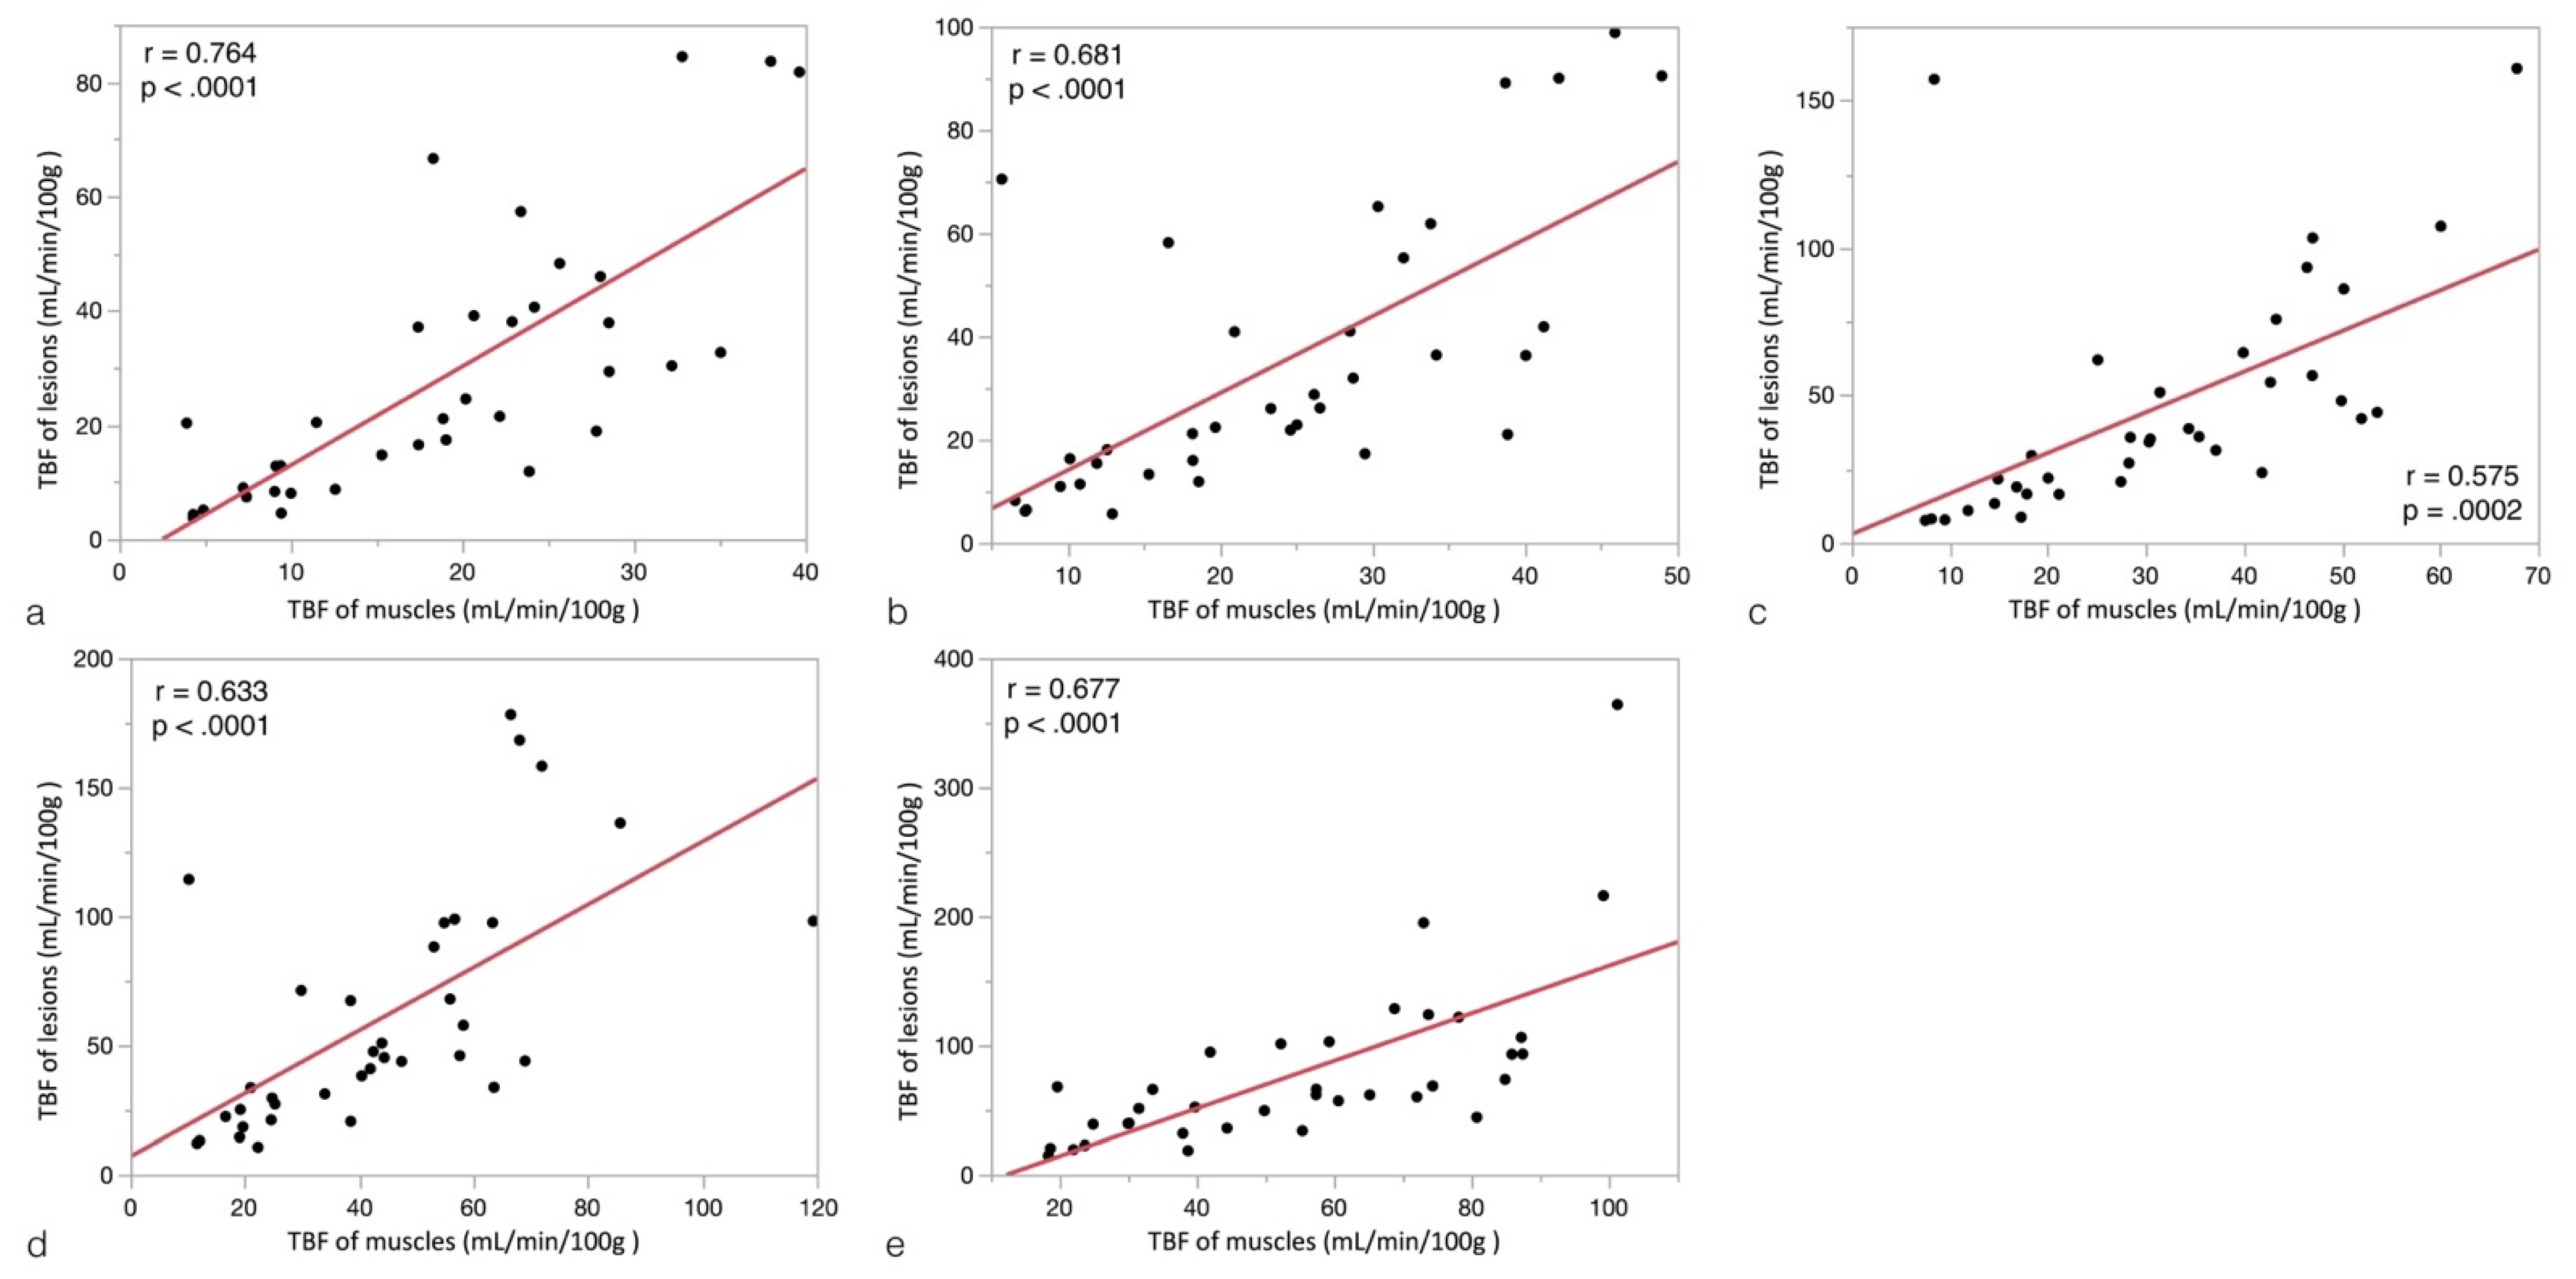
3. Results
4. Discussion
5. Conclusions
Supplementary Materials
Author Contributions
Funding
Institutional Review Board Statement
Informed Consent Statement
Data Availability Statement
Acknowledgments
Conflicts of Interest
References
- Vibhakar, A.M.; Cassels, J.A.; Botchu, R.; Rennie, W.J.; Shah, A. Imaging update on soft tissue sarcoma. J. Clin. Orthop. Trauma 2021, 22, 101568. [Google Scholar] [CrossRef] [PubMed]
- Murphey, M.D.; Kransdorf, M.J. Staging and Classification of Primary Musculoskeletal Bone and Soft-Tissue Tumors According to the 2020 WHO Update, From the AJR Special Series on Cancer Staging. AJR Am. J. Roentgenol. 2021, 217, 1038–1052. [Google Scholar] [CrossRef] [PubMed]
- Pekcevik, Y.; Kahya, M.O.; Kaya, A. Characterization of Soft Tissue Tumors by Diffusion-Weighted Imaging. Iran J. Radiol. 2015, 12, e15478. [Google Scholar] [CrossRef] [Green Version]
- Wang, C.K.; Li, C.W.; Hsieh, T.J.; Chien, S.H.; Liu, G.C.; Tsai, K.B. Characterization of bone and soft-tissue tumors with in vivo 1H MR spectroscopy: Initial results. Radiology 2004, 232, 599–605. [Google Scholar] [CrossRef] [PubMed]
- Howe, B.M.; Broski, S.M.; Littrell, L.A.; Pepin, K.M.; Wenger, D.E. Quantitative Musculoskeletal Tumor Imaging. Semin. Musculoskelet. Radiol. 2020, 24, 428–440. [Google Scholar] [CrossRef] [PubMed]
- De Mello, R.; Ma, Y.; Ji, Y.; Du, J.; Chang, E.Y. Quantitative MRI Musculoskeletal Techniques: An Update. AJR Am. J. Roentgenol. 2019, 213, 524–533. [Google Scholar] [CrossRef] [Green Version]
- Barrett, T.; Brechbiel, M.; Bernardo, M.; Choyke, P.L. MRI of tumor angiogenesis. J. Magn. Reson. Imaging 2007, 26, 235–249. [Google Scholar] [CrossRef]
- Verstraete, K.L.; Van der Woude, H.J.; Hogendoorn, P.C.; De-Deene, Y.; Kunnen, M.; Bloem, J.L. Dynamic contrast-enhanced MR imaging of musculoskeletal tumors: Basic principles and clinical applications. J. Magn. Reson. Imaging 1996, 6, 311–321. [Google Scholar] [CrossRef]
- Sugawara, Y.; Murase, K.; Kikuchi, K.; Sakayama, K.; Miyazaki, T.; Kajihara, M.; Miki, H.; Mochizuki, T. Measurement of tumor blood flow using dynamic contrast-enhanced magnetic resonance imaging and deconvolution analysis: A preliminary study in musculoskeletal tumors. J. Comput. Assist. Tomogr. 2006, 30, 983–990. [Google Scholar] [CrossRef]
- Sujlana, P.; Skrok, J.; Fayad, L.M. Review of dynamic contrast-enhanced MRI: Technical aspects and applications in the musculoskeletal system. J. Magn. Reson. Imaging 2018, 47, 875–890. [Google Scholar] [CrossRef] [PubMed]
- Detre, J.A.; Wang, J. Technical aspects and utility of fMRI using BOLD and ASL. Clin. Neurophysiol. 2002, 113, 621–634. [Google Scholar] [CrossRef]
- Detre, J.A.; Alsop, D.C. Perfusion magnetic resonance imaging with continuous arterial spin labeling: Methods and clinical applications in the central nervous system. Eur. J. Radiol. 1999, 30, 115–124. [Google Scholar] [CrossRef]
- Fujima, N.; Kudo, K.; Tsukahara, A.; Yoshida, D.; Sakashita, T.; Homma, A.; Tha, K.K.; Shirato, H. Measurement of tumor blood flow in head and neck squamous cell carcinoma by pseudo-continuous arterial spin labeling: Comparison with dynamic contrast-enhanced MRI. J. Magn. Reson. Imaging 2015, 41, 983–991. [Google Scholar] [CrossRef] [PubMed]
- Cai, W.; Li, F.; Wang, J.; Du, H.; Wang, X.; Zhang, J.; Fang, J.; Jiang, X. A comparison of arterial spin labeling perfusion MRI and DCE-MRI in human prostate cancer. NMR Biomed. 2014, 27, 817–825. [Google Scholar] [CrossRef] [PubMed]
- Watts, J.M.; Whitlow, C.T.; Maldjian, J.A. Clinical applications of arterial spin labeling. NMR Biomed. 2013, 26, 892–900. [Google Scholar] [CrossRef]
- Kawashima, M.; Katada, Y.; Shukuya, T.; Kojima, M.; Nozaki, M. MR perfusion imaging using the arterial spin labeling technique for breast cancer. J. Magn. Reson. Imaging 2012, 35, 436–440. [Google Scholar] [CrossRef]
- Katada, Y.; Shukuya, T.; Kawashima, M.; Nozaki, M.; Imai, H.; Natori, T.; Tamano, M. A comparative study between arterial spin labeling and CT perfusion methods on hepatic portal venous flow. Jpn. J. Radiol. 2012, 30, 863–869. [Google Scholar] [CrossRef]
- Winter, J.D.; St Lawrence, K.S.; Cheng, H.L. Quantification of renal perfusion: Comparison of arterial spin labeling and dynamic contrast-enhanced MRI. J. Magn. Reson. Imaging 2011, 34, 608–615. [Google Scholar] [CrossRef]
- Duyn, J.H.; van Gelderen, P.; Talagala, L.; Koretsky, A.; de Zwart, J.A. Technological advances in MRI measurement of brain perfusion. J. Magn. Reson. Imaging 2005, 22, 751–753. [Google Scholar] [CrossRef]
- Warmuth, C.; Gunther, M.; Zimmer, C. Quantification of blood flow in brain tumors: Comparison of arterial spin labeling and dynamic susceptibility-weighted contrast-enhanced MR imaging. Radiology 2003, 228, 523–532. [Google Scholar] [CrossRef]
- Fenchel, M.; Konaktchieva, M.; Weisel, K.; Kraus, S.; Claussen, C.D.; Horger, M. Response assessment in patients with multiple myeloma during antiangiogenic therapy using arterial spin labeling and diffusion-weighted imaging: A feasibility study. Acad. Radiol. 2010, 17, 1326–1333. [Google Scholar] [CrossRef] [PubMed]
- Xu, L.; Xu, L.; Zhu, H. Evaluation of three-dimensional arterial spin labeling perfusion imaging for the pathological investigation of musculoskeletal tumors. Exp. Ther. Med. 2018, 15, 5029–5034. [Google Scholar] [CrossRef] [PubMed] [Green Version]
- Abdel Razek, A.A.K.; Talaat, M.; El-Serougy, L.; Gaballa, G.; Abdelsalam, M. Clinical Applications of Arterial Spin Labeling in Brain Tumors. J. Comput. Assist. Tomogr. 2019, 43, 525–532. [Google Scholar] [CrossRef] [PubMed]
- Holland, C.K.; Brown, J.M.; Scoutt, L.M.; Taylor, K.J. Lower extremity volumetric arterial blood flow in normal subjects. Ultrasound. Med. Biol. 1998, 24, 1079–1086. [Google Scholar] [CrossRef]
- Lee, W. General principles of carotid Doppler ultrasonography. Ultrasonography 2014, 33, 11–17. [Google Scholar] [CrossRef]
- Baligand, C.; Hirschler, L.; Veeger, T.T.J.; Václavů, L.; Franklin, S.L.; van Osch, M.J.P.; Kan, H.E. A split-label design for simultaneous measurements of perfusion in distant slices by pulsed arterial spin labeling. Magn. Reson. Med. 2021, 86, 2441–2453. [Google Scholar] [CrossRef]
- Bancroft, L.W.; Pettis, C.; Wasyliw, C. Imaging of benign soft tissue tumors. Semin. Musculoskelet. Radiol. 2013, 17, 156–167. [Google Scholar] [CrossRef] [Green Version]
- Naraghi, A.M.; Mohankumar, R.; Linda, D.; White, L.M. Bone Tumors: Imaging Features of Common and Rare Benign Entities. Radiol. Clin. N. Am. 2022, 60, 205–219. [Google Scholar] [CrossRef]
- Woertler, K. Benign bone tumors and tumor-like lesions: Value of cross-sectional imaging. Eur. Radiol. 2003, 13, 1820–1835. [Google Scholar] [CrossRef]
- Zhuang, K.D.; Tandon, A.A.; Ho, B.C.; Chong, B.K. MRI features of soft-tissue lumps and bumps. Clin. Radiol. 2014, 69, e568–e583. [Google Scholar] [CrossRef]
- Mayerson, J.L.; Scharschmidt, T.J.; Lewis, V.O.; Morris, C.D. Diagnosis and Management of Soft-tissue Masses. J. Am. Acad. Orthop. Surg. 2014, 22, 742–750. [Google Scholar] [CrossRef] [PubMed]
- Grade, M.; Hernandez Tamames, J.A.; Pizzini, F.B.; Achten, E.; Golay, X.; Smits, M. A neuroradiologist’s guide to arterial spin labeling MRI in clinical practice. Neuroradiology 2015, 57, 1181–1202. [Google Scholar] [CrossRef] [PubMed] [Green Version]
- Takahashi, N.; Yoshino, O.; Hiraike, O.; Maeda, E.; Nakamura, M.; Hori, M.; Harada, M.; Koga, K.; Saito, S.; Fujii, T.; et al. The assessment of myometrium perfusion in patients with uterine fibroid by arterial spin labeling MRI. Springerplus 2016, 5, 1907. [Google Scholar] [CrossRef] [PubMed] [Green Version]
- Mathew, R.C.; Kramer, C.M. Recent advances in magnetic resonance imaging for peripheral artery disease. Vasc. Med. 2018, 23, 143–152. [Google Scholar] [CrossRef] [Green Version]
- Caroca, S.; Villagran, D.; Chabert, S. Four functional magnetic resonance imaging techniques for skeletal muscle exploration, a systematic review. Eur. J. Radiol. 2021, 144, 109995. [Google Scholar] [CrossRef] [PubMed]
- Englund, E.K.; Rodgers, Z.B.; Langham, M.C.; Mohler, E.R., 3rd; Floyd, T.F.; Wehrli, F.W. Measurement of skeletal muscle perfusion dynamics with pseudo-continuous arterial spin labeling (pCASL): Assessment of relative labeling efficiency at rest and during hyperemia, and comparison to pulsed arterial spin labeling (PASL). J. Magn. Reson. Imaging 2016, 44, 929–939. [Google Scholar] [CrossRef] [Green Version]
- Kuniyasu, H.; Yasui, W.; Shinohara, H.; Yano, S.; Ellis, L.M.; Wilson, M.R.; Bucana, C.D.; Rikita, T.; Tahara, E.; Fidler, I.J. Induction of angiogenesis by hyperplastic colonic mucosa adjacent to colon cancer. Am. J. Pathol. 2000, 157, 1523–1535. [Google Scholar] [CrossRef] [Green Version]
- Amukotuwa, S.A.; Yu, C.; Zaharchuk, G. 3D Pseudocontinuous arterial spin labeling in routine clinical practice: A review of clinically significant artifacts. J. Magn. Reson. Imaging 2016, 43, 11–27. [Google Scholar] [CrossRef]


| Diagnosis | N | Location (N) |
|---|---|---|
| Atypical lipomatous tumor (borderline malignancy) | 1 | Left thigh (1) |
| Liposarcoma, well-differentiated | 1 | Left thigh (1) |
| Pleomorphic rhabdomyosarcoma | 1 | Left thigh (1) |
| Myxofibrosarcoma | 2 | Left thigh (1) Right thigh (1) |
| Lymphoma | 1 | Right iliac bone (1) |
| Metastasis | 1 | Right iliac bone (1) |
| Diagnosis | N | Method | Location (N) |
|---|---|---|---|
| Hypervascular benign lesion | 11 | ||
| Schwannoma | 6 | Pathology | Right hip (2) Left thigh (1) Right knee (1) |
| MRI | Right leg (2) | ||
| Hemangioma | 3 | Pathology | Right foot (1) |
| MRI | Right lower leg (2) | ||
| Fibrous dysplasia | 2 | MRI | Left femur (1) Right femur (1) |
| Hypovascular benign lesion | 18 | ||
| Intramuscular myxoma | 1 | Pathology | Right hip (1) |
| Lipoma | 6 | Pathology | Right gluteal region (1) |
| MRI | Right thigh (2) Left thigh (3) | ||
| Cyst | 5 | MRI | Left hip (1) Left foot (1) Left knee (2) Right ankle (1) |
| Enchondroma | 1 | MRI | Right tibia (1) |
| Necrosis | 1 | Pathology | Right thigh (1) |
| Synovial chondromatosis | 2 | Pathology | Right knee (1) Left knee (1) |
| Amyloidosis | 1 | Pathology | Left lower leg (1) |
| Gouty arthritis | 1 | Pathology | Left knee (1) |
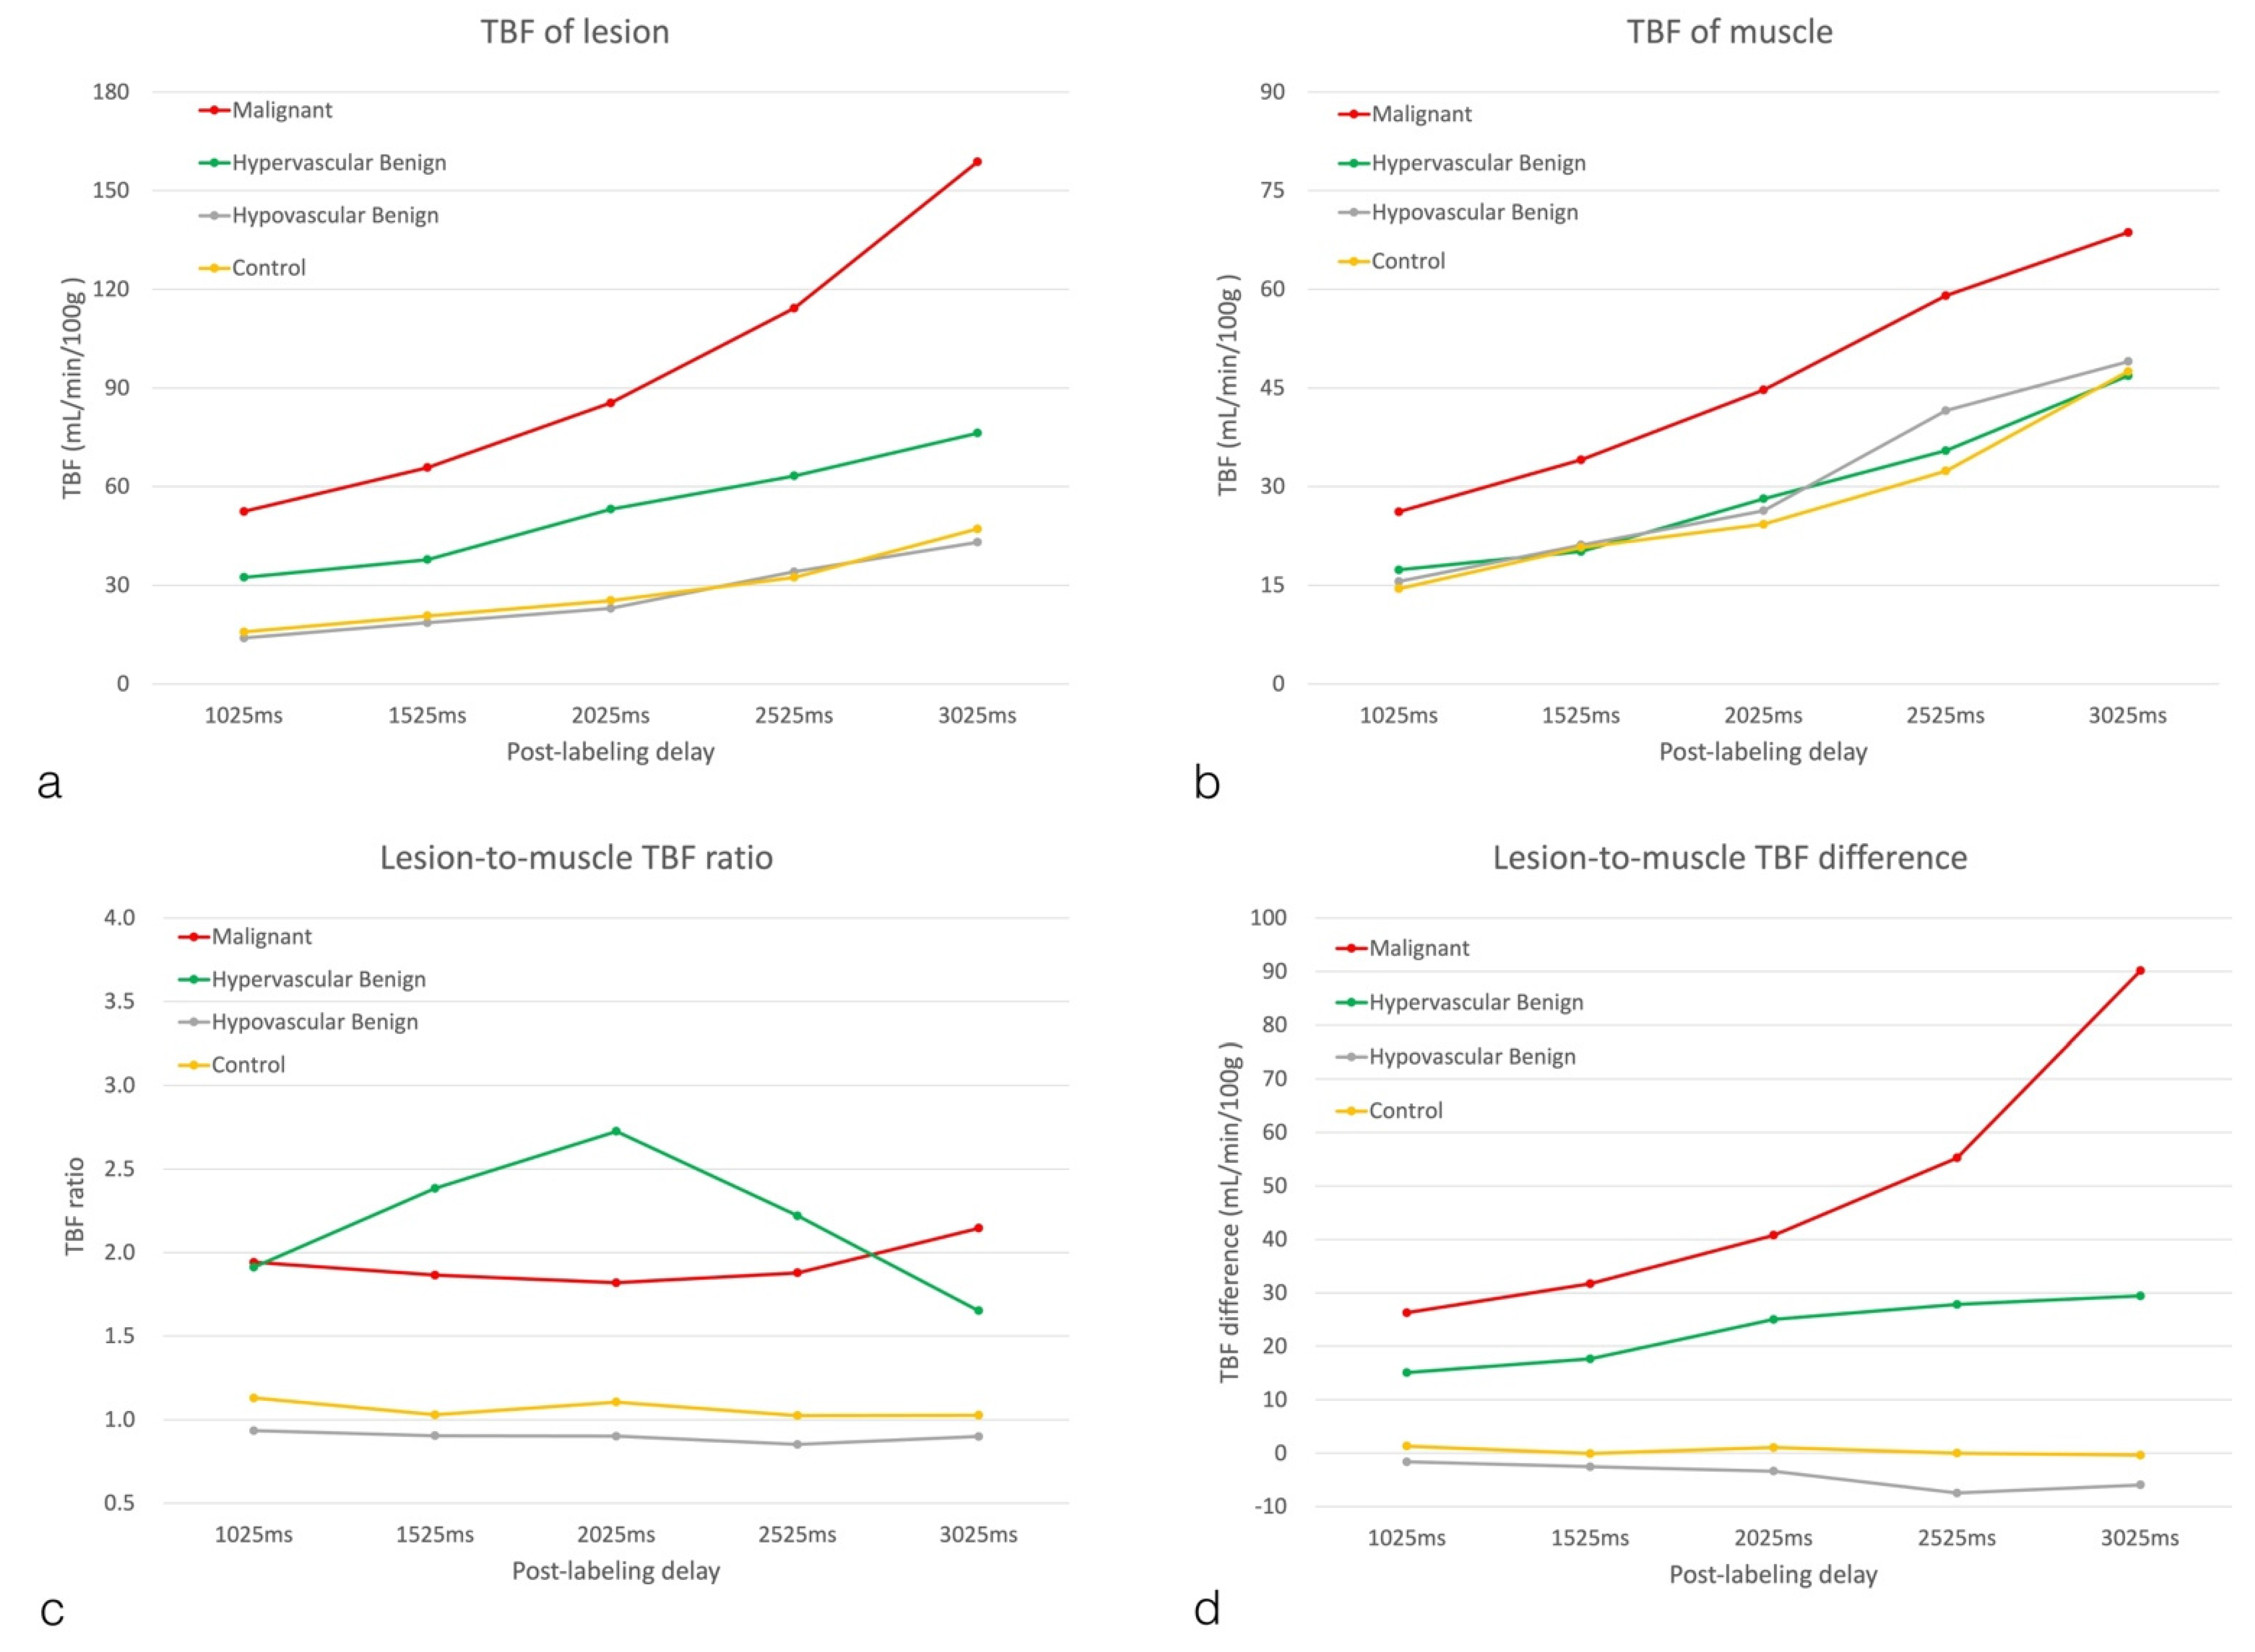
| Malignant | Hypervascular Benign | Hypovascular Benign | Control | M-B | M-L | M-N | B-L | B-N | L-N | |
|---|---|---|---|---|---|---|---|---|---|---|
| PLD = 1025ms | ||||||||||
| Lesion TBF (mL/min/100 g) | 52.46 ± 25.41 | 32.42 ± 25.03 | 13.96 ± 9.41 | 15.81 ± 9.39 | 0.1166 | 0.0004 * | 0.0008 * | 0.0524 | 0.0947 | 0.9933 |
| Muscle TBF (mL/min/100 g) | 26.18 ± 8.12 | 17.34 ± 10.50 | 15.57 ± 10.28 | 14.49 ± 7.66 | 0.2422 | 0.1181 | 0.0716 | 0.9631 | 0.8653 | 0.9909 |
| Dif_TBF (mL/min/100 g) | 26.28 ± 18.29 | 15.08 ± 17.19 | −1.62 ± 3.73 | 1.32 ± 6.11 | 0.2429 | 0.0001 * | 0.0007 * | 0.0050 * | 0.0265 | 0.9224 |
| TBF ratio | 1.94 ± 0.47 | 1.91 ± 1.26 | 0.93 ± 0.24 | 1.13 ± 0.39 | 0.9998 | 0.0432 * | 0.1383 | 0.0092 * | 0.0503 | 0.9079 |
| PLD = 1525 ms | ||||||||||
| Lesion TBF (mL/min/100 g) | 65.76 ± 29.18 | 37.79 ± 28.51 | 18.60 ± 11.35 | 20.69 ± 10.20 | 0.0374 | 0.0002 * | 0.0003 * | 0.0898 | 0.1536 | 0.9935 |
| Muscle TBF (mL/min/100 g) | 34.08 ± 11.73 | 20.14 ± 11.35 | 21.12 ± 12.64 | 20.76 ± 9.67 | 0.0765 | 0.1113 | 0.0973 | 0.9961 | 0.999 | 0.9998 |
| Dif_TBF (mL/min/100 g) | 31.69 ± 18.43 | 17.65 ± 23.36 | −2.52 ± 5.32 | −0.07 ± 7.51 | 0.2473 | 0.0002 * | 0.0006 * | 0.0075 * | 0.0224 | 0.9756 |
| TBF ratio | 1.86 ± 0.40 | 2.38 ± 3.08 | 0.90 ± 0.22 | 1.03 ± 0.29 | 0.9233 | 0.6574 | 0.7467 | 0.1291 | 0.1858 | 0.9976 |
| PLD = 2025 ms | ||||||||||
| Lesion TBF (mL/min/100 g) | 85.46 ± 44.15 | 53.16 ± 43.84 | 22.95 ± 13.56 | 25.34 ± 13.32 | 0.1474 | 0.0008 * | 0.0012 * | 0.0657 | 0.1022 | 0.9970 |
| Muscle TBF (mL/min/100 g) | 44.69 ± 14.24 | 28.14 ± 15.94 | 26.33 ± 15.86 | 24.27 ± 13.20 | 0.1290 | 0.0769 | 0.0405 | 0.9896 | 0.9114 | 0.9850 |
| Dif_TBF (mL/min/100 g) | 40.77 ± 30.41 | 25.01 ± 41.51 | −3.37 ± 6.63 | 1.07 ± 7.19 | 0.5951 | 0.0057 * | 0.0118 * | 0.0332 | 0.0925 | 0.9699 |
| TBF ratio | 1.82 ± 0.10 | 2.73 ± 4.83 | 0.90 ± 0.24 | 1.10 ± 0.28 | 0.8963 | 0.8926 | 0.9455 | 0.2999 | 0.4032 | 0.9972 |
| PLD = 2525 ms | ||||||||||
| Lesion TBF (mL/min/100 g) | 114.25 ± 54.42 | 63.27 ± 45.89 | 34.12 ± 23.23 | 32.39 ± 16.58 | 0.0251 | 0.0002 * | 0.0001 * | 0.1603 | 0.1251 | 0.9993 |
| Muscle TBF (mL/min/100 g) | 59.04 ± 17.76 | 35.47 ± 20.70 | 41.57 ± 29.15 | 32.38 ± 15.99 | 0.1509 | 0.3881 | 0.0841 | 0.8949 | 0.9842 | 0.7147 |
| Dif_TBF (mL/min/100 g) | 55.21 ± 42.06 | 27.80 ± 35.66 | −7.45 ± 11.20 | 0.02 ± 6.95 | 0.1409 | <0.0001 * | 0.0004 * | 0.0051 * | 0.0371 | 0.8748 |
| TBF ratio | 1.88 ± 0.59 | 2.22 ± 2.74 | 0.85 ± 0.20 | 1.02 ± 0.22 | 0.9673 | 0.5171 | 0.6610 | 0.1104 | 0.1953 | 0.9912 |
| PLD = 3025 ms | ||||||||||
| Lesion TBF (mL/min/100 g) | 158.80 ± 109.78 | 76.27 ± 52.69 | 43.10 ± 23.41 | 47.13 ± 26.76 | 0.0120 * | 0.0003 * | 0.0004 * | 0.3669 | 0.4807 | 0.9971 |
| Muscle TBF (mL/min/100 g) | 68.67 ± 17.70 | 46.86 ± 24.51 | 49.03 ± 24.49 | 47.50 ± 25.60 | 0.2731 | 0.3625 | 0.2979 | 0.9957 | 0.9999 | 0.9985 |
| Dif_TBF (mL/min/100 g) | 90.14 ± 92.73 | 29.41 ± 34.34 | −5.93 ± 12.34 | −0.37 ± 11.61 | 0.0116 * | <0.0001 * | 0.0001 * | 0.1047 | 0.2139 | 0.9826 |
| TBF ratio | 2.15 ± 0.87 | 1.65 ± 0.70 | 0.90 ± 0.26 | 1.03 ± 0.21 | 0.2362 | 0.0001 * | 0.0005 * | 0.0036 * | 0.0196 | 0.9247 |
| Malignant | Hypervascular Benign | Hypovascular Benign | Control | |
|---|---|---|---|---|
| PLD | p | p | p | p |
| 1025 ms | 0.0169 * | 0.0082 * | 0.1439 | 0.4509 |
| 1525 ms | 0.0084 * | 0.0184 * | 0.1131 | 0.9721 |
| 2025 ms | 0.0219 * | 0.0506 | 0.0916 | 0.5998 |
| 2525 ms | 0.0236 * | 0.0157 * | 0.0336 * | 0.9929 |
| 3025 ms | 0.0315 * | 0.0094 * | 0.1088 | 0.9105 |
Publisher’s Note: MDPI stays neutral with regard to jurisdictional claims in published maps and institutional affiliations. |
© 2022 by the authors. Licensee MDPI, Basel, Switzerland. This article is an open access article distributed under the terms and conditions of the Creative Commons Attribution (CC BY) license (https://creativecommons.org/licenses/by/4.0/).
Share and Cite
Lin, C.-H.; Hsieh, T.-J.; Chou, Y.-C.; Chen, C.K.-H. Feasibility of Arterial Spin Labeling Magnetic Resonance Imaging for Musculoskeletal Tumors with Optimized Post-Labeling Delay. Diagnostics 2022, 12, 2450. https://doi.org/10.3390/diagnostics12102450
Lin C-H, Hsieh T-J, Chou Y-C, Chen CK-H. Feasibility of Arterial Spin Labeling Magnetic Resonance Imaging for Musculoskeletal Tumors with Optimized Post-Labeling Delay. Diagnostics. 2022; 12(10):2450. https://doi.org/10.3390/diagnostics12102450
Chicago/Turabian StyleLin, Chien-Hung, Tsyh-Jyi Hsieh, Yi-Chen Chou, and Clement Kuen-Huang Chen. 2022. "Feasibility of Arterial Spin Labeling Magnetic Resonance Imaging for Musculoskeletal Tumors with Optimized Post-Labeling Delay" Diagnostics 12, no. 10: 2450. https://doi.org/10.3390/diagnostics12102450