
Detecting Parkinson’s Disease through Gait Measures Using Machine Learning
Abstract
:1. Introduction
2. Materials and Methods
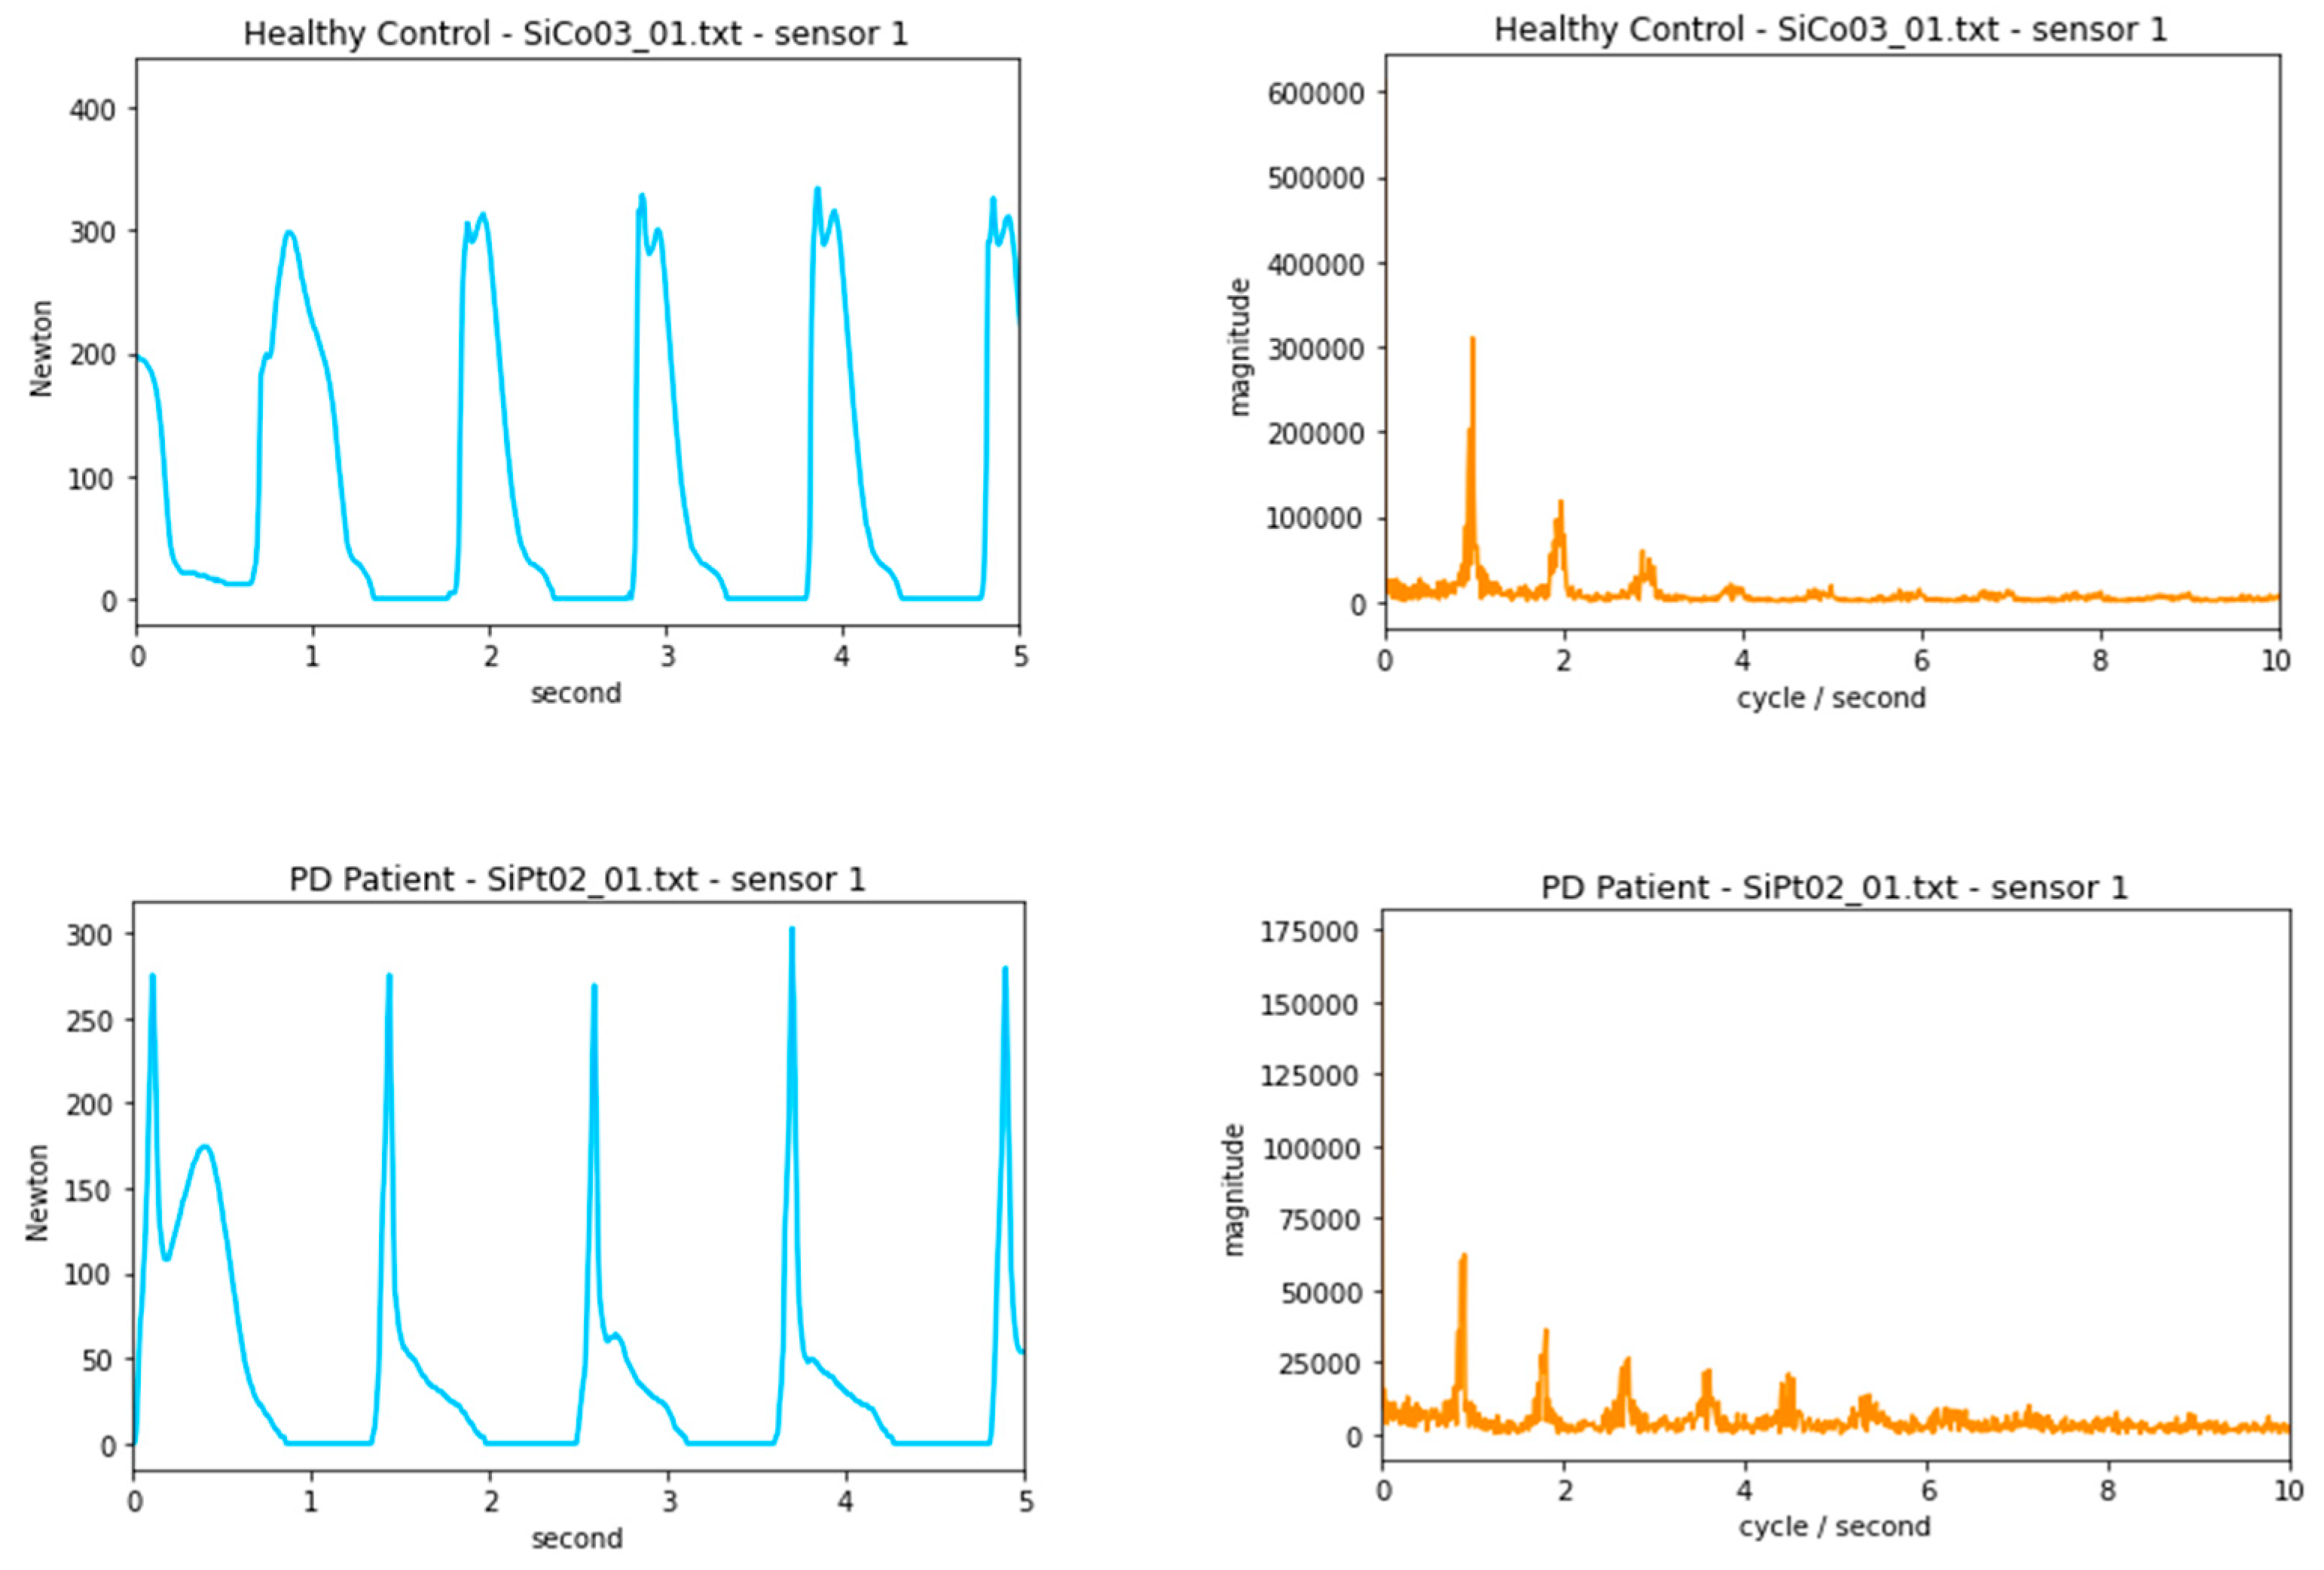
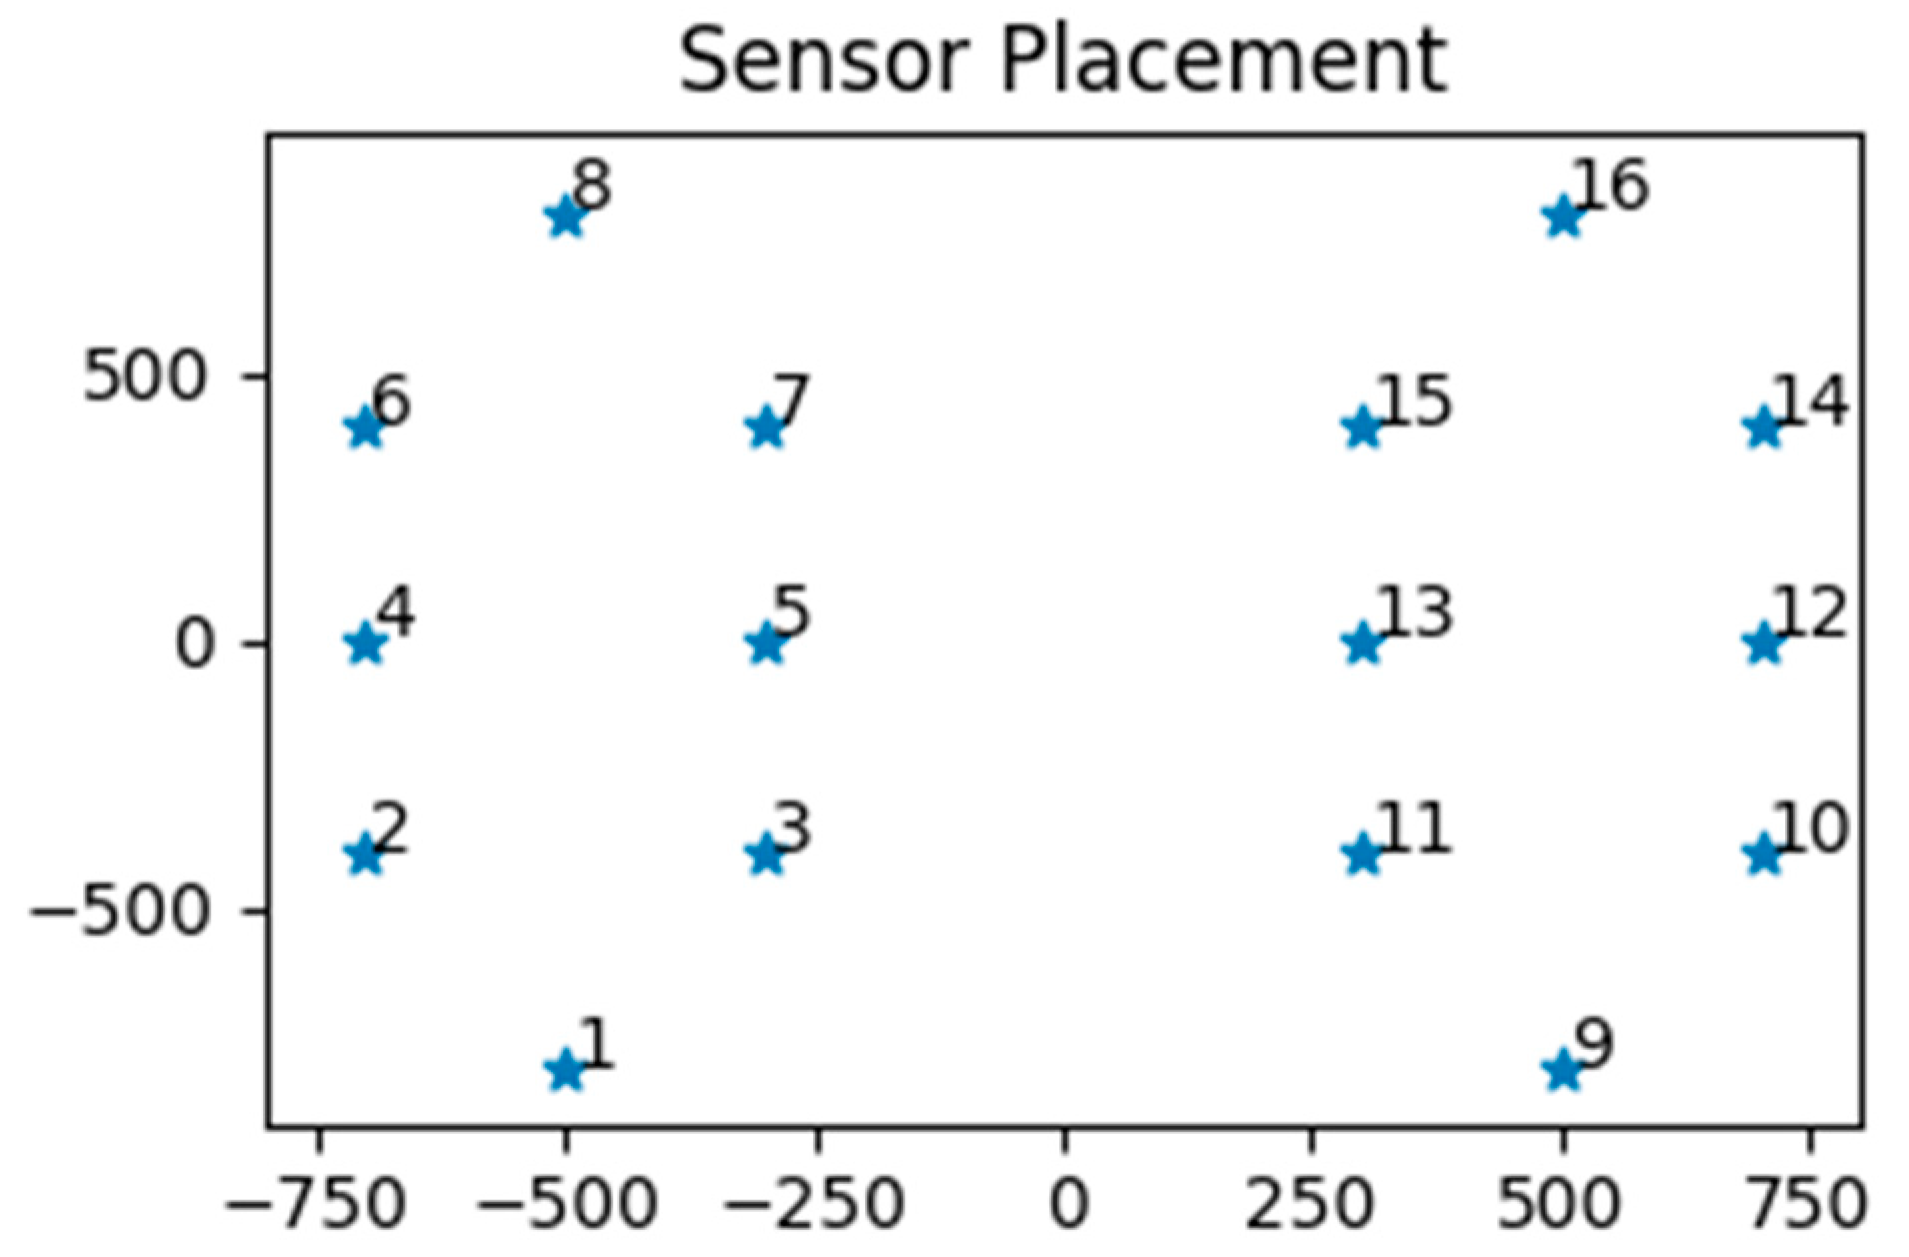
2.1. Dataset and Features
2.2. Baseline Model
2.3. Frequency Domain
2.4. Decision Tree, K-Nearest Neighbors, Convolutional Neural Networks
2.5. Limited Dataset
- Sides-Only: all except sensors 1, 8, 9, 16
- Exclude-Diagonals: sensors 1, 4, 5, 8, 9, 12, 13, 16

3. Results
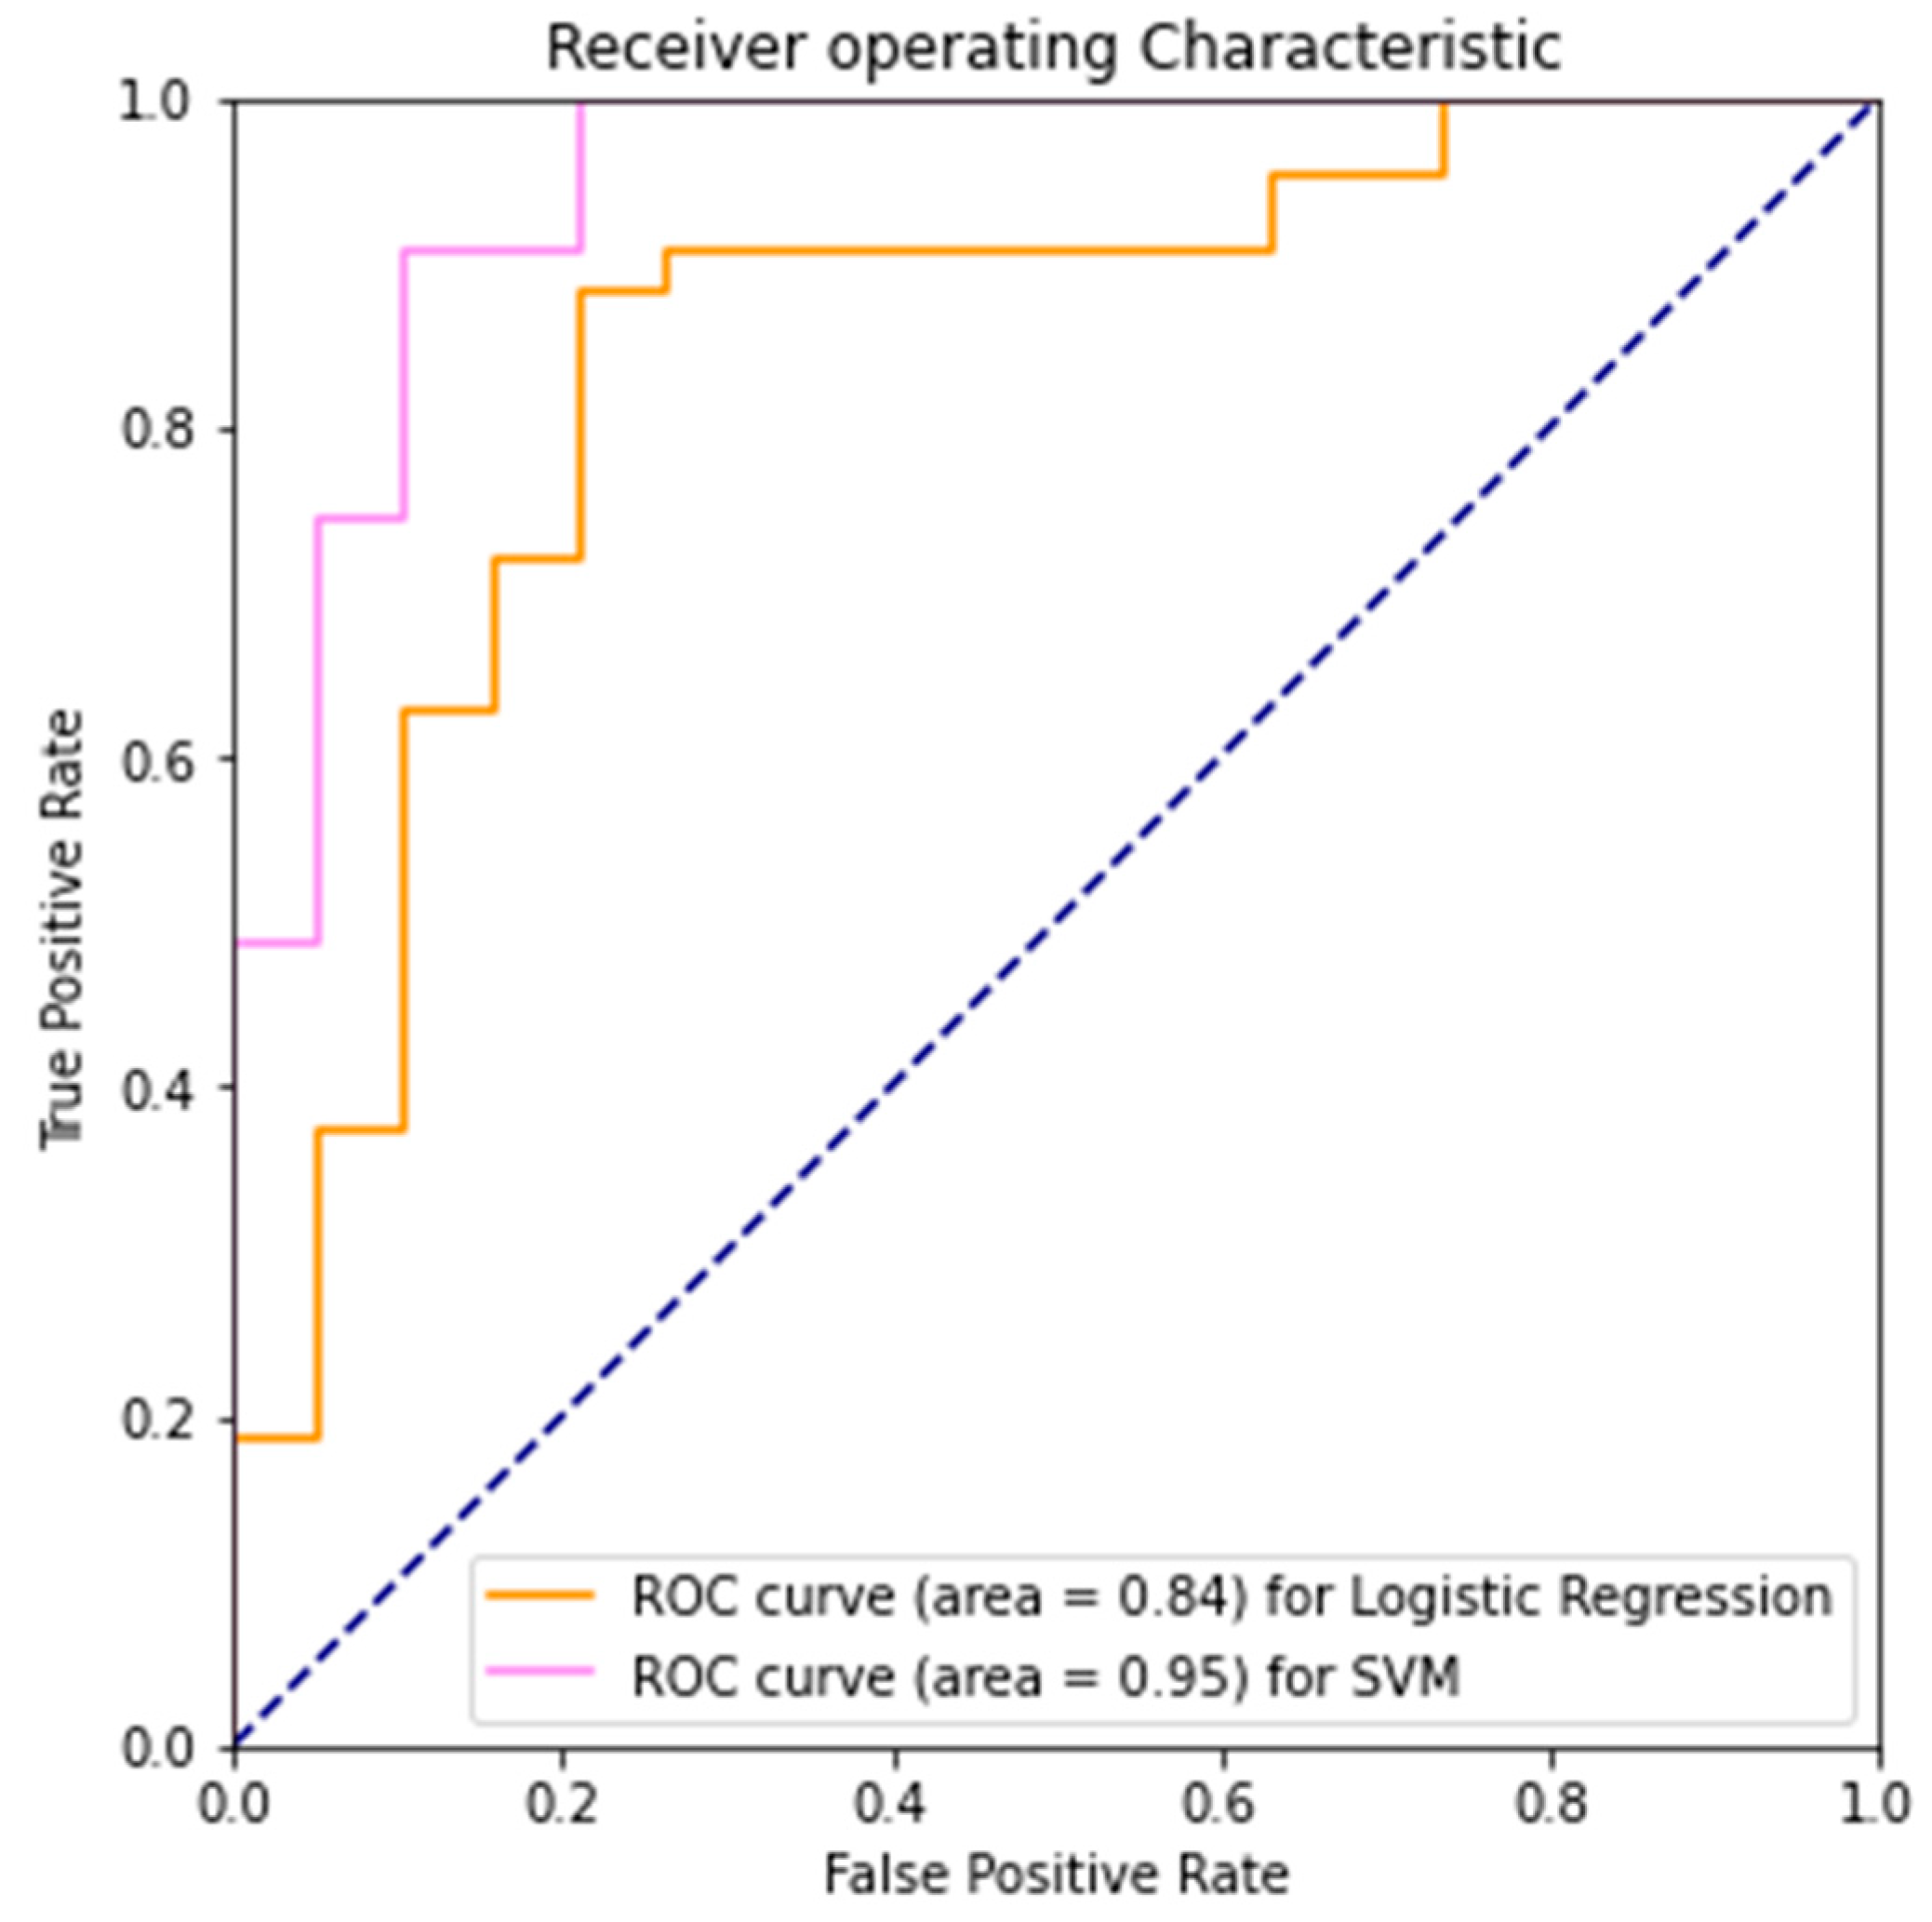
3.1. Baseline Model
- -
- True Negative (TN): healthy control correctly identified
- -
- False Positive (FP): healthy control incorrectly identified as PD
- -
- True Positive (TP): PD patient correctly identified
- -
- False Negative (FN): PD patient incorrectly identified as healthy control
- -
- And the metrics
- -
- Precision = TP/(TP + FP)
- -
- Recall = TP/(TP + FN)
- -
- False Positive Rate = FP/(FP + TN).
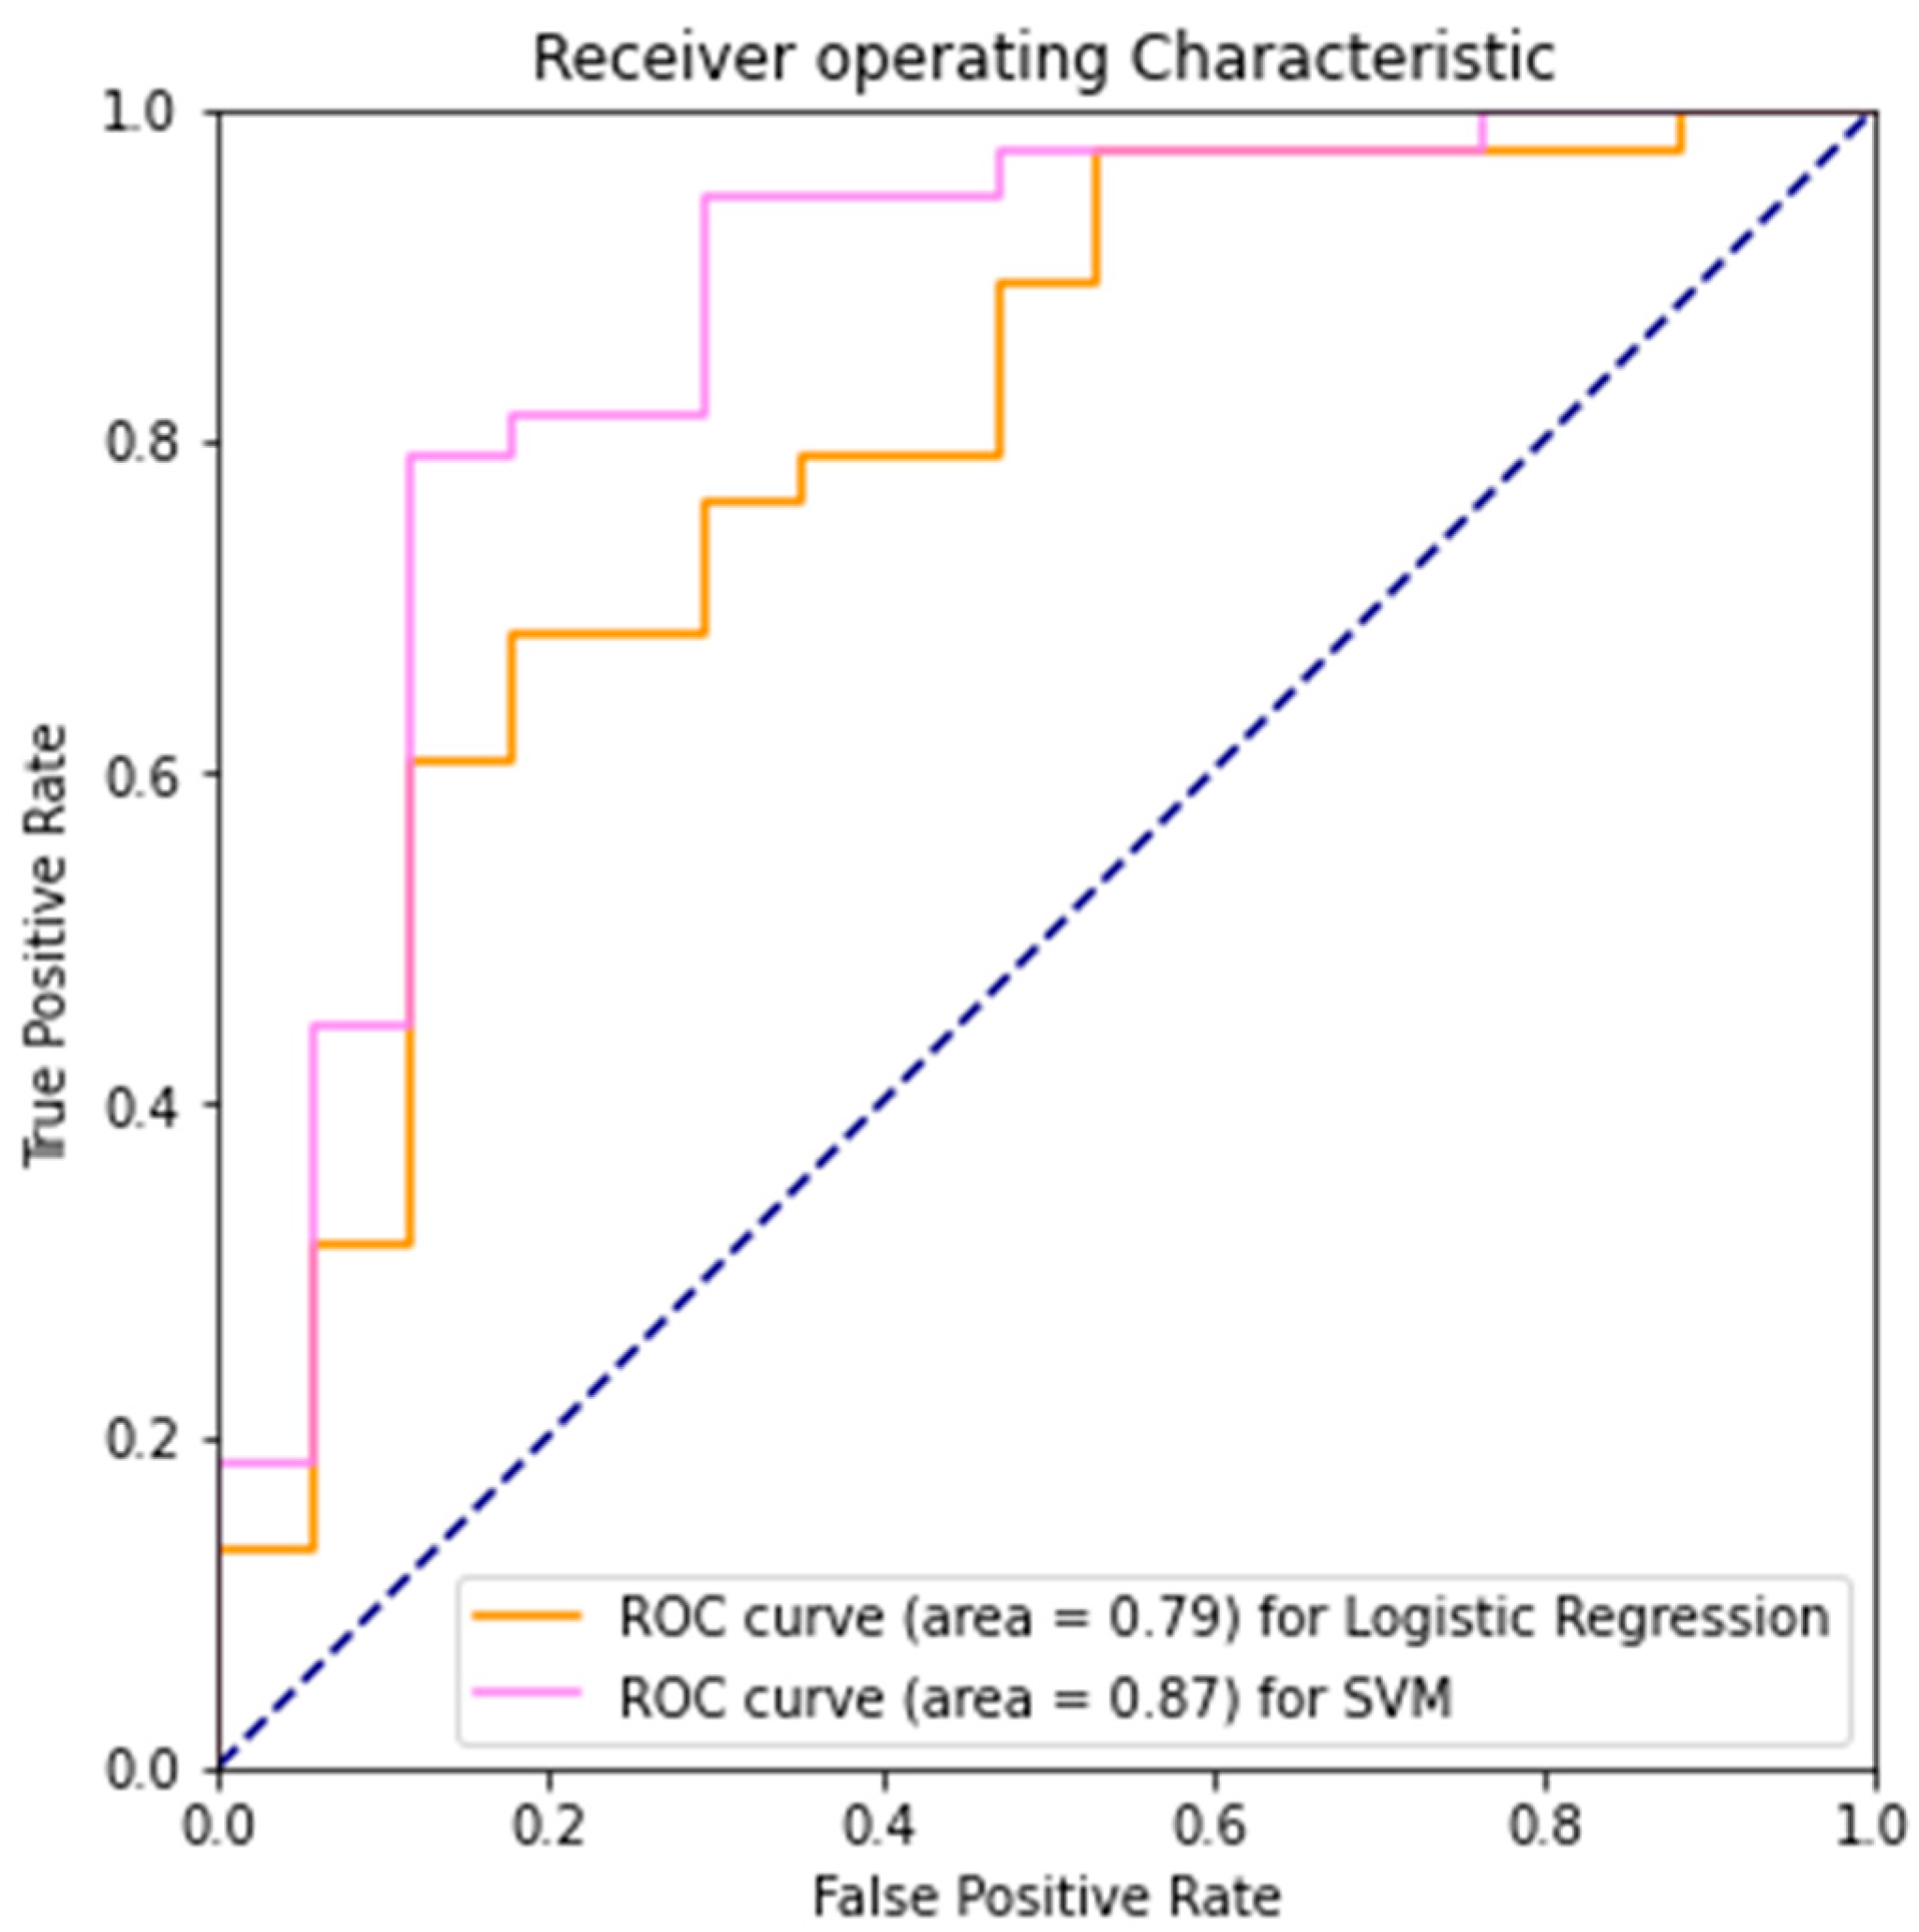
3.2. Frequency Domain
3.3. Decision Tree
3.4. K-Nearest Neighbors
3.5. Limited Dataset
4. Discussion
Supplementary Materials
Author Contributions
Funding
Institutional Review Board Statement
Informed Consent Statement
Data Availability Statement
Conflicts of Interest
References
- Gelb, D.J.; Oliver, E.; Gilman, S. Diagnostic Criteria for Parkinson Disease. Arch. Neurol. 1999, 56, 33–39. [Google Scholar] [CrossRef]
- França, C.; Duarte, K.P.; Cury, R.G. Dynamic Tremor in a Patient With Parkinson Disease. JAMA Neurol. 2021, 78, 1015. [Google Scholar] [CrossRef]
- Parkinson’s Foundation. Better Lives. Together. Available online: https://www.parkinson.org/ (accessed on 20 June 2022).
- Jankovic, J. Parkinson’s disease: Clinical features and diagnosis. J. Neurol. Neurosurg. Psychiatry 2008, 79, 368–376. [Google Scholar] [CrossRef] [PubMed] [Green Version]
- Tolosa, E.; Garrido, A.; Scholz, S.W.; Poewe, W. Challenges in the diagnosis of Parkinson’s disease. Lancet Neurol. 2021, 20, 385–397. [Google Scholar] [CrossRef]
- Tolosa, E.; Wenning, G.; Poewe, W. The diagnosis of Parkinson’s disease. Lancet Neurol. 2006, 5, 75–86. [Google Scholar] [CrossRef]
- Pagano, G.; Niccolini, F.; Politis, M. Imaging in Parkinson’s disease. Clin. Med. Lond. Engl. 2016, 16, 371–375. [Google Scholar] [CrossRef]
- Zhou, Y.; Tagare, H.D. Self-normalized Classification of Parkinson’s Disease DaTscan Images. In Proceedings of the 2021 IEEE International Conference on Bioinformatics and Biomedicine (BIBM), Houston, TX, USA, 9–12 December 2021; pp. 1205–1212. [Google Scholar]
- Isaacson, J.R.; Brillman, S.; Chhabria, N.; Isaacson, S.H. Impact of DaTscan Imaging on Clinical Decision Making in Clinically Uncertain Parkinson’s Disease. J. Park. Dis. 2021, 11, 885–889. [Google Scholar] [CrossRef] [PubMed]
- Sadasivan, S.; Friedman, J.H. Experience with DaTscan at a tertiary referral center. Parkinsonism Relat. Disord. 2015, 21, 42–45. [Google Scholar] [CrossRef]
- Rajput, A.H.; Rajput, A. Accuracy of Parkinson disease diagnosis unchanged in 2 decades. Neurology 2014, 83, 386–387. [Google Scholar] [CrossRef]
- Tolosa, E.; Gaig, C.; Santamaría, J.; Compta, Y. Diagnosis and the premotor phase of Parkinson disease. Neurology 2009, 72, S12–S20. [Google Scholar] [CrossRef]
- Mahlknecht, P.; Seppi, K.; Poewe, W. The Concept of Prodromal Parkinson’s Disease. J. Park. Dis. 2015, 5, 681–697. [Google Scholar] [CrossRef] [Green Version]
- Hausdorff, J.M.; Lowenthal, J.; Herman, T.; Gruendlinger, L.; Peretz, C.; Giladi, N. Rhythmic auditory stimulation modulates gait variability in Parkinson’s disease. Eur. J. Neurosci. 2007, 26, 2369–2375. [Google Scholar] [CrossRef] [PubMed]
- Frenkel-Toledo, S.; Giladi, N.; Peretz, C.; Herman, T.; Gruendlinger, L.; Hausdorff, J.M. Effect of gait speed on gait rhythmicity in Parkinson’s disease: Variability of stride time and swing time respond differently. J. Neuroeng. Rehabil. 2005, 2, 23. [Google Scholar] [CrossRef] [PubMed] [Green Version]
- Bailey, C.A.; Corona, F.; Murgia, M.; Pili, R.; Pau, M.; Côté, J.N. Electromyographical Gait Characteristics in Parkinson’s Disease: Effects of Combined Physical Therapy and Rhythmic Auditory Stimulation. Front. Neurol. 2018, 9, 211. [Google Scholar] [CrossRef] [PubMed]
- McIntosh, G.C.; Brown, S.H.; Rice, R.R.; Thaut, M.H. Rhythmic auditory-motor facilitation of gait patterns in patients with Parkinson’s disease. J. Neurol. Neurosurg. Psychiatry 1997, 62, 22–26. [Google Scholar] [CrossRef] [PubMed] [Green Version]
- Yogev, G.; Giladi, N.; Peretz, C.; Springer, S.; Simon, E.S.; Hausdorff, J.M. Dual tasking, gait rhythmicity, and Parkinson’s disease: Which aspects of gait are attention demanding? Eur. J. Neurosci. 2005, 22, 1248–1256. [Google Scholar] [CrossRef] [PubMed]
- Banda, J.M.; Sarraju, A.; Abbasi, F.; Parizo, J.; Pariani, M.; Ison, H.; Briskin, E.; Wand, H.; Dubois, S.; Jung, K.; et al. Finding missed cases of familial hypercholesterolemia in health systems using machine learning. NPJ Digit. Med. 2019, 2, 23. [Google Scholar] [CrossRef] [Green Version]
- Boutet, A.; Madhavan, R.; Elias, G.J.B.; Joel, S.E.; Gramer, R.; Ranjan, M.; Paramanandam, V.; Xu, D.; Germann, J.; Loh, A.; et al. Predicting optimal deep brain stimulation parameters for Parkinson’s disease using functional MRI and machine learning. Nat. Commun. 2021, 12, 3043. [Google Scholar] [CrossRef]
- Landolfi, A.; Ricciardi, C.; Donisi, L.; Cesarelli, G.; Troisi, J.; Vitale, C.; Barone, P.; Amboni, M. Machine Learning Approaches in Parkinson’s Disease. Curr. Med. Chem. 2021, 28, 6548–6568. [Google Scholar] [CrossRef] [PubMed]
- Karapinar Senturk, Z. Early diagnosis of Parkinson’s disease using machine learning algorithms. Med. Hypotheses 2020, 138, 109603. [Google Scholar] [CrossRef]
- Drotár, P.; Mekyska, J.; Rektorová, I.; Masarová, L.; Smékal, Z.; Faundez-Zanuy, M. Decision support framework for Parkinson’s disease based on novel handwriting markers. IEEE Trans. Neural Syst. Rehabil. Eng. Publ. IEEE Eng. Med. Biol. Soc. 2015, 23, 508–516. [Google Scholar] [CrossRef]
- Segovia, F.; Górriz, J.M.; Ramírez, J.; Martínez-Murcia, F.J.; Castillo-Barnes, D. Assisted Diagnosis of Parkinsonism Based on the Striatal Morphology. Int. J. Neural Syst. 2019, 29, 1950011. [Google Scholar] [CrossRef] [Green Version]
- Váradi, C.; Nehéz, K.; Hornyák, O.; Viskolcz, B.; Bones, J. Serum N-Glycosylation in Parkinson’s Disease: A Novel Approach for Potential Alterations. Mol. Basel Switz. 2019, 24, 2220. [Google Scholar] [CrossRef] [Green Version]
- Ma, C.; Ouyang, J.; Chen, H.-L.; Zhao, X.-H. An efficient diagnosis system for Parkinson’s disease using kernel-based extreme learning machine with subtractive clustering features weighting approach. Comput. Math. Methods Med. 2014, 2014, 985789. [Google Scholar] [CrossRef] [Green Version]
- Jeon, H.-S.; Han, J.; Yi, W.-J.; Jeon, B.; Park, K.S. Classification of Parkinson gait and normal gait using Spatial-Temporal Image of Plantar pressure. In Proceedings of the 2008 30th Annual International Conference of the IEEE Engineering in Medicine and Biology Society, Vancouver, BC, Canada, 20–25 August 2008; pp. 4672–4675. [Google Scholar]
- Zhao, A.; Qi, L.; Li, J.; Dong, J.; Yu, H. A hybrid spatio-temporal model for detection and severity rating of Parkinson’s disease from gait data. Neurocomputing 2018, 315, 1–8. [Google Scholar] [CrossRef] [Green Version]
- El Maachi, I.; Bilodeau, G.-A.; Bouachir, W. Deep 1D-Convnet for accurate Parkinson disease detection and severity prediction from gait. Expert Syst. Appl. 2020, 143, 113075. [Google Scholar] [CrossRef]
- Goldberger, A.L.; Amaral, L.A.; Glass, L.; Hausdorff, J.M.; Ivanov, P.C.; Mark, R.G.; Mietus, J.E.; Moody, G.B.; Peng, C.K.; Stanley, H.E. PhysioBank, PhysioToolkit, and PhysioNet: Components of a new research resource for complex physiologic signals. Circulation 2000, 101, E215–E220. [Google Scholar] [CrossRef] [Green Version]
- Frenkel-Toledo, S.; Giladi, N.; Peretz, C.; Herman, T.; Gruendlinger, L.; Hausdorff, J.M. Treadmill walking as an external pacemaker to improve gait rhythm and stability in Parkinson’s disease. Mov. Disord. Off. J. Mov. Disord. Soc. 2005, 20, 1109–1114. [Google Scholar] [CrossRef] [PubMed]
- Tudor-Locke, C.; Aguiar, E.J.; Han, H.; Ducharme, S.W.; Schuna, J.M.; Barreira, T.V.; Moore, C.C.; Busa, M.A.; Lim, J.; Sirard, J.R.; et al. Walking cadence (steps/min) and intensity in 21–40 year olds: CADENCE-adults. Int. J. Behav. Nutr. Phys. Act. 2019, 16, 8. [Google Scholar] [CrossRef] [PubMed] [Green Version]
- Snijders, A.H.; van de Warrenburg, B.P.; Giladi, N.; Bloem, B.R. Neurological gait disorders in elderly people: Clinical approach and classification. Lancet Neurol. 2007, 6, 63–74. [Google Scholar] [CrossRef]
- Hausdorff, J.M. Gait variability: Methods, modeling and meaning. J. Neuroeng. Rehabil. 2005, 2, 19. [Google Scholar] [CrossRef] [PubMed] [Green Version]
- Alexander, R.M.; Jayes, A.S. Fourier analysis of forces exerted in walking and running. J. Biomech. 1980, 13, 383–390. [Google Scholar] [CrossRef]
- Pedregosa, F.; Varoquaux, G.; Gramfort, A.; Michel, V.; Thirion, B.; Grisel, O.; Blondel, M.; Prettenhofer, P.; Weiss, R.; Dubourg, V.; et al. Scikit-learn: Machine Learning in Python. J. Mach. Learn. Res. 2011, 12, 2825–2830. [Google Scholar]
- Breiman, L.; Friedman, J.H.; Olshen, R.A.; Stone, C.J. Classification and Regression Trees; Routledge: New York, NY, USA, 2017; ISBN 978-1-315-13947-0. [Google Scholar]
- Zhang, Z. Introduction to machine learning: K-nearest neighbors. Ann. Transl. Med. 2016, 4, 218. [Google Scholar] [CrossRef] [PubMed] [Green Version]
- The Discrete Fourier Transform |2| The Transform and Data Compressio. Available online: https://www.taylorfrancis.com/chapters/mono/10.1201/9781315220529-2/discrete-fourier-transform-kamisetty-ramam-rao-patrick-yip?context=ubx&refId=1951c981-b380-41a1-872b-ead013f6f1be (accessed on 17 July 2022).
- Beauchet, O.; Allali, G.; Annweiler, C.; Bridenbaugh, S.; Assal, F.; Kressig, R.W.; Herrmann, F.R. Gait variability among healthy adults: Low and high stride-to-stride variability are both a reflection of gait stability. Gerontology 2009, 55, 702–706. [Google Scholar] [CrossRef]


| Accuracy Mean (SD) n = 10 | Precision Mean (SD) n = 10 | Recall Mean (SD) n = 10 | False Positive Rate Mean (SD) n = 10 | ||
|---|---|---|---|---|---|
| Baseline model | LR | 0.81 (0.03) | 0.81 (0.03) | 0.95 (0.03) | 0.52 (0.09) |
| SVM | 0.85 (0.03) | 0.86 (0.03) | 0.94 (0.04) | 0.35 (0.09) | |
| Frequency domain | LR | 0.80 (0.04) | 0.84 (0.03) | 0.88 (0.05) | 0.37 (0.09) |
| SVM | 0.84 (0.03) | 0.84 (0.03) | 0.95 (0.05) | 0.41 (0.10) | |
| DT | 0.60 (0.06) | 0.71 (0.04) | 0.70 (0.08) | 0.64 (0.12) | |
| KNN | 0.70 (0.05) | 0.73 (0.03) | 0.91 (0.05) | 0.75 (0.10) |
| Accuracy Mean (SD) n = 10 | Precision Mean (SD) n = 10 | Recall Mean (SD) n = 10 | False Positive Rate Mean (SD) n = 10 | |||
|---|---|---|---|---|---|---|
| Sides-Only | Baseline model | LR | 0.80 (0.03) | 0.79 (0.03) | 0.97 (0.02) | 0.60 (0.10) |
| SVM | 0.84 (0.06) | 0.87 (0.04) | 0.90 (0.06) | 0.30 (0.10) | ||
| DT | 0.59 (0.08) | 0.70 (0.06) | 0.69 (0.10) | 0.65 (0.15) | ||
| KNN | 0.62 (0.06) | 0.73 (0.04) | 0.71 (0.08) | 0.57 (0.09) | ||
| Exclude-Diagonals | Baseline model | LR | 0.78 (0.04) | 0.78 (0.03) | 0.94 (0.05) | 0.59 (0.09) |
| SVM | 0.85 (0.03) | 0.87 (0.02) | 0.92 (0.03) | 0.32 (0.06) | ||
| DT | 0.60 (0.05) | 0.71 (0.04) | 0.73 (0.06) | 0.68 (0.12) | ||
| KNN | 0.68 (0.03) | 0.69 (0.01) | 0.98 (0.03) | 0.98 (0.04) |
Publisher’s Note: MDPI stays neutral with regard to jurisdictional claims in published maps and institutional affiliations. |
© 2022 by the authors. Licensee MDPI, Basel, Switzerland. This article is an open access article distributed under the terms and conditions of the Creative Commons Attribution (CC BY) license (https://creativecommons.org/licenses/by/4.0/).
Share and Cite
Li, A.; Li, C. Detecting Parkinson’s Disease through Gait Measures Using Machine Learning. Diagnostics 2022, 12, 2404. https://doi.org/10.3390/diagnostics12102404
Li A, Li C. Detecting Parkinson’s Disease through Gait Measures Using Machine Learning. Diagnostics. 2022; 12(10):2404. https://doi.org/10.3390/diagnostics12102404
Chicago/Turabian StyleLi, Alex, and Chenyu Li. 2022. "Detecting Parkinson’s Disease through Gait Measures Using Machine Learning" Diagnostics 12, no. 10: 2404. https://doi.org/10.3390/diagnostics12102404