
Dilated Semantic Segmentation for Breast Ultrasonic Lesion Detection Using Parallel Feature Fusion


 , , and
Abstract
:1. Introduction
- A dilated semantic segmentation network with weighted pixel counts.
- The segmentation method enhanced with the erosion operation.
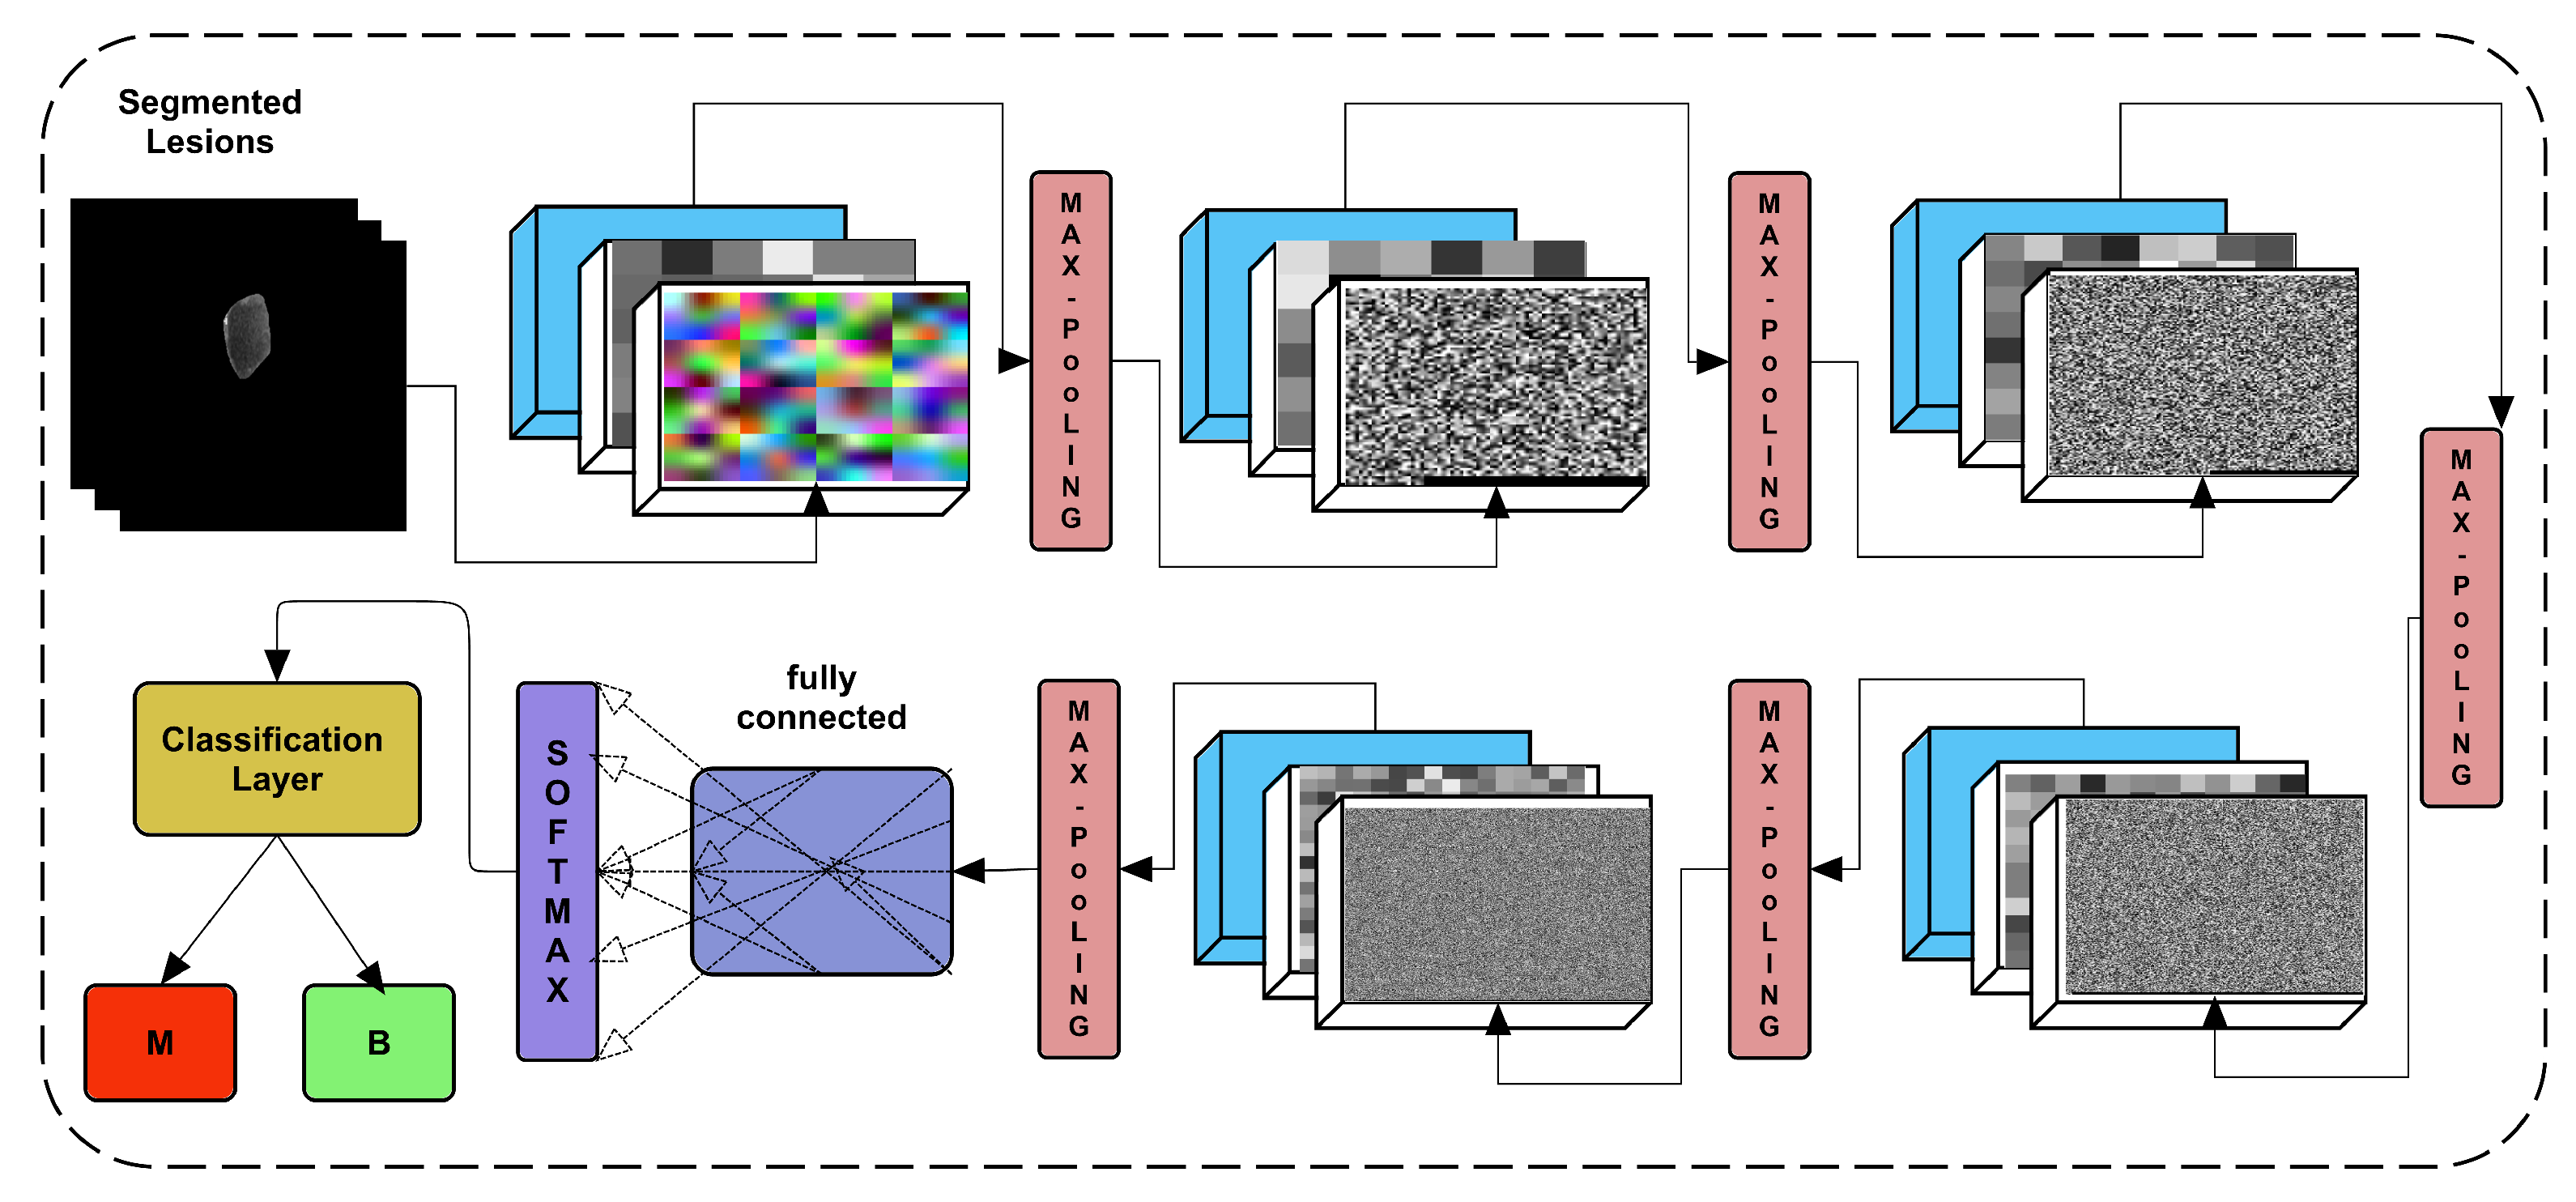
- Dense features are extracted from the proposed 24-layer CNN, which uses transfer learning to transfer the enriched features to the next layer.
- The fusion of the obtained feature vectors from the segmented image through the Di-CNN.
2. Related Work
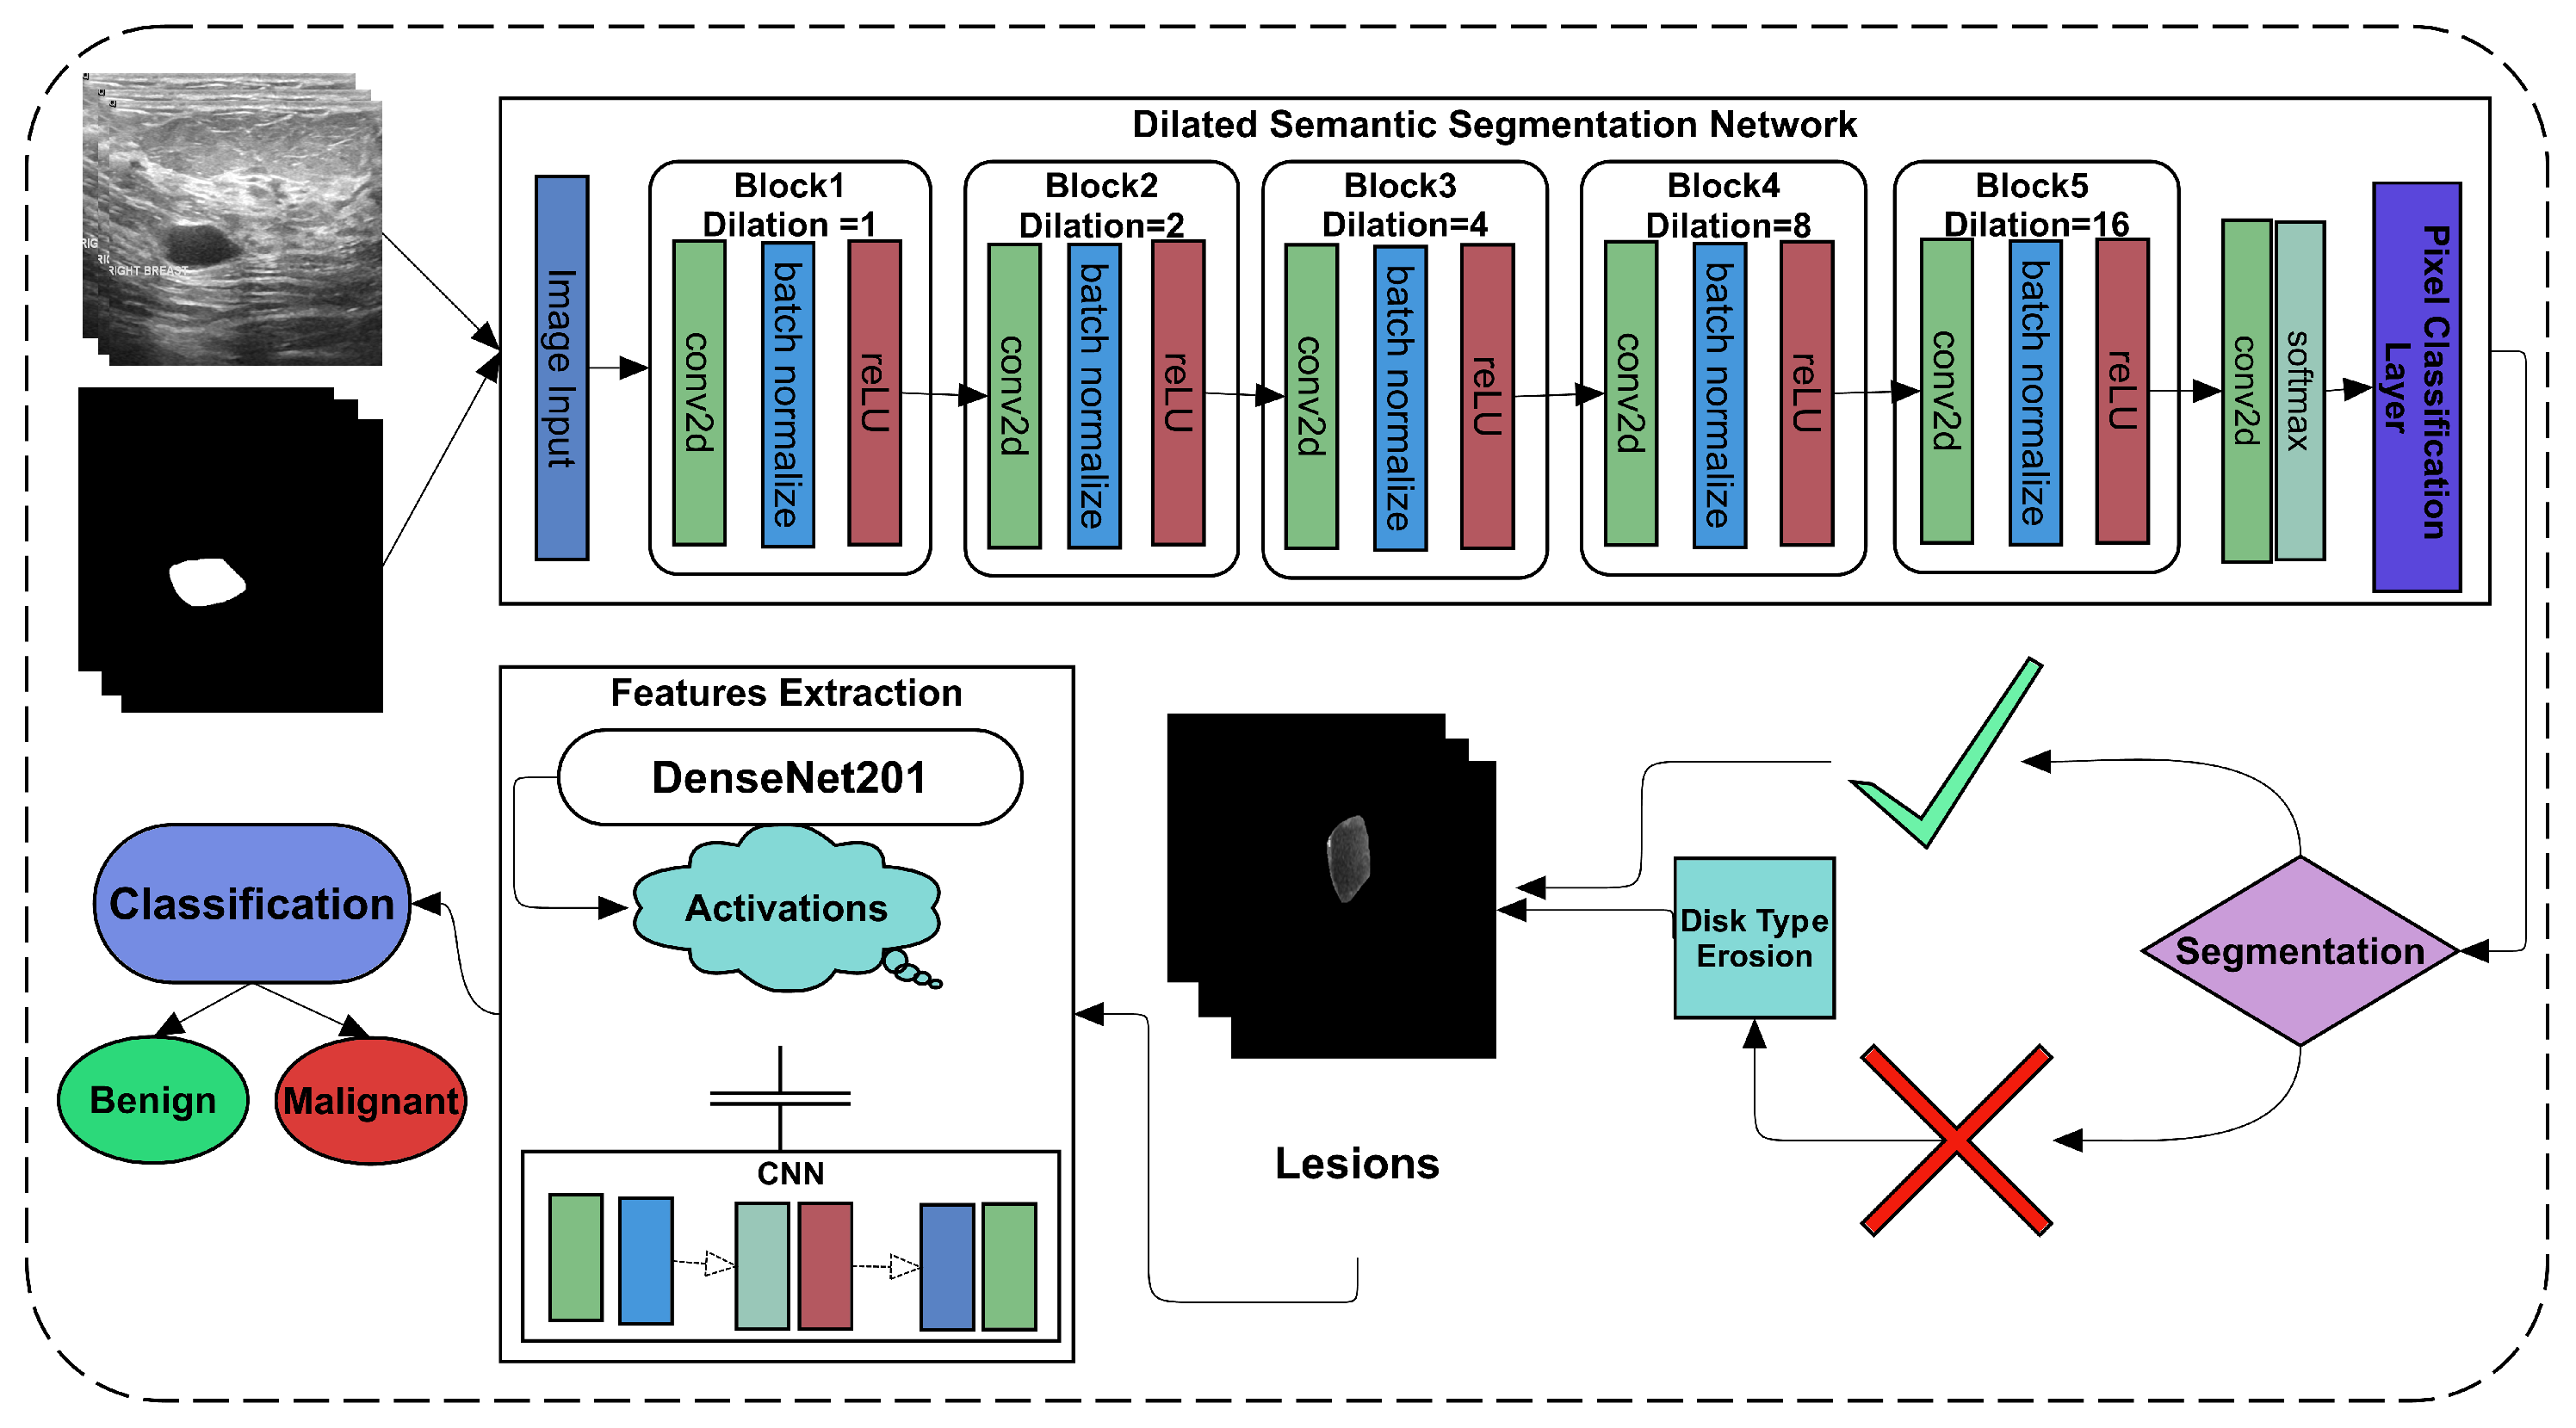
3. Methodology
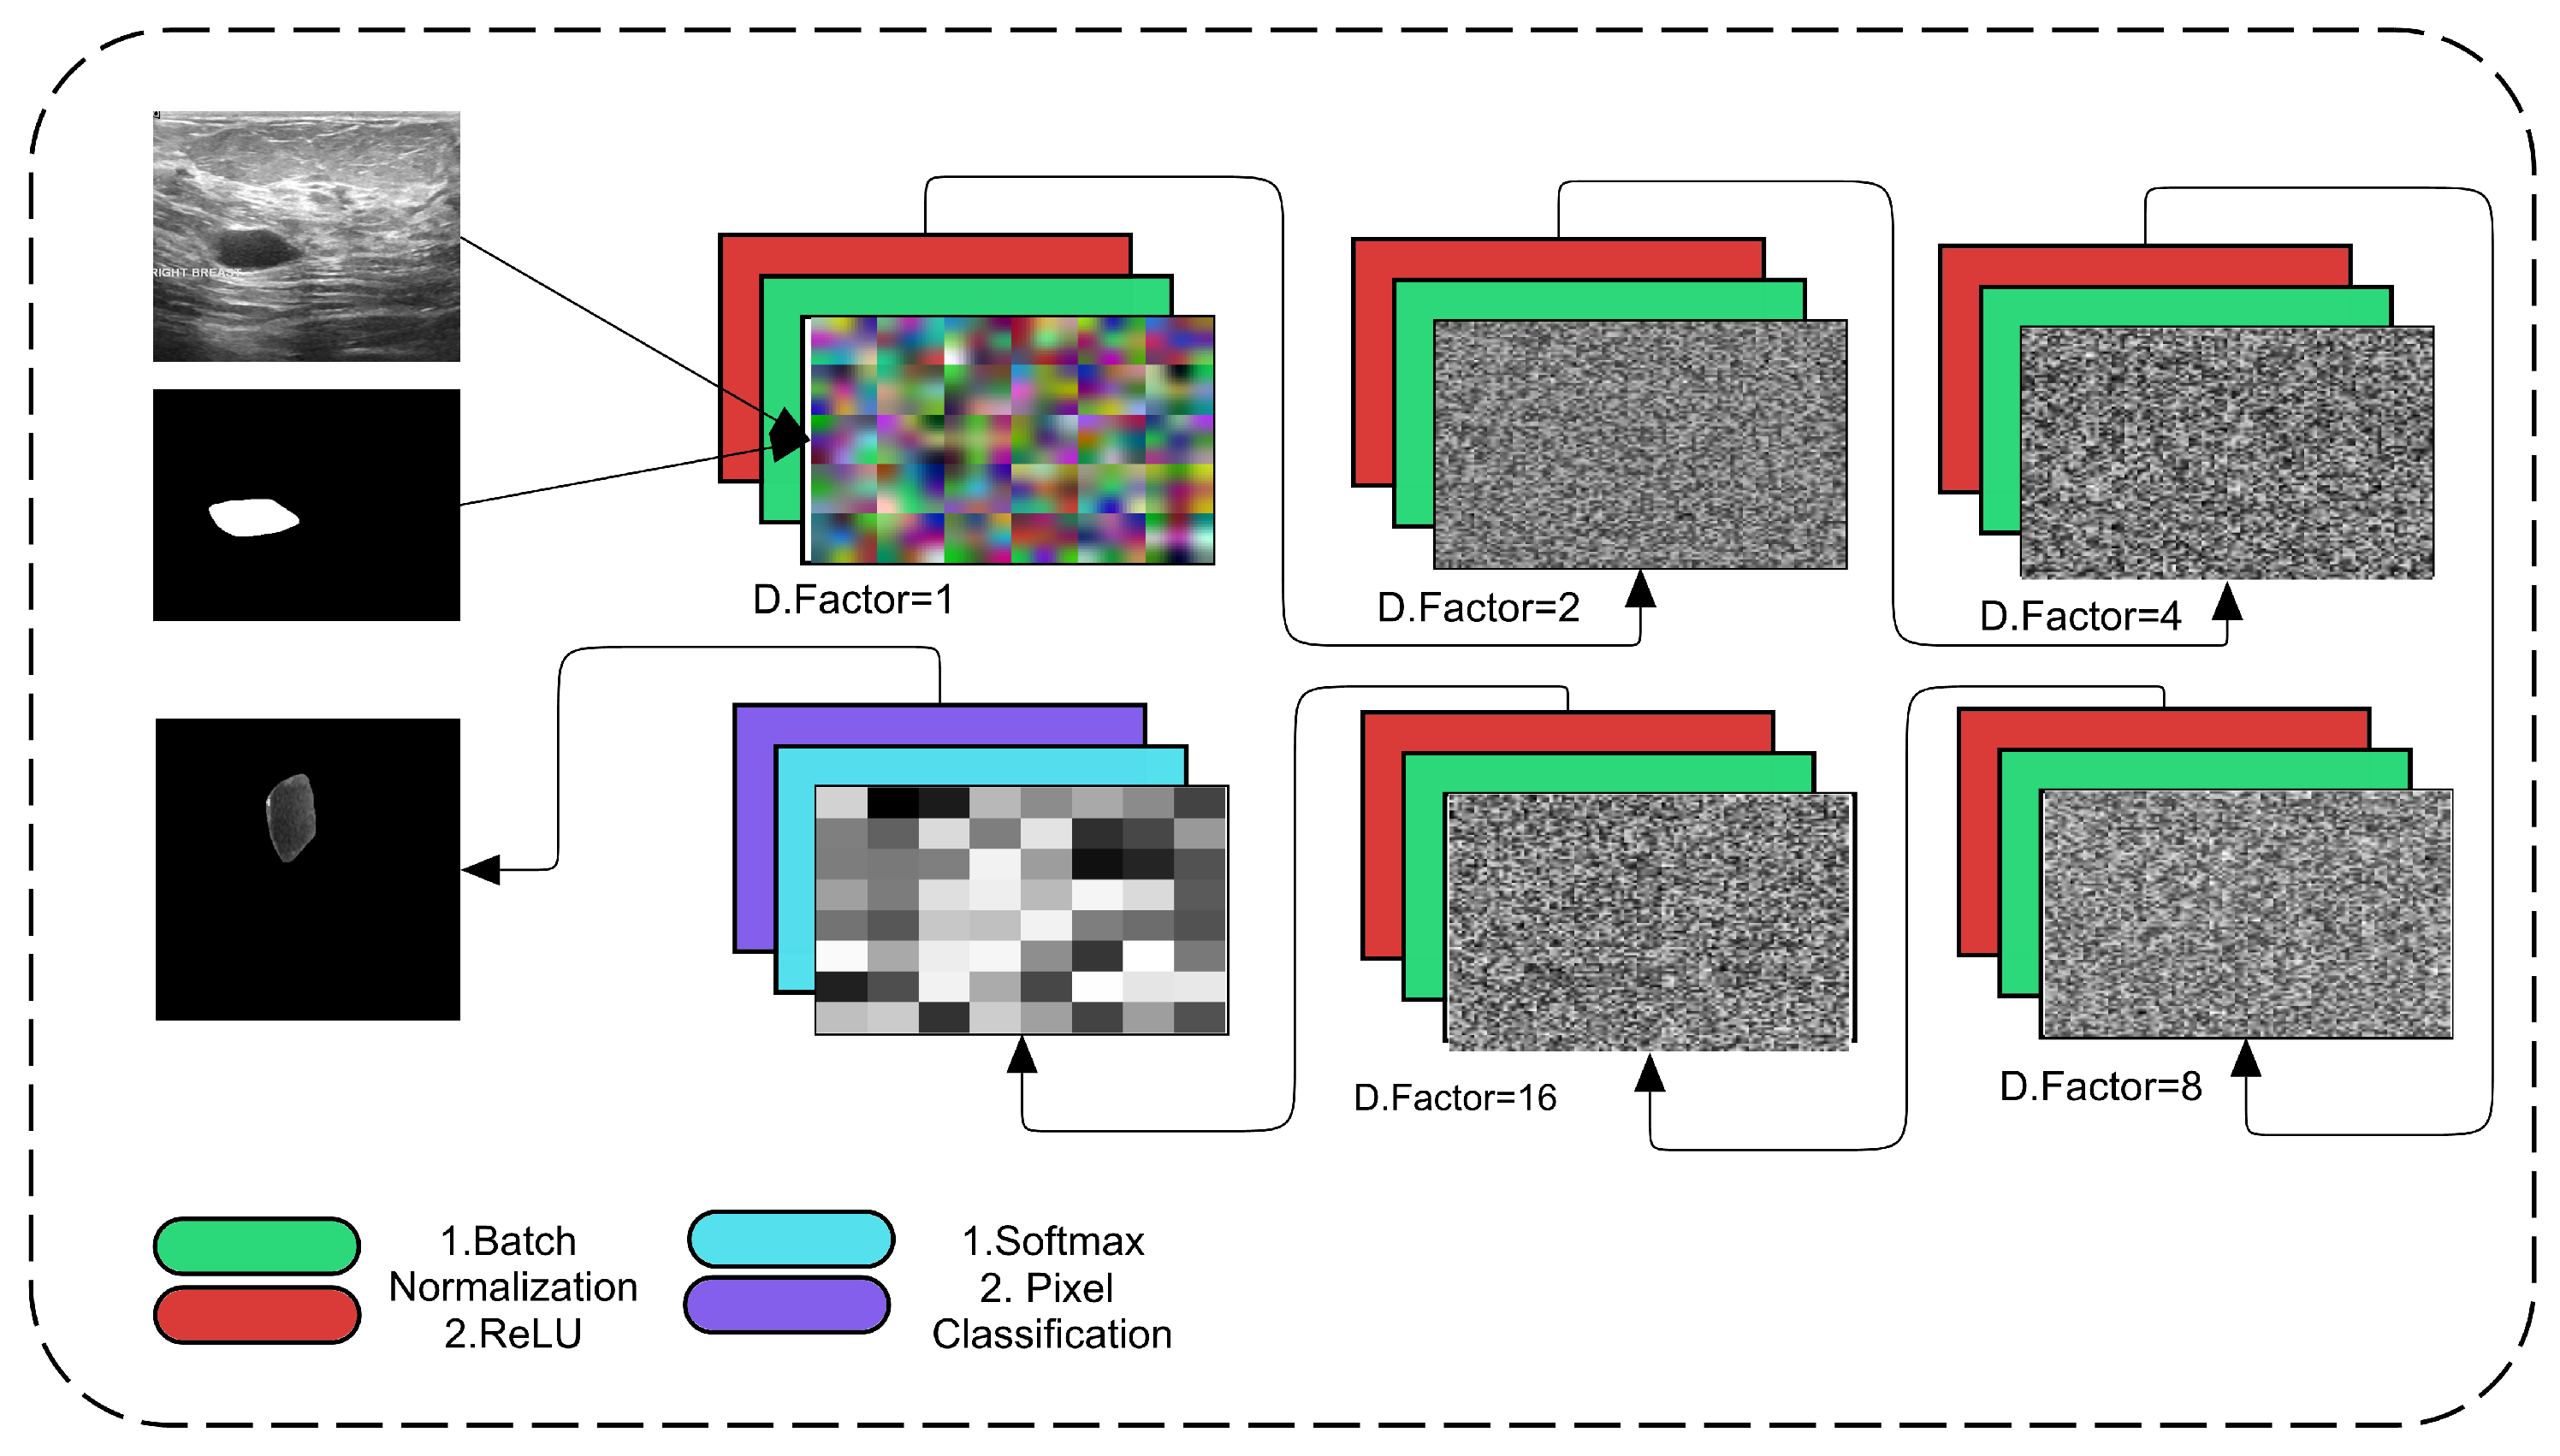
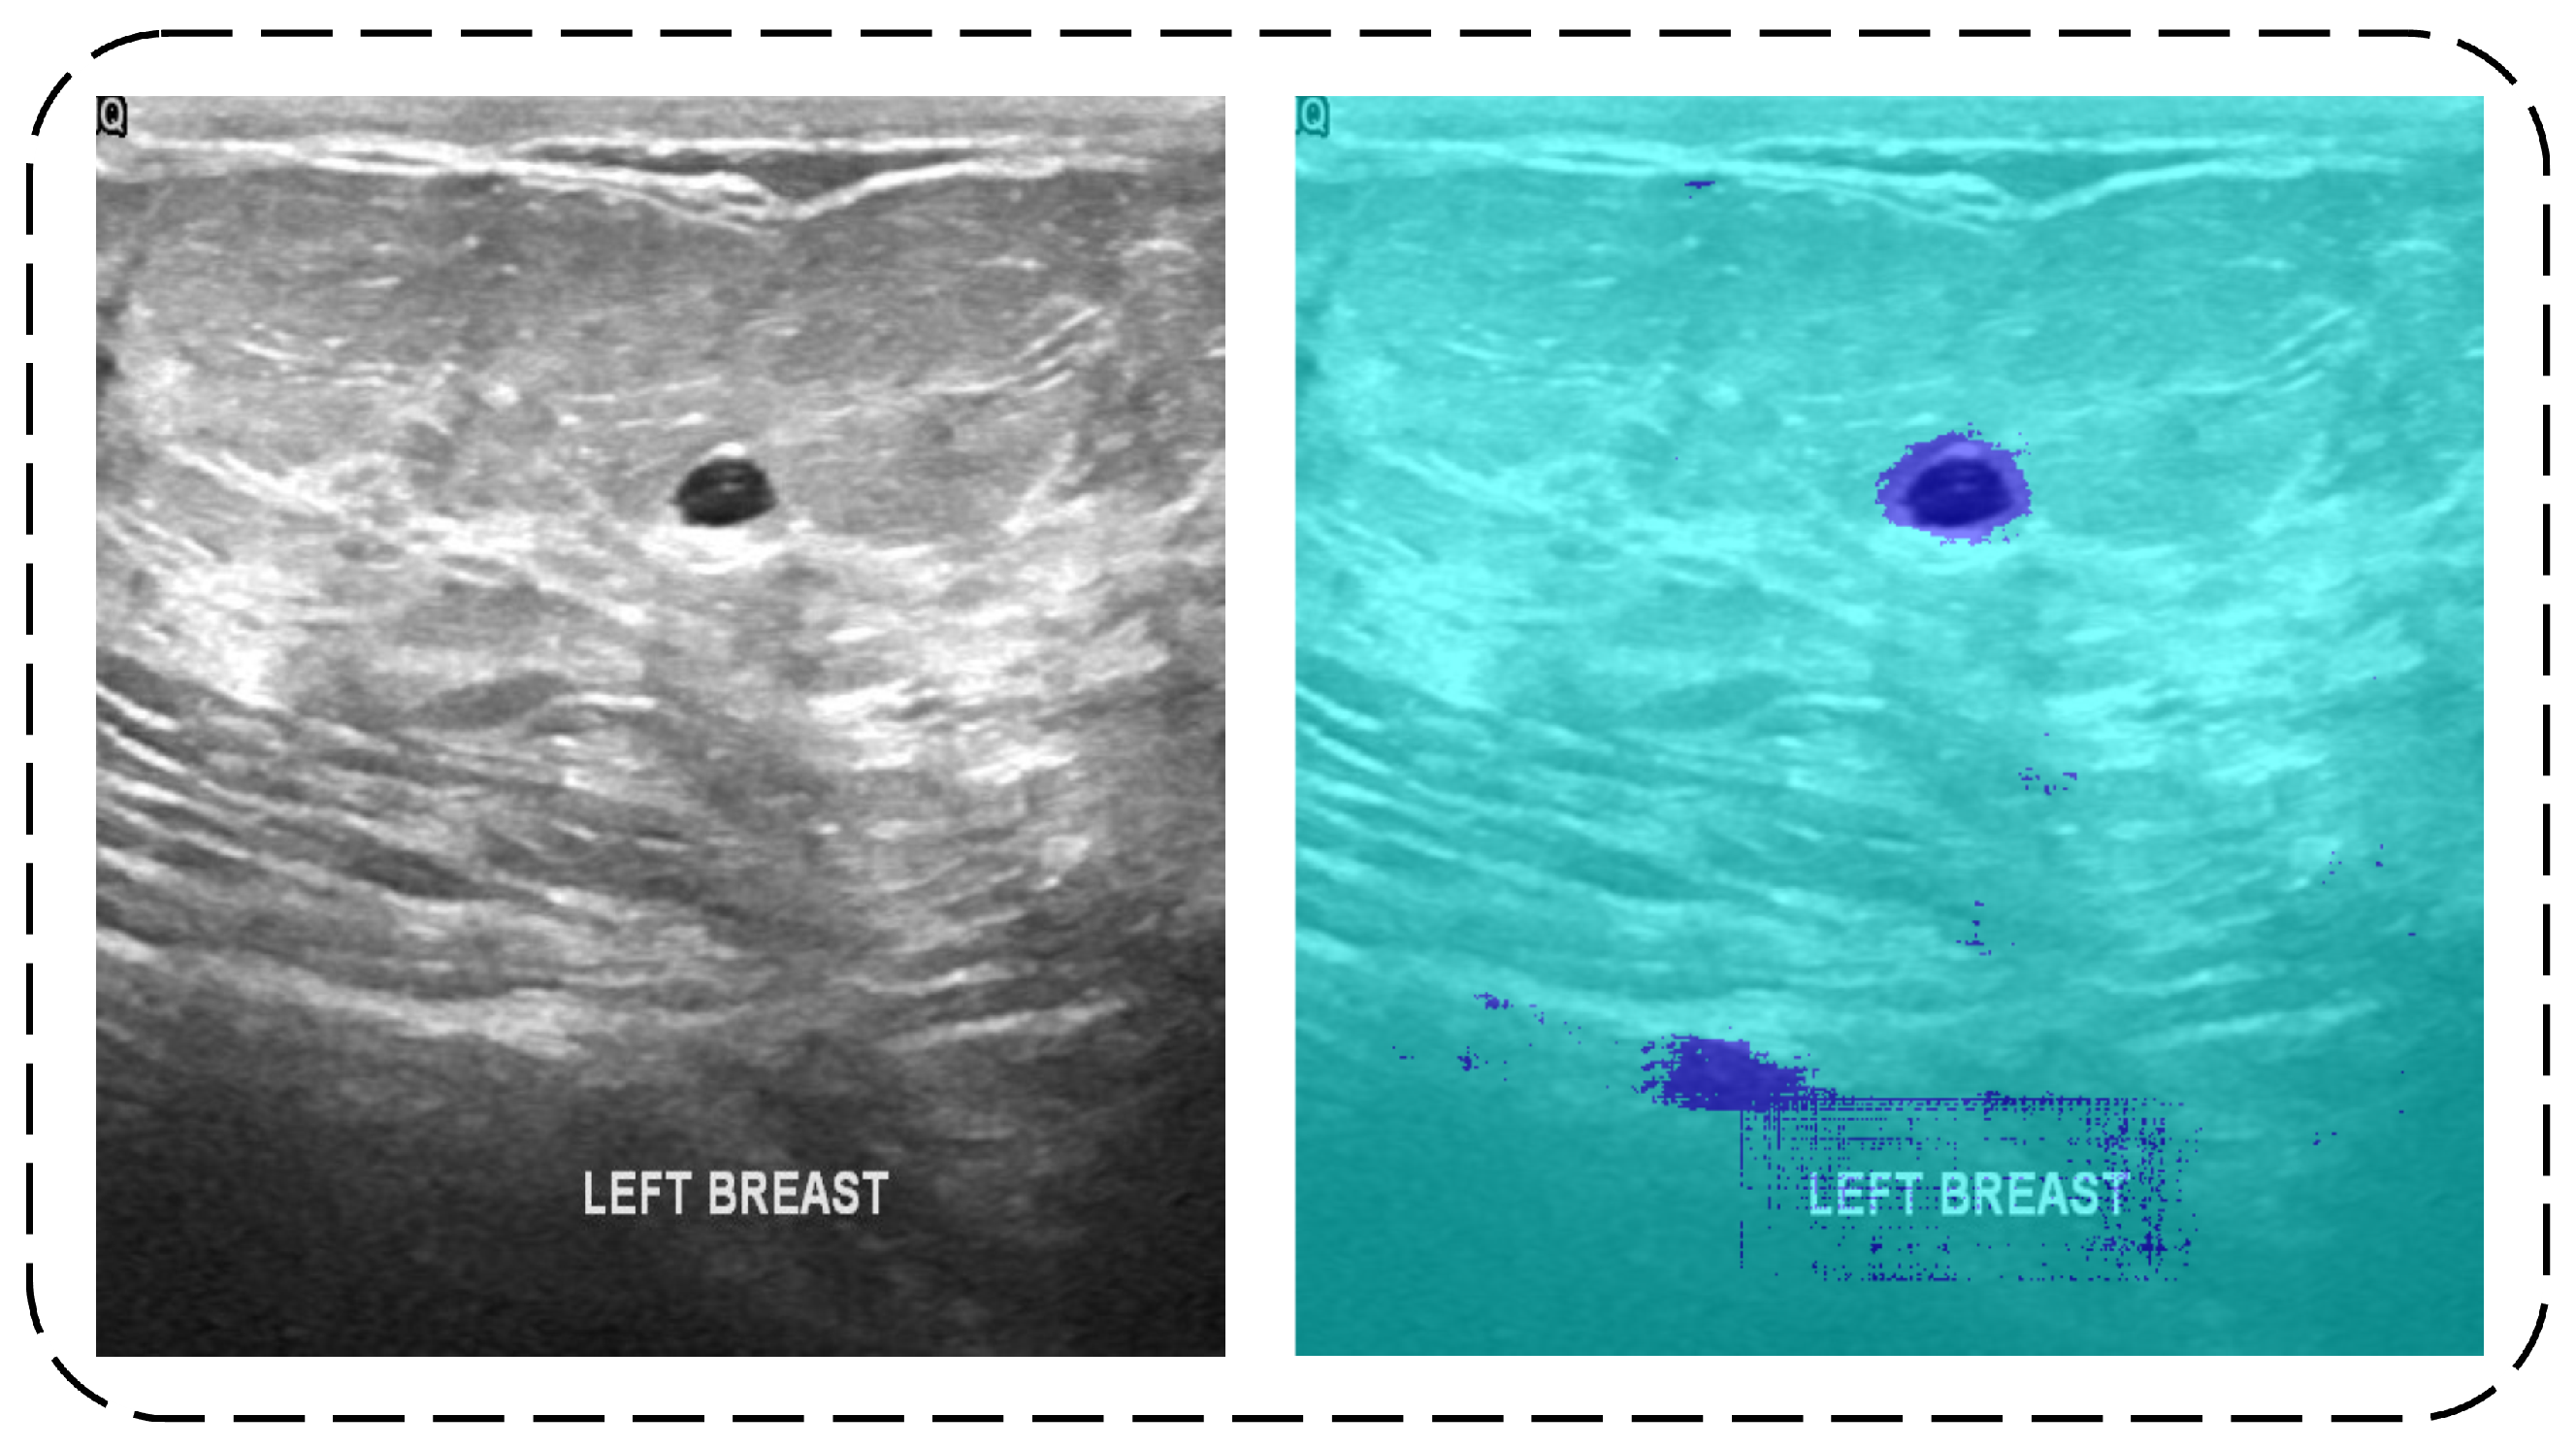
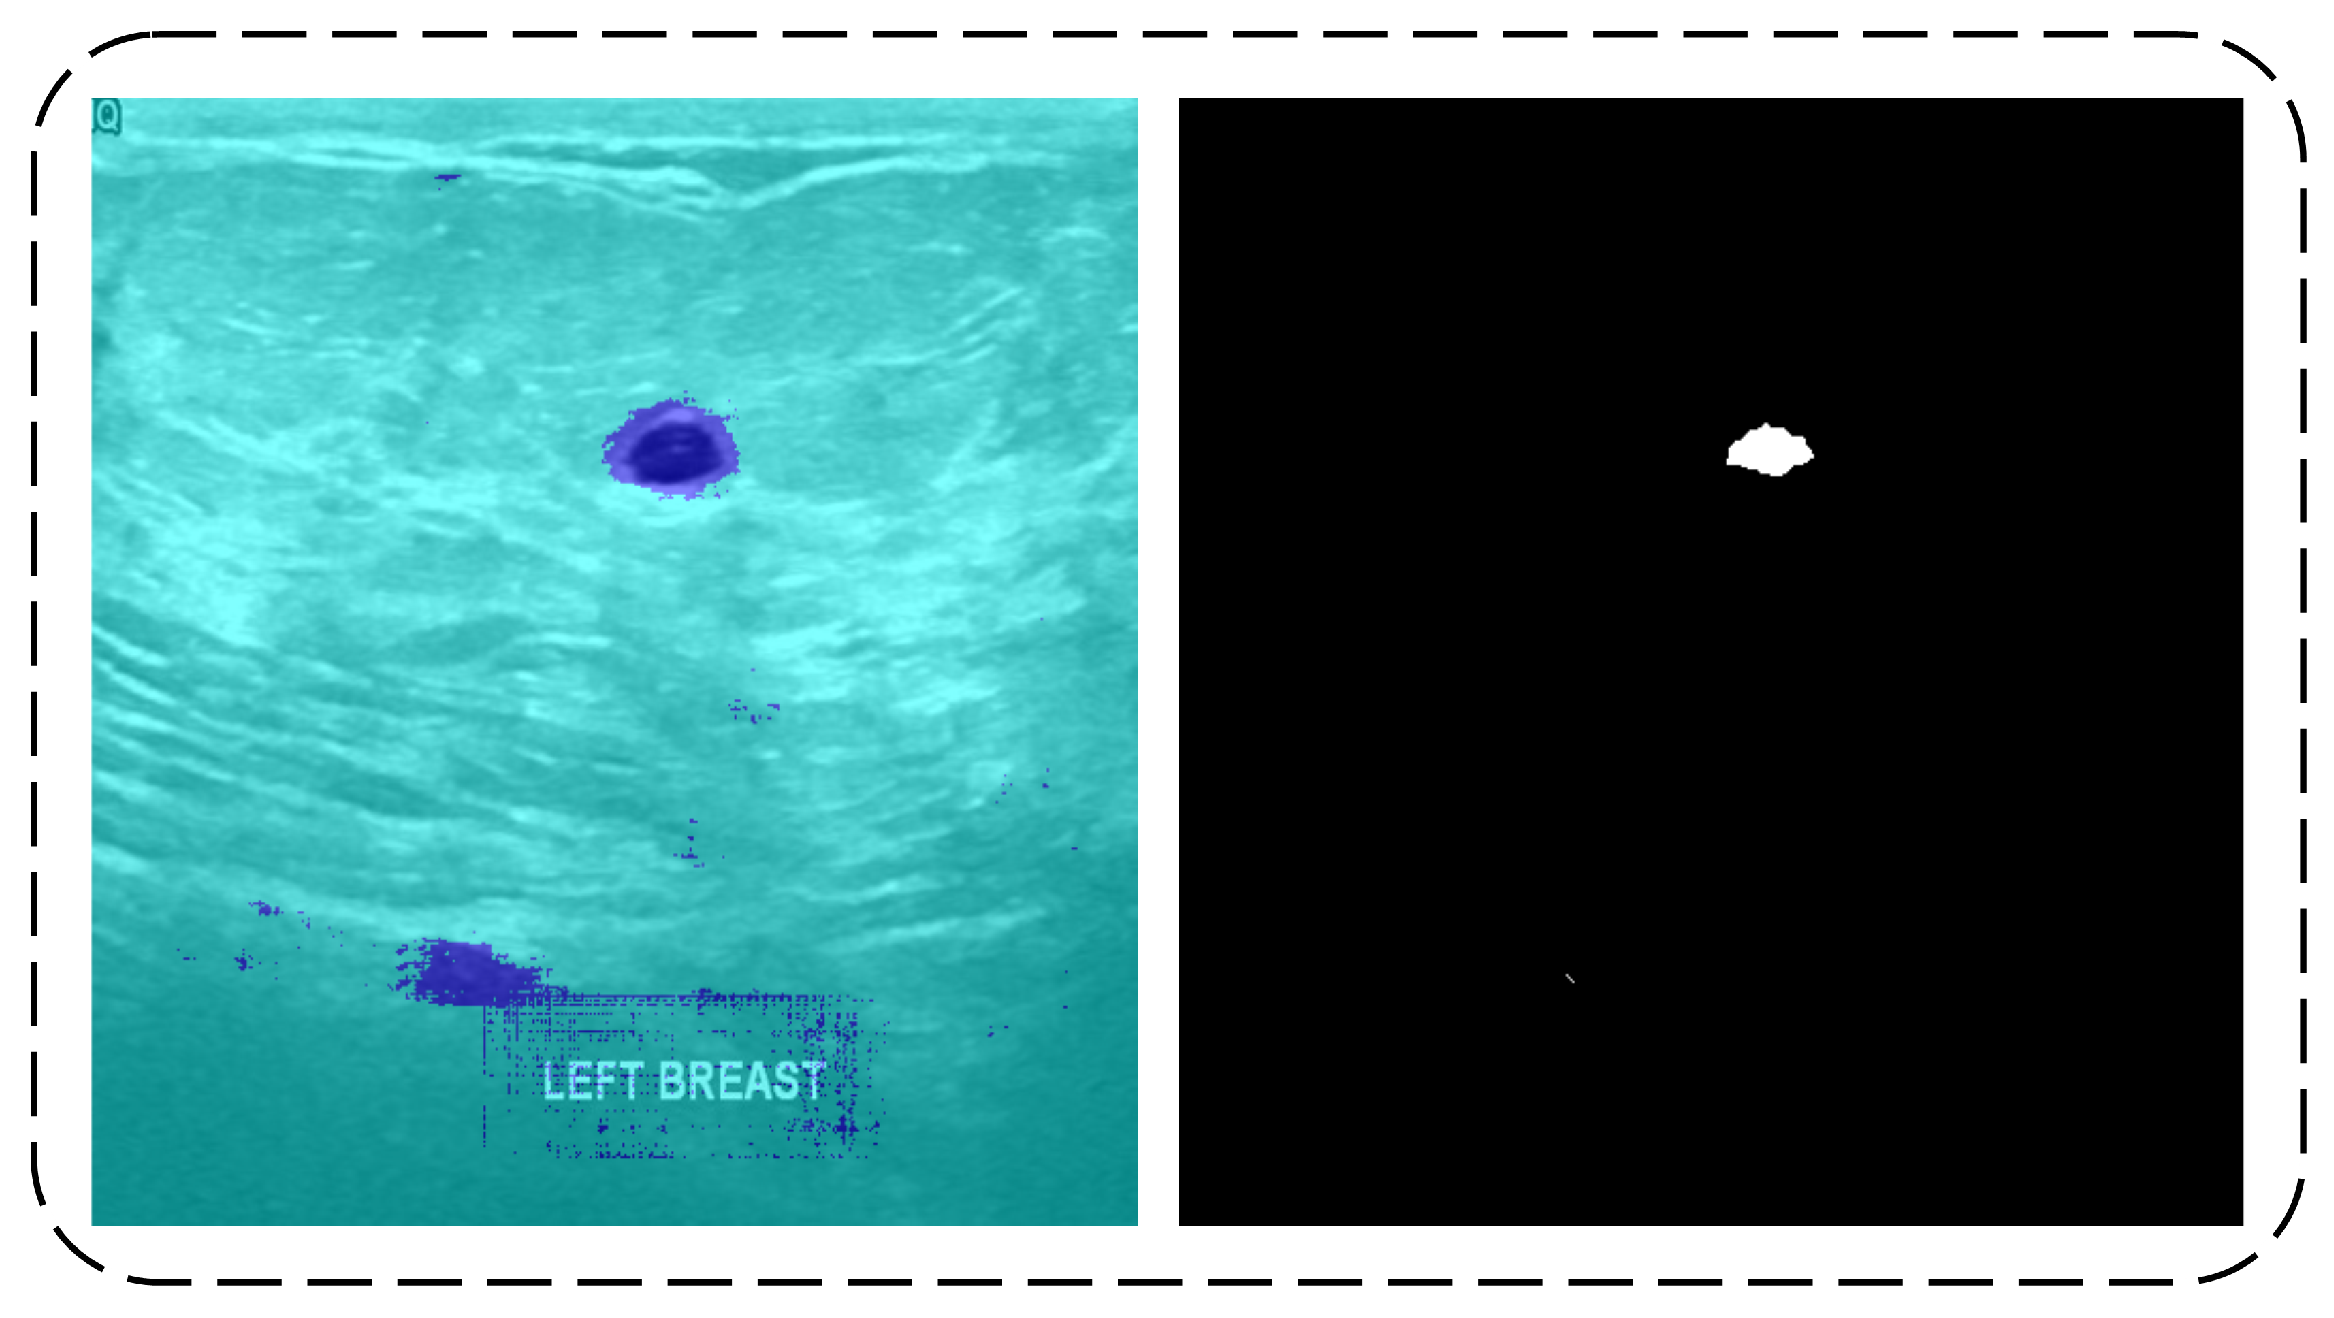
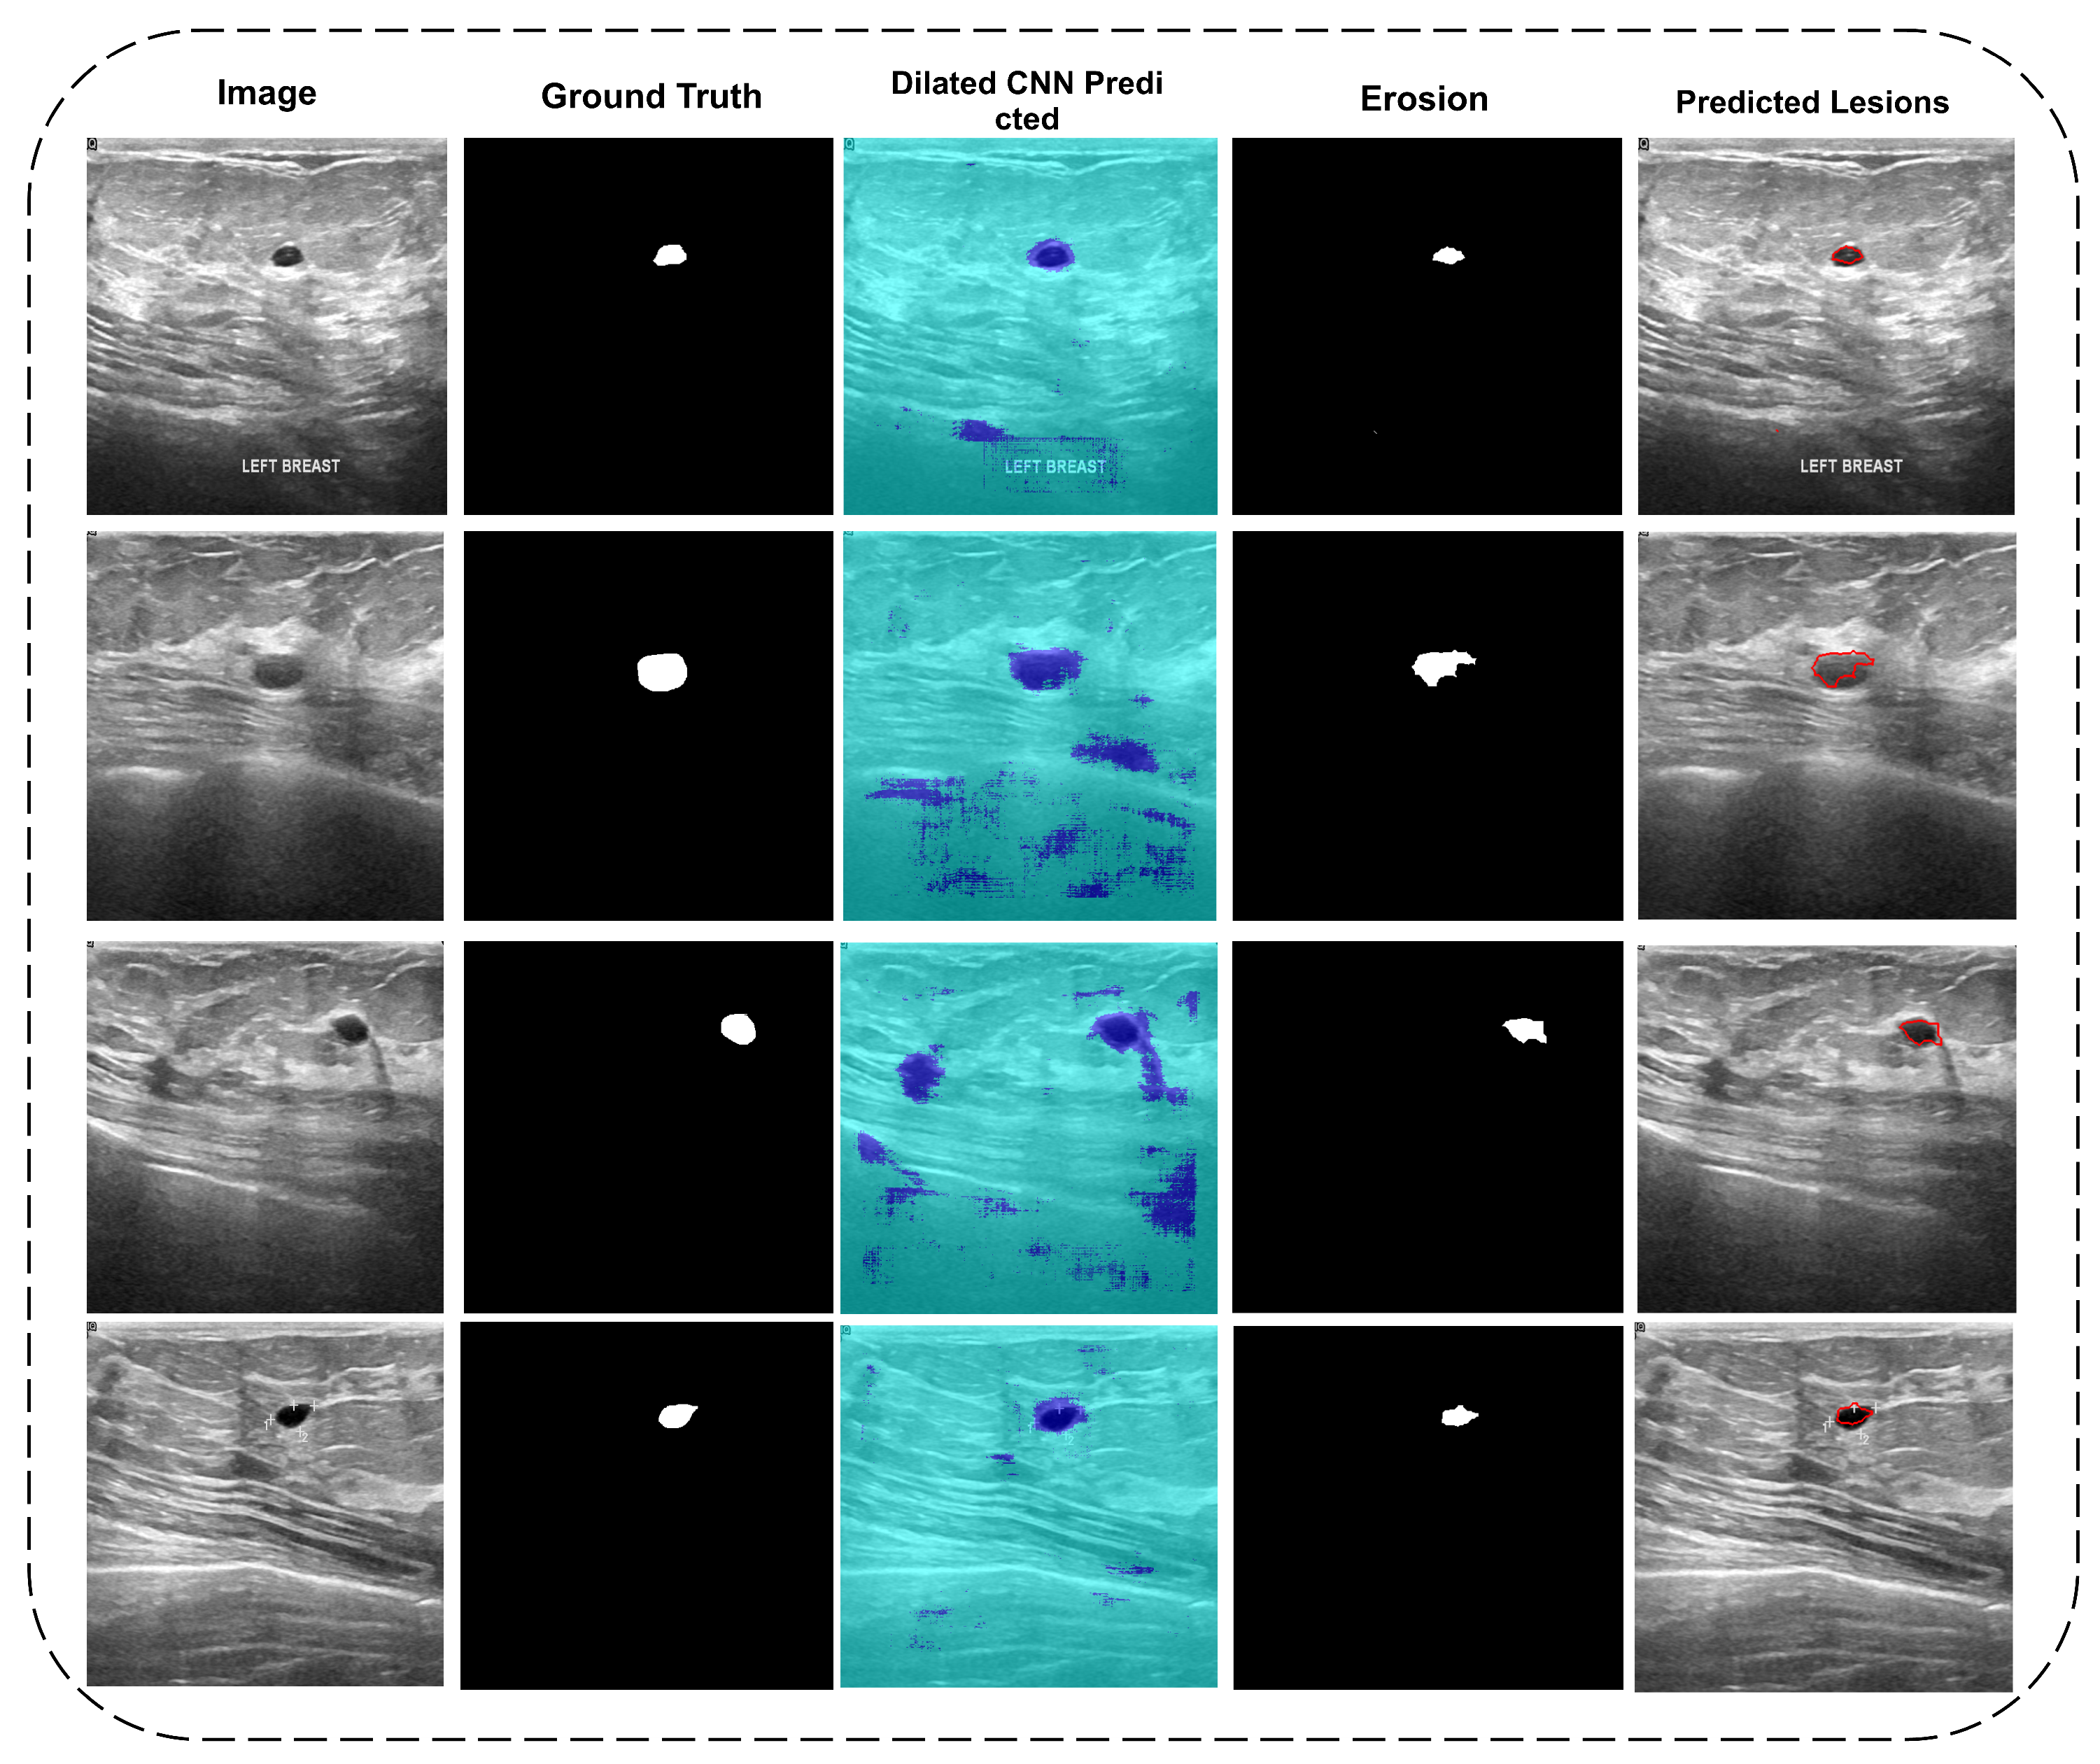
3.1. Segmentation
3.1.1. Dilated Semantic Convolutional Neural Network
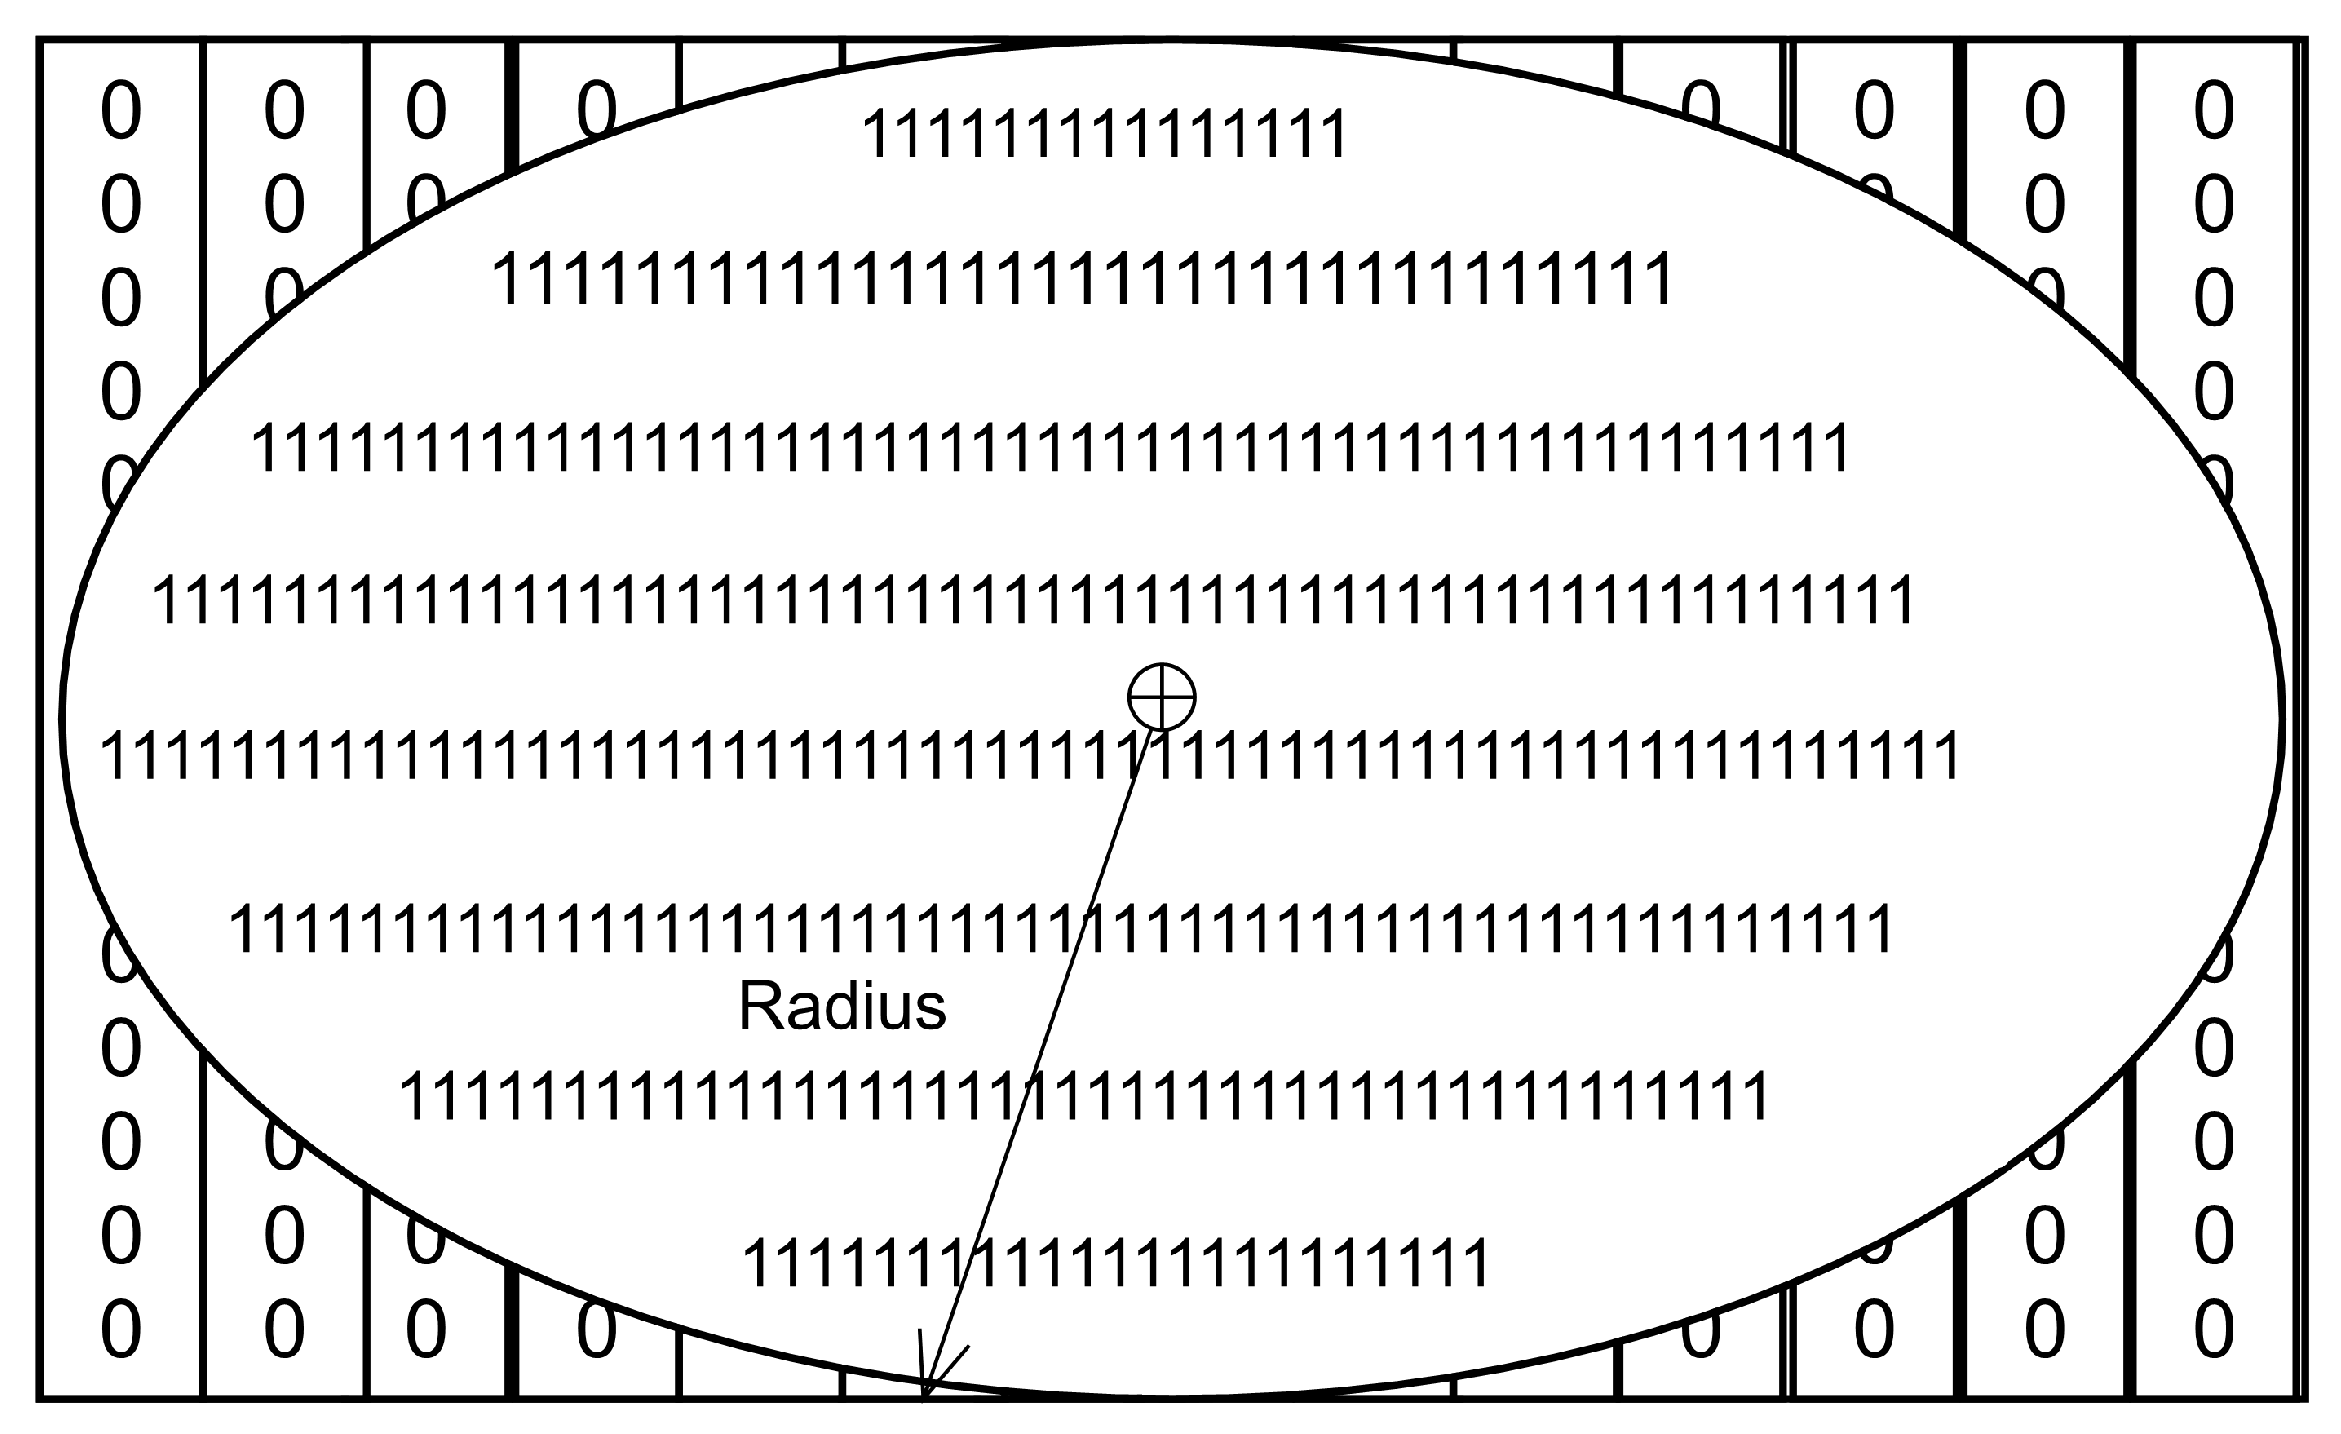
3.1.2. Erosion
3.2. Features Extraction
3.2.1. DenseNet201 Transfer Learning Features
3.2.2. Convolutional Neural Network
3.2.3. Feature Fusion
3.3. Classification
4. Results and Discussion
4.1. Di-CNN Evaluation
4.2. DenseNet201 Activations Based Classification
4.3. CNN Activations based Classification
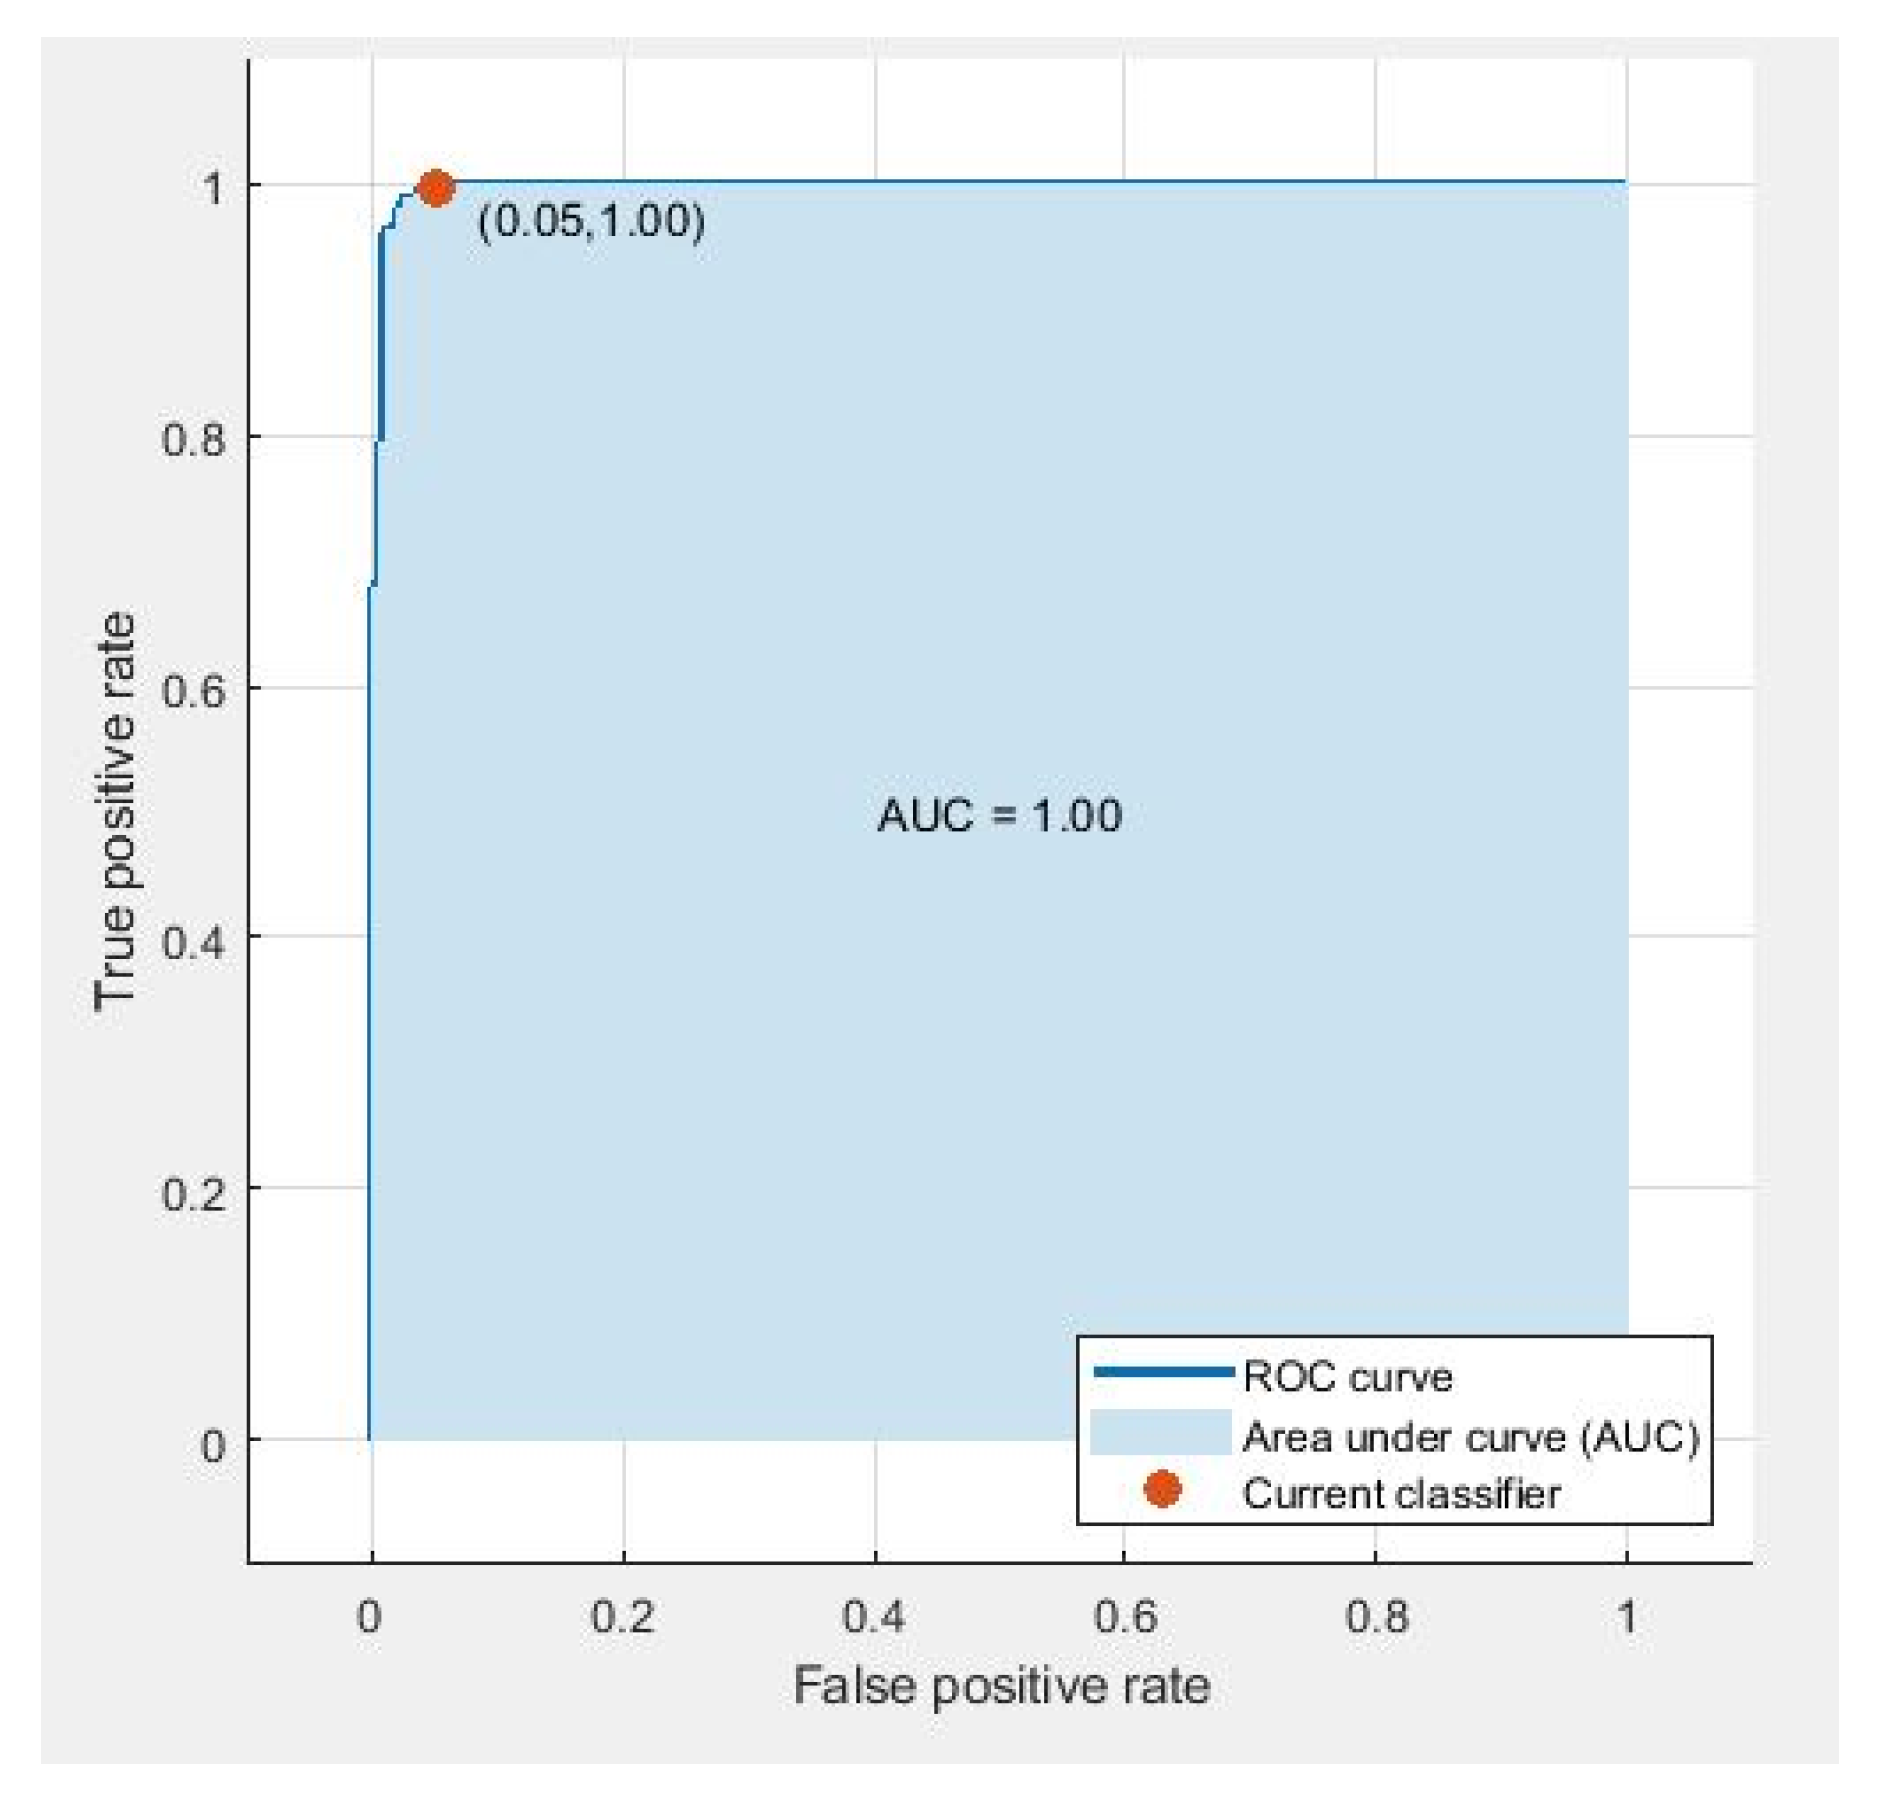
4.4. Parallel Fusion
4.5. Discussion
5. Conclusions
Author Contributions
Funding
Institutional Review Board Statement
Informed Consent Statement
Data Availability Statement
Conflicts of Interest
References
- Sung, H.; Ferlay, J.; Siegel, R.L.; Laversanne, M.; Soerjomataram, I.; Jemal, A.; Bray, F. Global cancer statistics 2020: GLOBOCAN estimates of incidence and mortality worldwide for 36 cancers in 185 countries. CA Cancer J. Clin. 2021. [Google Scholar] [CrossRef]
- Gao, J.; Wang, H.; Shen, H. Smartly Handling Renewable Energy Instability in Supporting a Cloud Datacenter. In Proceedings of the 2020 IEEE International Parallel and Distributed Processing Symposium (IPDPS), New Orleans, LA, USA, 18–22 May 2020; pp. 769–778. [Google Scholar]
- Albahli, S.; Rauf, H.T.; Arif, M.; Nafis, M.T.; Algosaibi, A. Identification of Thoracic Diseases by Exploiting Deep Neural Networks. Neural Netw. 2021, 5, 6. [Google Scholar] [CrossRef]
- Gao, J.; Wang, H.; Shen, H. Task failure prediction in cloud data centers using deep learning. IEEE Trans. Serv. Comput. 2020. [Google Scholar] [CrossRef]
- Oyewola, D.O.; Dada, E.G.; Misra, S.; Damaševičius, R. Detecting cassava mosaic disease using a deep residual convolutional neural network with distinct block processing. PeerJ Comput. Sci. 2021, 7, 1–15. [Google Scholar] [CrossRef]
- Rehman, Z.U.; Khan, M.A.; Ahmed, F.; Damaševičius, R.; Naqvi, S.R.; Nisar, W.; Javed, K. Recognizing apple leaf diseases using a novel parallel real-time processing framework based on MASK RCNN and transfer learning: An application for smart agriculture. IET Image Process. 2021. [Google Scholar] [CrossRef]
- Rauf, H.T.; Lali, M.I.U.; Zahoor, S.; Shah, S.Z.H.; Rehman, A.U.; Bukhari, S.A.C. Visual features based automated identification of fish species using deep convolutional neural networks. Comput. Electron. Agric. 2019, 167, 105075. [Google Scholar] [CrossRef]
- Hemalatha, J.; Roseline, S.A.; Geetha, S.; Kadry, S.; Damaševičius, R. An efficient densenet-based deep learning model for malware detection. Entropy 2021, 23, 344. [Google Scholar] [CrossRef] [PubMed]
- Rauf, H.T.; Malik, S.; Shoaib, U.; Irfan, M.N.; Lali, M.I. Adaptive inertia weight Bat algorithm with Sugeno-Function fuzzy search. Appl. Soft Comput. 2020, 90, 106159. [Google Scholar] [CrossRef]
- Pang, T.; Wong, J.H.D.; Ng, W.L.; Chan, C.S. Deep learning radiomics in breast cancer with different modalities: Overview and future. Expert Syst. Appl. 2020, 158, 113501. [Google Scholar] [CrossRef]
- Latif, G.; Butt, M.O.; Al Anezi, F.Y.; Alghazo, J. Ultrasound Image Despeckling and Detection of Breast Cancer Using Deep CNN. In Proceedings of the 2020 RIVF International Conference on Computing and Communication Technologies (RIVF), Ho Chi Minh City, Vietnam, 14–15 October 2020; pp. 1–5. [Google Scholar]
- Ching, T.; Himmelstein, D.S.; Beaulieu-Jones, B.K.; Kalinin, A.A.; Do, B.T.; Way, G.P.; Ferrero, E.; Agapow, P.M.; Zietz, M.; Hoffman, M.M.; et al. Opportunities and obstacles for deep learning in biology and medicine. J. R. Soc. Interface 2018, 15, 20170387. [Google Scholar] [CrossRef] [Green Version]
- Li, Y.; Liu, Y.; Zhang, M.; Zhang, G.; Wang, Z.; Luo, J. Radiomics with attribute bagging for breast tumor classification using multimodal ultrasound images. J. Ultrasound Med. 2020, 39, 361–371. [Google Scholar] [CrossRef]
- Li, F.; Shang, C.; Li, Y.; Shen, Q. Interpretable mammographic mass classification with fuzzy interpolative reasoning. Knowl.-Based Syst. 2020, 191, 105279. [Google Scholar] [CrossRef]
- Amiri, M.; Brooks, R.; Behboodi, B.; Rivaz, H. Two-stage ultrasound image segmentation using U-Net and test time augmentation. Int. J. Comput. Assist. Radiol. Surg. 2020, 15, 981–988. [Google Scholar] [CrossRef] [PubMed]
- Vakanski, A.; Xian, M.; Freer, P.E. Attention-enriched deep learning model for breast tumor segmentation in ultrasound images. Ultrasound Med. Biol. 2020, 46, 2819–2833. [Google Scholar] [CrossRef] [PubMed]
- Rakhlin, A.; Tiulpin, A.; Shvets, A.A.; Kalinin, A.A.; Iglovikov, V.I.; Nikolenko, S. Breast Tumor Cellularity Assessment Using Deep Neural Networks. In Proceedings of the IEEE/CVF International Conference on Computer Vision Workshops, Seoul, Korea, 27–28 October 2019. [Google Scholar]
- Lahoura, V.; Singh, H.; Aggarwal, A.; Sharma, B.; Mohammed, M.A.; Damaševičius, R.; Kadry, S.; Cengiz, K. Cloud Computing-Based Framework for Breast Cancer Diagnosis Using Extreme Learning Machine. Diagnostics 2021, 11, 241. [Google Scholar] [CrossRef]
- Yap, M.H.; Goyal, M.; Osman, F.; Marti, R.; Denton, E.; Juette, A.; Zwiggelaar, R. Breast ultrasound region of interest detection and lesion localisation. Artif. Intell. Med. 2020, 107, 101880. [Google Scholar] [CrossRef]
- Meraj, T.; Rauf, H.T.; Zahoor, S.; Hassan, A.; Lali, M.I.; Ali, L.; Bukhari, S.A.C.; Shoaib, U. Lung nodules detection using semantic segmentation and classification with optimal features. Neural Comput. Appl. 2019, 1–14. [Google Scholar] [CrossRef]
- Pi, Y.; Chen, Y.; Deng, D.; Qi, X.; Li, J.; Lv, Q.; Yi, Z. Automated diagnosis of multi-plane breast ultrasonography images using deep neural networks. Neurocomputing 2020, 403, 371–382. [Google Scholar] [CrossRef]
- Hussain, S.; Xi, X.; Ullah, I.; Wu, Y.; Ren, C.; Lianzheng, Z.; Tian, C.; Yin, Y. Contextual Level-Set Method for Breast Tumor Segmentation. IEEE Access 2020, 8, 189343–189353. [Google Scholar] [CrossRef]
- Sadad, T.; Hussain, A.; Munir, A.; Habib, M.; Ali Khan, S.; Hussain, S.; Yang, S.; Alawairdhi, M. Identification of breast malignancy by marker-controlled watershed transformation and hybrid feature set for healthcare. Appl. Sci. 2020, 10, 1900. [Google Scholar] [CrossRef] [Green Version]
- Zhu, L.; Chen, R.; Fu, H.; Xie, C.; Wang, L.; Wan, L.; Heng, P.A. A Second-Order Subregion Pooling Network for Breast Lesion Segmentation in Ultrasound. In Proceedings of the International Conference on Medical Image Computing and Computer-Assisted Intervention, Lima, Peru, 4–8 October 2020; pp. 160–170. [Google Scholar]
- Shia, W.C.; Lin, L.S.; Chen, D.R. Classification of malignant tumors in breast ultrasound using unsupervised machine learning approaches. Sci. Rep. 2021, 11, 1–11. [Google Scholar] [CrossRef]
- Kim, S.Y.; Choi, Y.; Kim, E.K.; Han, B.K.; Yoon, J.H.; Choi, J.S.; Chang, J.M. Deep learning-based computer-aided diagnosis in screening breast ultrasound to reduce false-positive diagnoses. Sci. Rep. 2021, 11, 1–11. [Google Scholar]
- Qian, X.; Zhang, B.; Liu, S.; Wang, Y.; Chen, X.; Liu, J.; Yang, Y.; Chen, X.; Wei, Y.; Xiao, Q.; et al. A combined ultrasonic B-mode and color Doppler system for the classification of breast masses using neural network. Eur. Radiol. 2020, 30, 3023–3033. [Google Scholar] [CrossRef]
- Wang, Y.; Choi, E.J.; Choi, Y.; Zhang, H.; Jin, G.Y.; Ko, S.B. Breast cancer classification in automated breast ultrasound using multiview convolutional neural network with transfer learning. Ultrasound Med. Biol. 2020, 46, 1119–1132. [Google Scholar] [CrossRef] [PubMed]
- Yang, Z.; Gong, X.; Guo, Y.; Liu, W. A Temporal Sequence Dual-Branch Network for Classifying Hybrid Ultrasound Data of Breast Cancer. IEEE Access 2020, 8, 82688–82699. [Google Scholar] [CrossRef]
- Zhang, H.; Han, L.; Chen, K.; Peng, Y.; Lin, J. Diagnostic efficiency of the breast ultrasound computer-aided prediction model based on convolutional neural network in breast cancer. J. Digit. Imaging 2020, 33, 1218–1223. [Google Scholar] [CrossRef] [PubMed]
- Liu, Y.; Ren, L.; Cao, X.; Tong, Y. Breast tumors recognition based on edge feature extraction using support vector machine. Biomed. Signal Process. Control 2020, 58, 101825. [Google Scholar] [CrossRef]
- Rakhlin, A.; Shvets, A.; Iglovikov, V.; Kalinin, A.A. Deep Convolutional Neural Networks for Breast Cancer Histology Image Analysis. In Proceedings of the International Conference Image Analysis and Recognition, Porto, Portugal, 27–29 June 2018; pp. 737–744. [Google Scholar]
- Hossen, Z.; Abrar, M.A.; Ara, S.R.; Hasan, M.K. RATE-iPATH: On the design of integrated ultrasonic biomarkers for breast cancer detection. Biomed. Signal Process. Control 2020, 62, 102053. [Google Scholar] [CrossRef]
- Jarosik, P.; Klimonda, Z.; Lewandowski, M.; Byra, M. Breast lesion classification based on ultrasonic radio-frequency signals using convolutional neural networks. Biocybern. Biomed. Eng. 2020, 40, 977–986. [Google Scholar] [CrossRef]
- Chang, J.; Chen, Z.; Huang, Y.; Li, Y.; Zeng, X.; Lu, C. Flexible ultrasonic array for breast-cancer diagnosis based on a self-shape–estimation algorithm. Ultrasonics 2020, 108, 106199. [Google Scholar] [CrossRef] [PubMed]
- Alzubaidi, L.; Al-Shamma, O.; Fadhel, M.A.; Farhan, L.; Zhang, J.; Duan, Y. Optimizing the performance of breast cancer classification by employing the same domain transfer learning from hybrid deep convolutional neural network model. Electronics 2020, 9, 445. [Google Scholar] [CrossRef] [Green Version]
- Huang, Q.; Huang, Y.; Luo, Y.; Yuan, F.; Li, X. Segmentation of breast ultrasound image with semantic classification of superpixels. Med. Image Anal. 2020, 61, 101657. [Google Scholar] [CrossRef] [PubMed]
- Mojabi, P.; Khoshdel, V.; Lovetri, J. Tissue-Type Classification With Uncertainty Quantification of Microwave and Ultrasound Breast Imaging: A Deep Learning Approach. IEEE Access 2020, 8, 182092–182104. [Google Scholar] [CrossRef]
- Liang, X.; Li, Z.; Zhang, L.; Wang, D.; Tian, J. Application of Contrast-Enhanced Ultrasound in the Differential Diagnosis of Different Molecular Subtypes of Breast Cancer. Ultrason. Imaging 2020, 42, 261–270. [Google Scholar] [CrossRef] [PubMed]
- Luo, Y.; Zhao, C.; Gao, Y.; Xiao, M.; Li, W.; Zhang, J.; Ma, L.; Qin, J.; Jiang, Y.; Zhu, Q. Predicting Axillary Lymph Node Status With a Nomogram Based on Breast Lesion Ultrasound Features: Performance in N1 Breast Cancer Patients. Front. Oncol. 2020, 10. [Google Scholar] [CrossRef]
- Lee, S.; Rahul; Ye, H.; Chittajallu, D.; Kruger, U.; Boyko, T.; Lukan, J.K.; Enquobahrie, A.; Norfleet, J.; De, S. Real-time burn classification using ultrasound imaging. Sci. Rep. 2020, 10, 1–13. [Google Scholar] [CrossRef] [Green Version]
- Kore, S.S.; Kadam, A.B. A novel incomplete sparse least square optimized regression model for abdominal mass detection in ultrasound images. Evol. Intell. 2020, 1–16. [Google Scholar] [CrossRef]
- Moon, W.K.; Lee, Y.W.; Ke, H.H.; Lee, S.H.; Huang, C.S.; Chang, R.F. Computer-aided diagnosis of breast ultrasound images using ensemble learning from convolutional neural networks. Comput. Methods Prog. Biomed. 2020, 190, 105361. [Google Scholar] [CrossRef] [PubMed]
- Byra, M.; Dobruch-Sobczak, K.; Klimonda, Z.; Piotrzkowska-Wroblewska, H.; Litniewski, J. Early prediction of response to neoadjuvant chemotherapy in breast cancer sonography using Siamese convolutional neural networks. IEEE J. Biomed. Health Inform. 2020, 25, 797–805. [Google Scholar] [CrossRef]
- Al-Dhabyani, W.; Gomaa, M.; Khaled, H.; Fahmy, A. Dataset of breast ultrasound images. Data Brief 2020, 28, 104863. [Google Scholar] [CrossRef]
- Yu, F.; Koltun, V. Multi-scale context aggregation by dilated convolutions. arXiv 2015, arXiv:1511.07122. [Google Scholar]
- Gonzalez, R.C.; Woods, R.E.; Masters, B.R. Digital Image Processing, 3rd ed.; Pearson Prentice Hall: Hoboken, NJ, USA, 2008; pp. 630–633. [Google Scholar]
- Jadon, S. A Survey of Loss Functions for Semantic Segmentation. In Proceedings of the 2020 IEEE Conference on Computational Intelligence in Bioinformatics and Computational Biology (CIBCB), Viña del Mar, Chile, 27–29 October 2020; pp. 1–7. [Google Scholar]
- Al-Dhabyani, W.; Gomaa, M.; Khaled, H.; Aly, F. Deep learning approaches for data augmentation and classification of breast masses using ultrasound images. Int. J. Adv. Comput. Sci. Appl. 2019, 10, 1–11. [Google Scholar] [CrossRef] [Green Version]
- Byra, M.; Jarosik, P.; Szubert, A.; Galperin, M.; Ojeda-Fournier, H.; Olson, L.; O’Boyle, M.; Comstock, C.; Andre, M. Breast mass segmentation in ultrasound with selective kernel U-Net convolutional neural network. Biomed. Signal Process. Control 2020, 61, 102027. [Google Scholar] [CrossRef]
- Lazo, J.F.; Moccia, S.; Frontoni, E.; De Momi, E. Comparison of different CNNs for breast tumor classification from ultrasound images. arXiv 2020, arXiv:2012.14517. [Google Scholar]


| References | Topic | Modality | Dataset Size | Results |
|---|---|---|---|---|
| [25] | Classification of malignant tumors in breast ultrasound using an unsupervised machine learning approaches | Ultrasonic | Total = 677 Benign = 312 Malignant = 365 | Sensitivity = 81.64% Specificity = 87.76% AUC = 0.847 |
| [26] | Deep learning-based computer-aided diagnosis in screening breast ultrasound to reduce false-positive diagnoses | Ultrasonic | Total = 299 Benign = 256 Malignant = 43 | Sensitivity = 89% Specificity = 87% |
| [28] | Breast cancer classification in automated breast ultrasound using multi-view CNN with transfer learning | Ultrasonic | Total = 316 Benign = 181 Malignant = 135 | Sensitivity = 88.6% Specificity = 87.6% AUC = 0.94 |
| [29] | A Temporal Sequence Dual-Branch Network for Classifying Hybrid Ultrasound Data of Breast Cancer | Ultrasonic | Total = 268 Benign = 122 Malignant = 146 | Accuracy = 90.2% Recall = 91.4% Precision = 95.2% F1-Score = 93.2% |
| [31] | Breast tumors recognition based on edge feature extraction using support vector machine | Ultrasonic | Total = 192 Benign = 121 Malignant = 71 | Accuracy = 82.69% Sensitivity = 66.67% Specificity = 93.55% |
| [32] | Deep CNN for Breast Cancer Histology Image Analysis | Histology | Total = 400 Benign = 100 Normal = 100 Situ Carcinoma = 100 invasive carcinoma = 100 | Accuracy = 93.08% Sensitivity = 96.07% Specificity = 88.00% |
| [33] | RATE-iPATH: On the design of integrated ultrasonic biomarkers for breast cancer detection | Ultrasonic | Total = 139 Fibroadenoma = 71 Malignant = 44 Inflammation = 24 | Accuracy = 99.28% Sensitivity = 100% Specificity = 98.95% |
| [34] | Breast lesion classification based on ultrasonic radio-frequency signals using convolutional neural networks | Ultrasonic | Total = 100 Benign = 48 Malignant = 52 | AUC = 0.772 |
| [23] | Identification of Breast Malignancy by Marker-Controlled Watershed Transformation and Hybrid Feature Set for Healthcare | Ultrasonic | Same as used in the proposed study | Accuracy = 96.6% Sensitivity = 94.34% Specificity = 97.7% |
| [24] | A Second-Order Subregion Pooling Network for Breast Lesion Segmentation in Ultrasound | Ultrasonic | Same as used in the proposed study | Sensitivity = 85.51% Specificity = 87.62% |
| Categories | Numbers |
|---|---|
| Dimension | 512 × 512 |
| Malignant | 210 |
| Benign | 437 |
| Normal | 133 |
| Total | 780 |
| Global Accuracy (%) | Mean-IoU (%) | Mean Accuracy (%) | Weighted-IoU (%) | Mean-BF Score |
|---|---|---|---|---|
| 80.20 | 52.89 | 79.61 | 73.83 | 0.18218 |
| Parameter | Value |
|---|---|
| Batch Size | 128 |
| Epochs | 500 |
| Activation function | Stochastic gradient decent (sgdm) |
| Training time | Hours:Minutes:Seconds; 197:03:28 |
| Iterations | 20,000 |
| Initial Learning Rate | 1 × 10 |
| Method | Accuracy (%) | Sensitivity (%) | Specificity (%) | Precision (%) | F1-Score (%) |
|---|---|---|---|---|---|
| LSVM | 98.45 | 100 | 95.24 | 97.76 | 98.87 |
| QSVM | 98.97 | 100 | 96.83 | 98.50 | 99.24 |
| Cubic–SVM | 98.45 | 99.24 | 96.83 | 96.48 | 98.86 |
| SVM–Medium Gaussian | 98.97 | 100 | 96.83 | 98.50 | 99.24 |
| Method | Accuracy (%) | Sensitivity (%) | Specificity (%) | Precision (%) | F1-Score (%) |
|---|---|---|---|---|---|
| LSVM | 98.30 | 100 | 94.76 | 94.76 | 98.76 |
| QSVM | 98.61 | 100 | 95.71 | 97.98 | 98.98 |
| Cubic–SVM | 98.30 | 99.54 | 95.71 | 97.97 | 98.75 |
| SVM–Medium Gaussian | 98.45 | 100 | 95.24 | 97.76 | 98.87 |
| Method | Accuracy (%) | Sensitivity (%) | Specificity (%) | Precision (%) | F1-Score (%) |
|---|---|---|---|---|---|
| LSVM | 89.18 | 95.42 | 76.19 | 89.29 | 92.25 |
| QSVM | 89.18 | 96.95 | 73.02 | 88.19 | 92.36 |
| Cubic–SVM | 89.18 | 96.18 | 74.60 | 88.73 | 92.31 |
| SVM–Medium Gaussian | 88.14 | 97.71 | 68.25 | 86.49 | 91.76 |
| Method | Accuracy (%) | Sensitivity (%) | Specificity (%) | Precision (%) | F1-Score (%) |
|---|---|---|---|---|---|
| LSVM | 89.64 | 94.28 | 80.00 | 90.75 | 92.48 |
| QSVM | 89.34 | 94.05 | 79.52 | 90.53 | 92.26 |
| Cubic–SVM | 81.61 | 91.53 | 60.95 | 82.99 | 87.05 |
| SVM–Medium Gaussian | 90.11 | 97.25 | 75.24 | 89.10 | 93.00 |
| Method | Accuracy (%) | Sensitivity (%) | Specificity (%) | Precision (%) | F1-Score (%) |
|---|---|---|---|---|---|
| LSVM | 98.45 | 100 | 95.24 | 97.76 | 98.87 |
| QSVM | 98.97 | 100 | 96.83 | 98.50 | 99.24 |
| Cubic–SVM | 98.97 | 100 | 96.83 | 98.50 | 99.24 |
| SVM–Medium Gaussian | 98.97 | 100 | 96.83 | 98.50 | 99.24 |
| Method | Accuracy (%) | Sensitivity (%) | Specificity (%) | Precision (%) | F1-Score (%) |
|---|---|---|---|---|---|
| LSVM | 98.45 | 100 | 95.24 | 97.76 | 98.87 |
| QSVM | 98.76 | 100 | 96.19 | 98.20 | 99.09 |
| Cubic–SVM | 98.45 | 99.54 | 96.19 | 98.19 | 98.86 |
| SVM–Medium Gaussian | 98.45 | 100 | 95.24 | 97.76 | 98.87 |
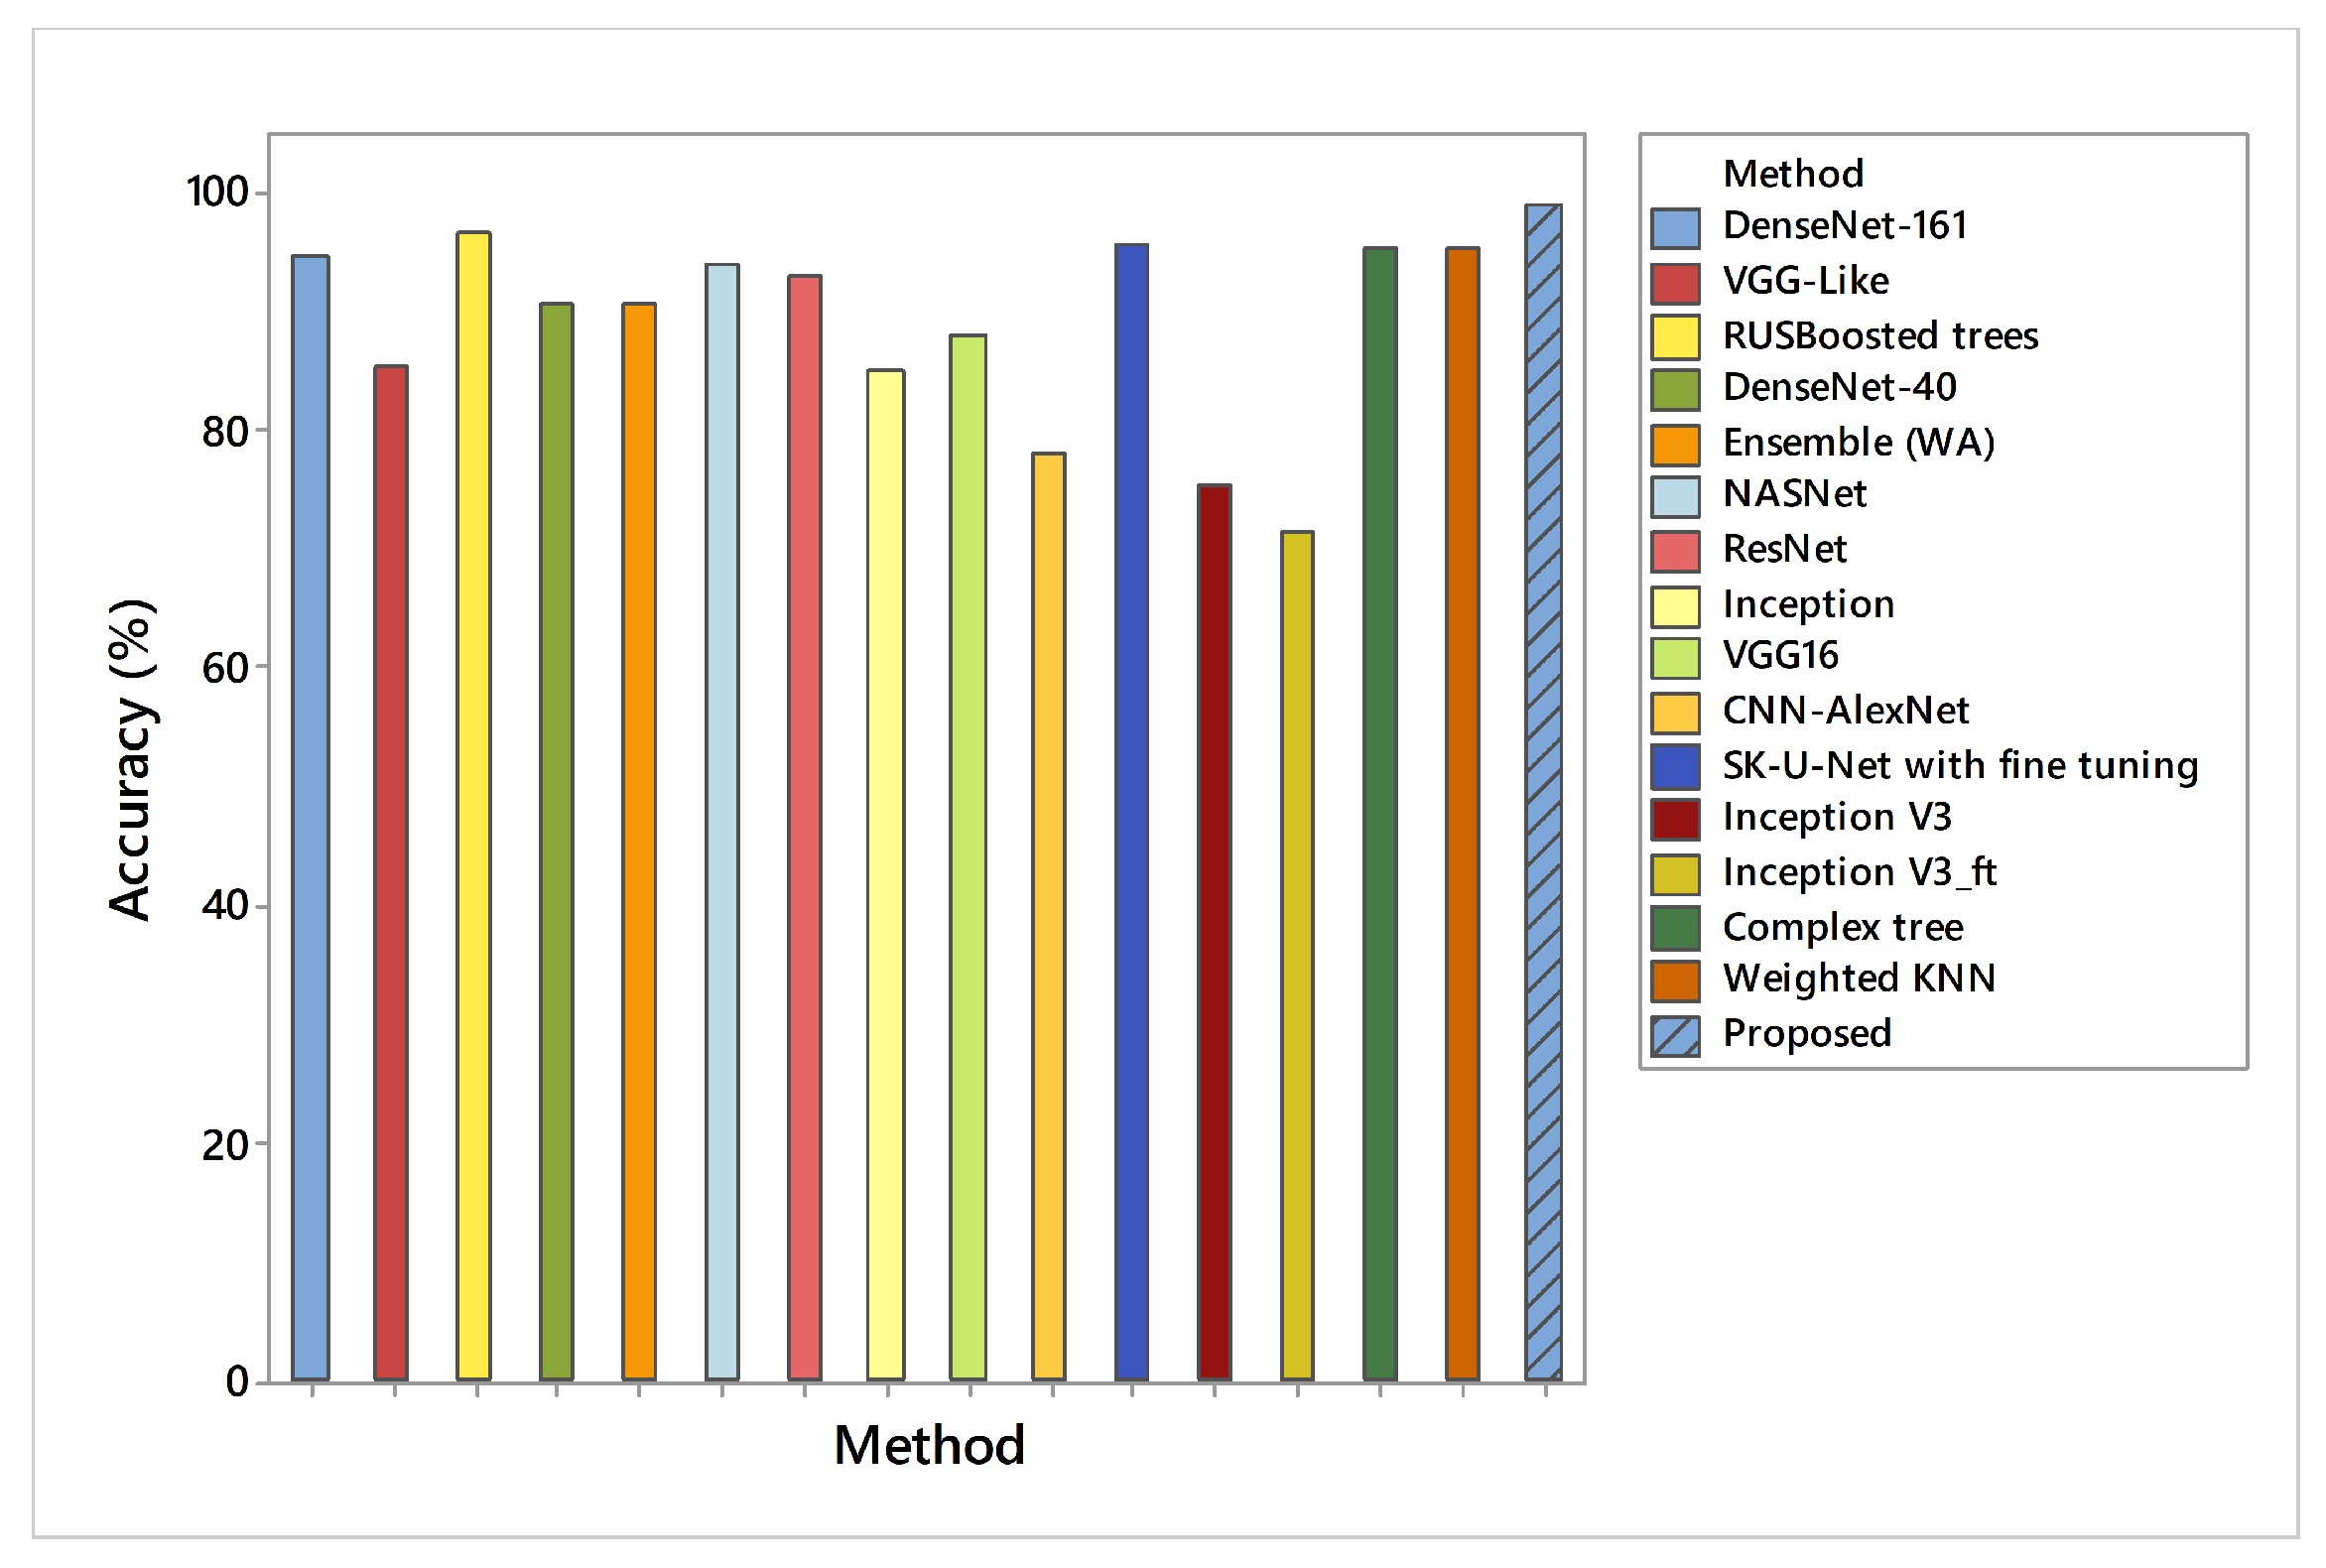
| Method | Accuracy (%) | Sensitivity (%) | Specificity (%) |
|---|---|---|---|
| DenseNet-161 [43] | 94.62 | 92.31 | 95.60 |
| VGG-Like [43] | 85.38 | 76.92 | 89.00 |
| RUSBoosted trees [23] | 96.6 | 94.34 | 97.70 |
| DenseNet-40 [43] | 90.77 | 88.89 | 91.49 |
| Ensemble (WA) [43] | 90.77 | 96.67 | 89.00 |
| DenseNet-121 [43] | 88.46 | 83.78 | 90.32 |
| NASNet [49] | 94 | - | - |
| ResNet [49] | 93 | - | - |
| Inception [49] | 85 | - | - |
| VGG16 [49] | 88 | - | - |
| CNN-AlexNet [49] | 78 | - | - |
| SK-U-Net with fine tuning [50] | 95.6 | - | - |
| SK-U-Net without fine tuning [50] | 94.4 | - | - |
| Inception V3 [51] | 75.6 | - | - |
| w/o-GMP [24] | - | 81.99 | 84.36 |
| w/o-subregions [24] | - | 83.97 | 86.35 |
| ChannelRC [24] | - | 84.22 | 86.72 |
| w/o-guidance [24] | - | 84.85 | 87.09 |
| S2P-Net [24] | - | 85.51 | 87.62 |
| VGG-16 [51] | 91.9 | - | - |
| Inception V3_ft [51] | 71.3 | - | - |
| VGG-16_ft [51] | 86.2 | - | - |
| UNet [22] | 96.41 | 95.17 | 97.34 |
| Complex tree [23] | 95.83 | 92.96 | 97.24 |
| Weighted KNN [23] | 95.36 | 92.86 | 96.56 |
| Proposed | 98.97 | 100 | 96.83 |
Publisher’s Note: MDPI stays neutral with regard to jurisdictional claims in published maps and institutional affiliations. |
© 2021 by the authors. Licensee MDPI, Basel, Switzerland. This article is an open access article distributed under the terms and conditions of the Creative Commons Attribution (CC BY) license (https://creativecommons.org/licenses/by/4.0/).
Share and Cite
Irfan, R.; Almazroi, A.A.; Rauf, H.T.; Damaševičius, R.; Nasr, E.A.; Abdelgawad, A.E. Dilated Semantic Segmentation for Breast Ultrasonic Lesion Detection Using Parallel Feature Fusion. Diagnostics 2021, 11, 1212. https://doi.org/10.3390/diagnostics11071212
Irfan R, Almazroi AA, Rauf HT, Damaševičius R, Nasr EA, Abdelgawad AE. Dilated Semantic Segmentation for Breast Ultrasonic Lesion Detection Using Parallel Feature Fusion. Diagnostics. 2021; 11(7):1212. https://doi.org/10.3390/diagnostics11071212
Chicago/Turabian StyleIrfan, Rizwana, Abdulwahab Ali Almazroi, Hafiz Tayyab Rauf, Robertas Damaševičius, Emad Abouel Nasr, and Abdelatty E. Abdelgawad. 2021. "Dilated Semantic Segmentation for Breast Ultrasonic Lesion Detection Using Parallel Feature Fusion" Diagnostics 11, no. 7: 1212. https://doi.org/10.3390/diagnostics11071212