
A Randomized Comparison of Delivered Energy in Cardioversion of Atrial Fibrillation: Biphasic Truncated Exponential Versus Pulsed Biphasic Waveforms


Abstract
:1. Introduction
2. Methods
2.1. Study Design and Setting
2.2. Intervention
2.3. Study Population and Ethics
2.4. Cardioversion Protocol
2.5. Baseline and Follow-Up Measurements
2.6. Study Endpoints
- Number of delivered shocks;
- Cumulative success rate: presence of sinus rhythm after first shock (1 min), second shock (1 min), and CVS success rate (1 min, 2 h, 24 h) after the last shock;
- Delivered energy of the effective shock.
- Changes of myocardial-specific biomarkers (CK-MB, hsTnI) at 8–12 h after CVS compared to baseline;
- Proportion of patients with elevated biomarkers;
- Complications after CVS: presence of apnea, arrhythmias, heart-blocks and the need for medication during CVS and 2 h follow-up;
- ST-segment changes (read by cardiologist in lead II, 80 ms after J-point) at 10 s post-shock and 2–5 min post-CVS compared to baseline (10 s pre-CVS);
- Vital signs (HR, BP) after CVS (1 min, 1 h, 2 h).
2.7. Statistical Analysis
3. Results
3.1. Patients
3.2. Baseline Data
3.3. Efficacy Endpoints
3.4. Safety Endpoints
4. Discussion
5. Study Limitations
6. Conclusions
Author Contributions
Funding
Institutional Review Board Statement
Informed Consent Statement
Data Availability Statement
Acknowledgments
Conflicts of Interest
References
- Hindricks, G.; Potpara, T.; Dagres, N.; Arbelo, E.; Bax, J.J.; Blomström-Lundqvist, C.; Boriani, G.; Castella, M.; Dan, G.A.; Dilaveris, P.E.; et al. 2020 ESC Guidelines for the diagnosis and management of atrial fibrillation developed in collaboration with the European Association of Cardio-Thoracic Surgery (EACTS). Eur. Heart J. 2021, 42, 373–489. [Google Scholar] [CrossRef] [PubMed]
- Brandes, A.; Crijns, H.; Rienstra, M.; Kirchhof, P.; Grove, E.L.; Pedersen, K.B.; Van Gelder, I.C. Cardioversion of atrial fibrillation and atrial flutter revisited: Current evidence and practical guidance for a common procedure. EP Eur. 2020, 22, 1149–1161. [Google Scholar] [CrossRef] [PubMed]
- Mittal, S.; Ayati, S.; Stein, K.M.; Schwartzman, D.; Cavlovich, D.; Tchou, P.J.; Markowitz, S.M.; Slotwiner, D.J.; Scheiner, M.A.; Lerman, B.B. Transthoracic Cardioversion of Atrial Fibrillation: Comparison of Rectilinear Biphasic Versus Damped Sine Wave Monophasic Shocks. Circulation 2000, 101, 1282–1287. [Google Scholar] [CrossRef] [PubMed] [Green Version]
- Inácio, J.F.; da Rosa, M.; Shah, J.; Rosário, J.; Vissoci, J.R.; Manica, A.L.; Rodrigues, C.G. Monophasic and biphasic shock for transthoracic conversion of atrial fibrillation: Systematic review and network meta-analysis. Resuscitation 2016, 100, 66–75. [Google Scholar] [CrossRef] [PubMed]
- Mortensen, K.; Risius, T.; Schwemer, T.F.; Aydin, M.A.; Köster, R.; Klemm, H.U.; Lutomsky, B.; Meinertz, T.; Ventura, R.; Willems, S. Biphasic versus Monophasic Shock for External Cardioversion of Atrial Flutter. Cardiology 2008, 111, 57–62. [Google Scholar] [CrossRef]
- Ambler, J.J.; Deakin, C.D. A randomized controlled trial of efficacy and ST change following use of the Welch-Allyn MRL PIC biphasic waveform versus damped sine monophasic waveform for external DC cardioversion. Resuscitation 2006, 71, 146–151. [Google Scholar] [CrossRef] [PubMed]
- Page, R.L.; Kerber, R.E.; Russell, J.K.; Trouton, T.; Waktare, J.; Gallik, D.; Olgin, J.E.; Ricard, P.; Dalzell, G.W.; Reddy, R.; et al. Biphasic versus monophasic shock waveform for conversion of atrial fibrillation: The results of an international randomized, double-blind multicenter trial. J. Am. Coll. Cardiol. 2002, 39, 1956–1963. [Google Scholar] [CrossRef] [Green Version]
- Deakin, C.D.; Connelly, S.; Wharton, R.; Yuen, H.M. A comparison of rectilinear and truncated exponential biphasic waveforms in elective cardioversion of atrial fibrillation: A prospective randomized controlled trial. Resuscitation 2013, 84, 286–291. [Google Scholar] [CrossRef]
- Neal, S.; Ngarmukos, T.; Lessard, D.; Rosenthal, L. Comparison of the efficacy and safety of two biphasic defibrillator waveforms for the conversion of atrial fibrillation to sinus rhythm. Am. J. Cardiol. 2003, 92, 810–814. [Google Scholar] [CrossRef]
- Alatawi, F.; Gurevitz, O.; White, R.D.; Ammash, N.M.; Malouf, J.F.; Bruce, C.J.; Moon, B.S.; Rosales, A.G.; Hodge, D.; Hammill, S.C.; et al. Prospective, randomized comparison of two biphasic waveforms for the efficacy and safety of transthoracic biphasic cardioversion of atrial fibrillation. Heart Rhythm 2005, 2, 382–387. [Google Scholar] [CrossRef]
- Kim, M.L.; Kim, S.G.; Park, D.S.; Gross, J.N.; Ferrick, K.J.; Palma, E.C.; Fisher, J.D. Comparison of rectilinear biphasic waveform energy versus truncated exponential biphasic waveform energy for transthoracic cardioversion of atrial fibrillation. Am. J. Cardiol. 2004, 94, 1438–1440. [Google Scholar] [CrossRef] [PubMed]
- Schmidt, A.S.; Lauridsen, K.G.; Adelborg, K.; Torp, P.; Bach, L.F.; Jepsen, S.M.; Hornung, N.; Deakin, C.D.; Rickers, H.; Løfgren, B. Cardioversion Efficacy Using Pulsed Biphasic or Biphasic Truncated Exponential Waveforms: A Randomized Clinical Trial. J. Am. Heart Assoc. 2017, 6, e004853. [Google Scholar] [CrossRef] [PubMed] [Green Version]
- Lavignasse, D.; Trendafilova, E.; Dimitrova, E.; Krasteva, V. Cardioversion of Atrial Fibrillation and Flutter: Comparative Study of Pulsed vs. Low Energy Biphasic Truncated Exponential Waveforms. J. Atr. Fibrillation 2019, 12, 2172. [Google Scholar] [CrossRef]
- Schmidt, A.S.; Lauridsen, K.G.; Torp, P.; Bach, L.F.; Rickers, H.; Løfgren, B. Maximum-fixed energy shocks for cardioverting atrial fibrillation. Eur. Heart J. 2019, 41, 626–631. [Google Scholar] [CrossRef]
- Glover, B.M.; Walsh, S.J.; McCann, C.J.; Moore, M.J.; Manoharan, G.; Dalzell, G.W.; McAllister, A.; McClements, B.; McEneaney, D.J.; Trouton, T.G.; et al. Biphasic energy selection for transthoracic cardioversion of atrial fibrillation. The BEST AF Trial. Heart 2008, 94, 884–887. [Google Scholar] [CrossRef]
- Sadek, M.M.; Chaugai, V.; Cleland, M.J.; Zakutney, T.J.; Birnie, D.H.; Ramirez, F.D. Association between transthoracic impedance and electrical cardioversion success with biphasic defibrillators: An analysis of 1055 shocks for atrial fibrillation and flutter. Clin. Cardiol. 2018, 41, 666–670. [Google Scholar] [CrossRef] [PubMed] [Green Version]
- Krasteva, V.; Trendafilova, E.; Cansell, A.; Daskalov, I. Assessment of balanced biphasic defibrillation waveforms in transthoracic atrial cardioversion. J. Med. Eng. Technol. 2001, 25, 68–73. [Google Scholar] [CrossRef]
- IEC 60601-2-4:2010+AMD1:2018 n.d. Available online: https://webstore.iec.ch/publication/62752 (accessed on 13 January 2020).
- Kette, F.; Locatelli, A.; Bozzola, M.; Zoli, A.; Li, Y.; Salmoiraghi, M.; Ristagno, G.; Andreassi, A. Electrical features of eighteen automated external defibrillators: A systematic evaluation. Resuscitation 2013, 84, 1596–1603. [Google Scholar] [CrossRef]
- Nocchi, F.; Derrico, P.; Masucci, G.; Capussotto, C.; Cecchetti, C.; Ritrovato, M. Semiautomated external defibrillators for in-hospital early defibrillation: A comparative study. Int. J. Technol. Assess. Health Care 2014, 30, 78–89. [Google Scholar] [CrossRef]
- White, R.D. Caution when comparing different defibrillation waveforms and energies. Resuscitation 2016, 102, e1. [Google Scholar] [CrossRef]
- Deakin, C.D.; Callaway, C.W.; Soar, J. Reply to: “Caution when comparing different defibrillation waveforms and energies”. Resuscitation 2016, 102, e2. [Google Scholar] [CrossRef] [Green Version]
- Chen, B.; Yu, T.; Ristagno, G.; Quan, W.; Li, Y. Average current is better than peak current as therapeutic dosage for biphasic waveforms in a ventricular fibrillation pig model of cardiac arrest. Resuscitation 2014, 85, 1399–1404. [Google Scholar] [CrossRef] [PubMed]
- Adgey, A.A.J. Theory and practice of defibrillation: (1) Atrial fibrillation and DC conversion. Heart 2004, 90, 1493–1498. [Google Scholar] [CrossRef] [PubMed] [Green Version]
- Mudrov, T.N.; Krasteva, V.T.; Jekova, I.I.; Mudrov, N.T.; Matveev, M.G.; Stoyanov, T.V. Device for Data Collection During Cardioversion. Annu. J. Electron. 2010, 4, 142–145. [Google Scholar]
- Achleitner, U.; Rheinberger, K.; Furtner, B.; Amann, A.; Baubin, M. Waveform analysis of biphasic external defibrillators. Resuscitation 2001, 50, 61–70. [Google Scholar] [CrossRef]
- Rumeau, P.; Fourcade, J.; Duparc, A.; Hébrard, A.; Mondoly, P.; Rollin, A.; Massabuau, P.; Detis, N.; Elbaz, M.; Carrié, D.; et al. ST-segment changes after direct current external cardioversion for atrial fibrillation. Incidence, characteristics and predictive factors. Int. J. Cardiol. 2011, 148, 341–346. [Google Scholar] [CrossRef] [PubMed]
- Zelinger, A.B.; Falk, R.H.; Hood, W.B. Electrical-induced sustained myocardial depolarization as a possible cause for transient ST elevation post-DC elective cardioversion. Am. Heart J. 1982, 103, 1073–1074. [Google Scholar] [CrossRef]
- White, H.D. Pathobiology of Troponin Elevations. J. Am. Coll. Cardiol. 2011, 57, 2406–2408. [Google Scholar] [CrossRef] [Green Version]
- Walcott, G.P.; Killingsworth, C.R.; Ideker, R.E. Do clinically relevant transthoracic defibrillation energies cause myocardial damage and dysfunction? Resuscitation 2003, 59, 59–70. [Google Scholar] [CrossRef]
- Agusala, V.; Khera, R.; Cheeran, D.; Mody, P.; Reddy, P.P.; Link, M.S. Diagnostic and prognostic utility of cardiac troponin in post-cardiac arrest care. Resuscitation 2019, 141, 69–72. [Google Scholar] [CrossRef]
- Trendafilova, E.; Krasteva, V.; Lavignasse, D.; Dimitrova, E.; Grigorov, V.; Jouven, X. Cardioversion for atrial fibrillation: Efficacy of dose-response of low energy, high energy and pulsed biphasic truncated exponential waveforms. Resuscitation 2018, 130, e45–e46. [Google Scholar] [CrossRef]
- Callaway, C.W.; Soar, J.; Aibiki, M.; Böttiger, B.W.; Brooks, S.C.; Deakin, C.D.; Donnino, M.W.; Drajer, S.; Kloeck, W.; Morley, P.T.; et al. Part 4: Advanced Life Support: 2015 International Consensus on Cardiopulmonary Resuscitation and Emergency Cardiovascular Care Science With Treatment Recommendations. Circulation 2015, 132 (Suppl. S1), S84–S145. [Google Scholar] [CrossRef] [PubMed]


| Baseline Characteristics | BTE-HE Waveform (n = 38) | PB Waveform (n = 35) | p-Value |
|---|---|---|---|
| Age, years | 60.9 ± 9.3 | 64.1 ± 9.5 | 0.16 |
| Men, % (n) | 65.8 (25) | 60.0 (21) | 0.61 |
| Weight, kg | 95.2 ± 19.6 | 93.4 ± 19.3 | 0.39 |
| Height, cm | 175.4 ± 9.34 | 173.9 ± 9.47 | 0.50 |
| BMI, kg/m2 | 31.0 ± 5.85 | 30.9 ± 5.95 | 0.96 |
| BSA, m² | 2.16 ± 0.25 | 2.14 ± 0.26 | 0.64 |
| Lean BW, kg | 63.0 (52.8–72.2) | 61.5 (52.3–71.1) | 0.55 |
| Fat BW, kg | 28.7 (20.7–45.4) | 28.7 (20.5–39.6) | 0.94 |
| Chest circumference, cm | 114.5 ± 15.2 | 112.0 ± 13.0 | 0.46 |
| First-time CVS, % (n) | 78.9 (30) | 77.1 (27) | 0.85 |
| Struct heart disease, % (n) | 86.8 (33) | 88.6 (31) | 0.82 |
| Heart failure, % (n) | 42.1 (16) | 37.1 (13) | 0.66 |
| Diabetes, % (n) | 21.1 (8) | 20.0 (7) | 0.91 |
| Hypertension, % (n) | 55.3 (21) | 55.6 (20) | 0.98 |
| CAD, % (n) | 5.13 (2) | 5.56 (2) | 0.93 |
| Cardiomyopathy, % (n) | 7.69 (3) | 8.33 (3) | 0.92 |
| Valvular disease, % (n) | 17.9 (7) | 17.1 (6) | 0.93 |
| AF without comorbidities, % (n) | 12.8 (5) | 11.1 (4) | 0.82 |
| Persistent AF, % (n) | 44.7 (17) | 42.9 (15) | 0.86 |
| First detected AF, % (n) | 55.3 (21) | 57.1 (20) | 0.88 |
| COPD, % (n) | 23.7 (9) | 14.3 (5) | 0.31 |
| GFR ≤ 60, % (n) | 23.7 (9) | 28.6 (10) | 0.64 |
| EGFR, mL/min/1.73 m2 | 70.3 ± 18.3 | 66.3 ± 15.1 | 0.30 |
| AF duration, days | 42 (30–180) | 60 (30–210) | 0.58 |
| AF duration < 1 month, % (n) | 47.4 (18) | 34.3 (12) | 0.26 |
| AF duration < 1–12 months, % (n) | 39.5 (15) | 51.4 (18) | 0.35 |
| AF duration > 12 months, % (n) | 13.1 (5) | 14.3 (5) | 0.90 |
| Hb, (norm 120–160), g/L | 146.2 ± 12.6 | 146.7 ± 14.7 | 0.86 |
| Ht (norm 36–46), % (n) | 42.5 (39–45) | 42 (39–45) | 0.54 |
| WBC (norm 4–10), 109/L | 7.85 ± 2.24 | 7.94 ± 1.94 | 0.86 |
| Glu (norm 4.1–5.9), mmol/L | 5.8 (5.4–6.5) | 5.7 (5.2–6.9) | 0.16 |
| Urea (norm 2.8–7.2), mmol/L | 6.6 (5.5–7.7) | 6.3 (5.3–7.4) | 0.36 |
| Creat (norm 74–110), umol/L | 90 (80–111) | 94 (85–109) | 0.67 |
| Transesophageal Echocardiography | |||
| TEE, % (n) | 100 (38) | 97.1 (34) | 0.29 |
| Non-severe echo contrast, % (n) | 31.6 (12) | 31.4 (11) | 0.99 |
| LA (anterior-posterior), mm | 50.3 ± 9.56 | 48.5 ± 7.89 | 0.38 |
| LA < 50 mm, % (n) | 44.7 (17) | 60.0 (21) | 0.20 |
| LV TSD, mm | 35 (32–42) | 34 (30–40) | 0.45 |
| LV TDD, mm | 52.5 (50–57.5) | 52 (48.5–54.5) | 0.49 |
| LV TSV, mL | 55.5 (41–70) | 45 (33–64) | 0.28 |
| LV TDV, mL | 118 (95–148) | 102 (87–130) | 0.11 |
| LV EF, % (n) | 56.5 (49–61) | 52 (48–60) | 0.99 |
| Normal EF > 50%, % (n) | 68.4 (26) | 71.4 (25) | 0.78 |
| ASA Class | |||
| Class 1, % (n) | 7.89 (3) | 5.71 (2) | 0.71 |
| Class 2, % (n) | 39.5 (15) | 48.6 (17) | 0.44 |
| Class 3, % (n) | 44.7 (17) | 45.7 (16) | 0.93 |
| Class 4, % (n) | 7.89 (3) | 0 (0) | 0.09 |
| Anesthetic | |||
| Propofol, mg | 90 (80–140) | 90 (80–110) | 0.22 |
| Anticoagulation | |||
| Acenocumarol, % (n) | 36.8 (14) | 20.0 (7) | 0.12 |
| Heparin, % (n) | 5.26 (2) | 5.71 (2) | 0.93 |
| DOAC, % (n) | 57.9 (22) | 74.3 (26) | 0.14 |
| Antiarrhytmic drugs | |||
| Amiodarone, % (n) | 76.3 (29) | 80.0 (28) | 0.70 |
| Beta blocker, % (n) | 73.7 (28) | 74.3 (26) | 0.95 |
| CCB, % (n) | 0 (0) | 2.86 (1) | 0.30 |
| Digitalis, % (n) | 10.5 (4) | 17.1 (7) | 0.41 |
| Propafenone, % (n) | 21.1 (8) | 20.0 (7) | 0.91 |
| Number AAD (n) | 1.82 ± 0.56 | 1.94 ± 0.64 | 0.37 |
| ACE inhibitor/ARB, % (n) | 52.6 (20) | 54.3 (19) | 0.88 |
| Vital signs before CVS | |||
| HR, min−1 | 103.8 ± 19.3 | 97.3 ± 20.8 | 0.17 |
| Systolic BP, mmHg | 137.0 ± 18.2 | 139.8 ± 18.1 | 0.52 |
| Diastolic BP, mmHg | 87.6 ± 14.4 | 88.9 ± 13.3 | 0.68 |
| Efficacy CVS Outcomes | BTE-HE Waveform (n = 38) | PB Waveform (n = 35) | Mean Difference [95% CI] | p-Value |
|---|---|---|---|---|
| Primary endpoint | ||||
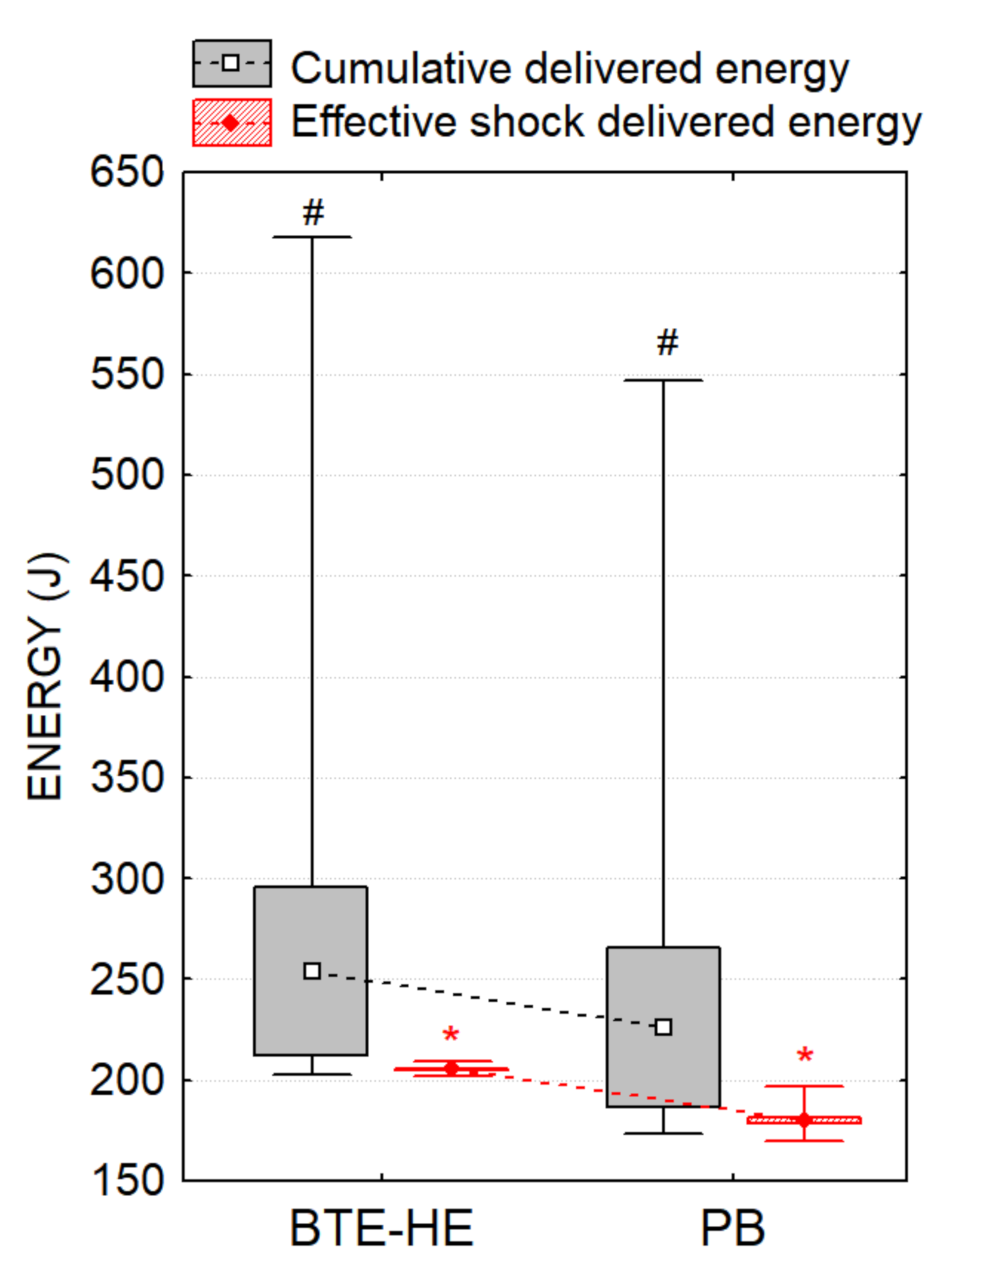
| Cumulative delivered energy, J | 253.9 ± 120.2 | 226.0 ± 109.8 | −27.9 [−81.8, 26.0] | 0.31 |
| Secondary endpoints | ||||
| Delivered energy of the effective shock, J | 205.5 ± 1.53 | 179.9 ± 4.51 | −25.6 [−27.1, −24.0] | <0.001 * |
| Number of delivered shocks | 1.263 ± 0.601 | 1.257 ± 0.610 | −0.006 [−0.289, 0.277] | 0.97 |
| 1st shock cumulative success rate at 1 min, % (n) | 84.2 (32) | 82.9 (29) | −1.35 [−18.9, 16.2] | 0.88 |
| 2nd shock cumulative success rate at 1 min, % (n) | 92.1 (35) | 91.4% (32) | −0.7 [−13.7, 12.3] | 0.92 |
| CVS success rate at 1 min, % (n) | 97.4 (37) | 94.3 (33) | −3.1 [−12.5, 6.3] | 0.51 |
| CVS success rate at 2 h, % (n) | 94.7 (36) | 94.3 (33) | −0.45 [−11.2, 10.3] | 0.93 |
| CVS success rate at 24 h, % (n) | 92.1 (35) | 94.3 (33) | 2.2 [−9.8, 14.1] | 0.72 |
| Safety CVS Outcomes | BTE-HE Waveform | PB Waveform | p-Value |
|---|---|---|---|
| Complications after CVS (2 h follow-up) | (n = 38) | (n = 35) | |
| Apnea, % (n) | 0 (0/38) | 0 (0/35) | NA |
| Rhythm disorders, % (n) | 34.2 (13/38) | 48.6 (17/35) | 0.22 |
| Rhythm disorders requiring medication, % (n) | 38.5 (5/13) | 24.0 (4/17) | 0.41 |
| E xtrasystoles , % (n) | 18.4 (7/38) | 45.7 (16/35) | 0.012 * |
| AF runs (transient), % (n) | 15.8 (6/38) | 2.86 (1/35) | 0.062 |
| Supraventricular tachycardia, % (n) | 0 (0/38) | 0 (0/35) | NA |
| Ventricular tachycardia/fibrillation, % (n) | 0 (0/38) | 0 (0/35) | NA |
| Blocks, % (n) | 23.7 (9/38) | 28.6 (10/35) | 0.64 |
| SA blocks, % (n) | 18.4 (7/38) | 17.1 (6/35) | 0.89 |
| AV blocks, % (n) | 5.26 (2/38) | 11.4 (4/35) | 0.34 |
| Blocks requiring Atropine, % (n) | 0 (0/9) | 10 (1/10) | 0.34 |
| Blocks requiring pacemaker, % (n) | 0 (0/9) | 0 (0/10) | NA |
| Post-shock ST-changes | (n = 38) | (n = 35) | |
| ST-shift (10 s after shock 1), mm | 0.069 ± 0.341 | 0.014 ± 0.085 | 0.36 |
| ST-shift (10 s after shock 1), % (n) | 5.56 (2/38) | 2.86 (1/35) | 0.57 |
| ST-shift (10 s after shock 2), mm | 0 ± 0.00 | 0 ± 0.00 | NA |
| ST-shift (10 s after shock 2), % (n) | 0 (0/7) | 0 (0/6) | NA |
| ST-shift (10 s after shock 3), mm | 0.333 ± 0.577 | 0 ± 0.00 | 0.37 |
| ST-shift (10 s after shock 3), % (n) | 33.3 (1/3) | 0 (0/3) | 0.34 |
| ST-shift (2–5 min after CVS), % (n) | 0 (0/38) | 0 (0/35) | NA |
| T-inverse, (2–5 min after CVS), % (n) | 0 (0/38) | 5.71 (2/35) | 0.14 |
| Vital parameters after CVS (2 h follow-up) | (n = 38) | (n = 35) | 0.63 |
| HR (1 min), min−1 | 65.7 ± 12.4 | 64.3 ± 11.7 | 0.73 |
| HR (1 h), min −1 | 65.4 ± 11.5 | 63.1 ± 10.4 | 0.45 |
| HR (2 h), min −1 | 66.1 ± 9.21 | 64.5 ± 11.8 | 0.52 |
| Systolic BP (1 min), mmHg | 116 ± 15.2 | 121 ± 17.9 | 0.25 |
| Systolic BP (1 h), mmHg | 117 ± 15.7 | 120 ± 15.7 | 0.56 |
| Systolic BP (2 h), mmHg | 121 ± 16.9 | 126 ± 14.4 | 0.56 |
| Diastolic BP (1 min), mmHg | 72.1 ± 9.7 | 70.6 ± 11.9 | 0.59 |
| Diastolic BP (1 h), mmHg | 71.8 ± 10.7 | 70.8 ± 10.1 | 0.74 |
| Diastolic BP (2 h), mmHg | 73.8 ± 11.6 | 73.6 ± 10.5 | 0.95 |
| Cardiac biomarkers | (n = 35) | (n = 34) | |
| hsTnI before CVS (99th percentile = 0.02), ng/mL | 0.0044 (0.0027–0.0123) | 0.0045 (0.0036–0.0071) | 0.36 |
| hsTnI after CVS (99th percentile = 0.02), ng/mL | 0.0055 (0.0037–0.0106) | 0.0064 (0.0043–0.0133) | 0.35 |
| hsTnI change, ng/mL | 0.0005 (−0.0009–0.0019) | 0.0008 (−0.0004–0.0017) | 0.36 |
| Elevated hsTnI after CSV a , % (n) | 2.86 (1/35) | 2.94% (1/34) | 0.98 |
| CK before CVS (ULN = 171), IU/L | 75 (50–114) | 92 (74–174) | 0.008 * |
| CK after CVS (ULN = 171), IU/L | 70 (52–101) | 82 (64–115) | 0.92 |
| CK change, IU/L | −5 (−15–11) | −17 (−53–10) | 0.08 |
| Elevated CK after CSV b , % (n) | 2.86 (1/35) | 2.94 (1/34) | 0.98 |
| MB before CVS (ULN = 25), IU/L | 11.0 (8.3–15.0) | 11.6 (9.1–15.0) | 0.17 |
| MB after CVS (ULN = 25), IU/L | 10.7 (9.1–13.7) | 10.8 (8.9–12.6) | 0.84 |
| MB change, IU/L | 0.25 (−2.1–3.85) | −0.2 (−2.1–1.8) | 0.24 |
| Elevated MB after CSV c , % (n) | 0 (0/35) | 0 (0/35) | NA |
Publisher’s Note: MDPI stays neutral with regard to jurisdictional claims in published maps and institutional affiliations. |
© 2021 by the authors. Licensee MDPI, Basel, Switzerland. This article is an open access article distributed under the terms and conditions of the Creative Commons Attribution (CC BY) license (https://creativecommons.org/licenses/by/4.0/).
Share and Cite
Trendafilova, E.; Dimitrova, E.; Didon, J.-P.; Krasteva, V. A Randomized Comparison of Delivered Energy in Cardioversion of Atrial Fibrillation: Biphasic Truncated Exponential Versus Pulsed Biphasic Waveforms. Diagnostics 2021, 11, 1107. https://doi.org/10.3390/diagnostics11061107
Trendafilova E, Dimitrova E, Didon J-P, Krasteva V. A Randomized Comparison of Delivered Energy in Cardioversion of Atrial Fibrillation: Biphasic Truncated Exponential Versus Pulsed Biphasic Waveforms. Diagnostics. 2021; 11(6):1107. https://doi.org/10.3390/diagnostics11061107
Chicago/Turabian StyleTrendafilova, Elina, Elena Dimitrova, Jean-Philippe Didon, and Vessela Krasteva. 2021. "A Randomized Comparison of Delivered Energy in Cardioversion of Atrial Fibrillation: Biphasic Truncated Exponential Versus Pulsed Biphasic Waveforms" Diagnostics 11, no. 6: 1107. https://doi.org/10.3390/diagnostics11061107