
Hypercoagulability as Measured by Thrombelastography May Be Associated with the Size of Acute Ischemic Infarct—A Pilot Study

 , , ,
, , ,
Abstract
:1. Introduction
2. Materials and Methods
2.1. Study Design and Participants
2.2. Thrombelastography
2.3. The Volumetric Evaluation
2.4. Ethical Statement
2.5. Statistical Evaluation Methods
3. Results
3.1. The Entire Group
3.2. Large Artery Atherosclerosis and Small Vessel Disease
4. Discussion
5. Conclusions
Author Contributions
Funding
Institutional Review Board Statement
Informed Consent Statement
Data Availability Statement
Conflicts of Interest
References
- Mallett, S.V.; Cox, D.J. Thrombelastography. Br. J. Anaesth. 1992, 69, 307–313. [Google Scholar] [CrossRef]
- Srinivasa, V.; Gilbertson, L.I.; Bhavani-Shankar, K. Thromboelastography: Where is it and where is it heading? Int. Anesth. Clin. 2001, 39, 35–49. [Google Scholar] [CrossRef]
- Takano, K.; Yamaguchi, T.; Uchida, K. Markers of a hypercoagulable state following acute ischemic stroke. Stroke 1992, 23, 194–198. [Google Scholar] [CrossRef] [PubMed] [Green Version]
- Roeloffzen, W.W.; Kluin-Nelemans, H.C.; Mulder, A.B.; Veeger, N.J.; Bosman, L.; de Wolf, J.T. In normal controls, both age and gender affect coagulability as measured by thrombelastography. Anesth. Analg. 2010, 110, 987–994. [Google Scholar] [CrossRef] [PubMed]
- Feinberg, W.M.; Erickson, L.P.; Bruck, D.; Kittelson, J. Hemostatic markers in acute ischemic stroke. Association with stroke type, severity, and outcome. Stroke 1996, 27, 1296–1300. [Google Scholar] [CrossRef] [PubMed]
- Wiśniewski, A.; Filipska, K. The Phenomenon of Clopidogrel High On-Treatment Platelet Reactivity in Ischemic Stroke Subjects: A Comprehensive Review. Int. J. Mol. Sci. 2020, 21, 6408. [Google Scholar] [CrossRef] [PubMed]
- Kang, Y. Thromboelastography in liver transplantation. Semin. Thromb. Hemost. 1995, 21, 34–44. [Google Scholar] [CrossRef]
- Shore-Lesserson, L.; Manspeizer, H.E.; DePerio, M.; Francis, S.; Vela-Cantos, F.; Ergin, M.A. Thromboelastography-guided transfusion algorithm reduces transfusions in complex cardiac surgery. Anesth. Analg. 1999, 88, 312–319. [Google Scholar]
- McCrath, D.J.; Cerboni, E.; Frumento, R.J.; Hirsh, A.L.; Bennett-Guerreo, E. Thromboelastography maximum amplitude predicts postoperative thrombotic complications including myocardial infarction. Anesth. Analg. 2005, 100, 1576–1583. [Google Scholar] [CrossRef] [PubMed]
- Barbosa, C.J.D.G.; de Souza Barreiros, R.; Franci, A.; Arantes, F.B.B.; de Mendonça Furtado, R.H.; Strunz, C.M.C.; da Rocha, T.R.F.; Baracioli, L.M.; Ramires, J.A.F.; Kalil Filho, R.; et al. Platelet function, coagulation and fibrinolysis in patients with previous coronary and cerebrovascular ischemic events. Clinics 2019, 74, e1222. [Google Scholar] [CrossRef] [PubMed]
- Bolliger, D.; Seeberger, M.D.; Tanaka, K.A. Principles and practice of thromboelastography in clinical coagulation management and transfusion practice. Transfus. Med. Rev. 2012, 26, 1–13. [Google Scholar] [CrossRef]
- De Villiers, S.; Swanepoel, A.; Bester, J.; Pretorius, E. Novel Diagnostic and Monitoring Tools in Stroke: An Individualized Patient-Centered Precision Medicine Approach. J. Atheroscler. Tromb. 2016, 23, 493–504. [Google Scholar] [CrossRef] [PubMed] [Green Version]
- Yu, G.; Kim, Y.-J.; Jeon, S.-B.; Kim, W.Y. Thromboelastography for prediction of hemorrhagic transformation in patients with acute ischemic stroke. Am. J. Emerg. Med. 2020, 38, 1772–1777. [Google Scholar] [CrossRef] [PubMed]
- Shi, Z.; Zheng, W.C.; Fu, X.L.; Fang, X.W.; Xia, P.S.; Yuan, W.J. Hypercoagulation on Thromboelastography Predicts Early Neurological Deterioration in Patients with Acute Ischemic Stroke. Cereb. Dis. 2018, 46, 125–131. [Google Scholar] [CrossRef]
- Rowe, A.S.; Green, C.L.; Snider, C.C.; Caroll, R.C.; Wiseman, B.F.; Henry, J.M.; Langdon, J.R.; Craft, R.M. Thromboelastographic changes in patients experiencing an acute ischemic stroke and receiving alteplase. J. Stroke Cereb. Dis. 2014, 23, 1307–1311. [Google Scholar] [CrossRef] [PubMed]
- Yao, X.; Dong, Q.; Song, Y.; Wang, Y.; Deng, Y.; Li, Y. Thrombelastrography maximal clot strength could predict one year functional outcome in patients with ischemic stroke. Cereb. Dis. 2014, 38, 182–190. [Google Scholar] [CrossRef] [PubMed]
- Windelov, N.A.; Welling, K.L.; Ostrowski, S.R.; Johansson, P.I. The prognostic value of thrombelastography in identifying neurosurgical patients with worse prognosis. Blood Coagul. Fibrinolysis 2011, 22, 416–419. [Google Scholar] [CrossRef] [PubMed]
- McDonald, M.M.; Wetzel, J.; Fraser, S.; Elliot, A.; Bowry, R.; Kawano-Castillo, J.F.; Cai, C.; Sangha, N.; Messier, J.; Hassler, A.; et al. Thrombelastography does not predict clinical response to rtPA for acute ischemic stroke. J. Thromb. Thrombolysis 2016, 41, 505–510. [Google Scholar] [CrossRef]
- Watson, T.; Shantsila, E.; Lip, G.Y. Mechanisms of thrombogenesis in atrial fibrillation: Virchow’s triad revisited. Lancet 2009, 373, 155–166. [Google Scholar] [CrossRef]
- Rafiq, S.; Johansson, P.I.; Kofoed, K.F.; Lund, J.T.; Olsen, P.S.; Bentsen, S.; Steinbruechel, D.A. Thrombelastographic hypercoagulability and antiplatelet therapy after coronary artery bypass surgery (TEG-CABG trial): A randomized controlled trial. Platelets 2017, 28, 786–793. [Google Scholar] [CrossRef] [PubMed]
- Liang, C.; Yang, Y.; He, Z.; Ma, S.; Qu, X.; Luo, Y.; Shen, C.; Xu, R. Comparison between thromboelastography and the conventional coagulation test in detecting effects of antiplatelet agents after endovascular treatments in acute ischemic stroke patients: A STROBE-compliant study. Medicine 2020, 99, e19447. [Google Scholar] [CrossRef] [PubMed]
- Elliot, A.; Wetzel, J.; Roper, T.; Pivalizza, E.; McCarthy, J.; Wallace, C.; Hess, M.J.; Peng, H.; Rahbar, M.H.; Sangha, N.; et al. Thromboelastography in patients with acute ischemic stroke. Int. J. Stroke 2015, 10, 194–201. [Google Scholar] [CrossRef] [Green Version]
- Kawano-Castillo, J.; Ward, E.; Elliott, A.; Wetzel, J.; Hassler, A.; McDonald, M.; Parker, S.A.; Archeval-Lao, J.; Tremont, C.; Cai, C.; et al. Thrombelastography detects possible coagulation disturbance in patients with intracerebral hemorrhage with hematoma enlargement. Stroke 2014, 45, 683–688. [Google Scholar] [CrossRef] [PubMed] [Green Version]
- Kinsella, J.A.; Tobin, W.O.; Hamilton, G.; McCabe, D.J. Platelet activation, function, and reactivity in atherosclerotic carotid artery stenosis: A systematic review of the literature. Int. J. Stroke 2013, 8, 451–464. [Google Scholar] [CrossRef]
- Tsai, N.W.; Chang, W.N.; Shaw, C.F.; Jan, C.R.; Chang, H.W.; Huang, C.R.; Chen, S.D.; Chuang, Y.C.; Lee, L.H.; Wang, H.C.; et al. Levels and value of platelet activation markers in di_erent subtypes of acute non-cardio-embolic ischemic stroke. Thromb. Res. 2009, 124, 213–218. [Google Scholar] [CrossRef]
- Wiśniewski, A.; Sikora, J.; Sławińska, A.; Filipska, K.; Karczmarska-Wódzka, A.; Serafin, Z.; Kozera, G. High On-Treatment Platelet Reactivity Affects the Extent of Ischemic Lesions in Stroke Patients Due to Large-Vessel Disease. J. Clin. Med. 2020, 9, 251. [Google Scholar] [CrossRef] [PubMed] [Green Version]
- Huang, R.P.; McDonald, M.M.; Wetzel, J.S.; Kawano-Castillo, J.; Parker, S.; Archeval-Lao, J.; Cai, C.; Rahbar, M.H.; Nguyen, A.N.D.; Baba, S.J.; et al. Clot strength as measured by thromboelastography correlates with platelet reactivity in stroke patients. Ann. Clin. Lab. Sci. 2015, 45, 301–307. [Google Scholar] [PubMed]
- Barua, R.S.; Sy, F.; Srikanth, S.; Huang, G.; Javed, U.; Buhari, C.; Margosan, D.; Ambrose, J.A. Effects of cigarette smoke exposure on clot dynamics and fibrin structure: An ex vivo investigation. Arterioscler. Thromb. Vasc. Biol. 2010, 30, 75–79. [Google Scholar] [CrossRef] [Green Version]


| Parameter | Value |
|---|---|
| Age in years, median (range) | 68.5 (43–89) |
| Sex, male, N (%) | 21(52.5%) |
| Large artery atherosclerosis, N (%) Small vessel disease, N (%) | 15 (37.5%) 25 (62.5%) |
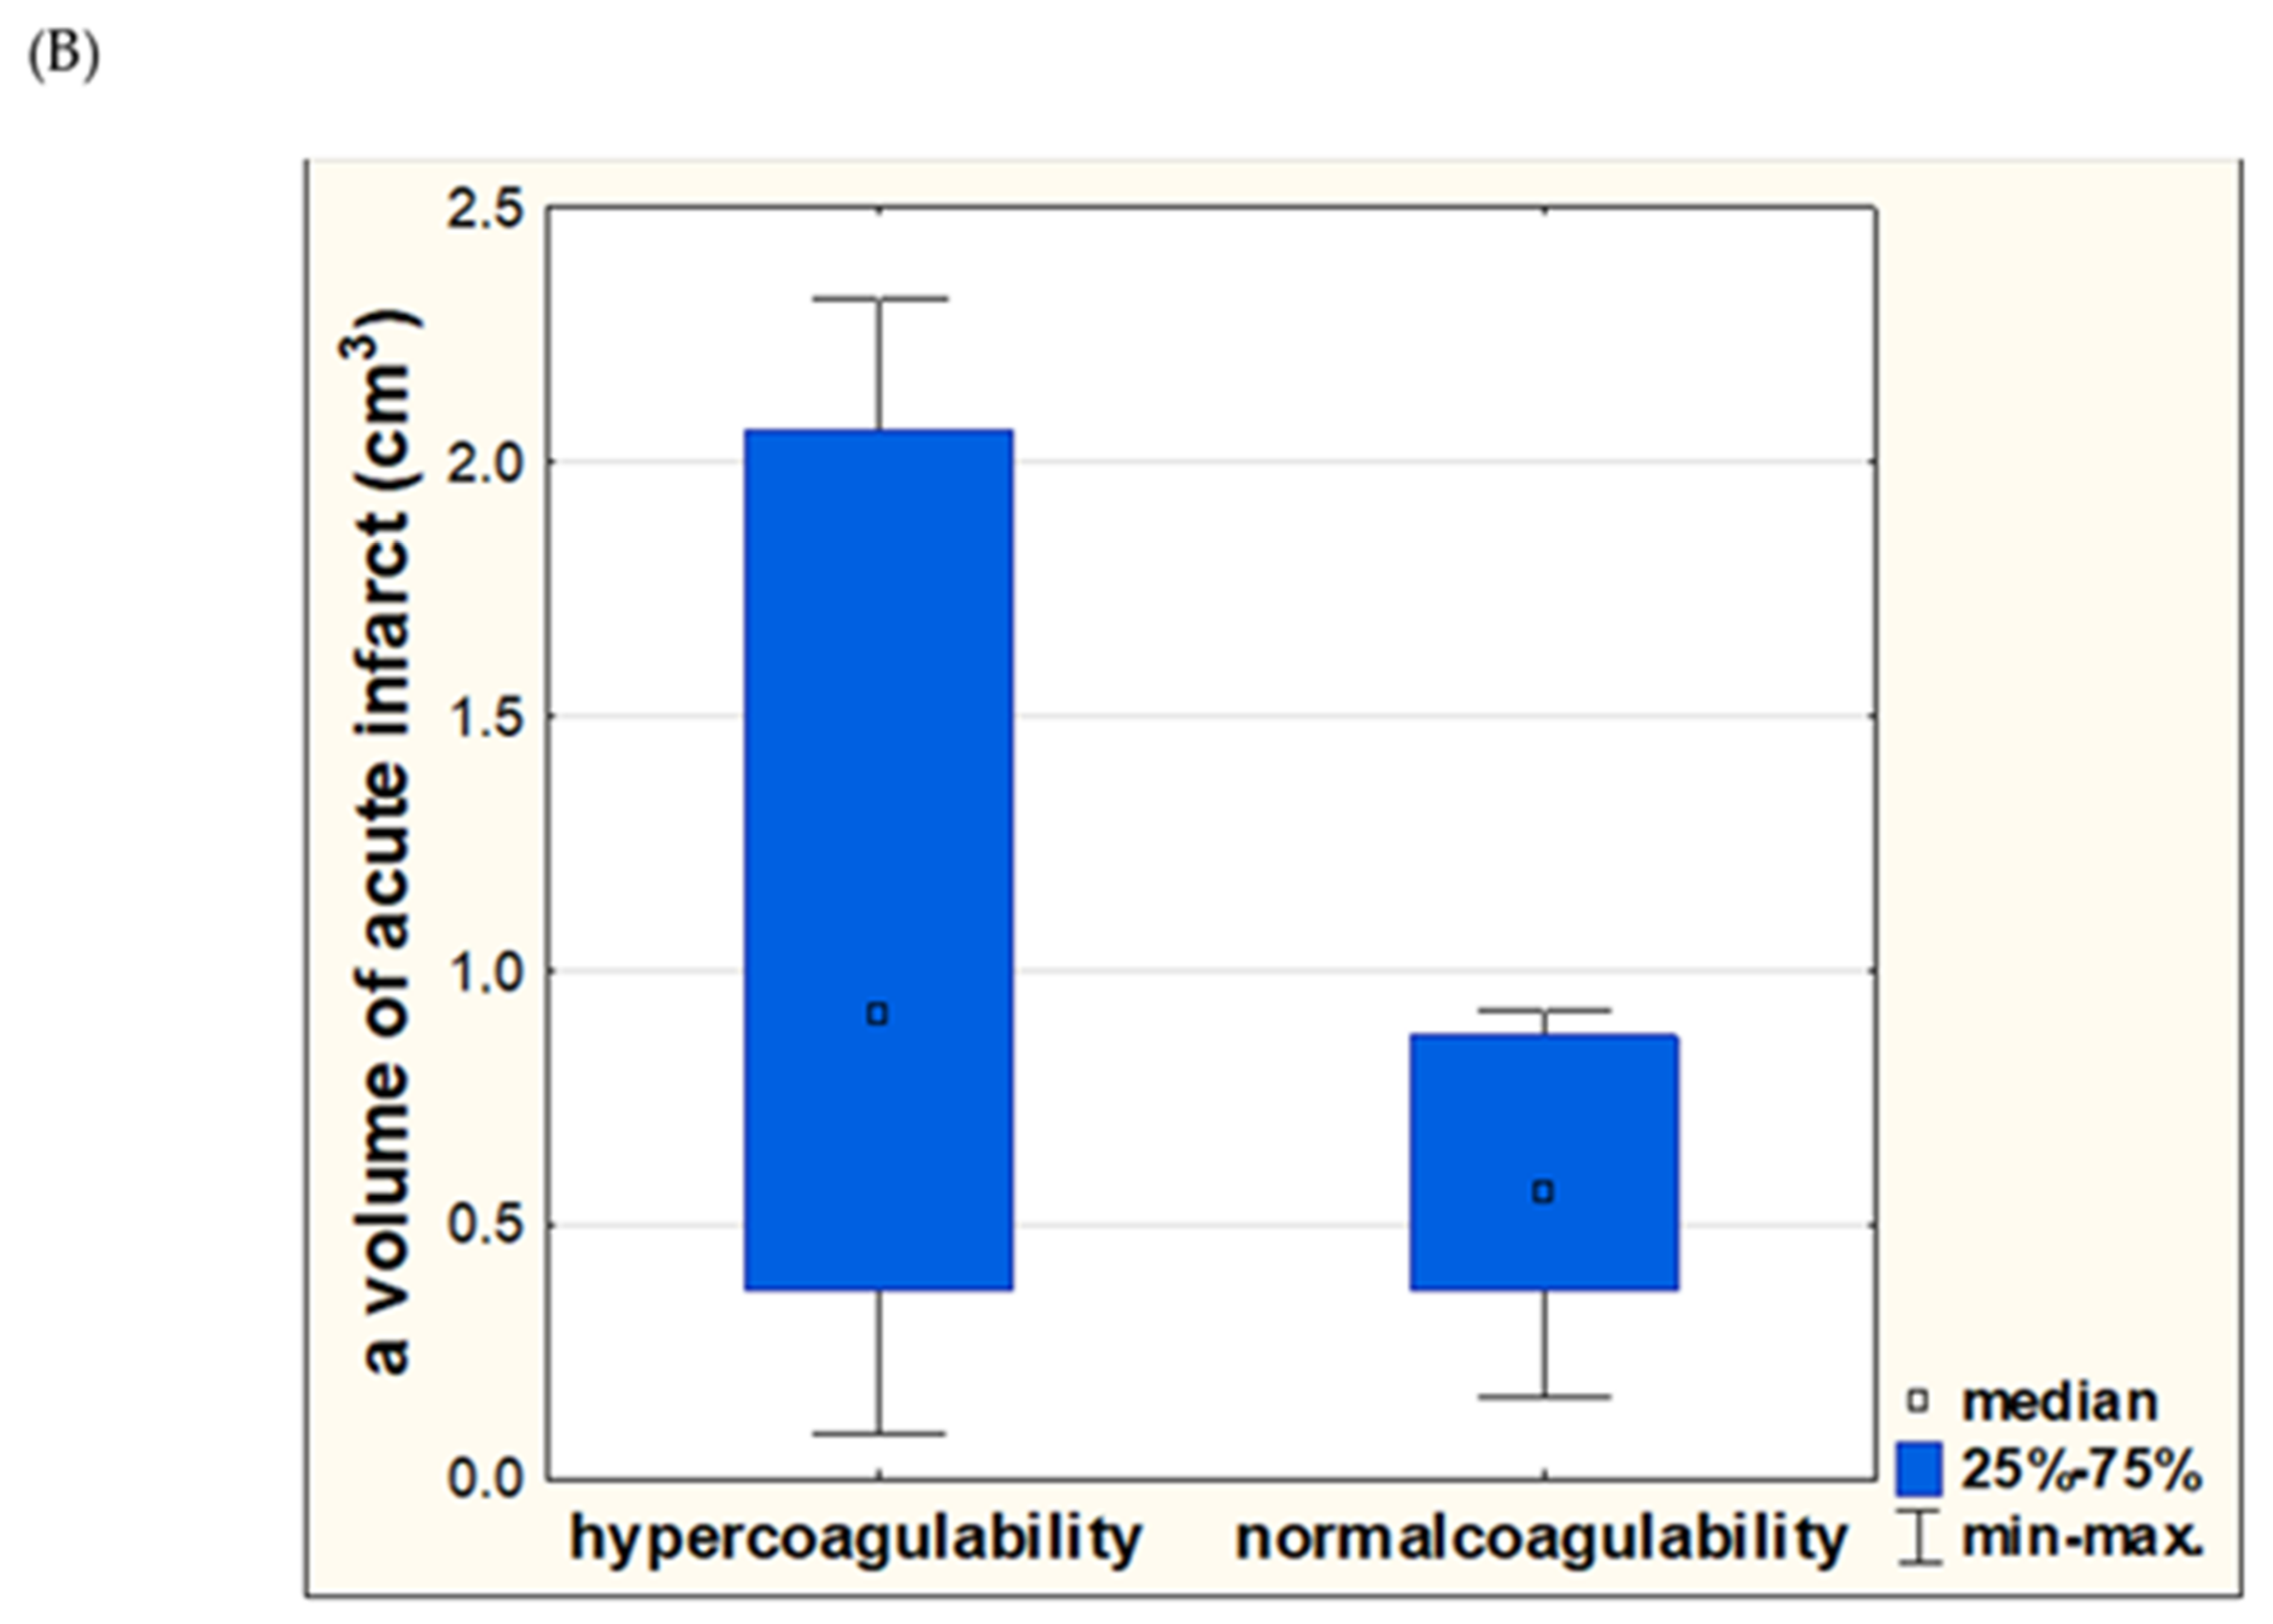
| Hypercoagulability, N (%) | 21 (52.5%) |
| NIHSS (points) at admission, median (range) NIHSS (points) at discharge, median (range) | 4 (2–15) 3 (1–14) |
| mRS (points) at admission, median (range) mRS (points) at discharge, median (range) | 2 (1–5) 1 (0–5) |
| R (minutes), median (range) K (minutes), median (range) Ly30 (%), median (range) MA (mm), median (range) Angle (alpha), degrees, median (range) | 8.85 (2.4–21.3) 2.3 (1.1–5.8) 0.25 (0–78.1) 69.25 (15.6–79.8) 55.6 (24.3–73.1) |
| Volume of acute infarct (cm3), median (range) | 1.46 (0.09–136.45) |
| Large infarct, (>2 cm3), N (%) Small infarct (<2 cm3), N (%) | 14 (35%) 26 (65%) |
| Hypertension, N (%) | 29 (72.5%) |
| Diabetes, N (%) | 12 (30%) |
| Hyperlipidemia, N (%) | 13 (32.5%) |
| Smoking, N (%) | 19 (47.5%) |
| Obesity, N (%) | 8 (20%) |
| CRP (mg/L) median (range) | 2.37 (0.21–67.4) |
| HBA1c (%) median (range) | 5.8 (4.8–13.1) |
| Platelets (thousands/µL) median (range) | 268 (102–618) |
| Fibrinogen (mg/dL) median (range) | 363 (110–646) |
| Parameter | Large Infarct (n = 14) | Small Infarct (n = 26) | p-Values |
|---|---|---|---|
| Age, median (range) | 71.5 (56–85) | 66.5 (43–89) | 0.3268 |
| Sex, male, N (%) | 7 (50%) | 14 (50%) | 0.9145 |
| Hypertension, N (%) | 12 (80%) | 17 (68%) | 0.6114 |
| Diabetes, N (%) | 4 (28.6%) | 8 (32%) | 0.6350 |
| Hyperlipidemia, N (%) | 7 (50%) | 6 (23%) | 0.0343 |
| Smoking, N (%) | 8 (57.1%) | 11 (42.3%) | 0.2632 |
| Obesity, N (%) | 2 (14.2%) | 6 (23%) | 0.3128 |
| CRP (mg/L) median (range) | 2.60 (0.97–67.4) | 1.72 (0.21–13.4) | 0.6259 |
| HBA1c (%) median (range) | 5.8 (5.3–13.1) | 5.6 (4.8–7.2) | 0.1756 |
| Platelet count (thousands/µL) median (range) | 285 (159–618) | 240 (102–395) | 0.2752 |
| Fibrinogen (mg/dL) median (range) | 382 (110–646) | 363 (241–480) | 0.3529 |
| Hypercoagulability, N (%) | 9 (64.3%) | 12 (46.2%) | 0.2233 |
| NIHSS at admission median (range) | 8 (2–15) | 4 (2–7) | 0.0054 |
| NIHSS at discharge median (range) | 6 (2–14) | 3 (1–6) | 0.0043 |
| mRS at admission median (range) | 4 (1–5) | 2 (0–4) | 0.0633 |
| mRS at discharge median (range) | 3 (1–5) | 1 (0–3) | 0.0613 |
| R (minutes), median (range) | 9.6 (5.4–21.3) | 9 (2.4–18.2) | 0.8345 |
| K (minutes), median (range) | 2.4 (1.2–5.8) | 2.5 (1.1–4.2) | 0.5419 |
| Ly30 (%), median (range) | 0.2 (0.0–1.0) | 0.4 (0.01–78.1) | 0.2186 |
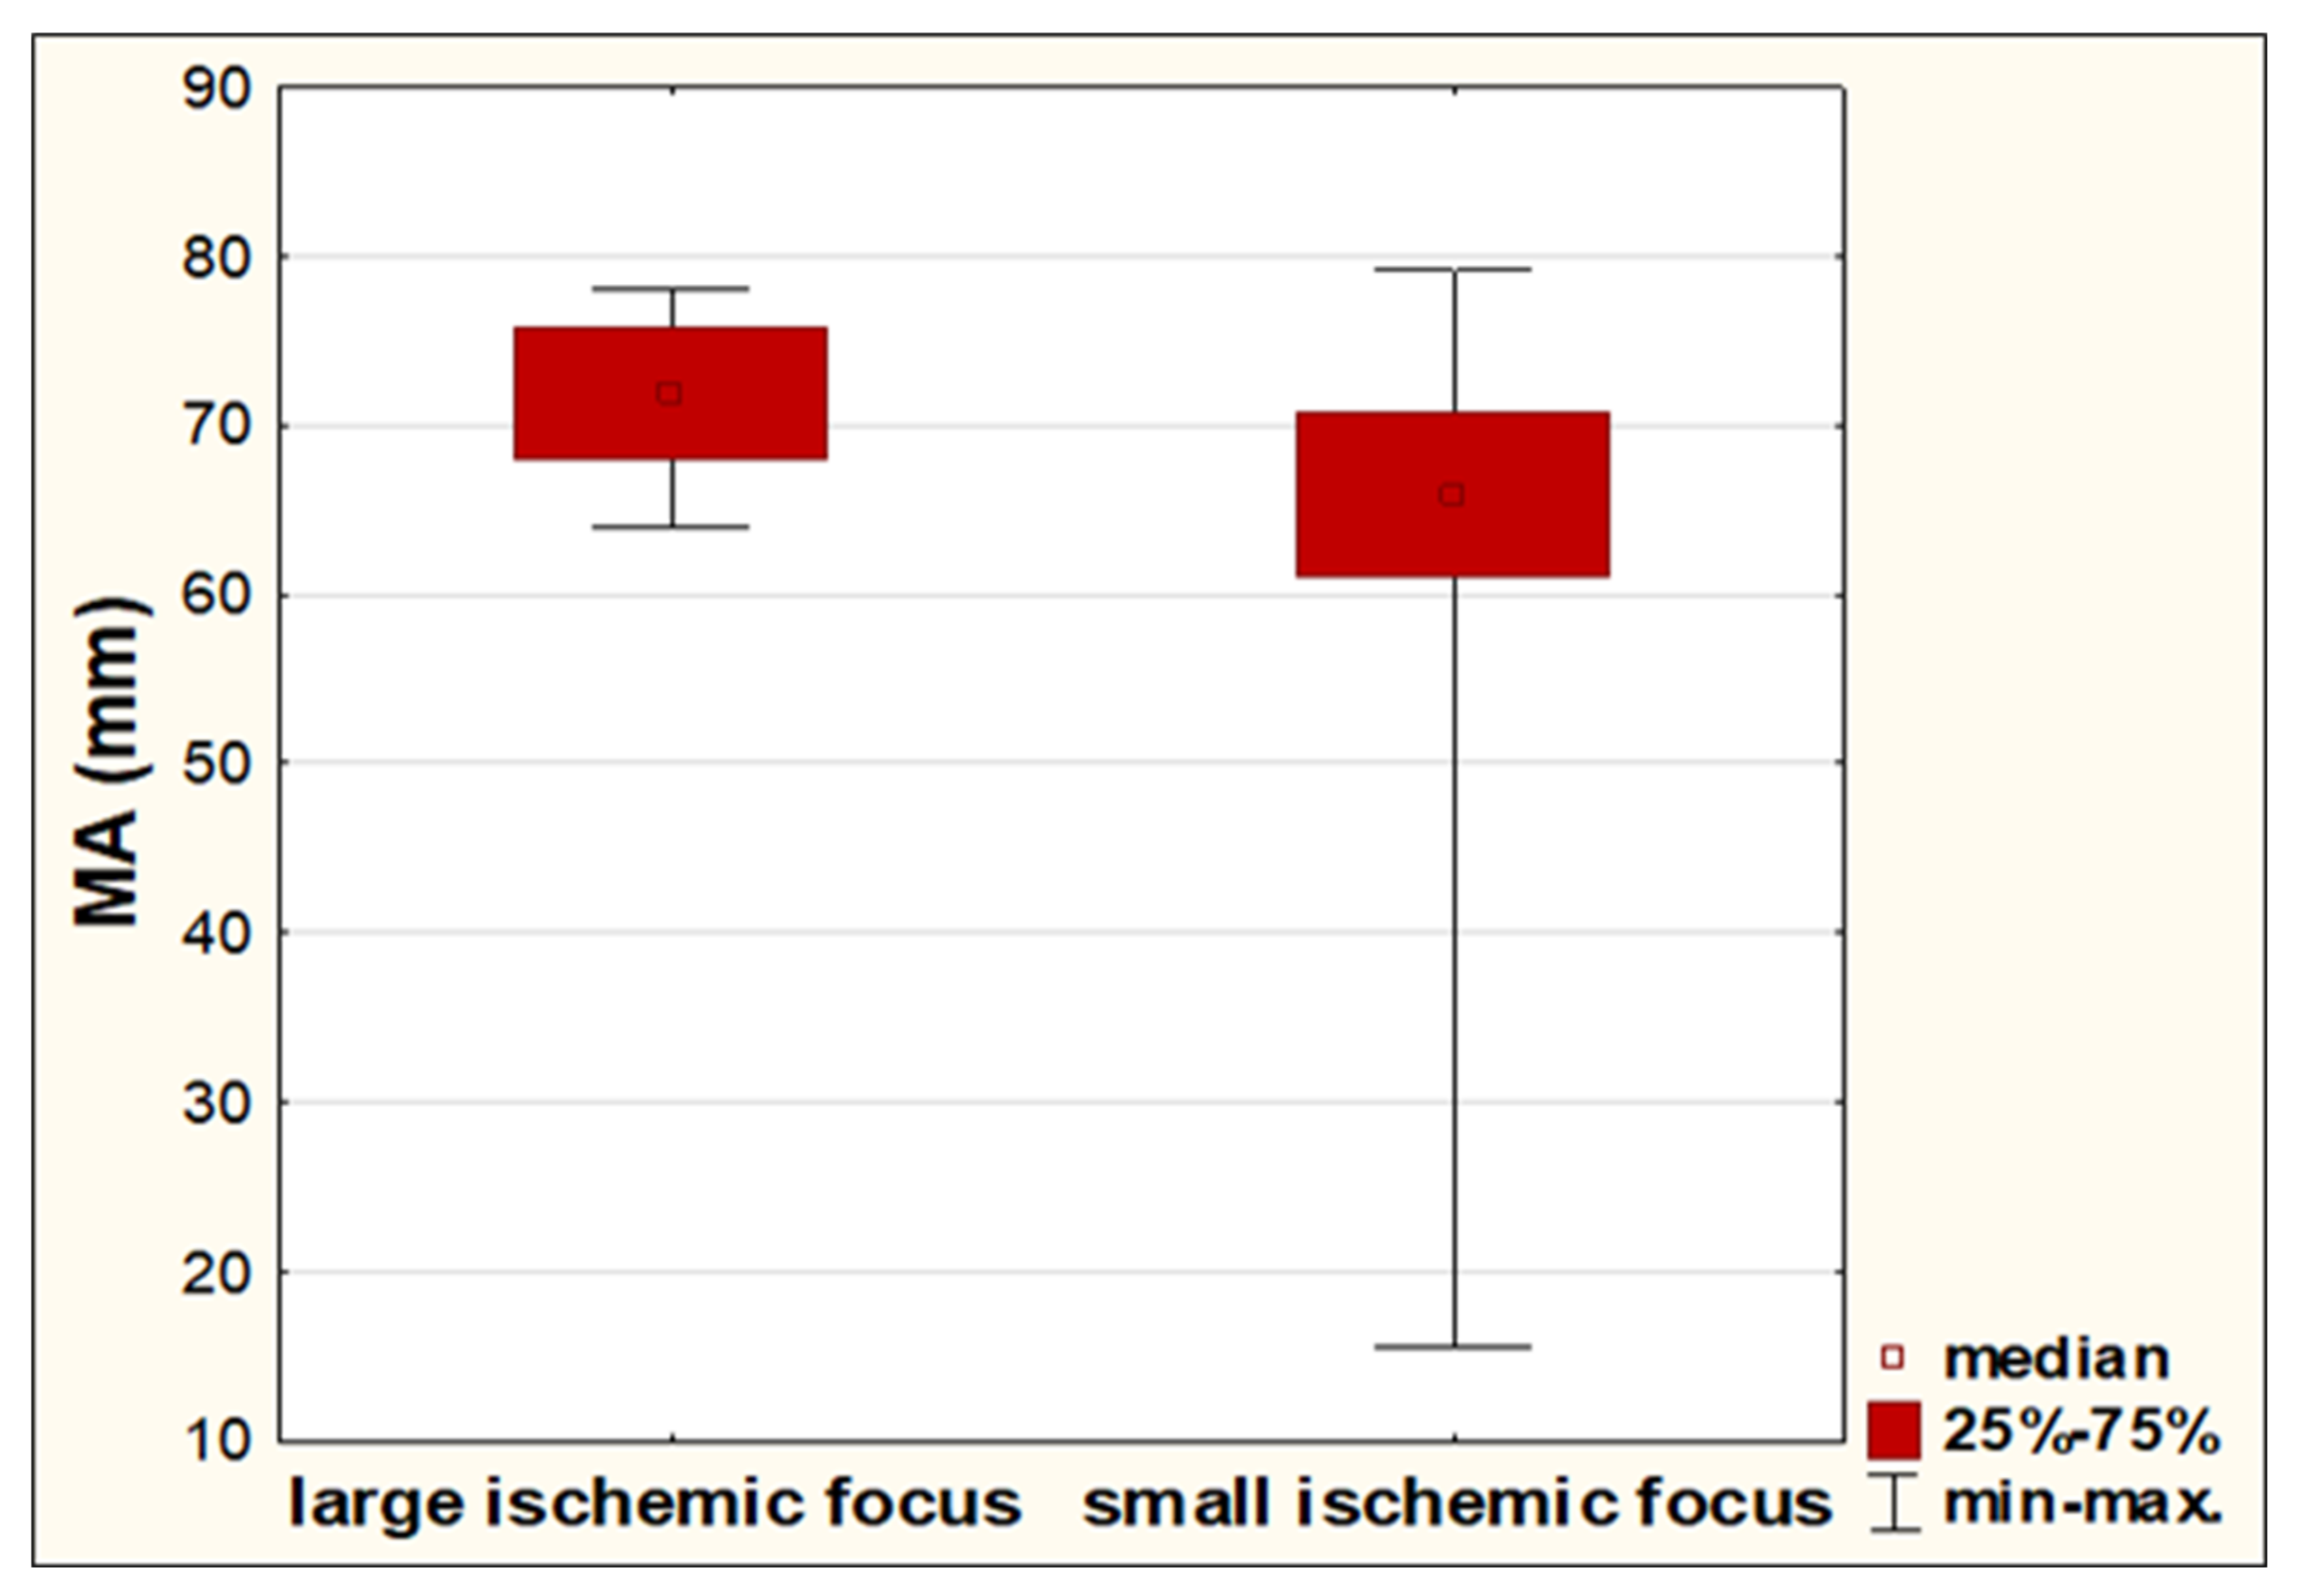
| MA (mm), median (range) | 71.8 (63.9–78.0) | 65.9(15.6–79.8) | 0.0168 |
| Angle (alpha), degrees, median (range) | 59.2 (43.6–71.7) | 54.2 (24.3–73.1) | 0.1144 |
| Volume of acute infarct (cm3), median (range) | 5.5 (2.06–136.5) | 0.73 (0.09–1.86) | <0.0001 |
| Parameter | OR (95% CI) | p |
|---|---|---|
| Hypercoagulability | 4.4 (0.89, 21.78) | 0.0694 |
| Sex (female) | 0.92 (0.20, 4.17) | 0.9122 |
| Large artery atherosclerosis | 3.33 (0.69, 16.02) | 0.1328 |
| Age | 1.06 (0.98, 1.15) | 0.1584 |
| NIHSS score | 1.83 (1.15, 2.90) | 0.0106 * |
| Platelet count | 1.01 (0.99, 1.02) | 0.1531 |
| Fibrinogen | 1.00 (0.99, 1.01) | 0.4317 |
| Hypertension | 1.67 (0.25, 11.07) | 0.5970 |
| Smoking | 0.71 (0.16, 3.23) | 0.6621 |
| Hyperlipidemia | 3.0 (0.61, 14.86) | 0.1785 |
| Diabetes | 5.0 (0.77, 32.57) | 0.0923 |
| Variables | Adjusted OR (95% CI) | p |
|---|---|---|
| Sex (female) | 0.06 (0.00, 3.71) | 0.1823 |
| Age | 1.16 (0.96, 1.39) | 0.1272 |
| Hypercoagulability | 59.05 (1.08, 3558.8) | 0.0488 * |
| Large artery atherosclerosis | 19.27 (0.40, 919.2) | 0.1335 |
| NIHSS score | 1.82 (0.90, 3.69) | 0.0976 |
| Parameter | Large Artery Atheroscleros (n = 15) | Small Vessel Disease (n = 25) | p-Values |
|---|---|---|---|
| Age, median (range) | 67 (43–89) | 69 (54–85) | 0.4418 |
| Sex, male, N (%) | 7 (46.7%) | 14 (56%) | 0.4059 |
| Hypertension, N (%) | 13 (86.7%) | 16 (64%) | 0.4356 |
| Diabetes, N (%) | 4 (26.6%) | 8 (32%) | 0.5050 |
| Hyperlipidemia, N (%) | 8 (53.3%) | 5 (20%) | 0.0343 |
| Smoking, N (%) | 9 (60%) | 10 (40%) | 0.2876 |
| Obesity, N (%) | 2 (13.3%) | 6 (24%) | 0.3545 |
| CRP (mg/L) median (range) | 2.68 (0.97–67.4) | 1.94 (0.21–18.1) | 0.3713 |
| HBA1c (%) median (range) | 5.8 (5.1–13.1) | 5.8 (4.8–12.4) | 0.8885 |
| Platelet count (thousands/µL), median (range) | 287 (159–618) | 250 (102–353) | 0.2697 |
| Fibrinogen (mg/dL) median (range) | 361 (110–451) | 365 (180– 646) | 0.7268 |
| Hypercoagulability, N (%) | 8 (53.3%) | 13 (52%) | 0.5971 |
| NIHSS at admission median (range) | 6 (2–15) | 3 (2–8) | 0.0189 |
| NIHSS at discharge median (range) | 5 (1–14) | 3 (1–8) | 0.0484 |
| mRS at admission median (range) | 3 (1–5) | 2 (1–5) | 0.1964 |
| mRS at discharge median (range) | 2 (1–5) | 1 (0–5) | 0.6700 |
| R (minutes), median (range) | 10 (5.4–20.2) | 8 (2.4–21.3) | 0.0163 |
| K (minutes), median (range) | 2.7 (1.5–4.5) | 2.3 (1.1–5.8) | 0.2076 |
| Ly30 (%), median (range) | 0.5 (0.01–78.1) | 0.10 (0.00–53.4) | 0.1882 |
| MA (mm), median (range) | 69.1 (15.6–77.3) | 69.4 (58.6–79.8) | 0.7799 |
| Angle (alpha), degrees, median (range) | 50 (24.3–68.3) | 56.5 (36.1–73.1) | 0.0992 |
| Volume of acute infarct (cm3), median (range) | 3.13 (0.23–136.5) | 0.87 (0.09–2.65) | 0.0291 |
| Large infarct (>2 cm3), N (%) | 13 (86.7%) | 1 (4%) | <0.0001 |
Publisher’s Note: MDPI stays neutral with regard to jurisdictional claims in published maps and institutional affiliations. |
© 2021 by the authors. Licensee MDPI, Basel, Switzerland. This article is an open access article distributed under the terms and conditions of the Creative Commons Attribution (CC BY) license (https://creativecommons.org/licenses/by/4.0/).
Share and Cite
Wiśniewski, A.; Karczmarska-Wódzka, A.; Sikora, J.; Sobczak, P.; Lemanowicz, A.; Filipska, K.; Ślusarz, R. Hypercoagulability as Measured by Thrombelastography May Be Associated with the Size of Acute Ischemic Infarct—A Pilot Study. Diagnostics 2021, 11, 712. https://doi.org/10.3390/diagnostics11040712
Wiśniewski A, Karczmarska-Wódzka A, Sikora J, Sobczak P, Lemanowicz A, Filipska K, Ślusarz R. Hypercoagulability as Measured by Thrombelastography May Be Associated with the Size of Acute Ischemic Infarct—A Pilot Study. Diagnostics. 2021; 11(4):712. https://doi.org/10.3390/diagnostics11040712
Chicago/Turabian StyleWiśniewski, Adam, Aleksandra Karczmarska-Wódzka, Joanna Sikora, Przemysław Sobczak, Adam Lemanowicz, Karolina Filipska, and Robert Ślusarz. 2021. "Hypercoagulability as Measured by Thrombelastography May Be Associated with the Size of Acute Ischemic Infarct—A Pilot Study" Diagnostics 11, no. 4: 712. https://doi.org/10.3390/diagnostics11040712