
Machine Learning Approaches for Predicting Acute Respiratory Failure, Ventilator Dependence, and Mortality in Chronic Obstructive Pulmonary Disease


Abstract
:1. Introduction
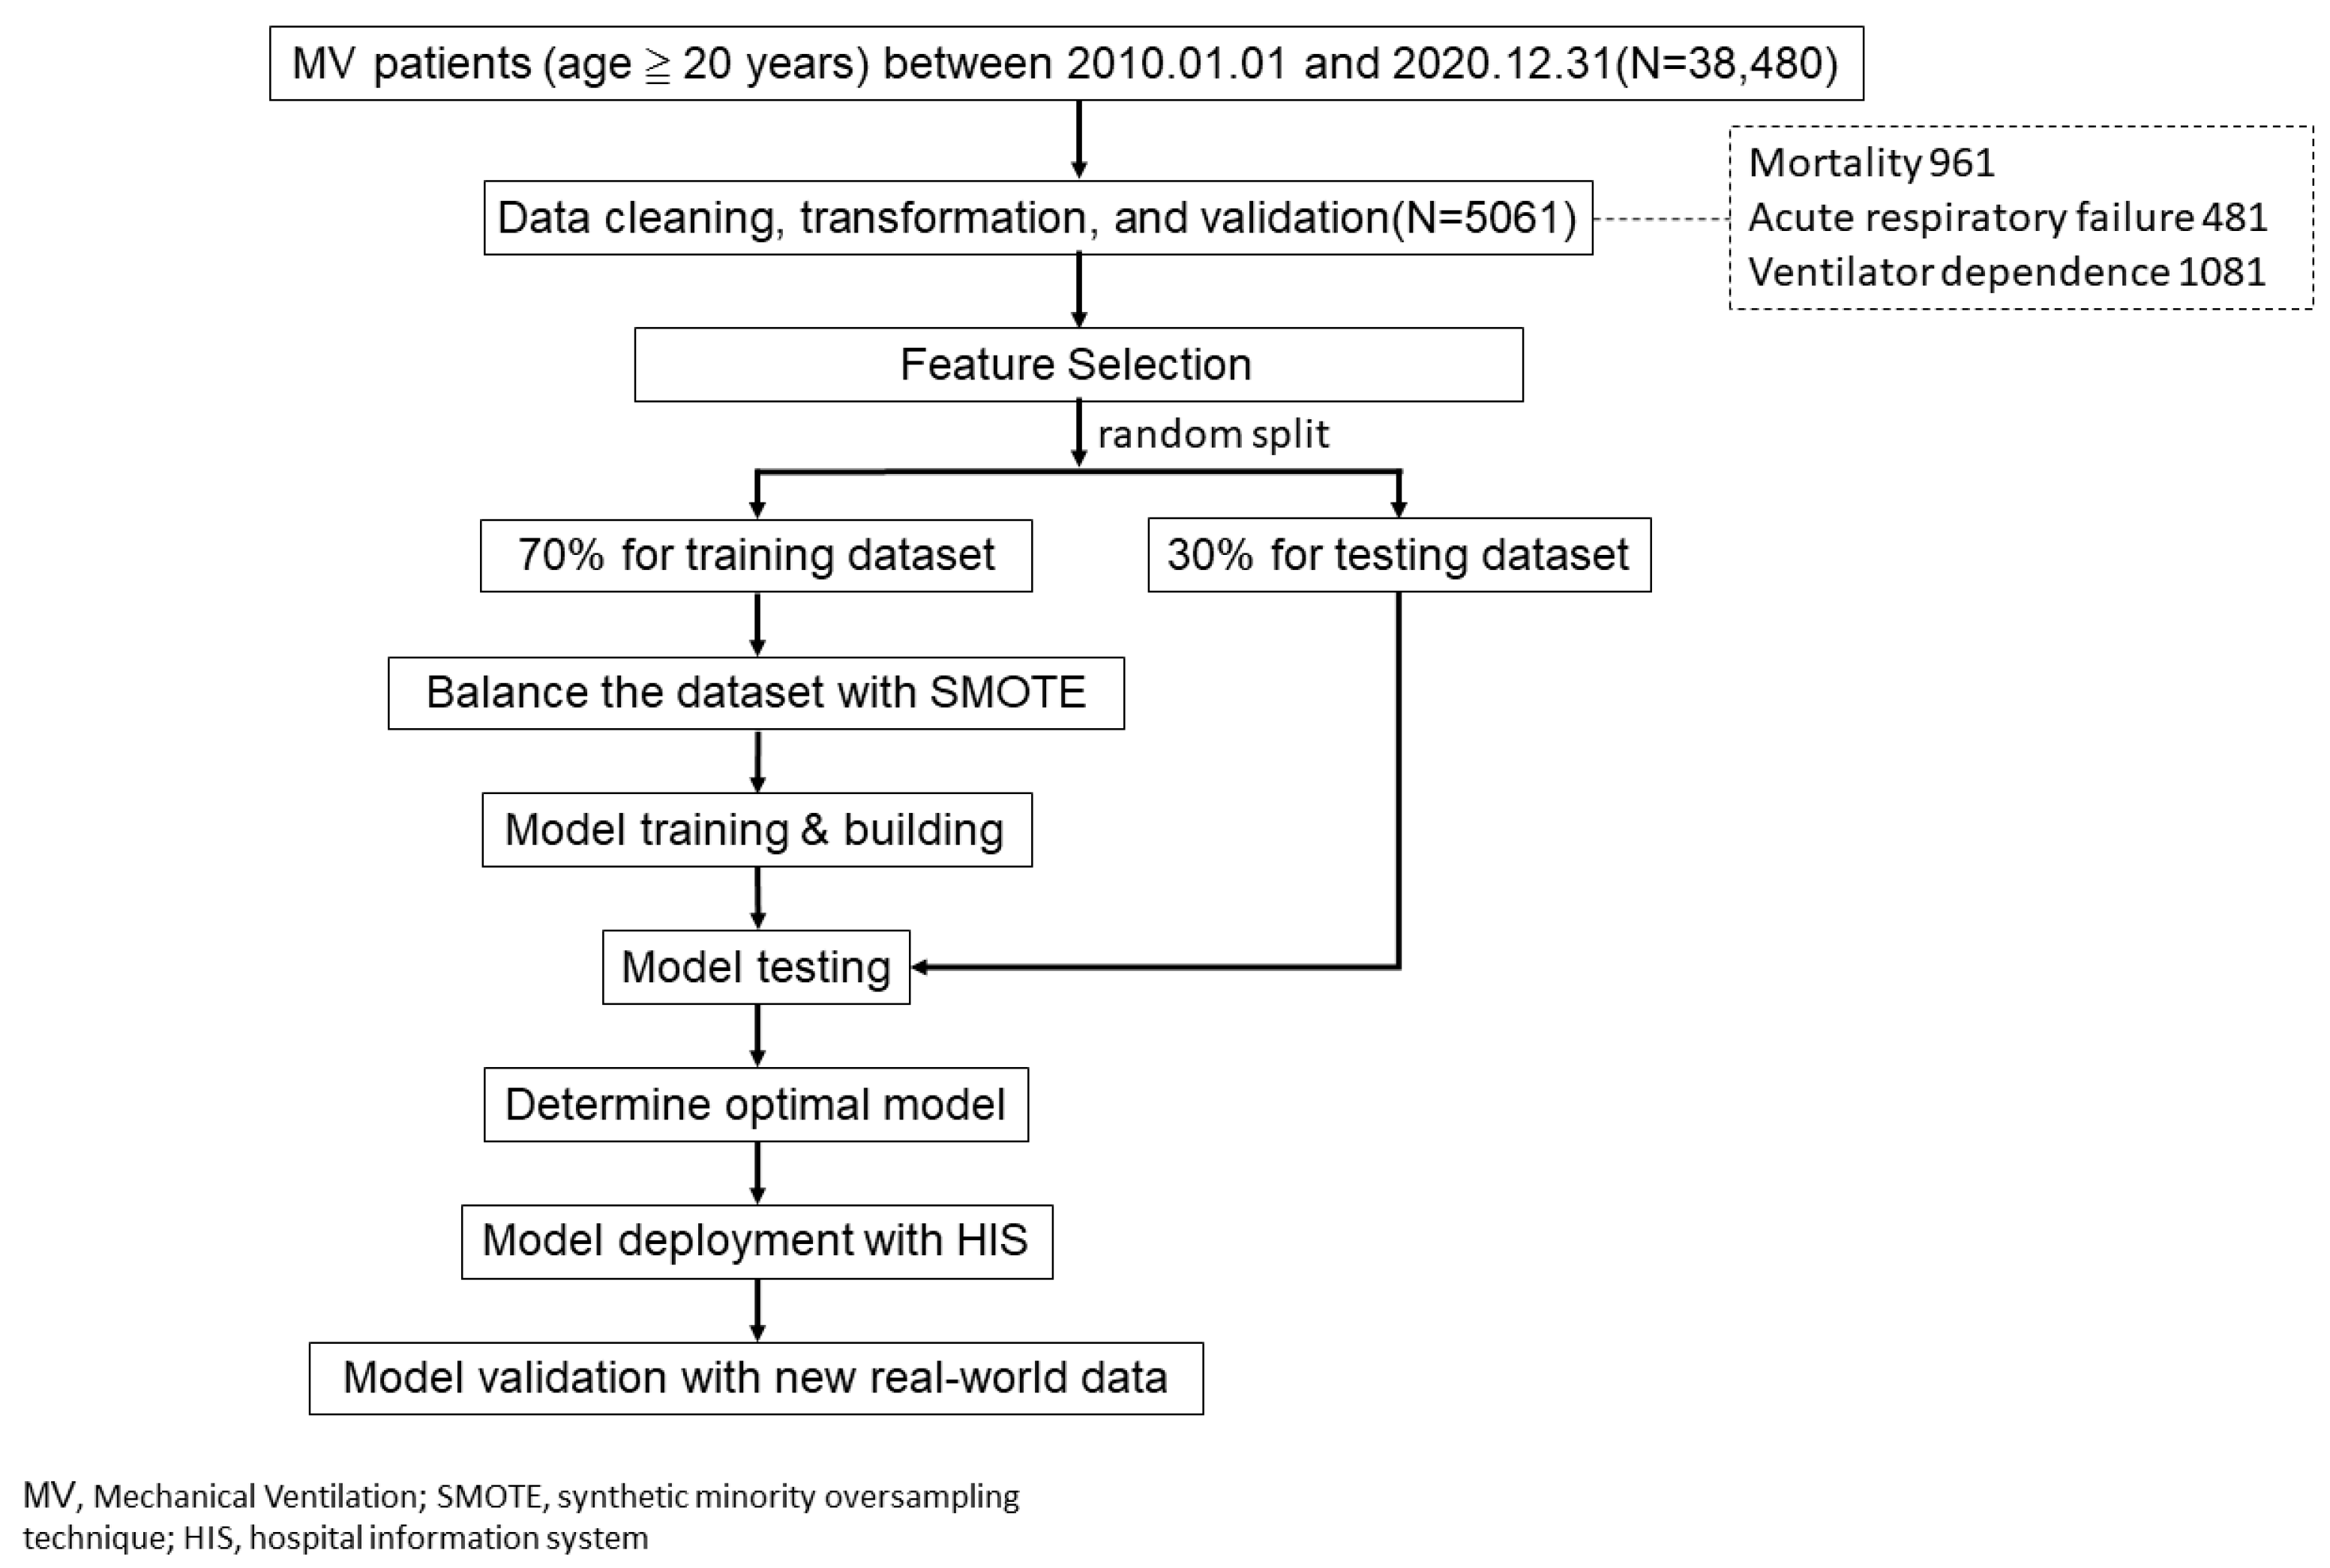
2. Materials and Methods
2.1. Study Design, Setting, and Samples
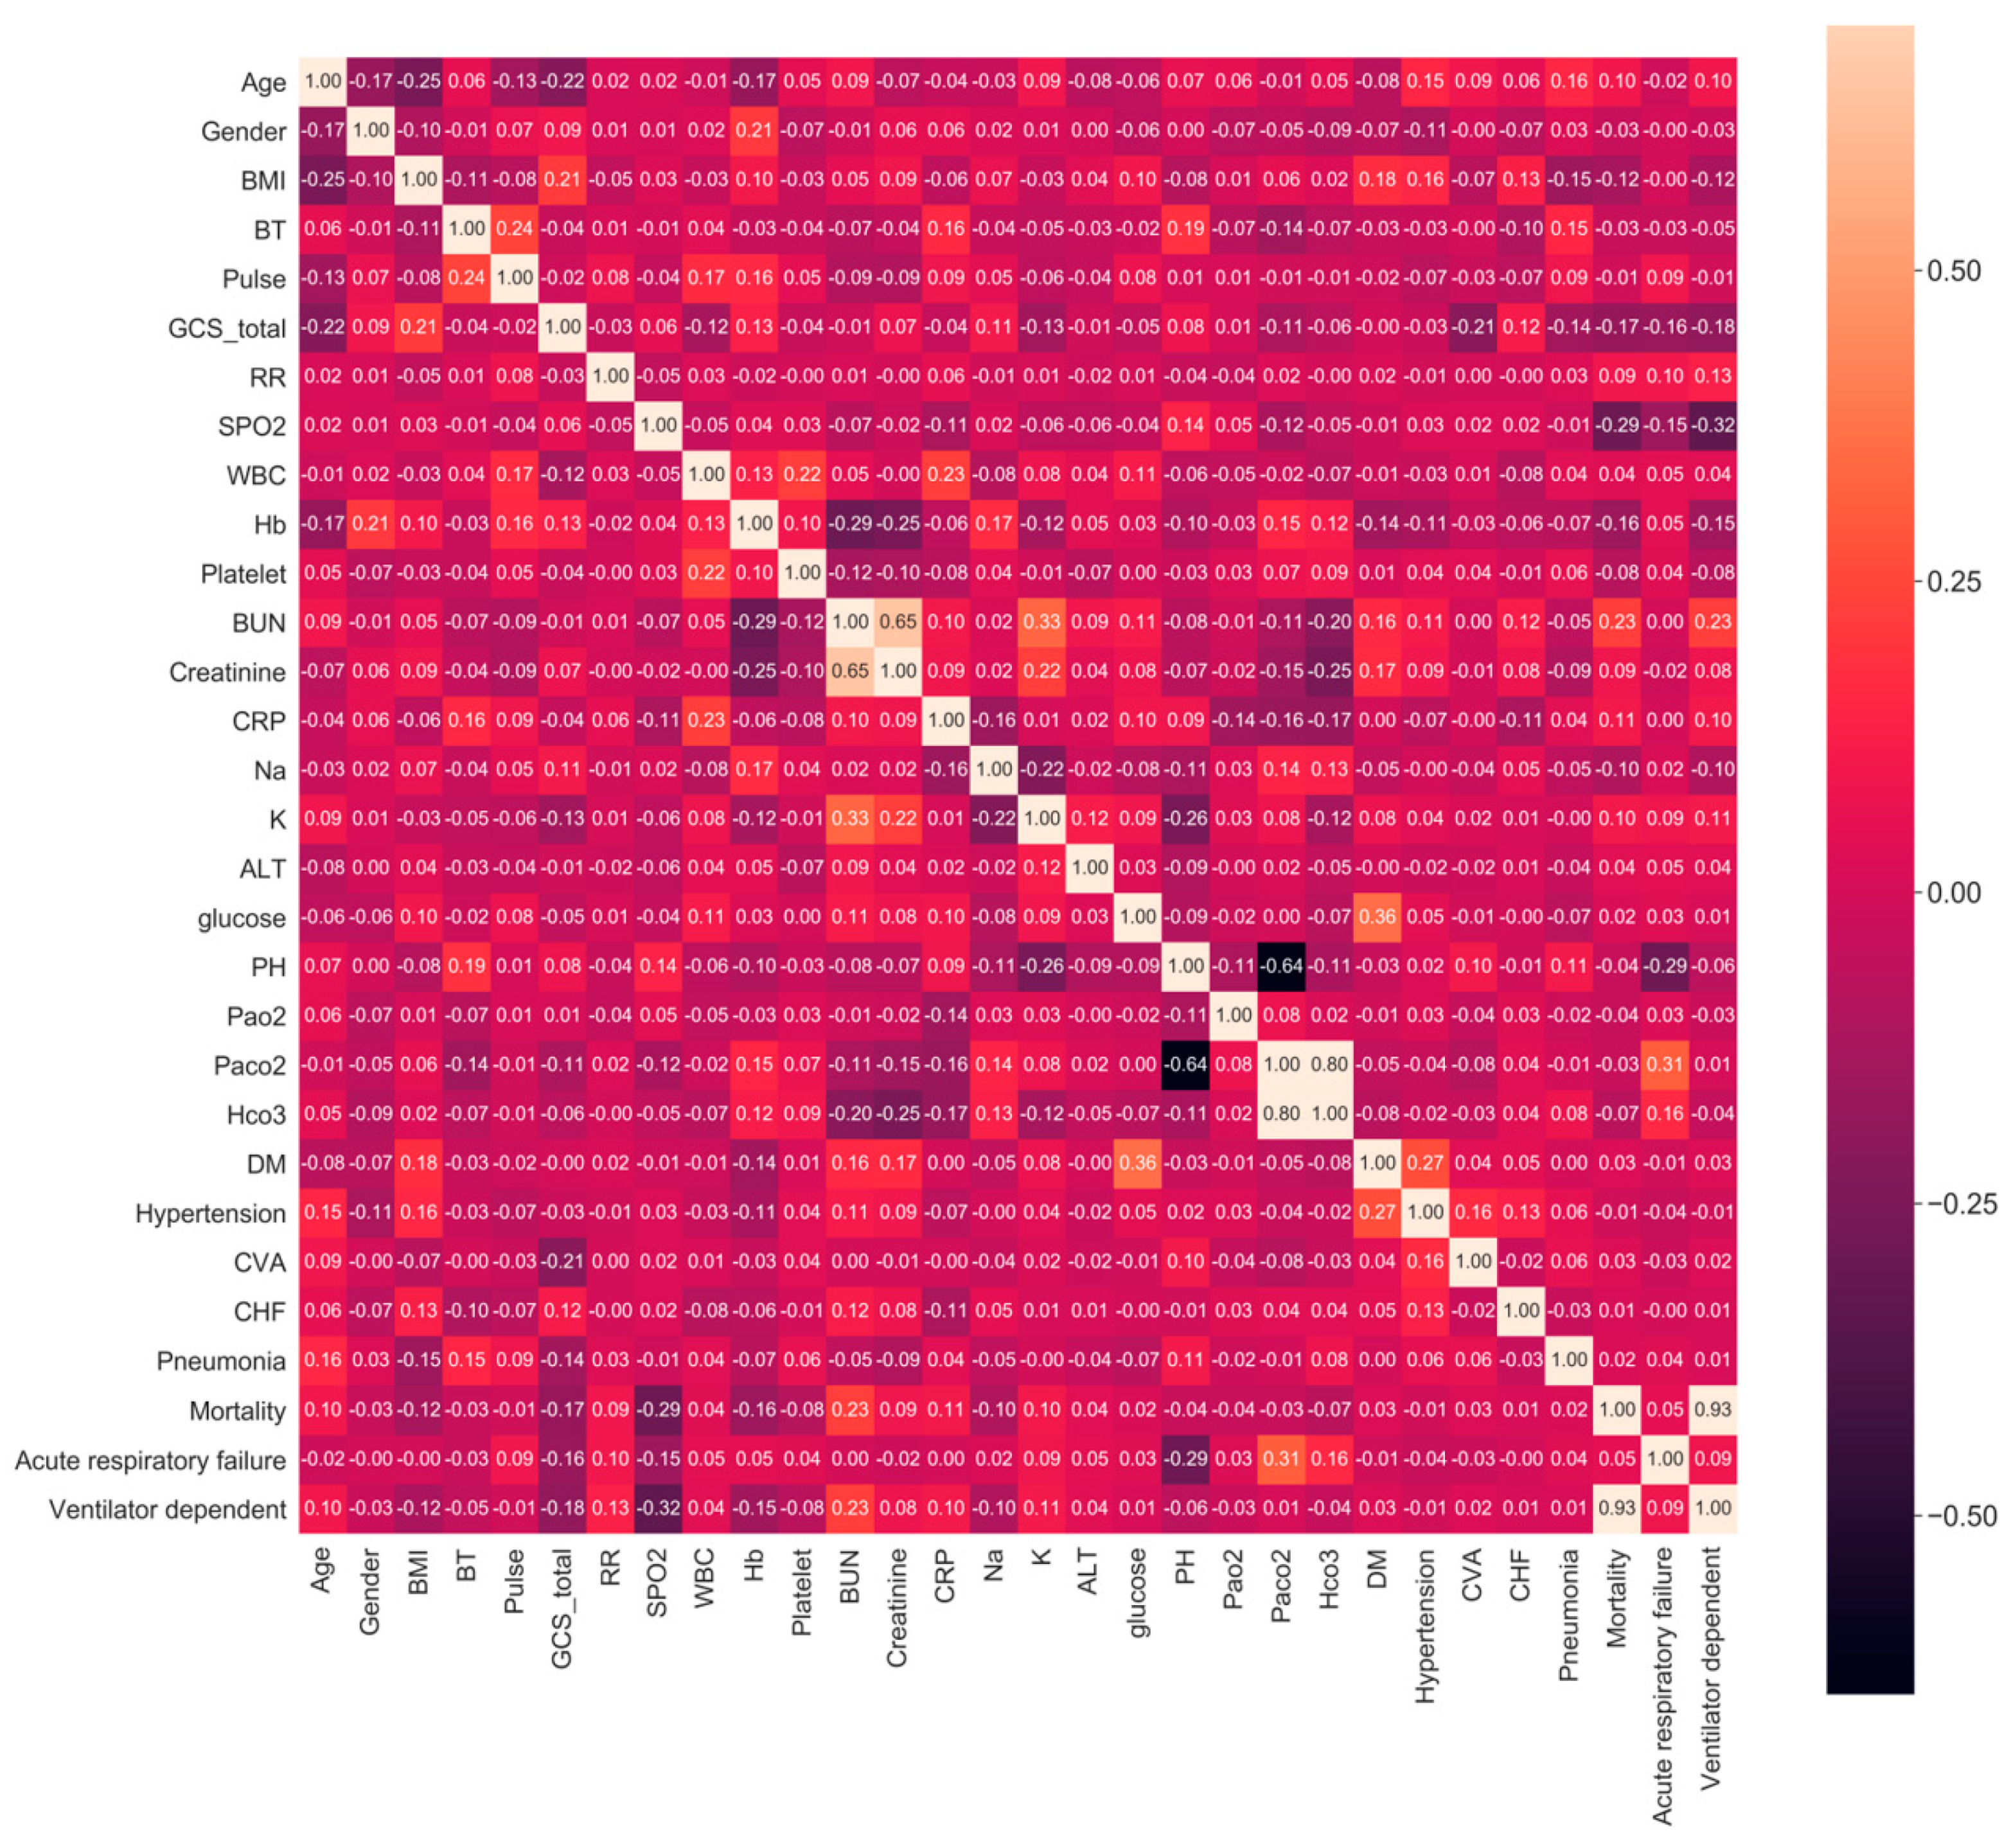
2.2. Feature and Outcome Variables
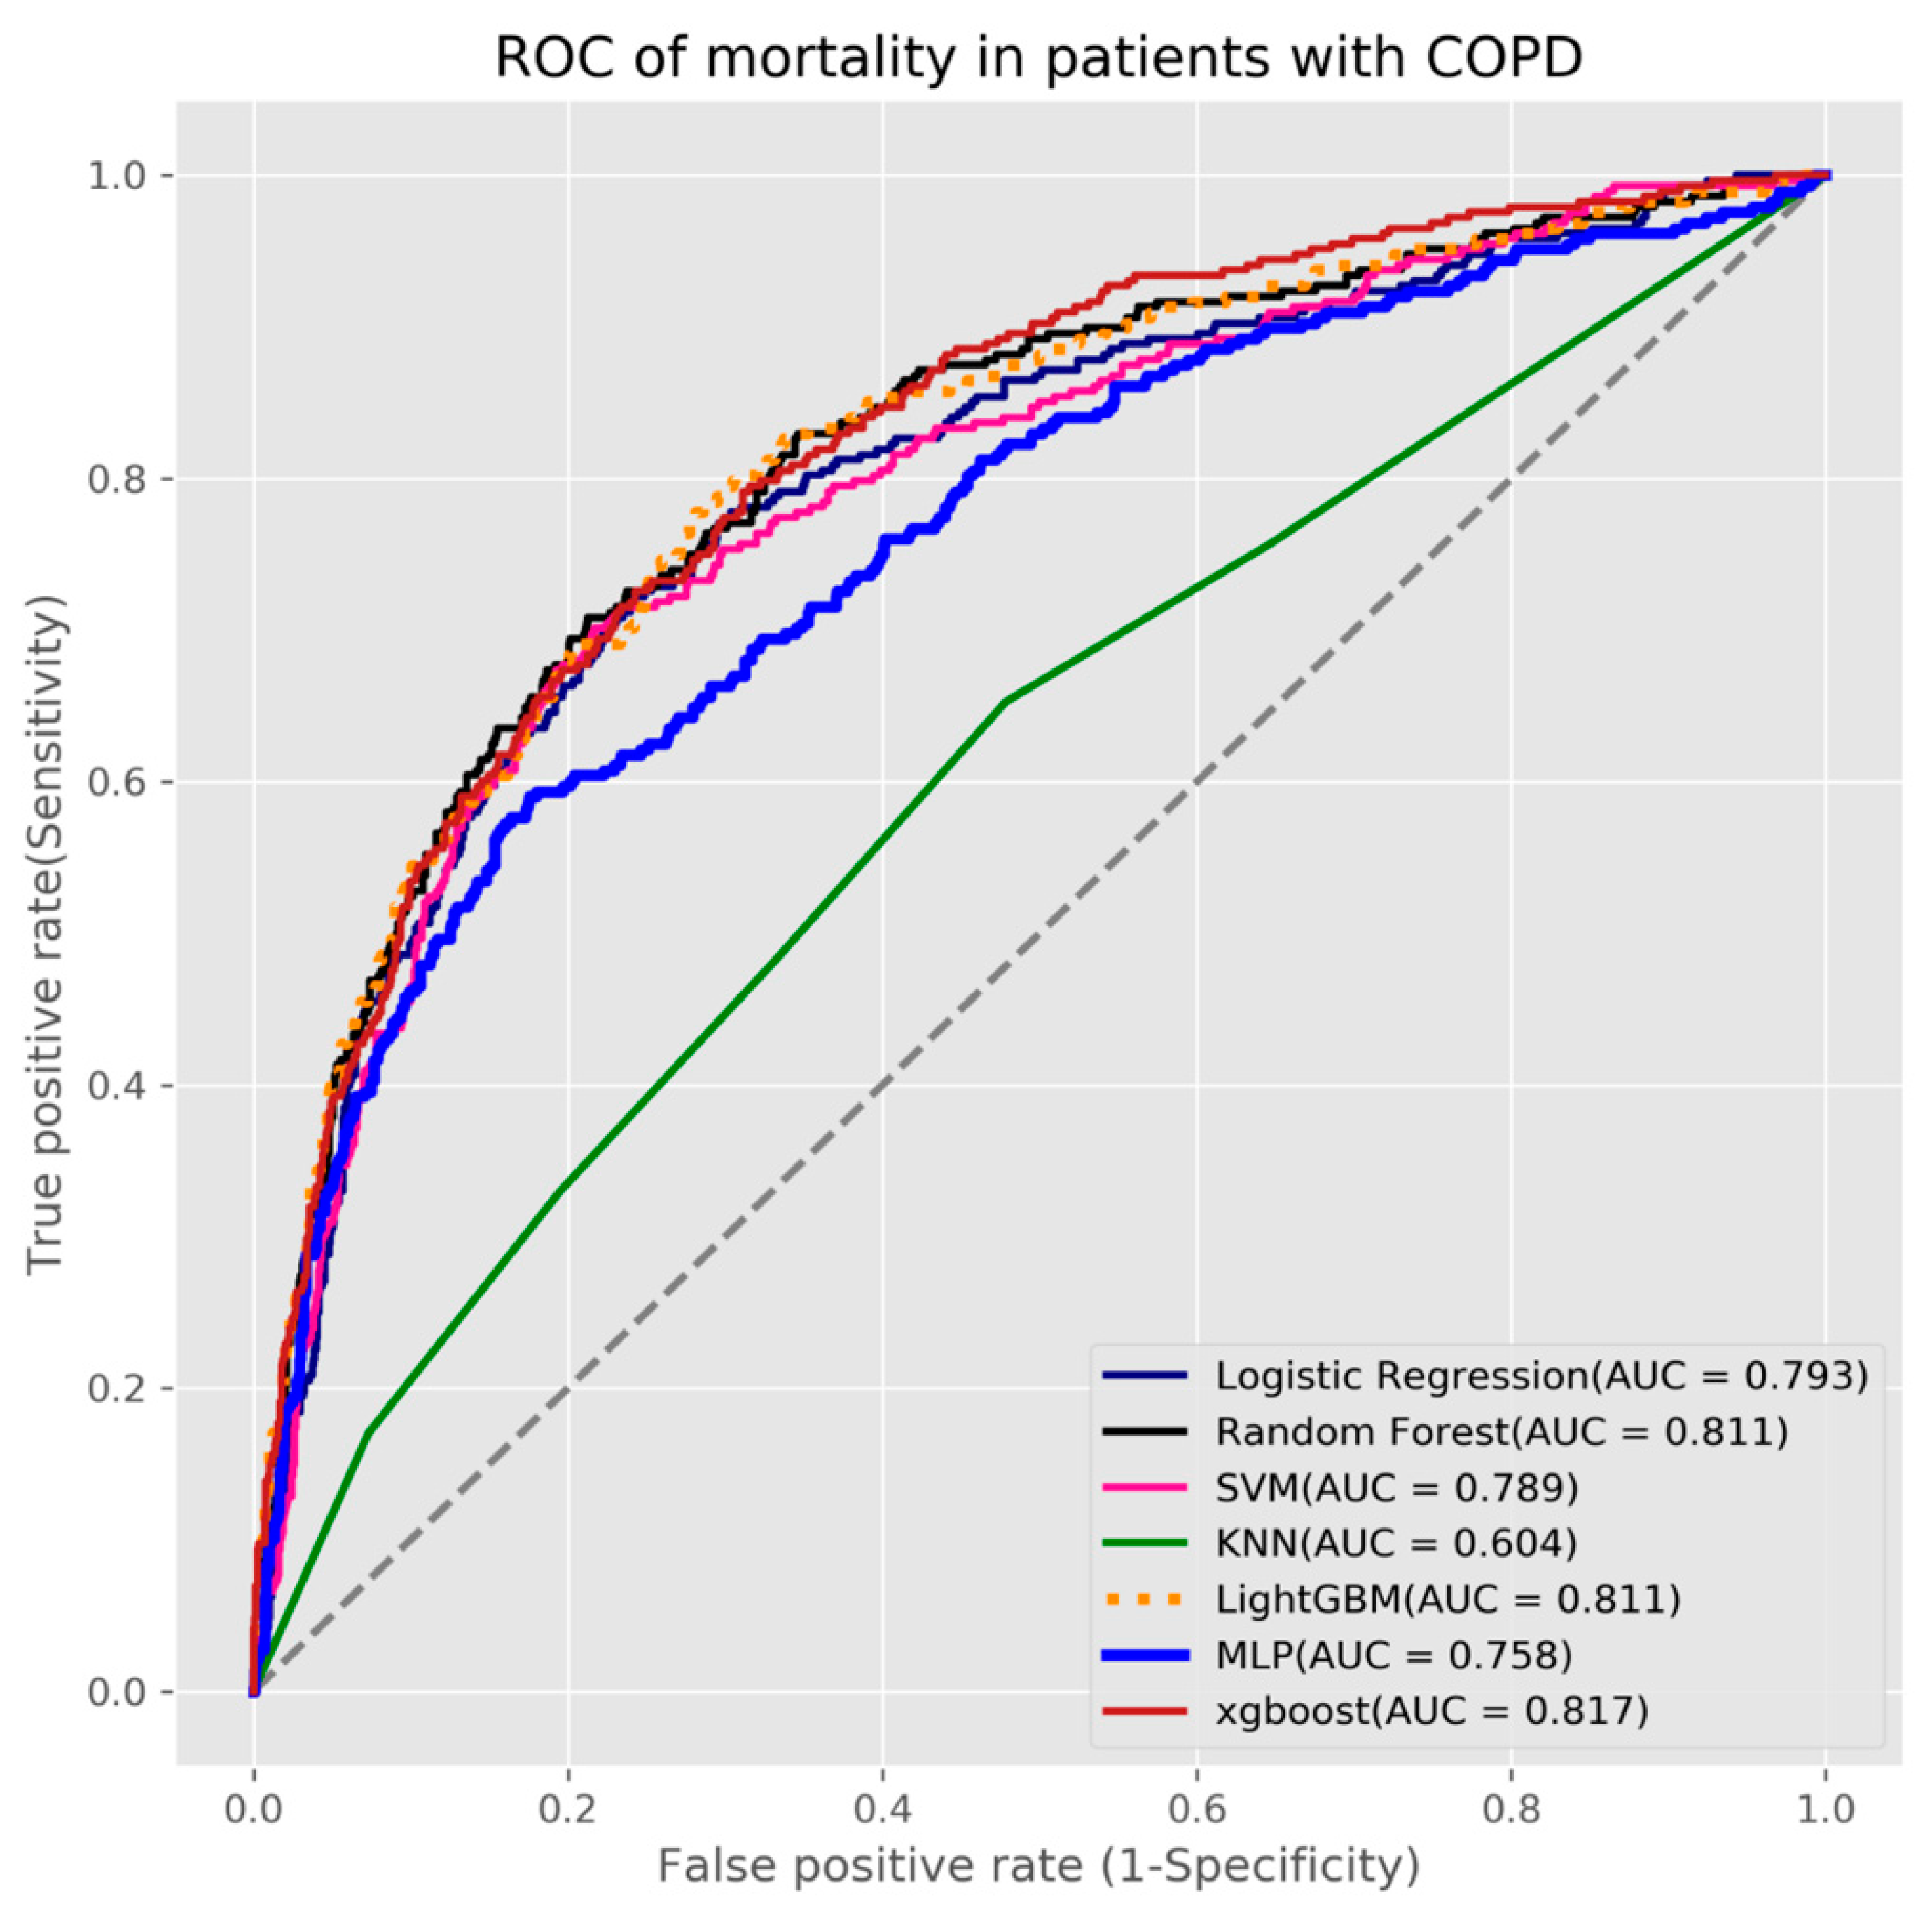
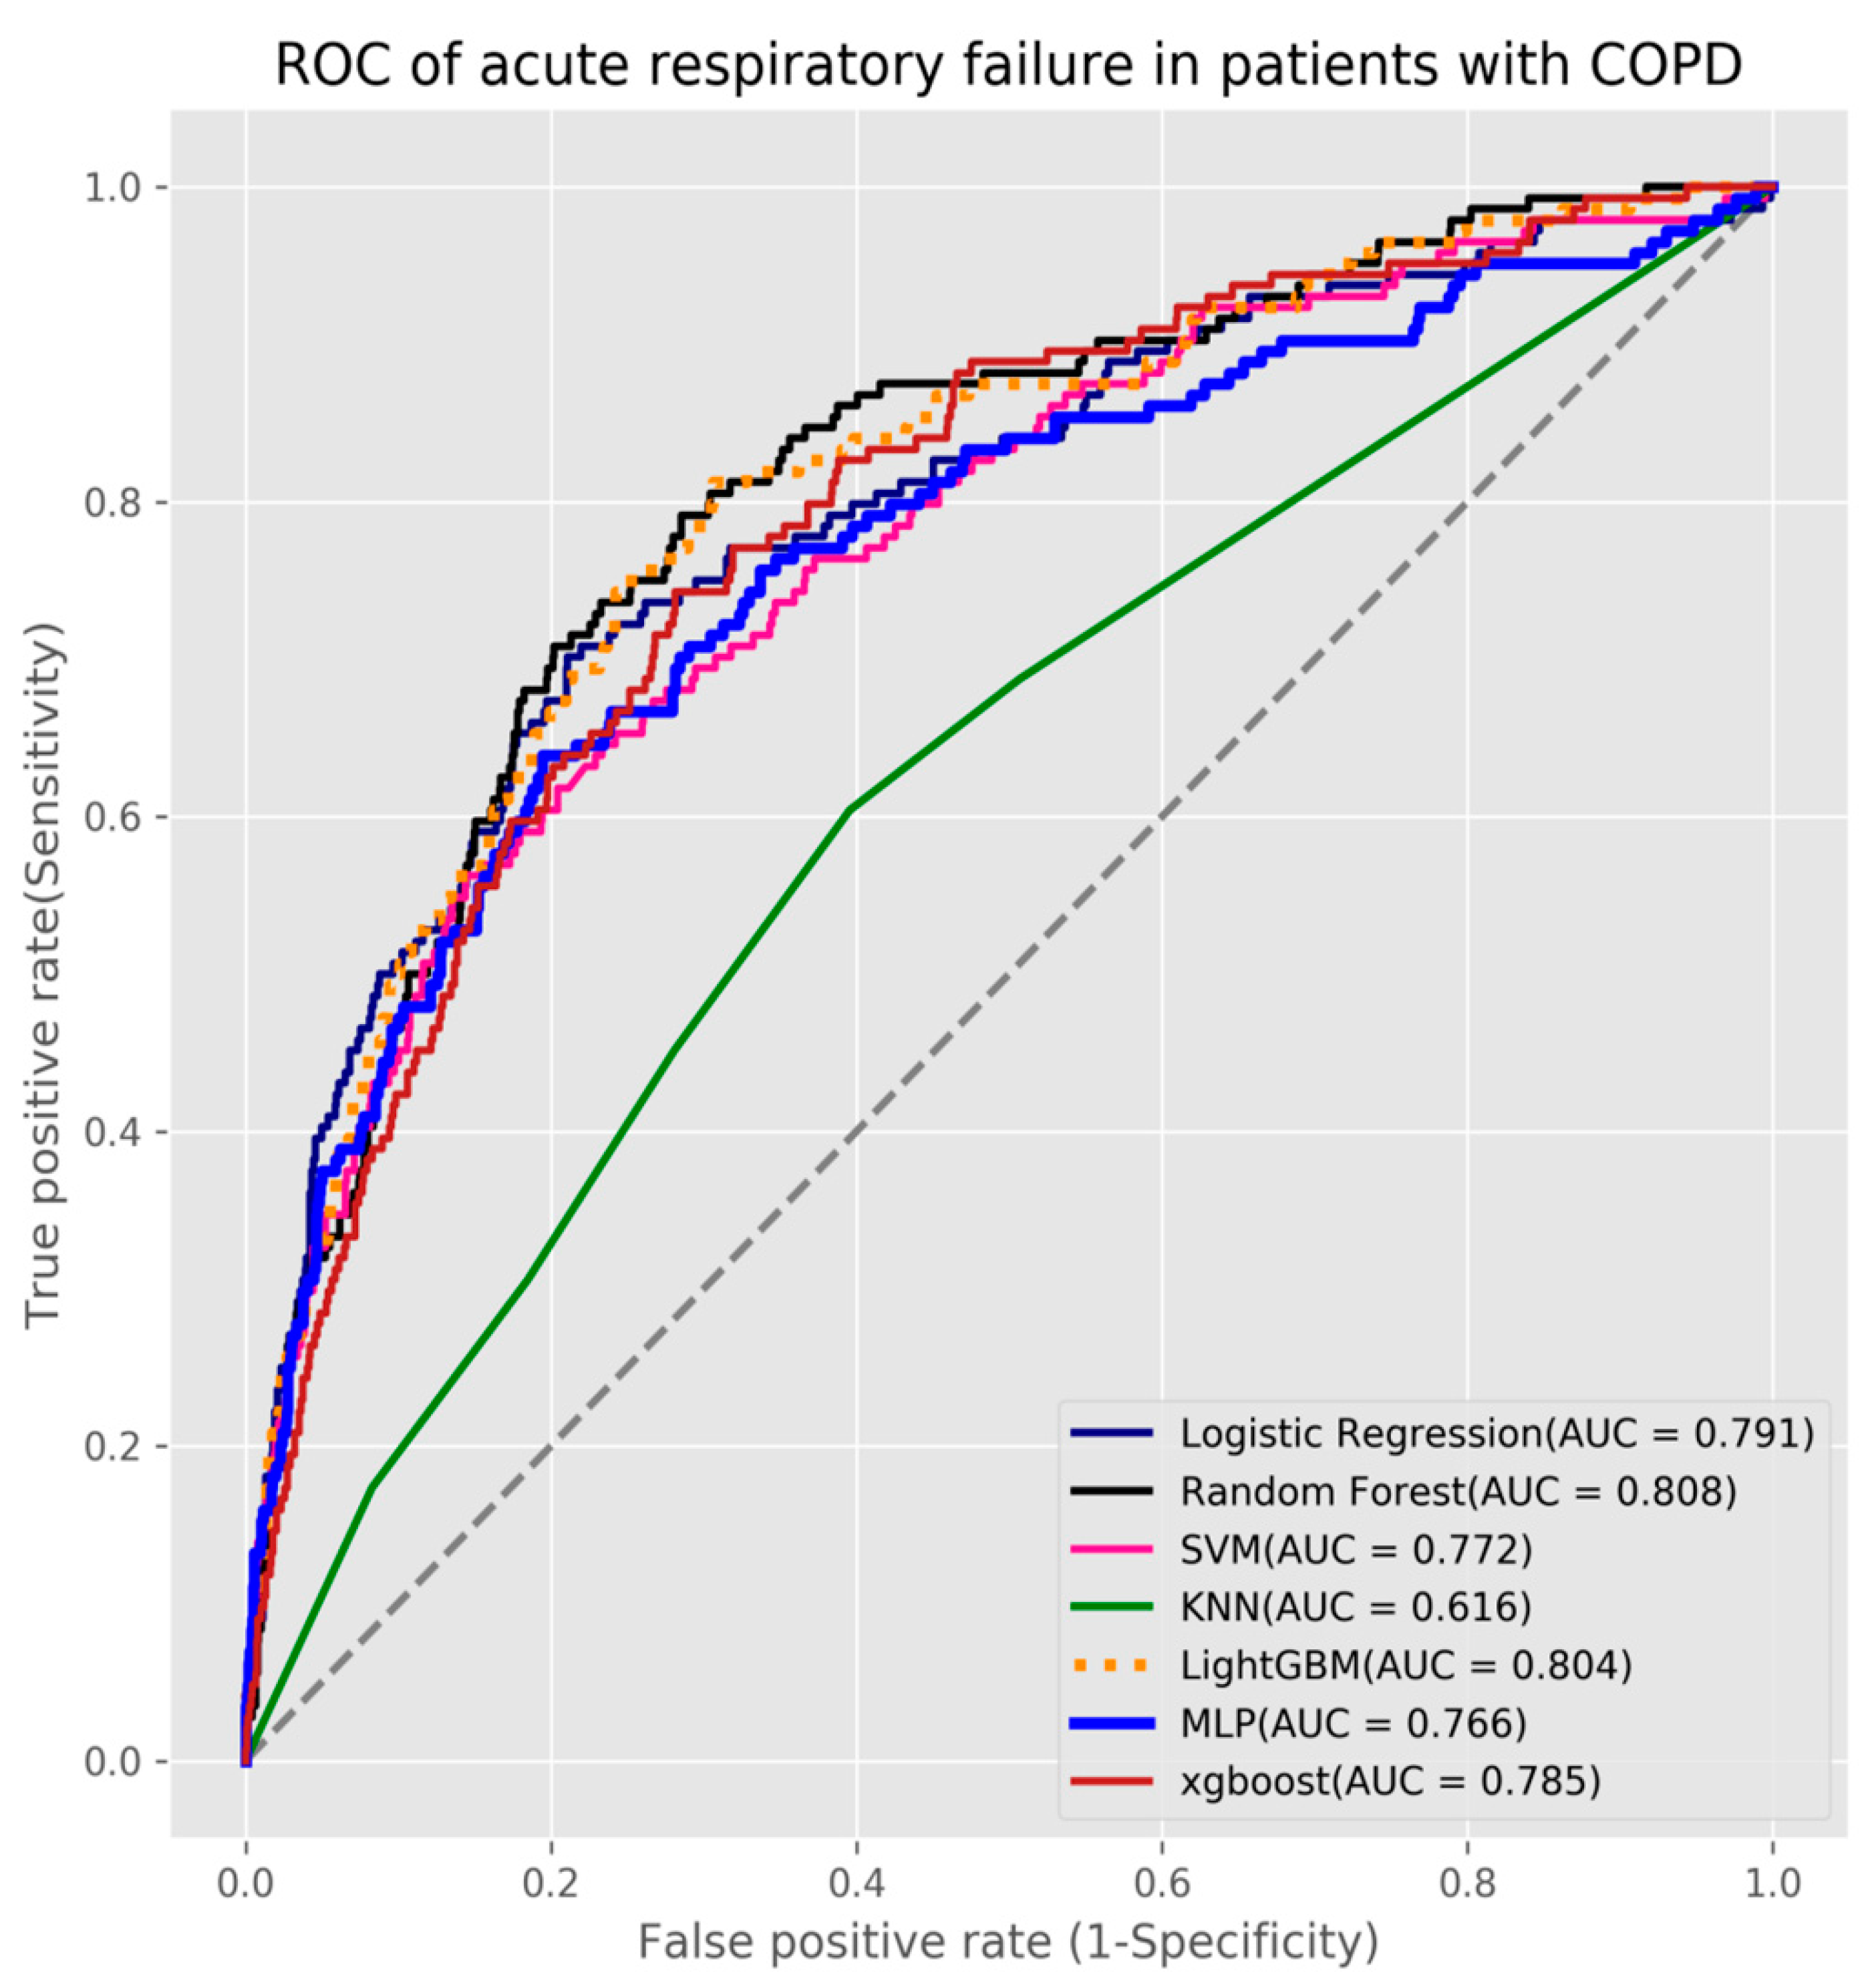
2.3. Model Building and Evaluation
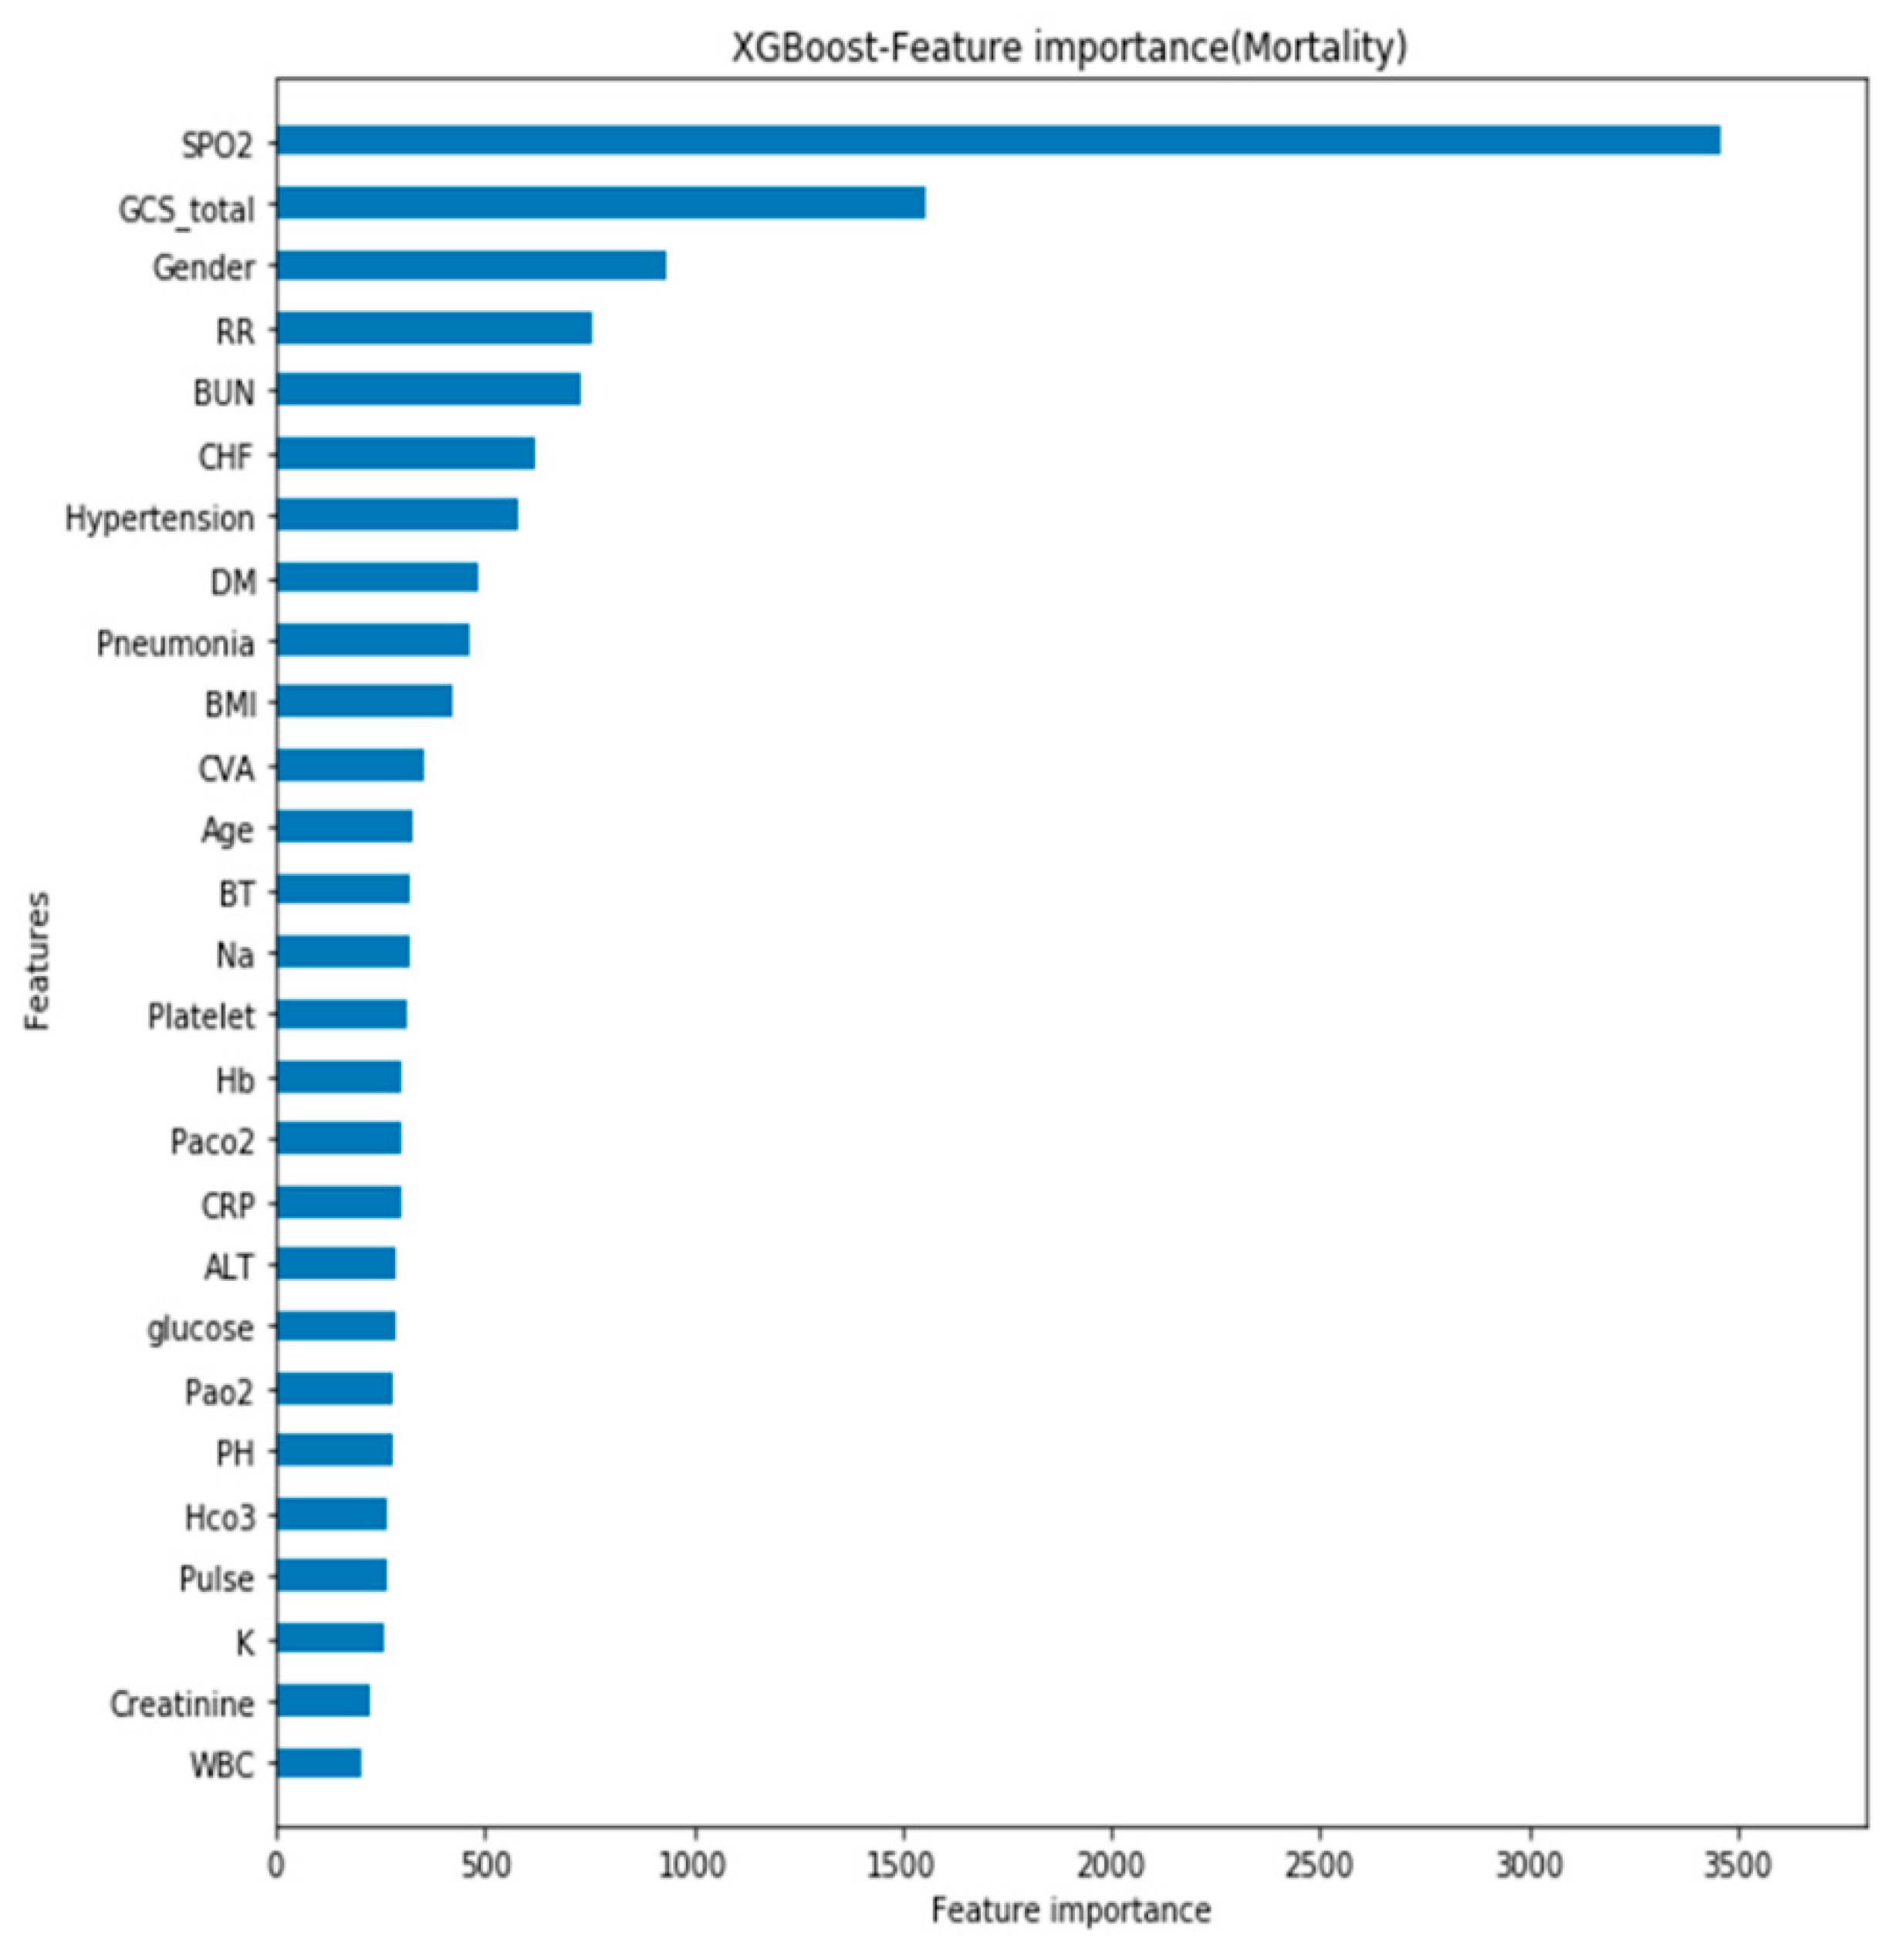
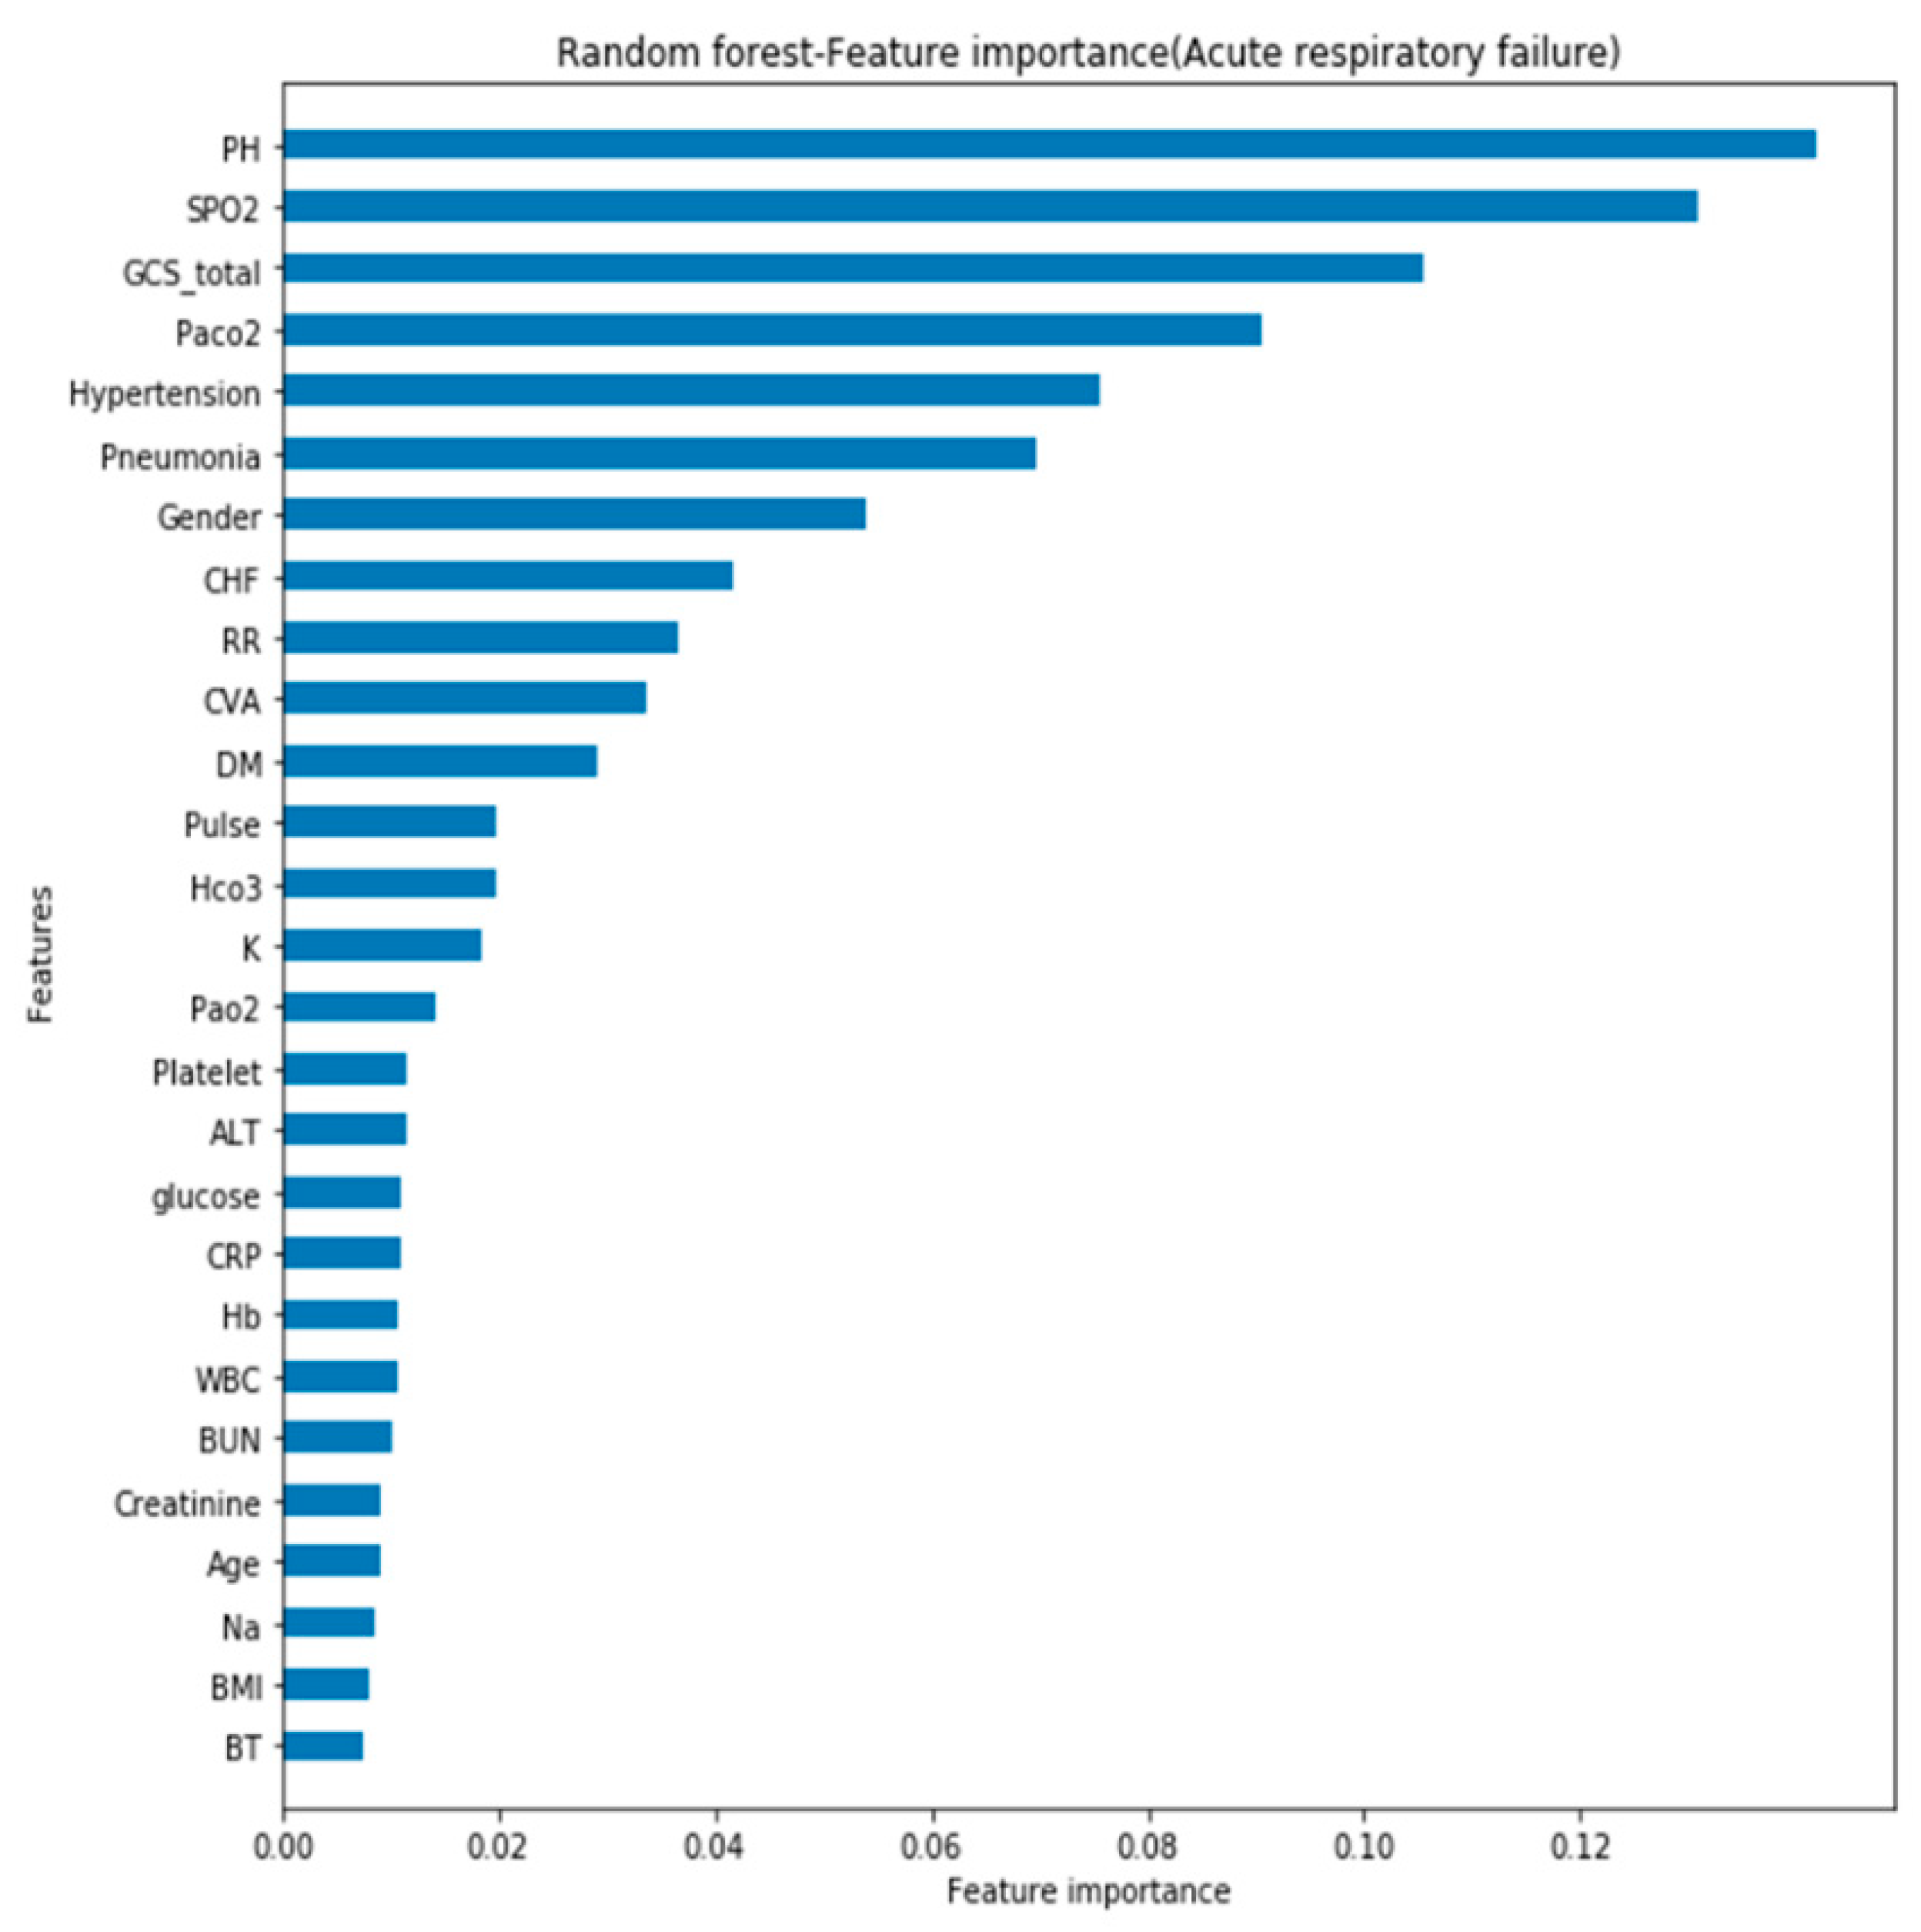
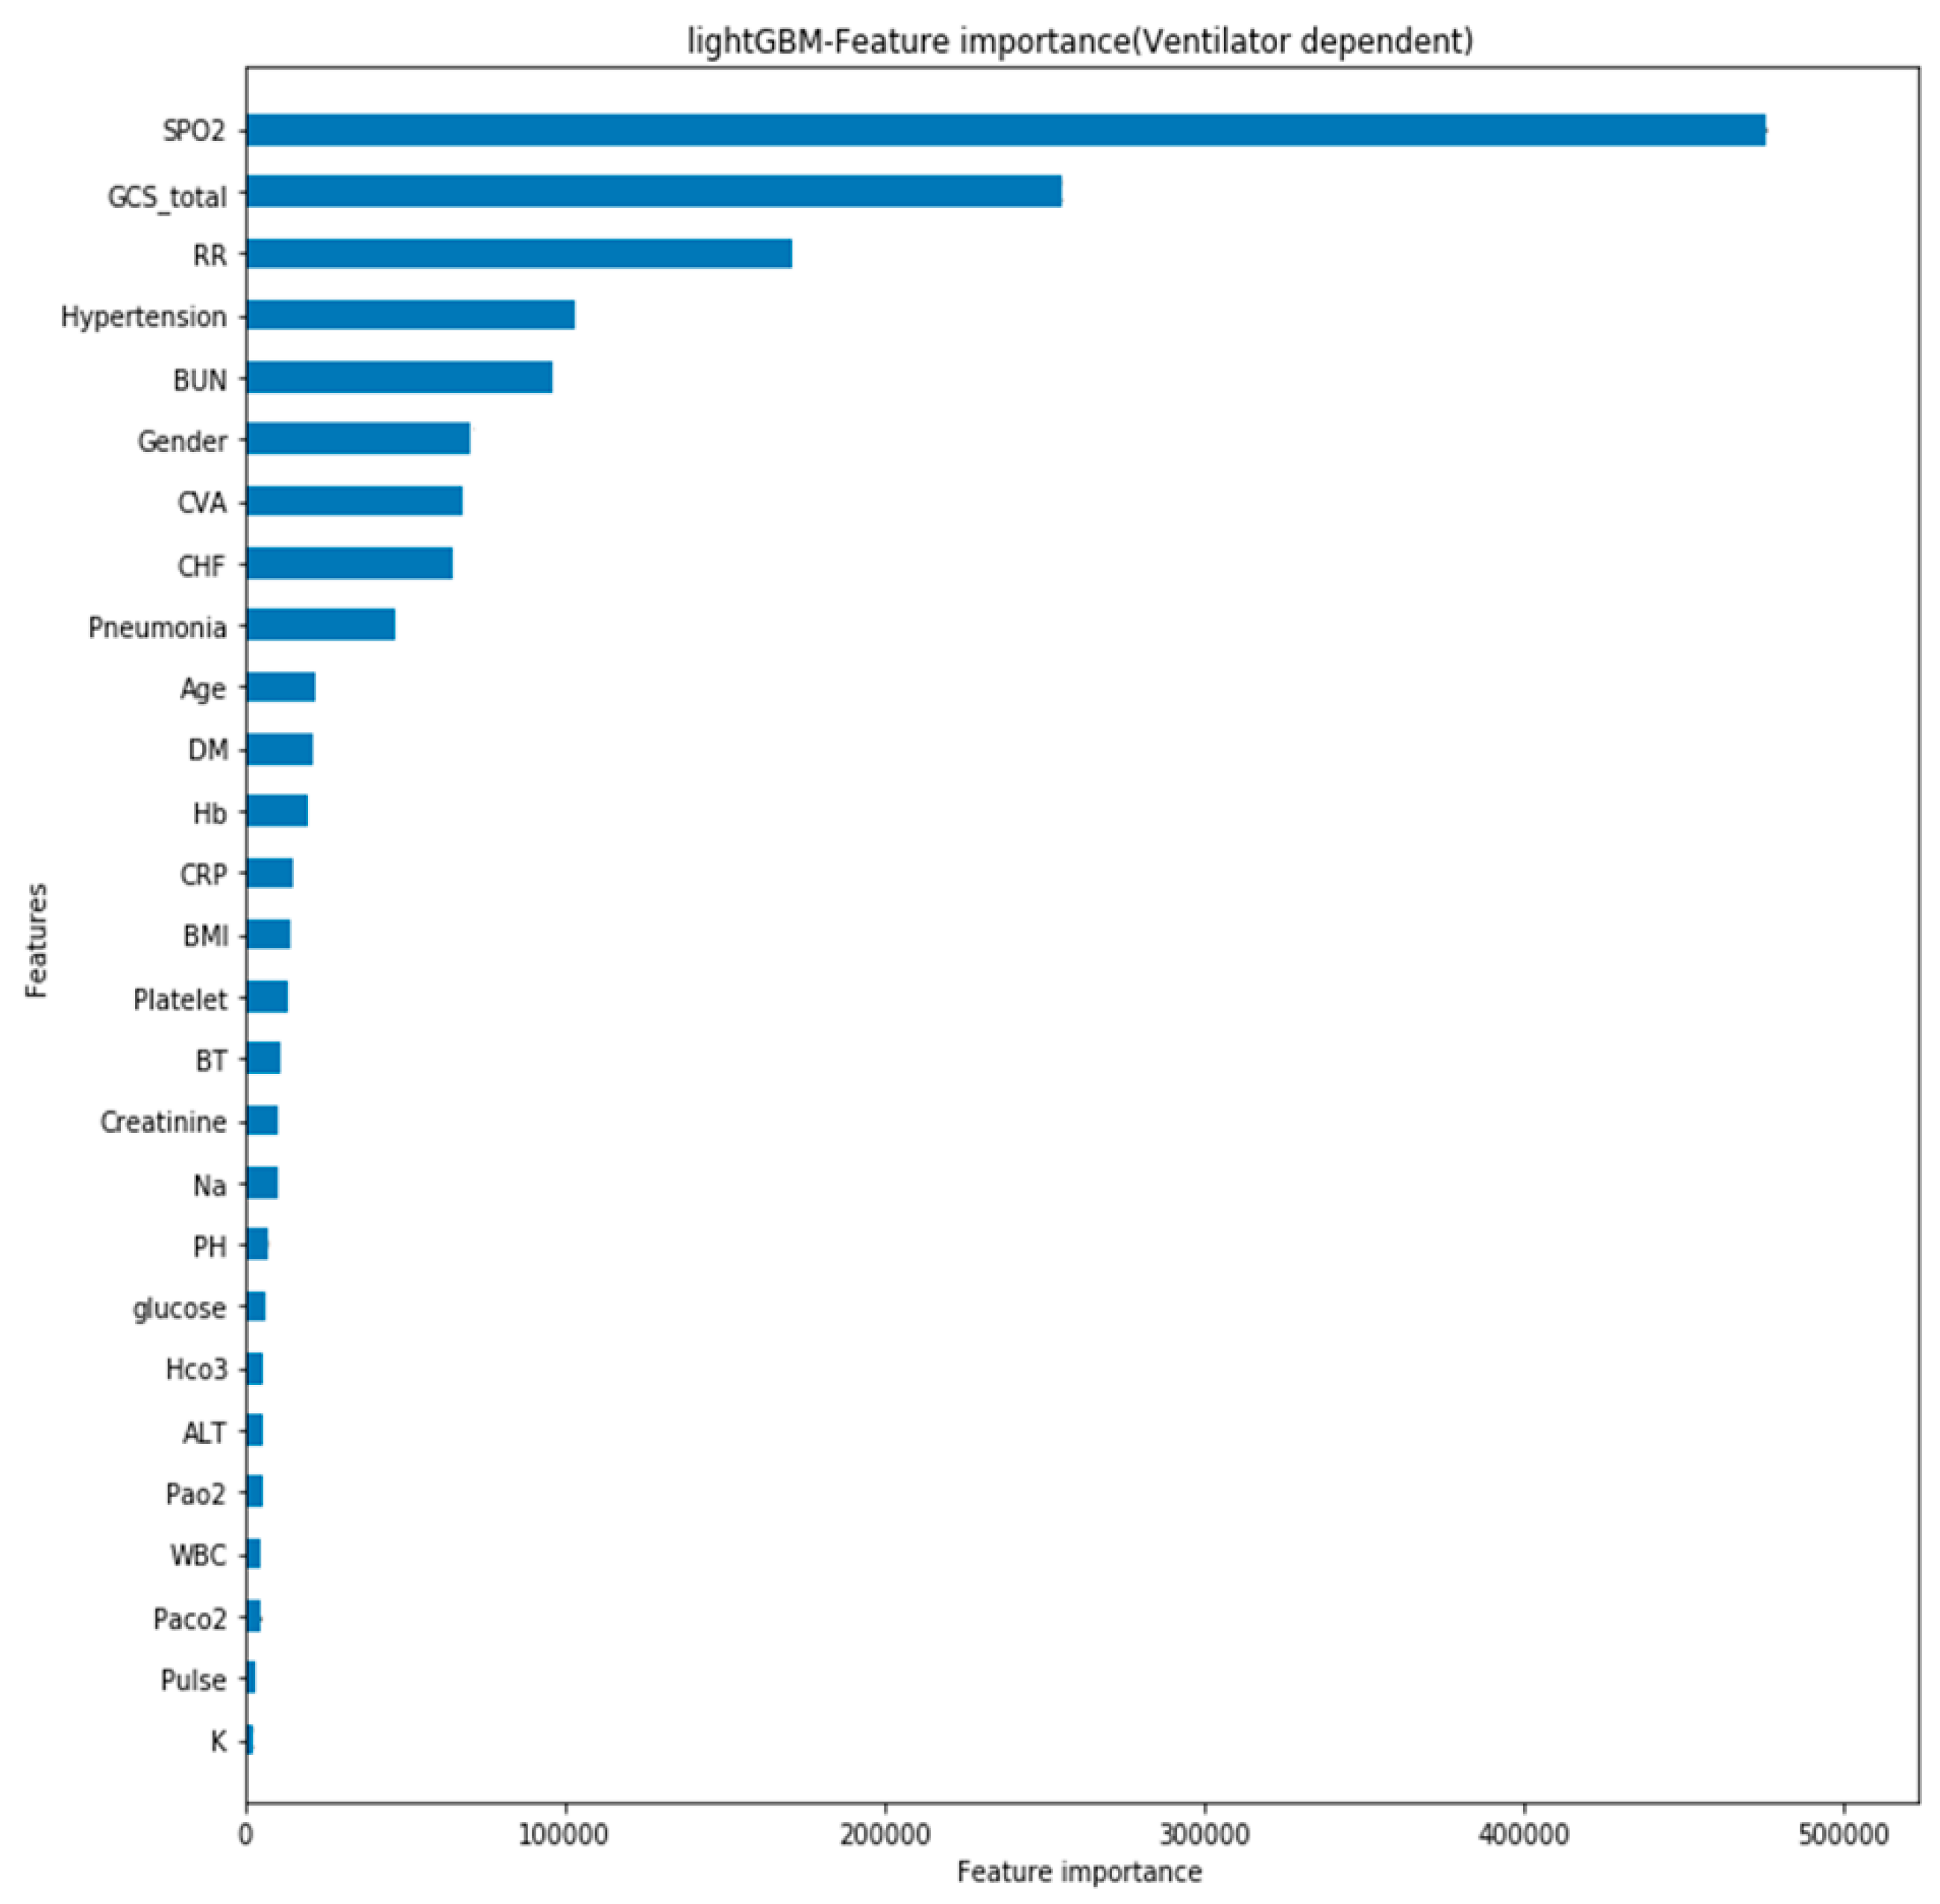
3. Results
4. Discussion
5. Conclusions
Author Contributions
Funding
Institutional Review Board Statement
Informed Consent Statement
Data Availability Statement
Conflicts of Interest
References
- Cheng, S.L.; Lin, C.H. COPD Guidelines in the Asia-Pacific Regions: Similarities and Differences. Diagnostics 2021, 11, 1153. [Google Scholar] [CrossRef]
- Rogliani, P.; Ora, J.; Puxeddu, E.; Cazzola, M. Airflow obstruction: Is it asthma or is it COPD? Int. J. Chron. Obstruct. Pulmon. Dis. 2016, 11, 3007–3013. [Google Scholar] [CrossRef] [Green Version]
- WHO. The Top 10 Causes of Death. Available online: https://www.who.int/news-room/fact-sheets/detail/the-top-10-causes-of-death (accessed on 29 September 2021).
- Wedzicha, J.A.; Miravitlles, M.; Hurst, J.R.; Calverley, P.M.; Albert, R.K.; Anzueto, A.; Criner, G.J.; Papi, A.; Rabe, K.F.; Rigau, D.; et al. Management of COPD exacerbations: A European Respiratory Society/American Thoracic Society guideline. Eur. Respir. J. 2017, 49, 1600791. [Google Scholar] [CrossRef] [Green Version]
- Vestbo, J.; Edwards, L.D.; Scanlon, P.D.; Yates, J.C.; Agusti, A.; Bakke, P.; Calverley, P.M.; Celli, B.; Coxson, H.O.; Crim, C.; et al. Changes in forced expiratory volume in 1 second overtime in COPD. N. Engl. J. Med. 2011, 365, 1184–1192. [Google Scholar] [CrossRef] [PubMed] [Green Version]
- Soler-Cataluna, J.J.; Martinez-Garcia, M.A.; Sánchez, P.R.; Salcedo, E.; Navarro, M.; Ochando, R. Severe acute exacerbations and mortality in patients with chronic obstructive pulmonary disease. Thorax 2005, 60, 925–931. [Google Scholar] [CrossRef] [Green Version]
- Jeffrey, A.A.; Warren, P.M.; Flenley, D.C. Acute hypercapnic respiratory failure in patients with chronic obstructive lung disease: Risk factors and use of guidelines for management. Thorax 1992, 47, 34–40. [Google Scholar] [CrossRef] [Green Version]
- Liao, K.M.; Lin, W.C.; Lin, T.C.; Li, C.Y.; Yang, Y.H. Disease severity at the first hospitalization as a predictor for mechanical ventilation dependency in elderly patients with chronic obstructive pulmonary disease. Tohoku J. Exp. Med. 2014, 234, 263–269. [Google Scholar] [CrossRef] [Green Version]
- Celli, B.R. Predictors of mortality in COPD. Respir. Med. 2010, 104, 773–779. [Google Scholar] [CrossRef] [PubMed] [Green Version]
- Halawa, F.; Madathil, S.C.; Gittler, A.; Khasawneh, M.T. Advancing evidence-based healthcare facility design: A systematic literature review. Health Care Manag. Sci. 2020, 23, 453–480. [Google Scholar] [CrossRef]
- Abràmoff, M.D.; Tobey, D.; Char, D.S. Lessons Learned About Autonomous AI: Finding a Safe, Efficacious, and Ethical Path Through the Development Process. Am. J. Ophthalmol. 2020, 214, 134–142. [Google Scholar] [CrossRef] [PubMed]
- Bzdok, D.; Meyer-Lindenberg, A. Machine Learning for Precision Psychiatry: Opportunities and Challenges. Biol. Psychiatry Cogn. Neurosci. Neuroimaging 2018, 3, 223–230. [Google Scholar] [CrossRef] [Green Version]
- Moser, E.; Narayan, G. Improving breast cancer care coordination and symptom management by using AI driven predictive toolkits. Breast 2020, 50, 25–29. [Google Scholar] [CrossRef] [PubMed] [Green Version]
- Lee, E.J.; Kim, Y.H.; Kim, N.; Kang, D.W. Deep into the Brain: Artificial Intelligence in Stroke Imaging. J. Stroke 2017, 19, 277–285. [Google Scholar] [CrossRef] [PubMed] [Green Version]
- Awan, S.E.; Sohel, F.; Sanfilippo, F.M.; Bennamoun, M.; Dwivedi, G. Machine learning in heart failure: Ready for prime time. Curr. Opin. Cardiol. 2018, 33, 190–195. [Google Scholar] [CrossRef]
- Golas, S.B.; Shibahara, T.; Agboola, S.; Otaki, H.; Sato, J.; Nakae, T.; Hisamitsu, T.; Kojima, G.; Felsted, J.; Kakarmath, S.; et al. A machine learning model to predict the risk of 30-day readmissions in patients with heart failure: A retrospective analysis of electronic medical records data. BMC Med. Inform. Decis. Mak. 2018, 18, 44. [Google Scholar] [CrossRef] [PubMed] [Green Version]
- Hampe, N.; Wolterink, J.M.; Van Velzen, S.G.M.; Leiner, T.; Išgum, I. Machine Learning for Assessment of Coronary Artery Disease in Cardiac CT: A Survey. Front. Cardiovasc. Med. 2019, 6, 172. [Google Scholar] [CrossRef] [Green Version]
- Berlyand, Y.; Raja, A.S.; Dorner, S.C.; Prabhakar, A.M.; Sonis, J.D.; Gottumukkala, R.V.; Succi, M.D.; Yun, B.J. How artificial intelligence could transform emergency department operations. Am. J. Emerg. Med. 2018, 36, 1515–1517. [Google Scholar] [CrossRef]
- Kaplan, A.; Cao, H.; FitzGerald, J.M.; Iannotti, N.; Yang, E.; Kocks, J.W.H.; Kostikas, K.; Price, D.; Reddel, H.K.; Tsiligianni, I.; et al. Artificial Intelligence/Machine Learning in Respiratory Medicine and Potential Role in Asthma and COPD Diagnosis. J. Allergy Clin. Immunol. Pract. 2021, 9, 2255–2261. [Google Scholar] [CrossRef] [PubMed]
- Mekov, E.; Miravitlles, M.; Petkov, R. Artificial intelligence and machine learning in respiratory medicine. Expert Rev. Respir. Med. 2020, 14, 559–564. [Google Scholar] [CrossRef]
- Gonem, S.; Janssens, W.; Das, N.; Topalovic, M. Applications of artificial intelligence and machine learning in respiratory medicine. Thorax 2020, 75, 695–701. [Google Scholar] [CrossRef]
- Feng, Y.; Wang, Y.; Zeng, C.; Mao, H. Artificial Intelligence and Machine Learning in Chronic Airway Diseases: Focus on Asthma and Chronic Obstructive Pulmonary Disease. Int. J. Med. Sci. 2021, 18, 2871–2889. [Google Scholar] [CrossRef] [PubMed]
- Khemasuwan, D.; Sorensen, J.S.; Colt, H.G. Artificial intelligence in pulmonary medicine: Computer vision, predictive model and COVID-19. Eur. Respir. Rev. 2020, 29, 200181. [Google Scholar] [CrossRef]
- Muro, S.; Ishida, M.; Horie, Y.; Takeuchi, W.; Nakagawa, S.; Ban, H.; Nakagawa, T.; Kitamura, T. Machine Learning Methods for the Diagnosis of Chronic Obstructive Pulmonary Disease in Healthy Subjects: Retrospective Observational Cohort Study. JMIR Med. Inform. 2021, 9, e24796. [Google Scholar] [CrossRef] [PubMed]
- Wu, C.T.; Li, G.H.; Huang, C.T.; Cheng, Y.C.; Chen, C.H.; Chien, J.Y.; Kuo, P.H.; Kuo, L.C.; Lai, F. Acute Exacerbation of a Chronic Obstructive Pulmonary Disease Prediction System Using Wearable Device Data, Machine Learning, and Deep Learning: Development and Cohort Study. JMIR Mhealth Uhealth 2021, 9, e22591. [Google Scholar] [CrossRef]
- Chawla, N.V.; Bowyer, K.W.; Hall, L.O.; Kegelmeyer, W.P. SMOTE: Synthetic minority over-sampling technique. J. Artif. Int. Res. 2002, 16, 321–357. [Google Scholar] [CrossRef]
- Goto, T.; Camargo, C.A., Jr.; Faridi, M.K.; Yun, B.J.; Hasegawa, K. Machine learning approaches for predicting disposition of asthma and COPD exacerbations in the ED. Am. J. Emerg. Med. 2018, 36, 1650–1654. [Google Scholar] [CrossRef]
- Peng, J.; Chen, C.; Zhou, M.; Xie, X.; Zhou, Y.; Luo, C.H. A Machine-learning Approach to Forecast Aggravation Risk in Patients with Acute Exacerbation of Chronic Obstructive Pulmonary Disease with Clinical Indicators. Sci. Rep. 2020, 10, 3118. [Google Scholar] [CrossRef] [PubMed] [Green Version]
- Shah, S.A.; Velardo, C.; Farmer, A.; Tarassenko, L. Exacerbations in Chronic Obstructive Pulmonary Disease: Identification and Prediction Using a Digital Health System. J. Med. Internet Res. 2017, 19, e69. [Google Scholar] [CrossRef]
- Wu, Y.K.; Su, W.L.; Yang, M.C.; Chen, S.Y.; Wu, C.W.; Lan, C.C. Characterization Associated with the Frequent Severe Exacerbator Phenotype in COPD Patients. Int. J. Chron. Obstruct. Pulmon. Dis. 2021, 16, 2475–2485. [Google Scholar] [CrossRef]
- Deng, L.; Yan, J.; Xu, H.; Huang, C.; Lv, Y.; Wu, Q.; Xu, Y.; Chen, X. Prediction of exacerbation frequency of AECOPD based on next-generation sequencing and its relationship with imbalance of lung and gut microbiota: A protocol of a prospective cohort study. BMJ Open 2021, 11, e047202. [Google Scholar]
- Hosking, L.; Yeo, A.; Hoffman, J.; Chiano, M.; Fraser, D.; Ghosh, S.; Lipson, D.A.; Martin, N.; Condreay, L.D.; Cox, C.; et al. Genetics plays a limited role in predicting chronic obstructive pulmonary disease treatment response and exacerbation. Respir. Med. 2021, 187, 106573. [Google Scholar] [CrossRef] [PubMed]
- Davidson, J.E.; Jones, C.; Bienvenu, O.J. Family response to critical illness: Postintensive care syndrome-family. Crit. Care Med. 2012, 40, 618–624. [Google Scholar] [CrossRef] [PubMed]
- Hashimoto, N.; Wakahara, K.; Sakamoto, K. The Importance of Appropriate Diagnosis in the Practical Management of Chronic Obstructive Pulmonary Disease. Diagnostics 2021, 11, 618. [Google Scholar] [CrossRef] [PubMed]
- Wubben, N.; van den Boogaard, M.; van der Hoeven, J.G.; Zegers, M. Shared decision-making in the ICU from the perspective of physicians, nurses and patients: A qualitative interview study. BMJ Open 2021, 11, e050134. [Google Scholar] [CrossRef]
- von Blanckenburg, P.; Hofmann, M.; Rief, W.; Seifart, U.; Seifart, C.; Berkey, F.J.; Wiedemer, J.P.; Vithalani, N.D. Delivering Bad or Life-Altering News. Am. Fam. Physician 2018, 98, 99–104. [Google Scholar]
- Pia von, B.; Mareike, H.; Winfried, R.; Ulf, S.; Carola, S. Assessing patients’ preferences for breaking Bad News according to the SPIKES-Protocol: The MABBAN scale. Patient Educ. Couns. 2020, 103, 1623–1629. [Google Scholar]
- Hussain, A.; Choi, H.E.; Kim, H.J.; Aich, S.; Saqlain, M.; Kim, H.C. Forecast the Exacerbation in Patients of Chronic Obstructive Pulmonary Disease with Clinical Indicators Using Machine Learning Techniques. Diagnostics 2021, 11, 829. [Google Scholar] [CrossRef]


| Feature | Overall | Mortality | p-Value | Acute Respiratory Failure | p-Value | Ventilator Dependence | p-Value | |||
|---|---|---|---|---|---|---|---|---|---|---|
| No | Yes | No | Yes | No | Yes | |||||
| 5061 | 4100 | 961 | 4580 | 481 | 3980 | 1081 | ||||
| Age, mean (SD) | 77.8 (11.4) | 77.3 (11.4) | 80.2 (11.2) | <0.001 | 77.9 (11.3) | 77.1 (12.2) | 0.159 | 77.2 (11.3) | 79.9 (11.4) | <0.001 |
| Sex_female, n (%) | 1673 (33.1) | 1326 (32.3) | 347 (36.1) | 0.028 | 1512 (33.0) | 161 (33.5) | 0.879 | 1289 (32.4) | 384 (35.5) | 0.057 |
| Sex_male, n (%) | 3388 (66.9) | 2774 (67.7) | 614 (63.9) | 3068 (67.0) | 320 (66.5) | 2691 (67.6) | 697 (64.5) | |||
| BMI, mean (SD) | 23.5 (5.4) | 23.8 (5.6) | 22.1 (4.5) | <0.001 | 23.5 (5.4) | 23.4 (6.1) | 0.756 | 23.8 (5.5) | 22.3 (4.8) | <0.001 |
| BT, mean (SD) | 37.1 (1.1) | 37.1 (1.1) | 37.0 (1.1) | 0.039 | 37.1 (1.1) | 37.0 (1.1) | 0.024 | 37.1 (1.1) | 37.0 (1.1) | 0.001 |
| Pulse, mean (SD) | 101.9 (23.8) | 102.0 (22.9) | 101.4 (27.3) | 0.529 | 101.2 (23.5) | 108.5 (26.0) | <0.001 | 102.0 (22.8) | 101.5 (27.3) | 0.648 |
| GCS, mean (SD) | 13.2 (3.1) | 13.4 (2.9) | 12.1 (3.7) | <0.001 | 13.4 (2.9) | 11.6 (4.2) | <0.001 | 13.5 (2.9) | 12.1 (3.7) | <0.001 |
| RR, mean (SD) | 21.7 (6.0) | 21.4 (5.5) | 22.8 (7.8) | <0.001 | 21.5 (5.5) | 23.5 (9.3) | <0.001 | 21.3 (5.0) | 23.2 (8.7) | <0.001 |
| SPO2, mean (SD) | 84.9 (16.9) | 87.3 (14.6) | 74.9 (21.7) | <0.001 | 85.8 (16.0) | 77.2 (22.7) | <0.001 | 87.8 (13.8) | 74.5 (22.2) | <0.001 |
| Lab data | ||||||||||
| WBC, mean (SD) | 10.3 (4.8) | 10.2 (4.7) | 10.7 (5.1) | 0.01 | 10.3 (4.8) | 11.1 (5.2) | 0.001 | 10.2 (4.8) | 10.7 (5.0) | 0.003 |
| Hb, mean (SD) | 12.1 (2.4) | 12.3 (2.4) | 11.3 (2.5) | <0.001 | 12.1 (2.4) | 12.5 (2.6) | 0.001 | 12.3 (2.4) | 11.4 (2.5) | <0.001 |
| Platelet, mean (SD) | 174.1 (49.3) | 176.1 (47.7) | 165.6 (54.5) | <0.001 | 173.5 (49.6) | 179.7 (46.1) | 0.006 | 176.1 (47.7) | 167.0 (54.2) | <0.001 |
| BUN, mean (SD) | 28.4 (18.0) | 26.4 (16.4) | 37.0 (21.7) | <0.001 | 28.4 (18.1) | 28.5 (16.9) | 0.952 | 26.3 (16.3) | 36.3 (21.6) | <0.001 |
| Creatinine, mean (SD) | 1.5 (1.3) | 1.4 (1.2) | 1.7 (1.5) | <0.001 | 1.5 (1.3) | 1.4 (1.2) | 0.173 | 1.4 (1.2) | 1.7 (1.5) | <0.001 |
| CRP, mean (SD) | 53.5 (63.9) | 50.2 (62.4) | 67.5 (68.3) | <0.001 | 53.5 (63.7) | 53.7 (66.0) | 0.958 | 50.0 (62.4) | 66.4 (67.7) | <0.001 |
| Na, mean (SD) | 135.2 (6.9) | 135.5 (6.4) | 133.7 (8.6) | <0.001 | 135.1 (6.9) | 135.6 (7.6) | 0.232 | 135.5 (6.4) | 133.8 (8.5) | <0.001 |
| K, mean (SD) | 3.96 (0.69) | 3.92 (0.67) | 4.11 (0.77) | <0.001 | 3.94 (0.68) | 4.15 (0.76) | <0.001 | 3.92 (0.66) | 4.10 (0.78) | <0.001 |
| ALT, mean (SD) | 42.3 (138.7) | 39.7 (132.8) | 53.5 (161.0) | 0.014 | 40.2 (114.1) | 62.1 (279.5) | 0.089 | 39.4 (133.5) | 53.2 (155.9) | 0.008 |
| Glucose, mean (SD) | 166.3 (86.2) | 165.6 (85.7) | 169.2 (88.6) | 0.253 | 165.3 (87.3) | 175.2 (75.3) | 0.007 | 165.6 (85.8) | 168.7 (87.8) | 0.3 |
| PH, mean (SD) | 7.4 (0.1) | 7.4 (0.1) | 7.4 (0.1) | 0.018 | 7.4 (0.1) | 7.3 (0.1) | <0.001 | 7.4 (0.1) | 7.4 (0.1) | <0.001 |
| Pao2, mean (SD) | 139.4 (78.5) | 140.9 (78.2) | 133.1 (79.5) | 0.006 | 138.6 (76.9) | 147.2 (92.0) | 0.049 | 140.6 (77.6) | 135.1 (81.5) | 0.045 |
| Paco2, mean (SD) | 40.0 (16.8) | 40.2 (16.7) | 38.9 (17.5) | 0.036 | 38.3 (14.1) | 56.1 (28.3) | <0.001 | 39.9 (16.2) | 40.3 (19.0) | 0.517 |
| Hco3, mean (SD) | 24.4 (6.6) | 24.6 (6.5) | 23.4 (7.1) | <0.001 | 24.0 (6.2) | 27.7 (9.0) | <0.001 | 24.5 (6.4) | 23.9 (7.4) | 0.006 |
| Comorbidity | ||||||||||
| DM, n (%) | 1775 (35.1) | 1412 (34.4) | 363 (37.8) | 0.056 | 1614 (35.2) | 161 (33.5) | 0.47 | 1366 (34.3) | 409 (37.8) | 0.035 |
| Hypertension, n (%) | 2920 (57.7) | 2375 (57.9) | 545 (56.7) | 0.516 | 2670 (58.3) | 250 (52.0) | 0.009 | 2308 (58.0) | 612 (56.6) | 0.437 |
| CVA, n (%) | 839 (16.6) | 657 (16.0) | 182 (18.9) | 0.032 | 774 (16.9) | 65 (13.5) | 0.066 | 642 (16.1) | 197 (18.2) | 0.111 |
| CHF, n (%) | 1293 (25.5) | 1035 (25.2) | 258 (26.8) | 0.325 | 1173 (25.6) | 120 (24.9) | 0.793 | 1009 (25.4) | 284 (26.3) | 0.565 |
| Pneumonia, n (%) | 3251 (64.2) | 2617 (63.8) | 634 (66.0) | 0.226 | 2915 (63.6) | 336 (69.9) | 0.008 | 2542 (63.9) | 709 (65.6) | 0.313 |
| Algorithm | Accuracy | Sensitivity | Specificity | AUC |
|---|---|---|---|---|
| Logistic Regression | 0.733 | 0.733 | 0.733 | 0.793 |
| Random Forest | 0.735 | 0.736 | 0.734 | 0.811 |
| SVM | 0.768 | 0.691 | 0.786 | 0.789 |
| KNN | 0.633 | 0.483 | 0.668 | 0.604 |
| LightGBM | 0.744 | 0.743 | 0.744 | 0.811 |
| MLP | 0.683 | 0.681 | 0.683 | 0.758 |
| XGBoost | 0.727 | 0.733 | 0.726 | 0.817 |
| Algorithm | Accuracy | Sensitivity | Specificity | AUC |
|---|---|---|---|---|
| Logistic Regression | 0.738 | 0.736 | 0.738 | 0.791 |
| Random Forest | 0.747 | 0.75 | 0.747 | 0.812 |
| SVM | 0.784 | 0.604 | 0.803 | 0.772 |
| KNN | 0.694 | 0.451 | 0.719 | 0.616 |
| LightGBM | 0.756 | 0.75 | 0.756 | 0.804 |
| MLP | 0.71 | 0.708 | 0.71 | 0.766 |
| XGBoost | 0.723 | 0.722 | 0.723 | 0.785 |
| Algorithm | Accuracy | Sensitivity | Specificity | AUC |
|---|---|---|---|---|
| Logistic Regression | 0.72 | 0.719 | 0.72 | 0.79 |
| Random Forest | 0.733 | 0.735 | 0.733 | 0.803 |
| SVM | 0.755 | 0.596 | 0.798 | 0.765 |
| KNN | 0.647 | 0.472 | 0.695 | 0.618 |
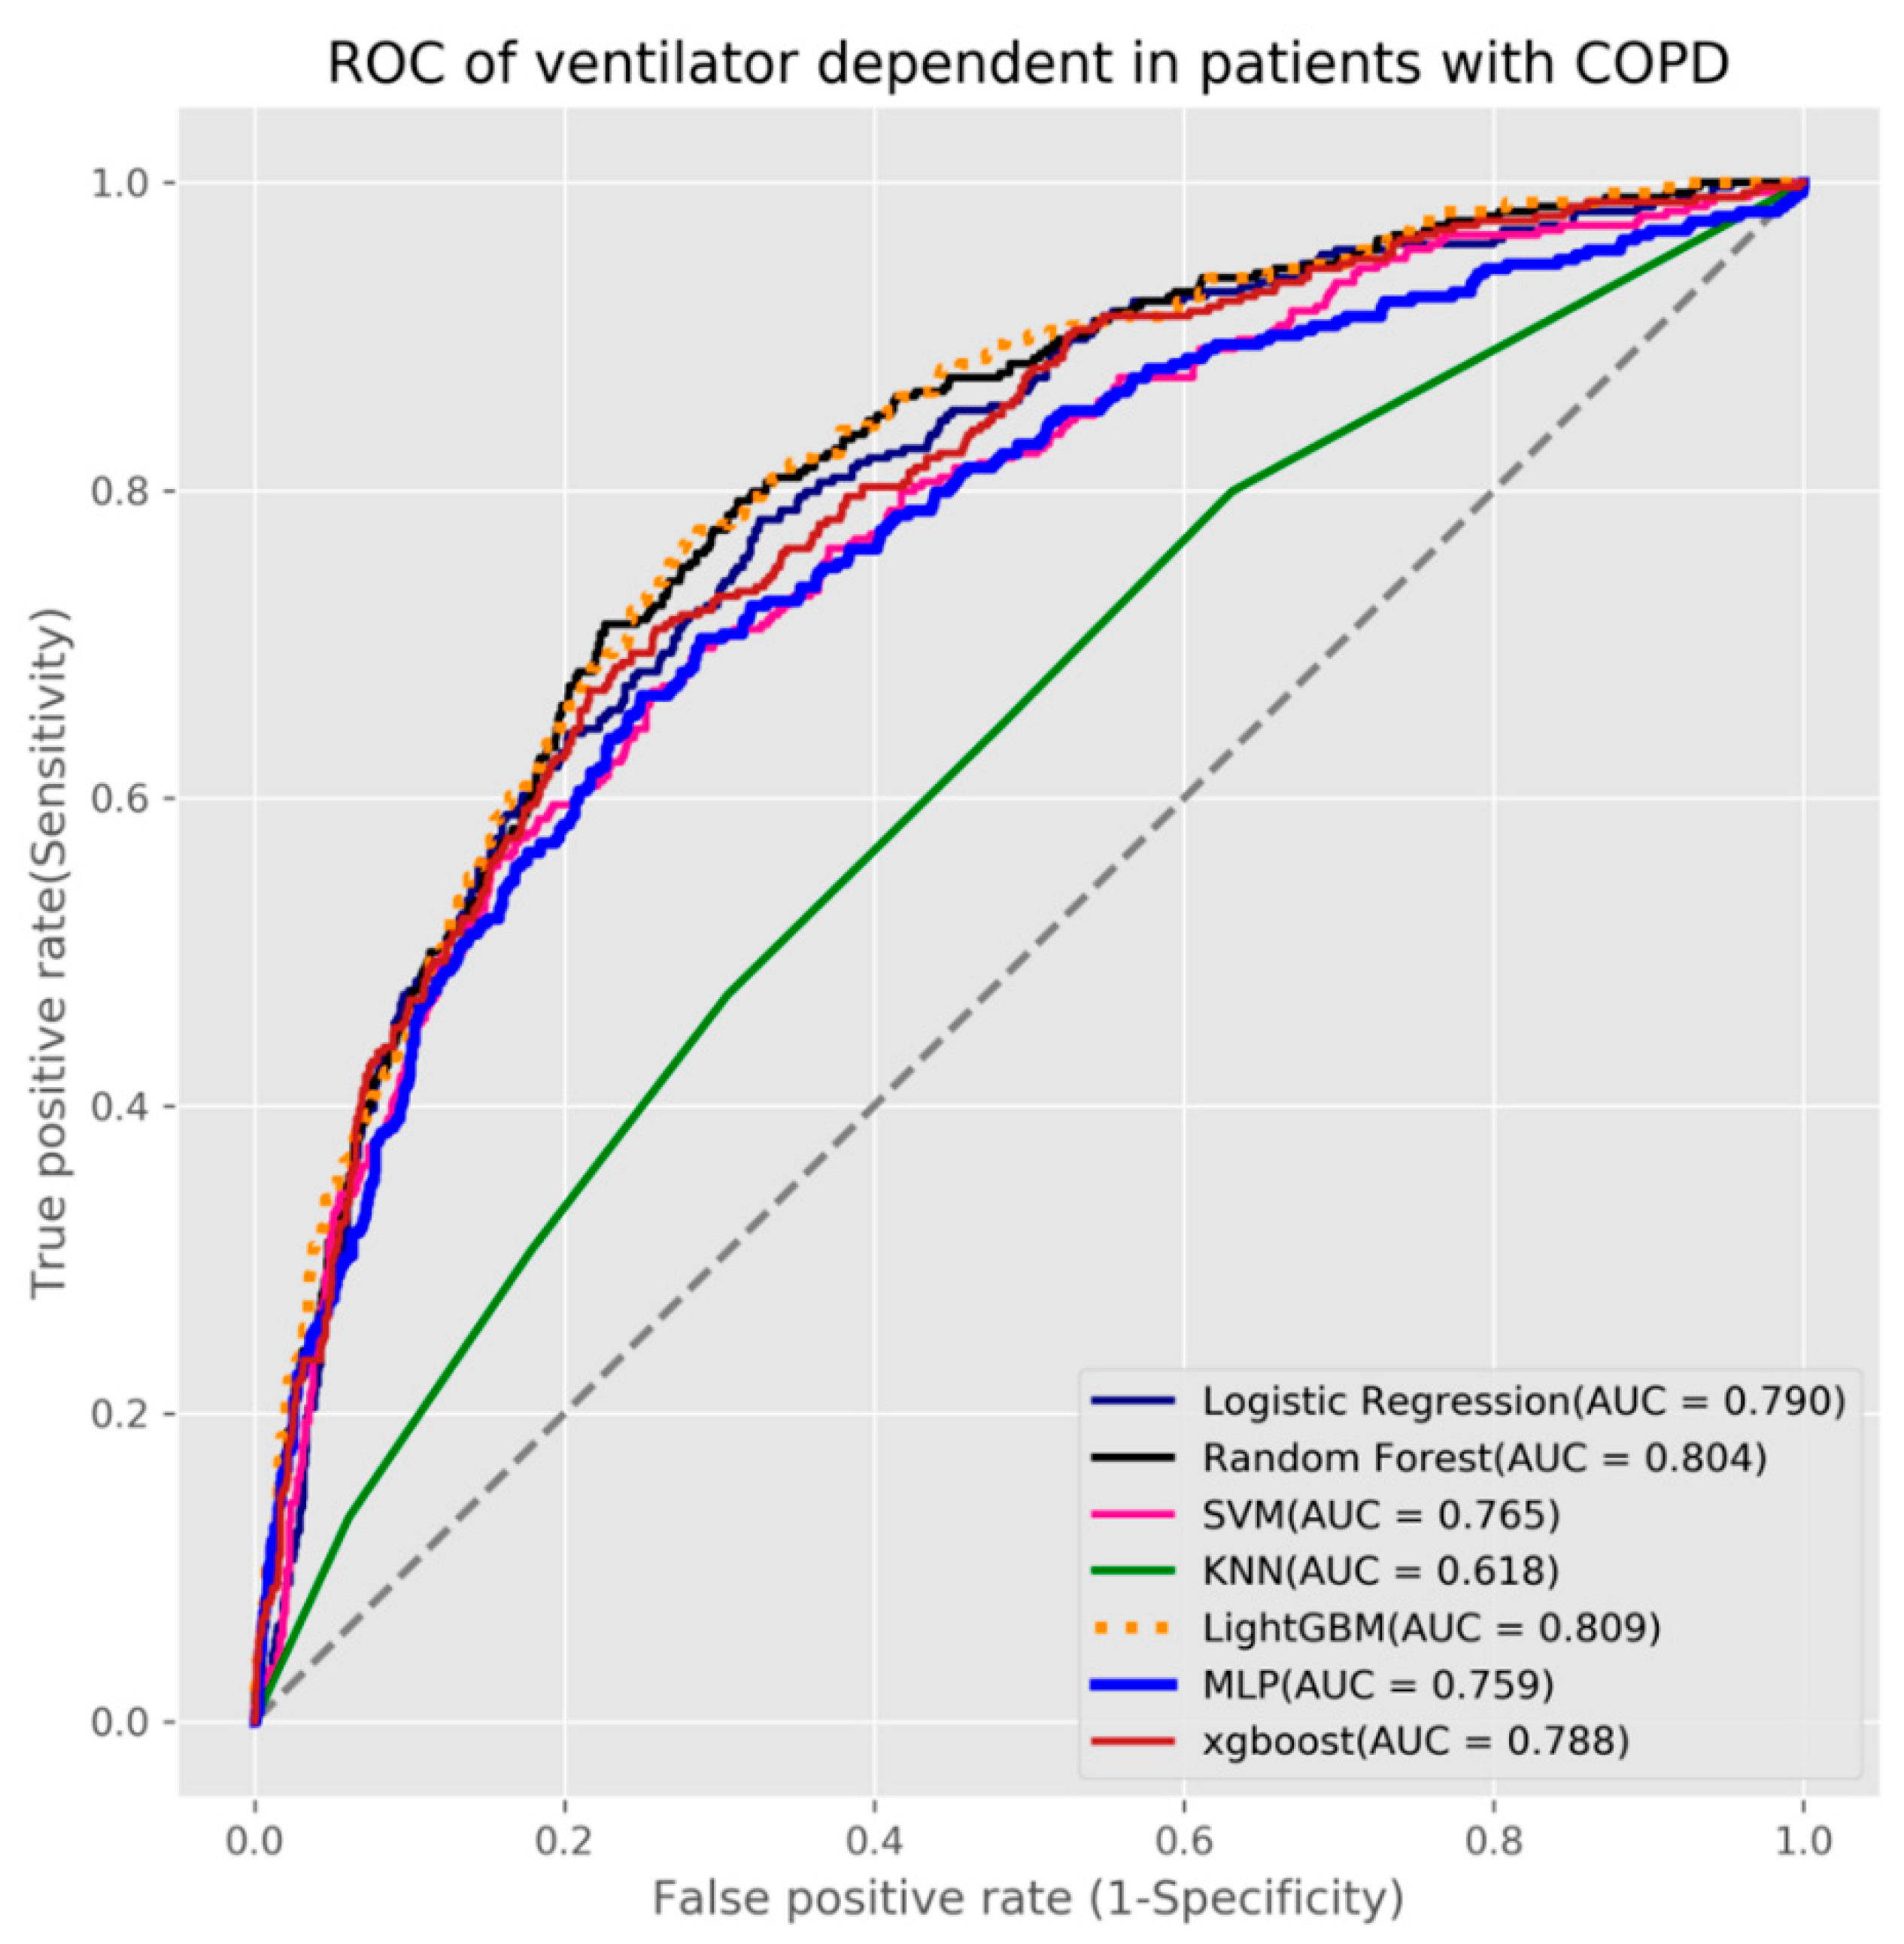
| LightGBM | 0.739 | 0.738 | 0.739 | 0.809 |
| MLP | 0.699 | 0.704 | 0.698 | 0.759 |
| XGBoost | 0.724 | 0.719 | 0.725 | 0.788 |
| Study | This Study | [27] | [28] | [29] |
|---|---|---|---|---|
| Patient type | Inpatient COPD | Emergency department, Asthma or COPD exacerbation | Inpatient AECOPD | COPD at home |
| Patient number | 5061 | 3206 | 410 | 110 |
| Outcome | 1. Ventilator dependence 2. Respiratory failure 3. Mortality | 1. Critical care outcome 2. Hospitalization outcome | Classifying the severity of AECOPD | Predicting COPD exacerbations |
| Study method | Seven machine leaning methods | Four machine leaning methods | Four machine leaning methods | One machine leaning method |
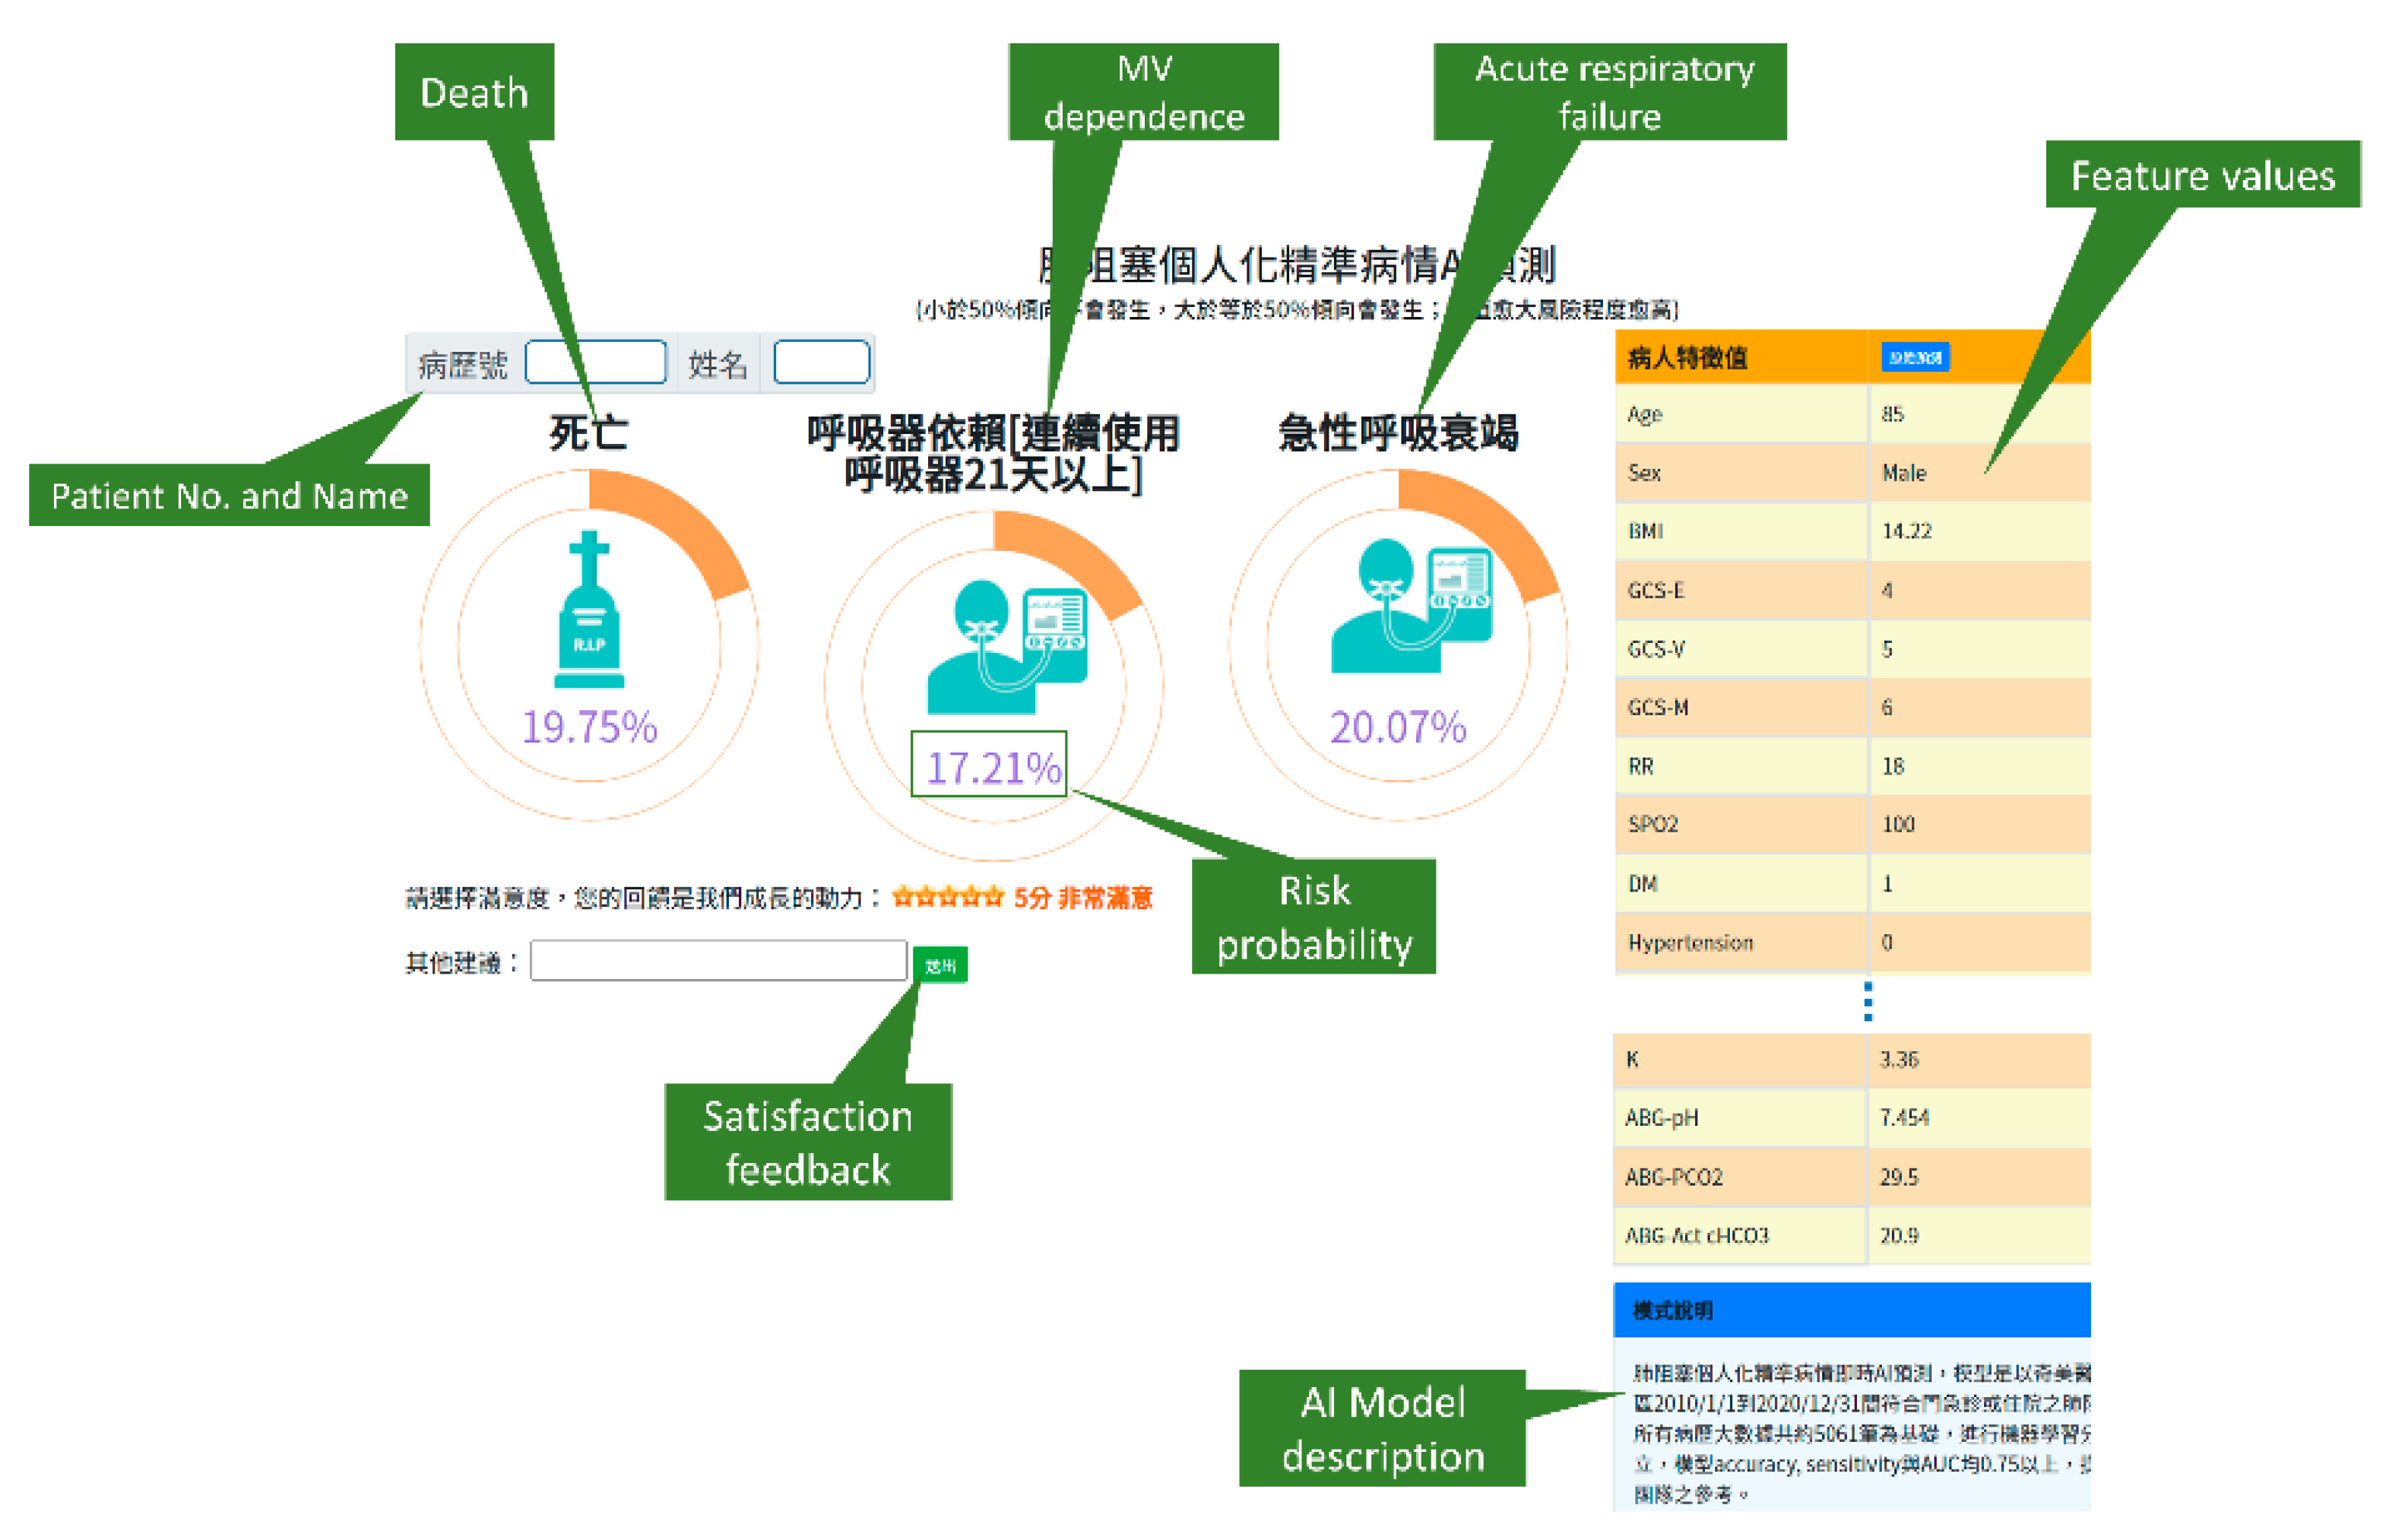
| Real world implementation | Yes. A predictive application with AI models was implemented and integrated into the existing HIS | N/A | N/A | N/A. |
| Input data | Patient demographic, vital signs, Glasgow Coma Scale (GCS), blood gases, laboratory results, comorbidities | Age, sex, mode of arrival, vital signs, common chief complaints, asthma or COPD status, comorbidities | Vital signs, medical history, comorbidities, various inflammatory indicators, laboratory results | Vital signs |
| Testing results (AUC) | Ventilator dependence (0.618–0.809) | Critical care outcome (0.76–0.80) | Predicting the prognosis (0.667–0.803) | Predicting COPD exacerbations (0.682) |
| Acute respiratory failure (0.616–0.812) | Hospitalization outcome (0.82–0.83) | |||
| Mortality (0.604–0.817) | ||||
| Year | 2021 | 2018 | 2020 | 2017 |
Publisher’s Note: MDPI stays neutral with regard to jurisdictional claims in published maps and institutional affiliations. |
© 2021 by the authors. Licensee MDPI, Basel, Switzerland. This article is an open access article distributed under the terms and conditions of the Creative Commons Attribution (CC BY) license (https://creativecommons.org/licenses/by/4.0/).
Share and Cite
Liao, K.-M.; Liu, C.-F.; Chen, C.-J.; Shen, Y.-T. Machine Learning Approaches for Predicting Acute Respiratory Failure, Ventilator Dependence, and Mortality in Chronic Obstructive Pulmonary Disease. Diagnostics 2021, 11, 2396. https://doi.org/10.3390/diagnostics11122396
Liao K-M, Liu C-F, Chen C-J, Shen Y-T. Machine Learning Approaches for Predicting Acute Respiratory Failure, Ventilator Dependence, and Mortality in Chronic Obstructive Pulmonary Disease. Diagnostics. 2021; 11(12):2396. https://doi.org/10.3390/diagnostics11122396
Chicago/Turabian StyleLiao, Kuang-Ming, Chung-Feng Liu, Chia-Jung Chen, and Yu-Ting Shen. 2021. "Machine Learning Approaches for Predicting Acute Respiratory Failure, Ventilator Dependence, and Mortality in Chronic Obstructive Pulmonary Disease" Diagnostics 11, no. 12: 2396. https://doi.org/10.3390/diagnostics11122396