
Multi-Focus Image Fusion Based on Convolution Neural Network for Parkinson’s Disease Image Classification

 , ,
, ,
Abstract
:1. Introduction
1.1. Background of Parkinson’s Disease
1.2. Current Situation of Convolution Neural Network Diagnosis
1.3. Image Fusion
2. Methods
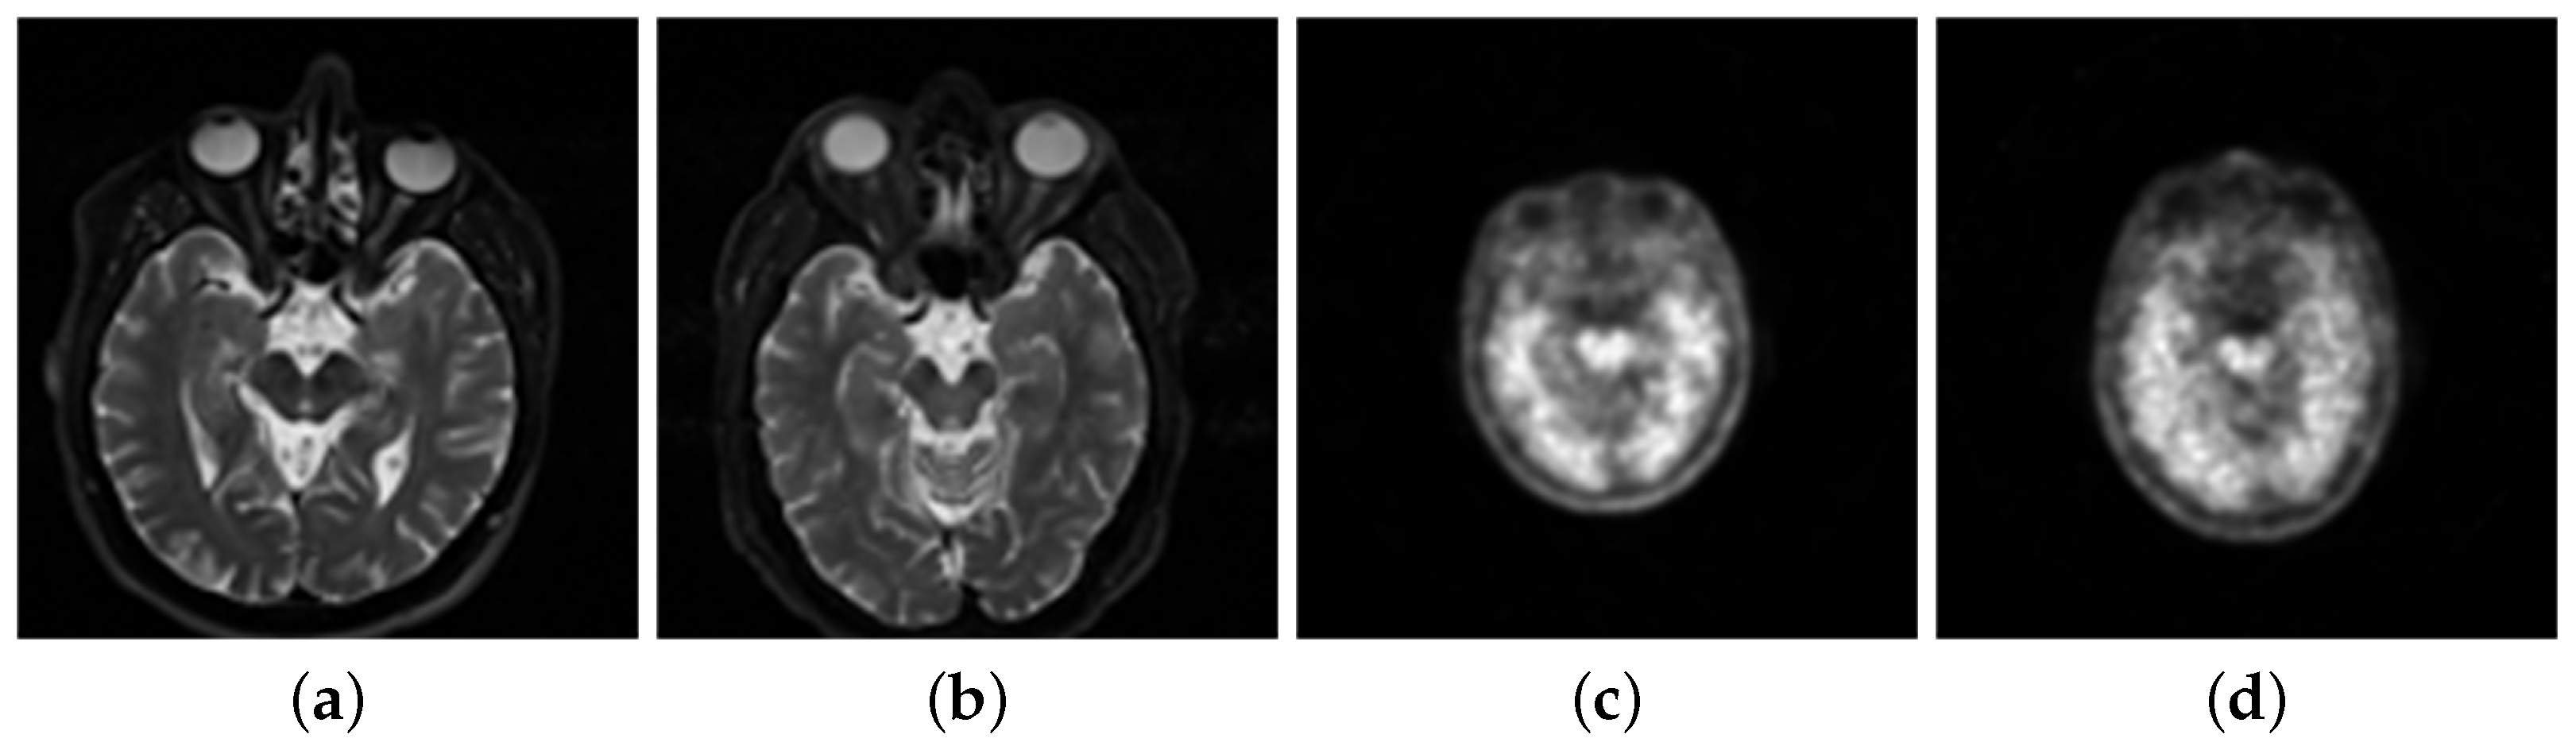
2.1. Data
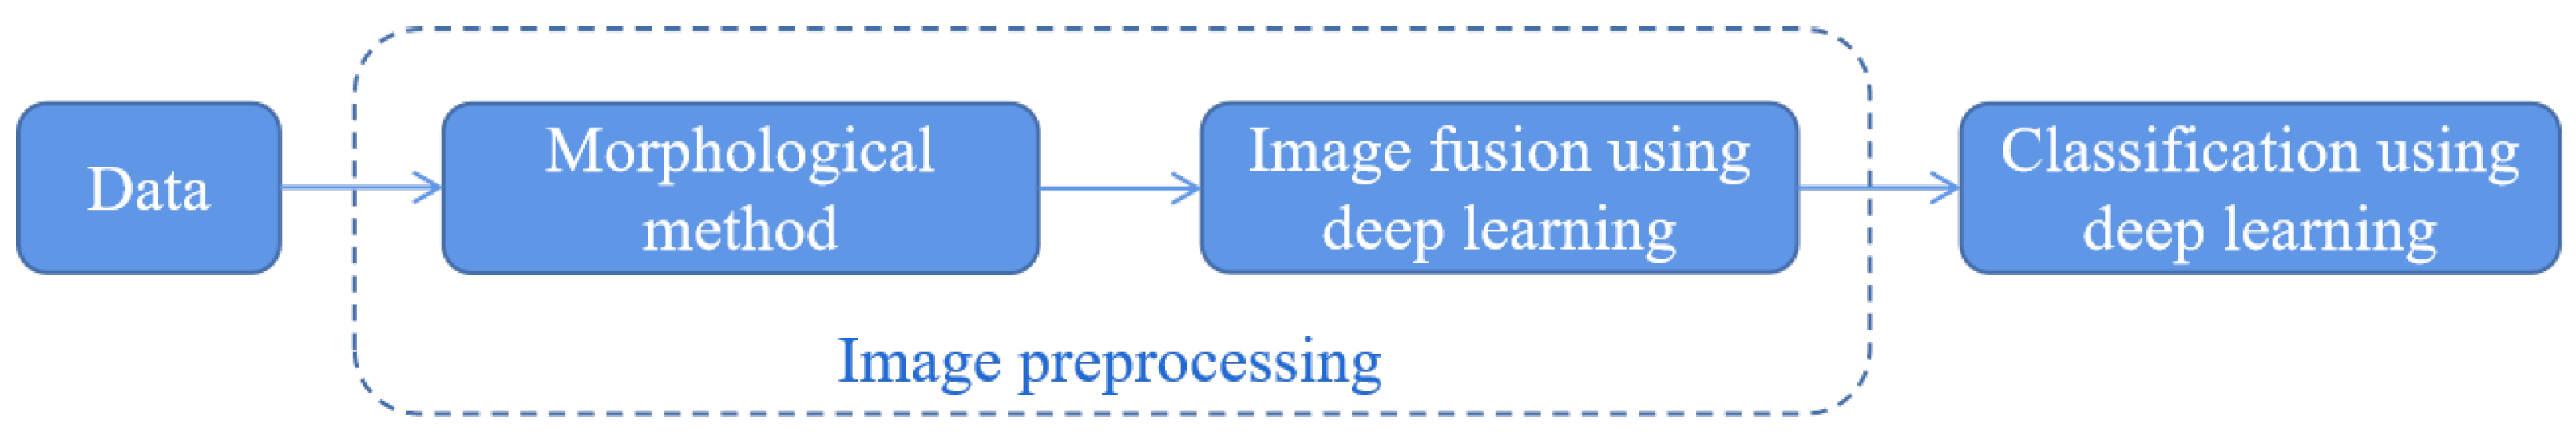
2.2. Data Preprocessing
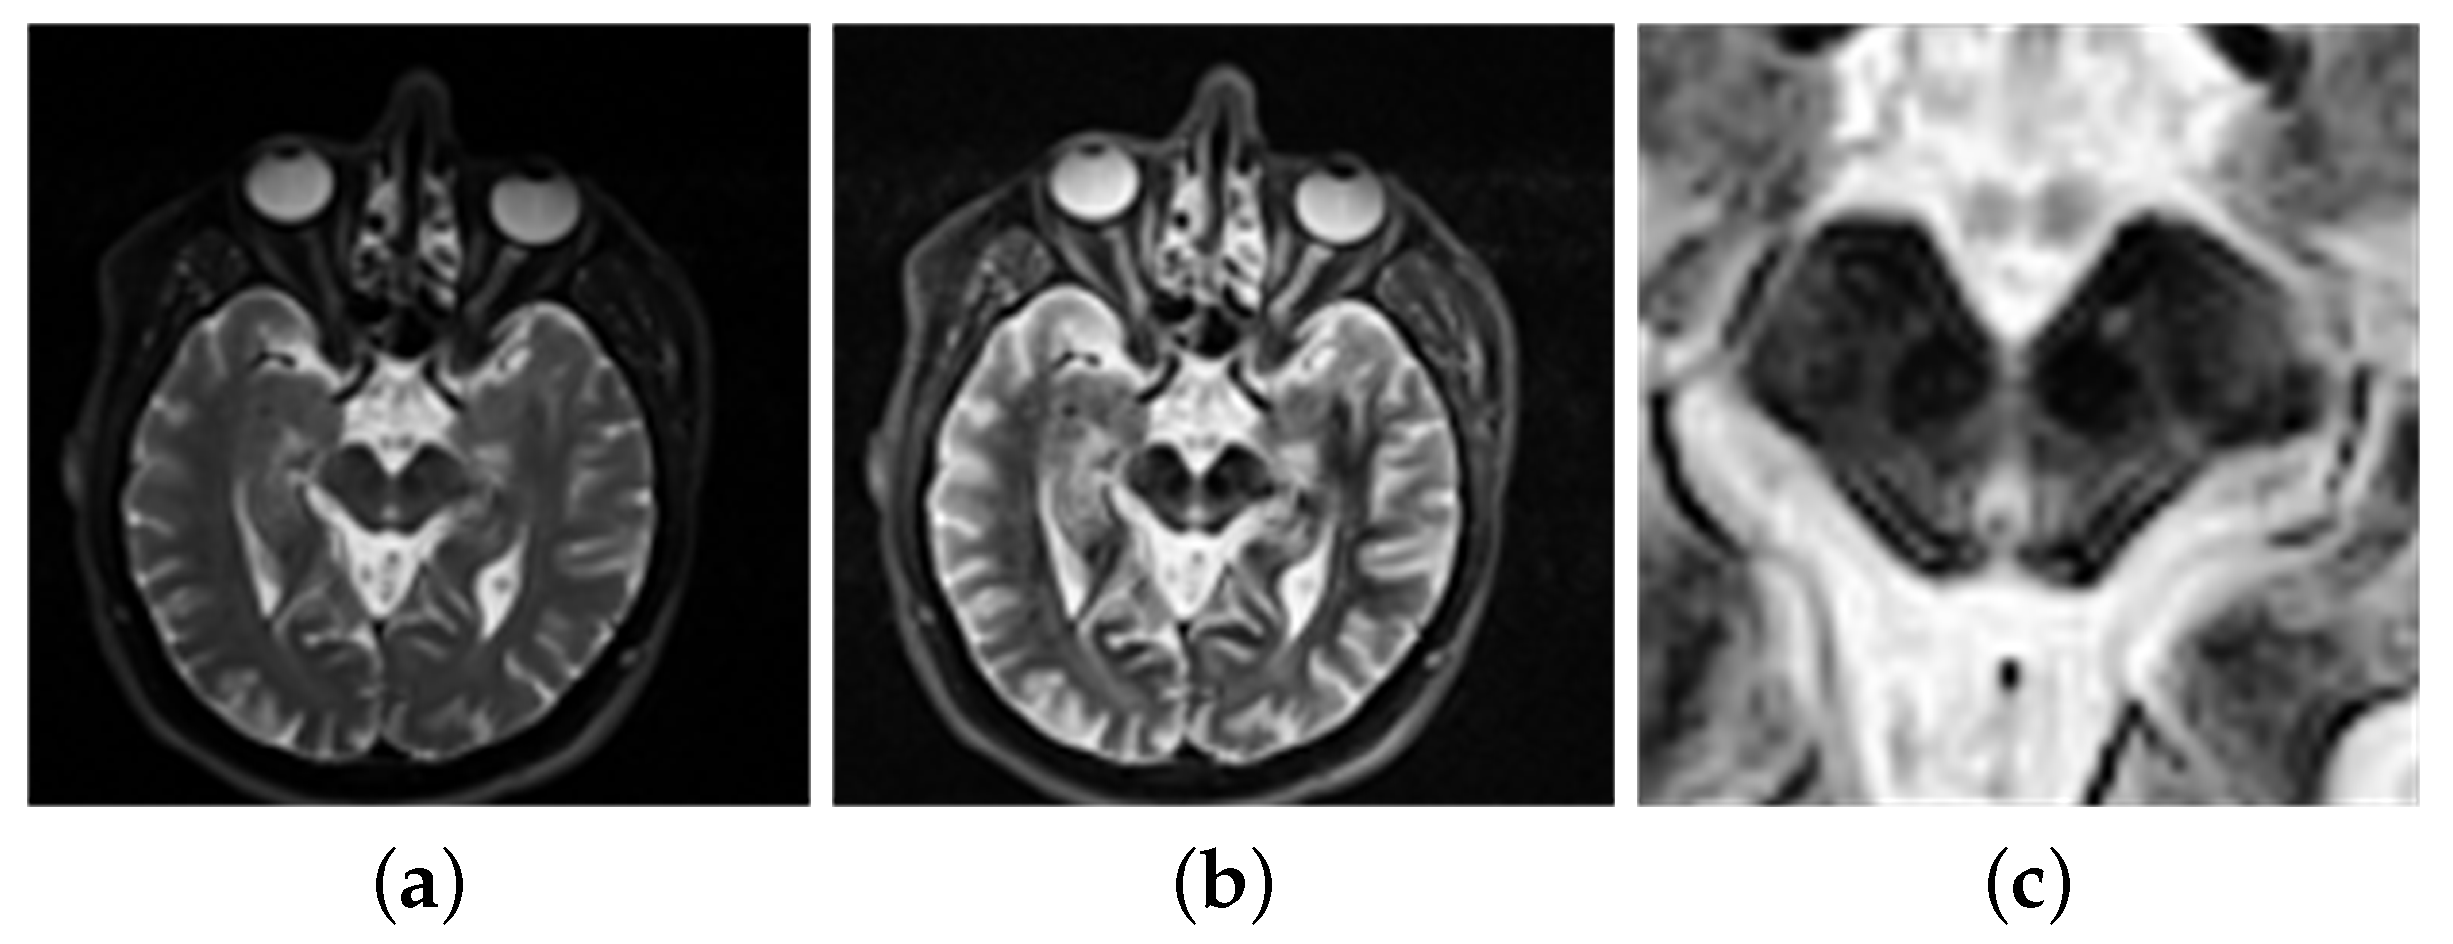
2.2.1. Morphological Methods
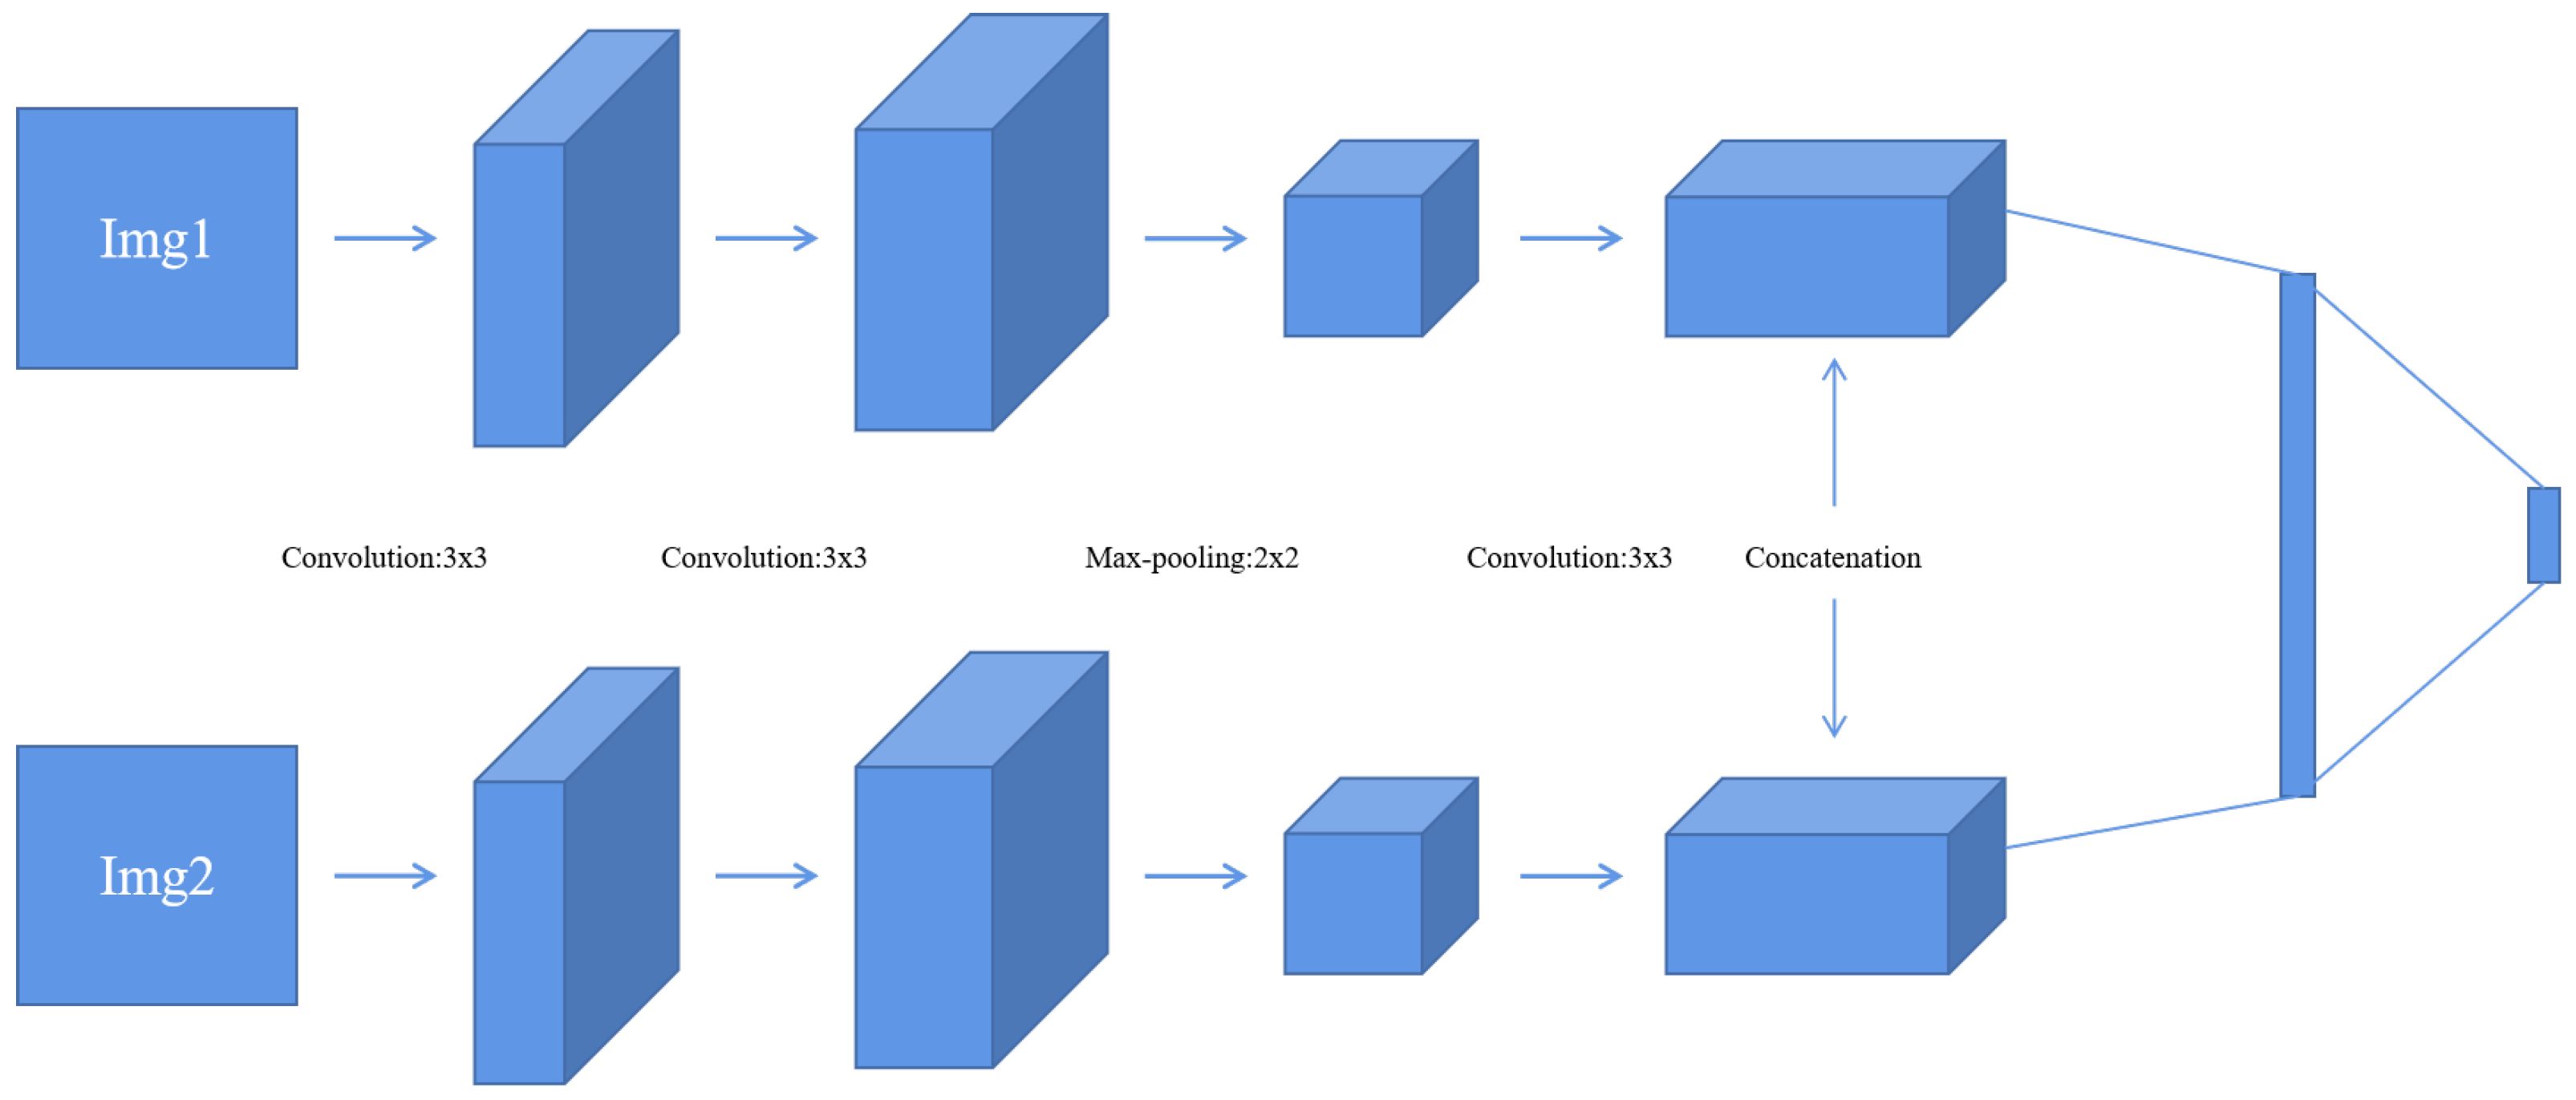
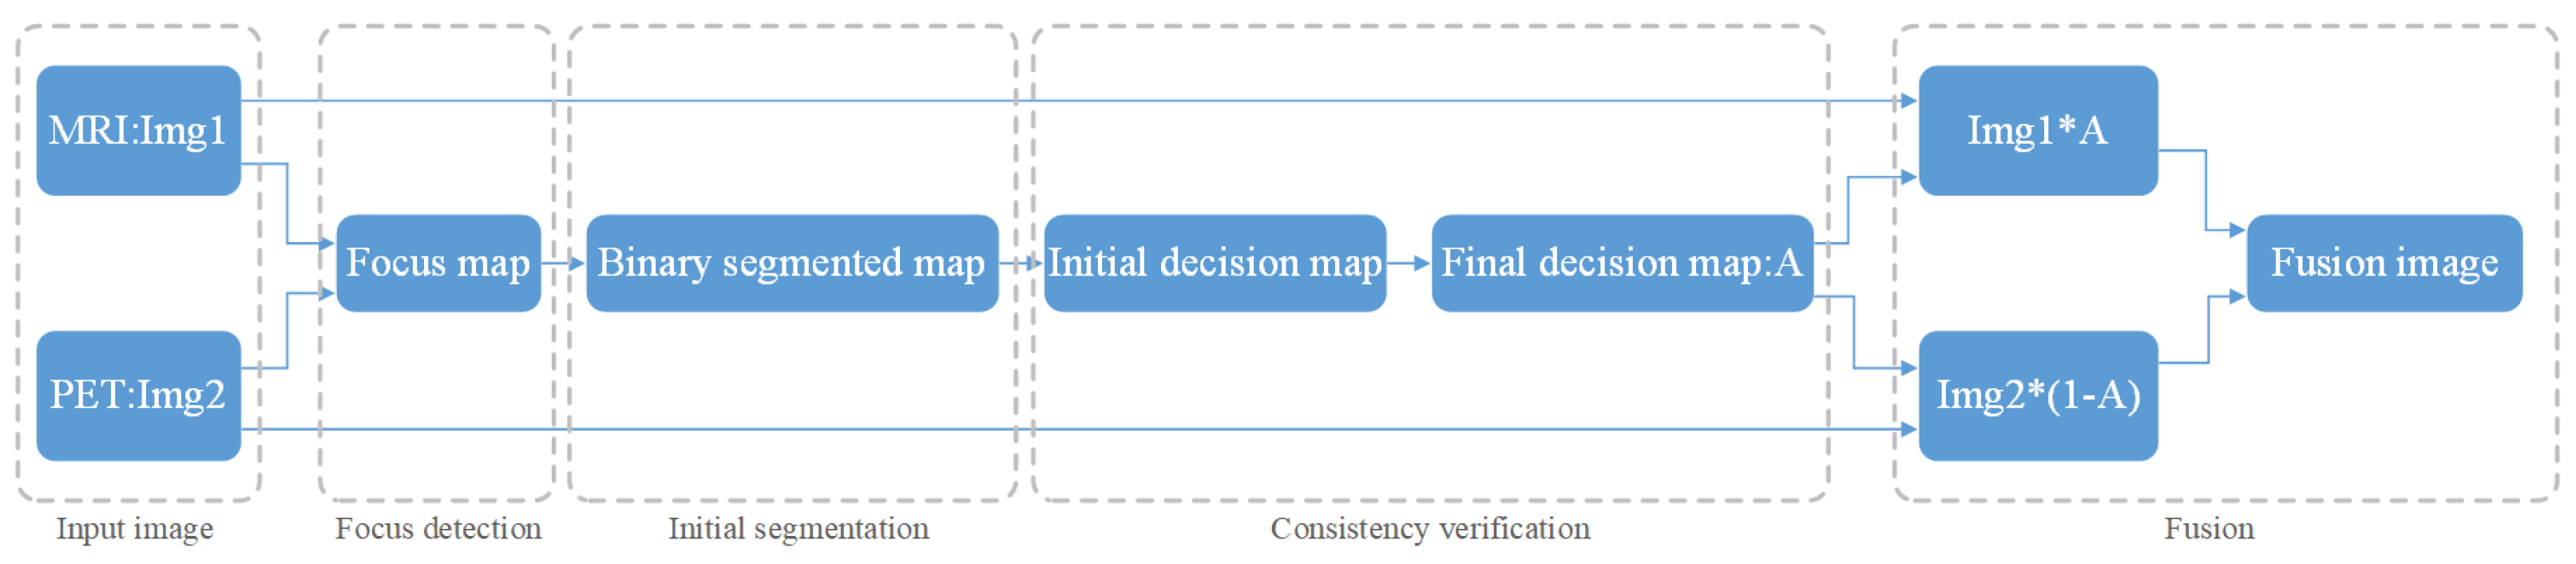
2.2.2. Image Fusion
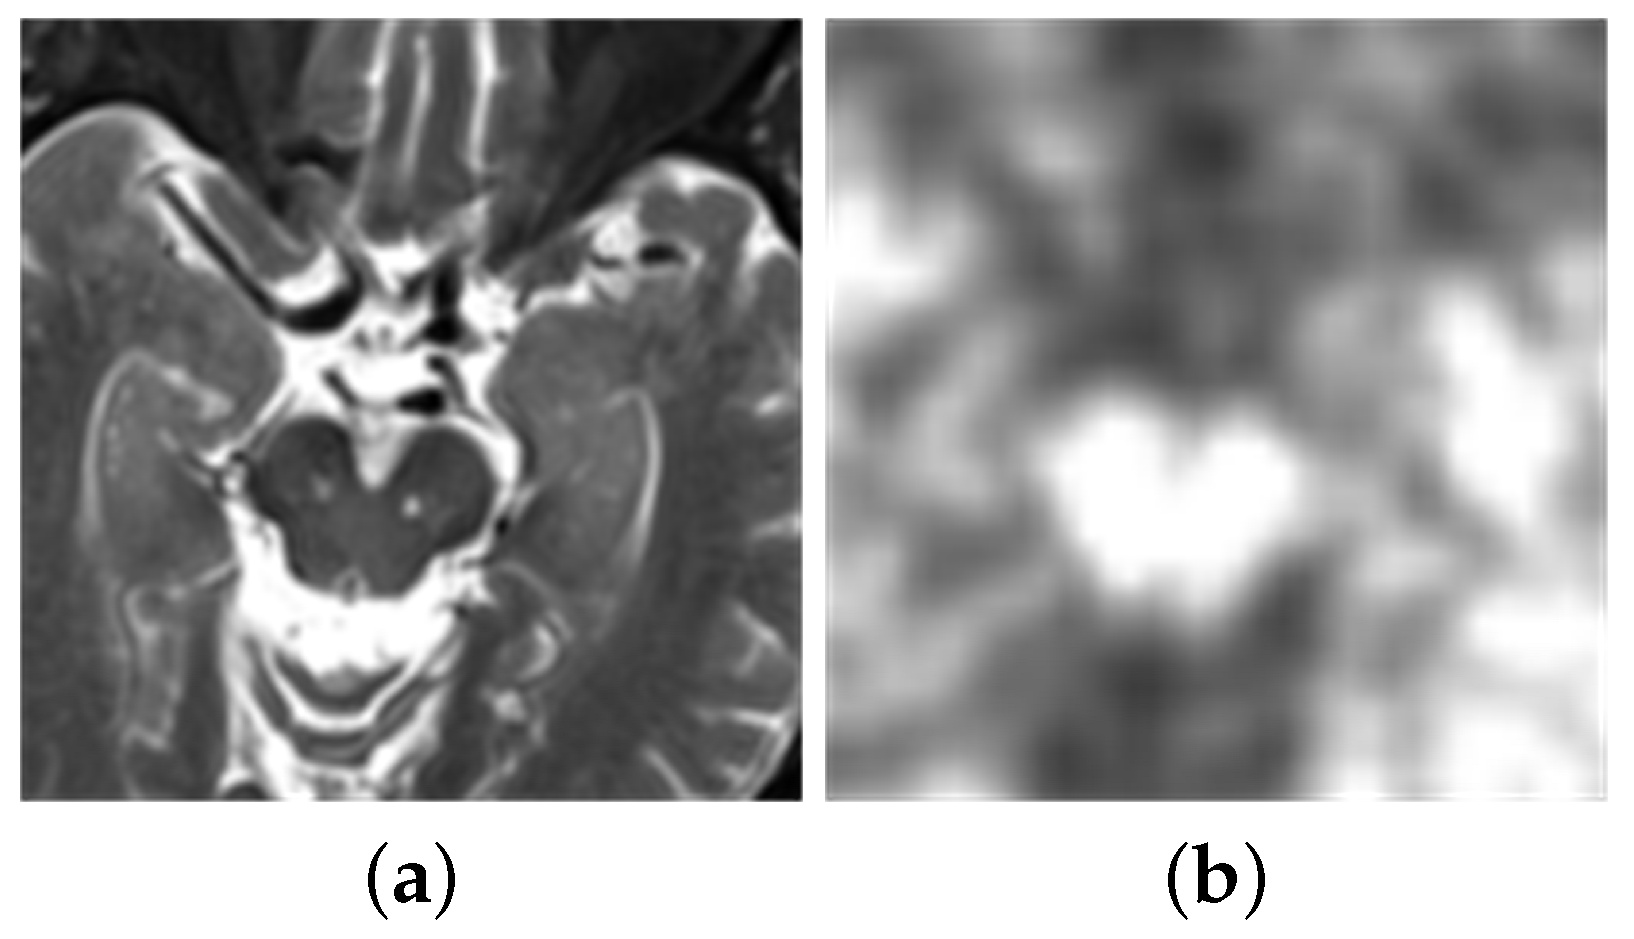
- Firstly, this experiment has pre-registered two images and they will be noted as img1 and img2. The images will be inputted into the neural network. This method compares the same position of the two images in the same group. It is then assigned a value between 0 and 1 to each coefficient point to represent the focusing characteristics of the image. The closer the points’ coefficient is to 1, the more focused the point is. This experiment then obtains a focused image [27].
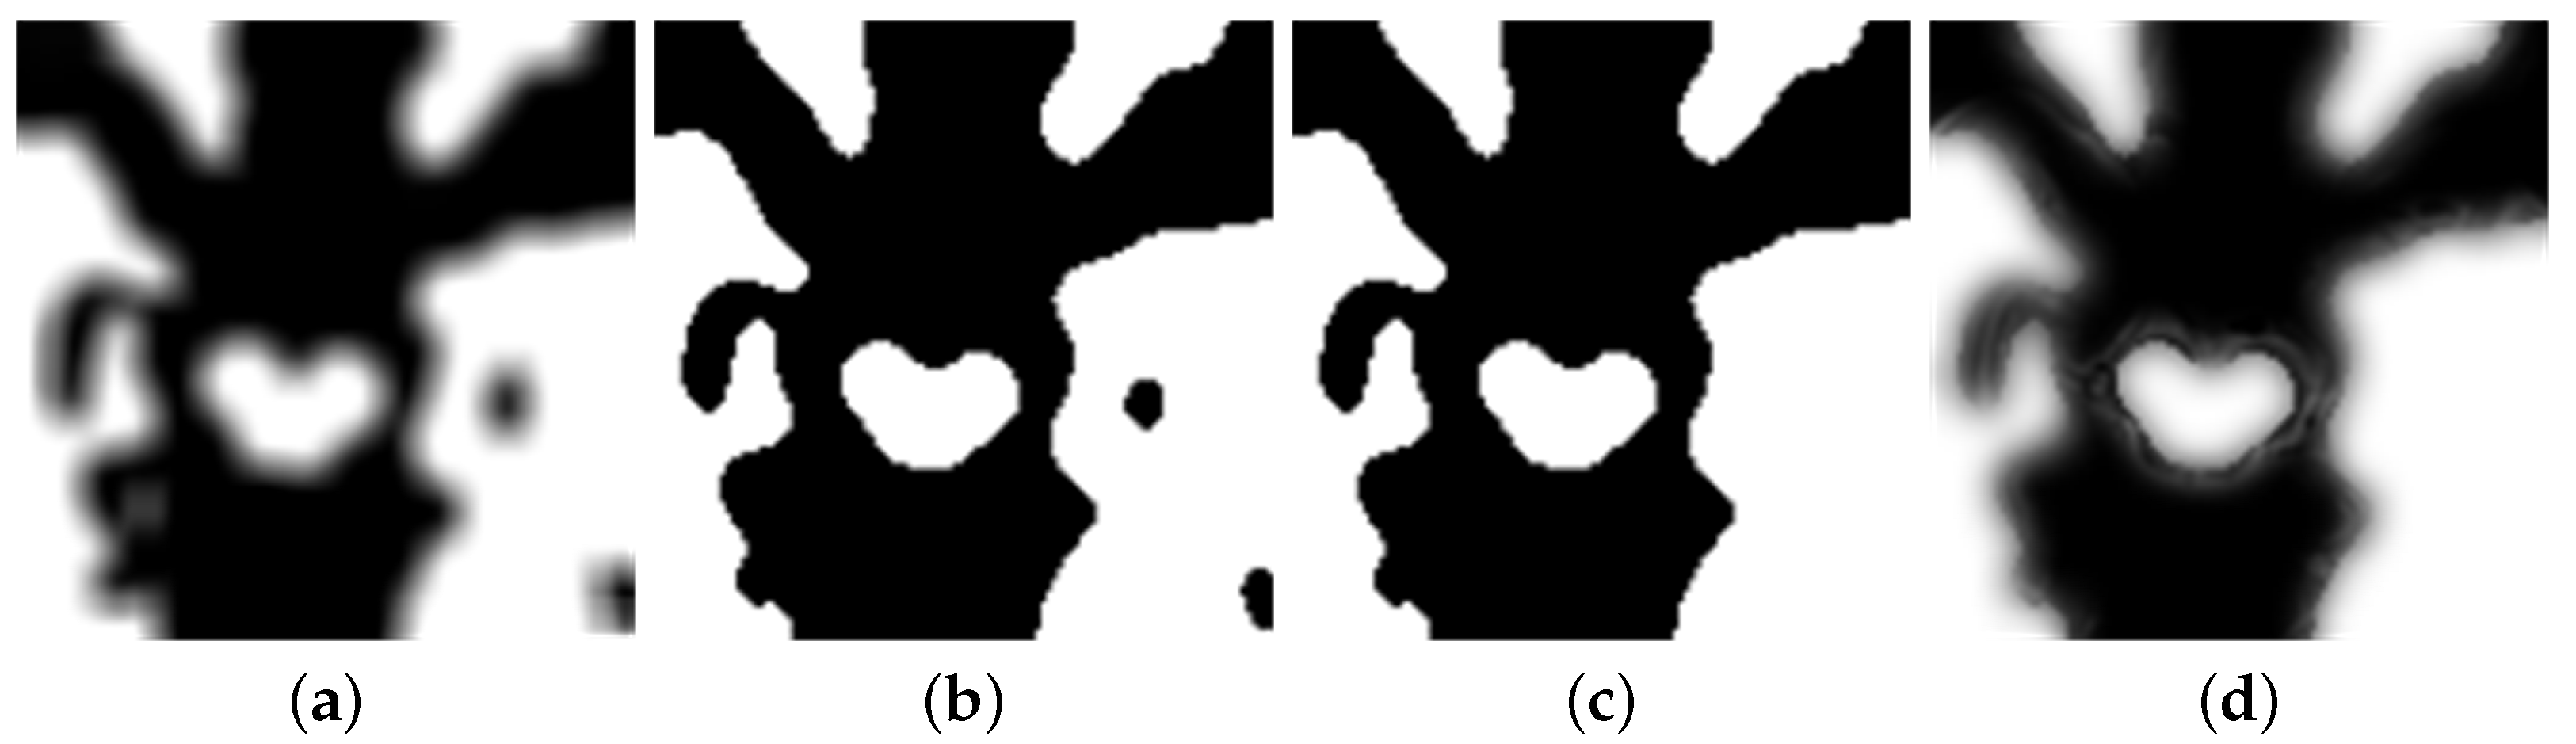
- This experiment uses a threshold of 0.5 to segment the focus image initially. Then, inside the focus map, the experiment marks the coefficient values greater than 0.5 as 1. Similarly, it also marks values less than or equal to 0.5 as 0. This allows the experiment to obtain a binary piecewise map A.
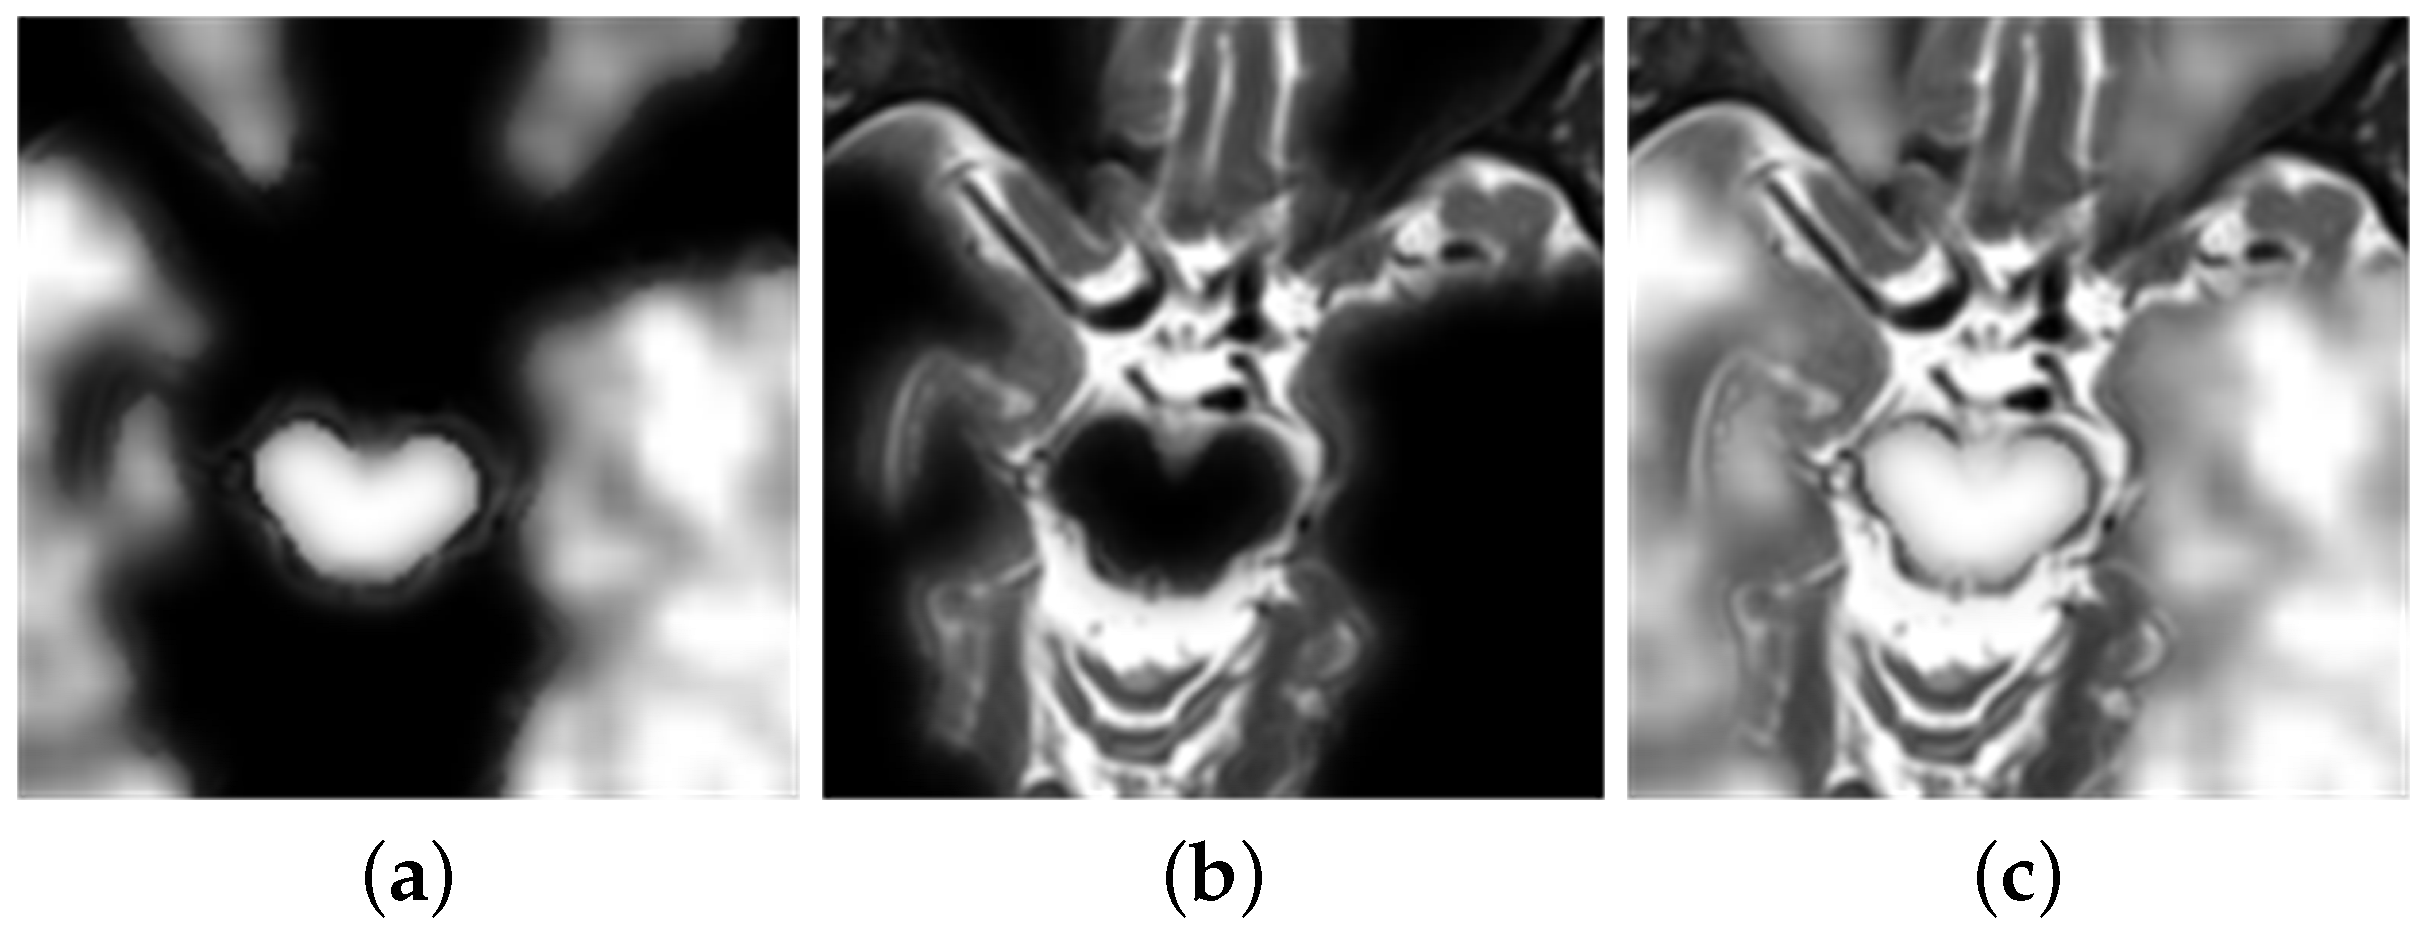
- The next step is used for consistency verification. Deleting incorrect points in the binary segmented graph and extracting the maximum connected component of the binary map allows the initial decision diagram to be returned [27]. After extracting the diagram, the experiment uses Formula (2) to calculate the gray image of the original image, the initial decision graph, and the filtered operation results. Following this, the experiment obtains a final decision diagram [27].
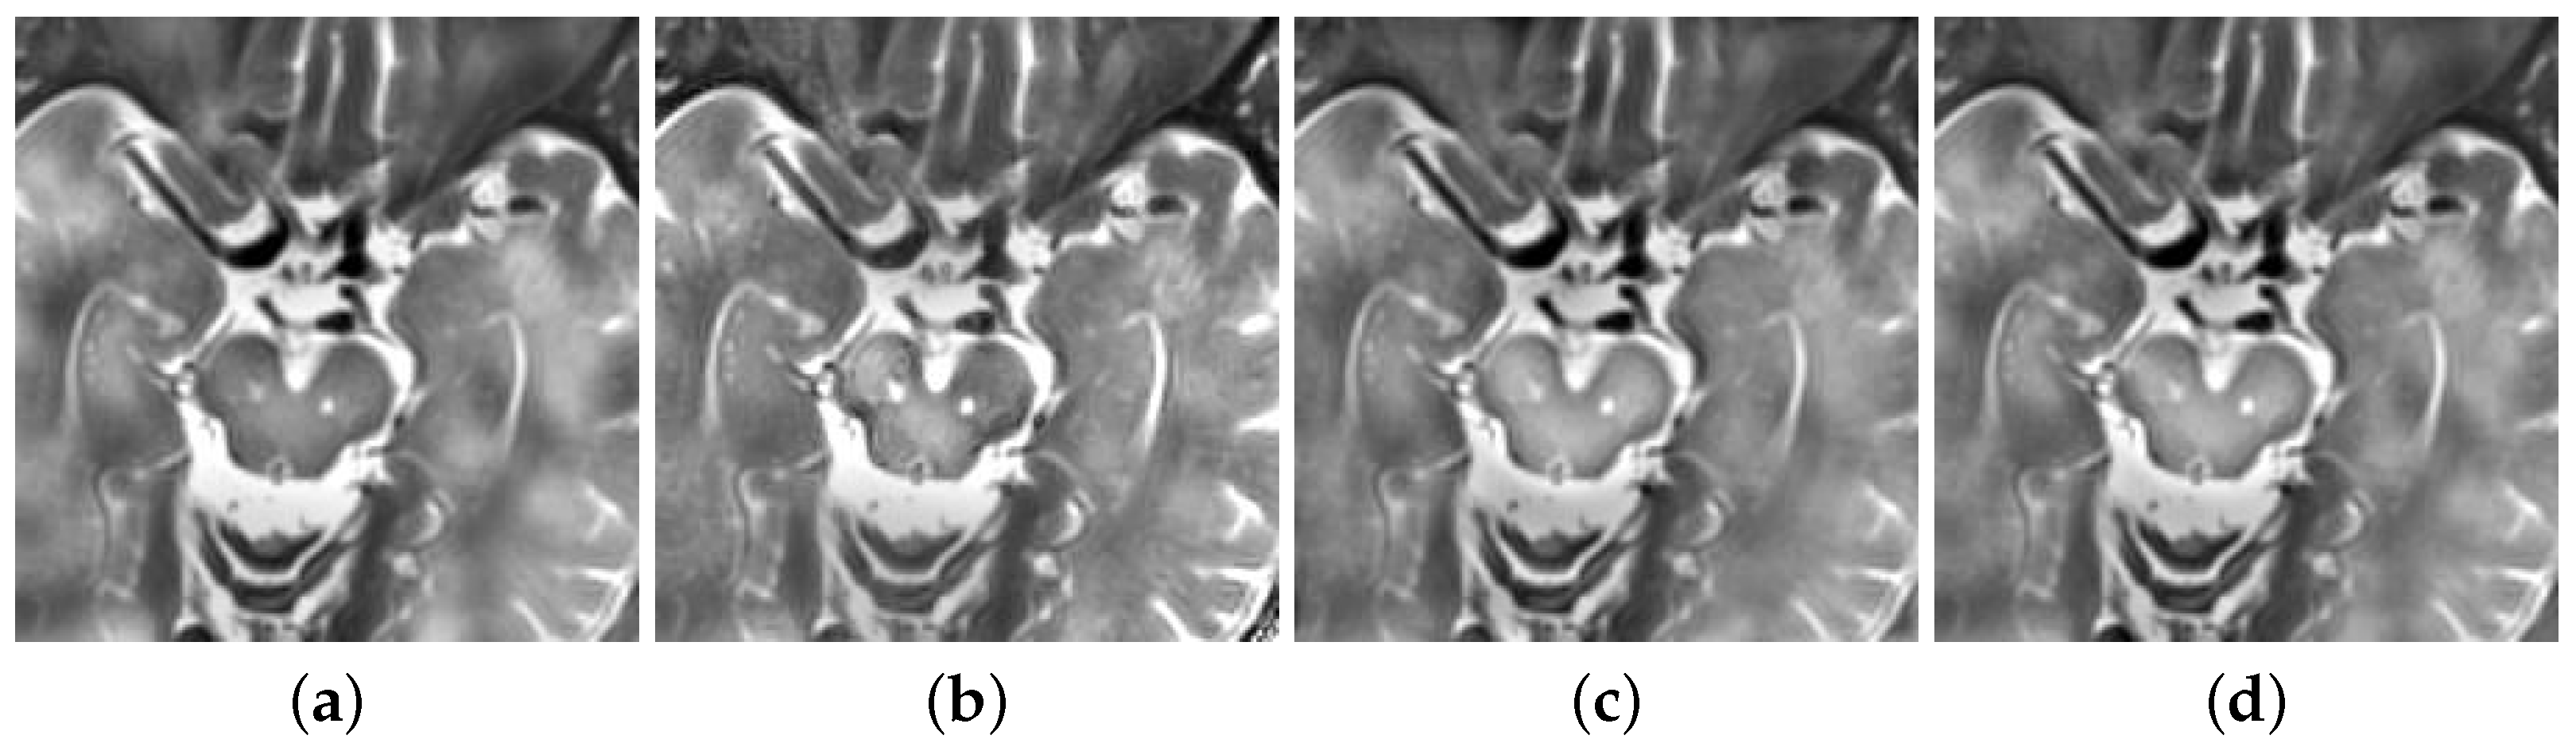
- Finally, the experiments fused the multiplication of MRI and the final decision map and the multiplication of PET and the final decision map complement into an image. Then, the experiment obtains a final fusion image that follows Formula (2) [15].
2.3. Classification of Convolutional Neural Network
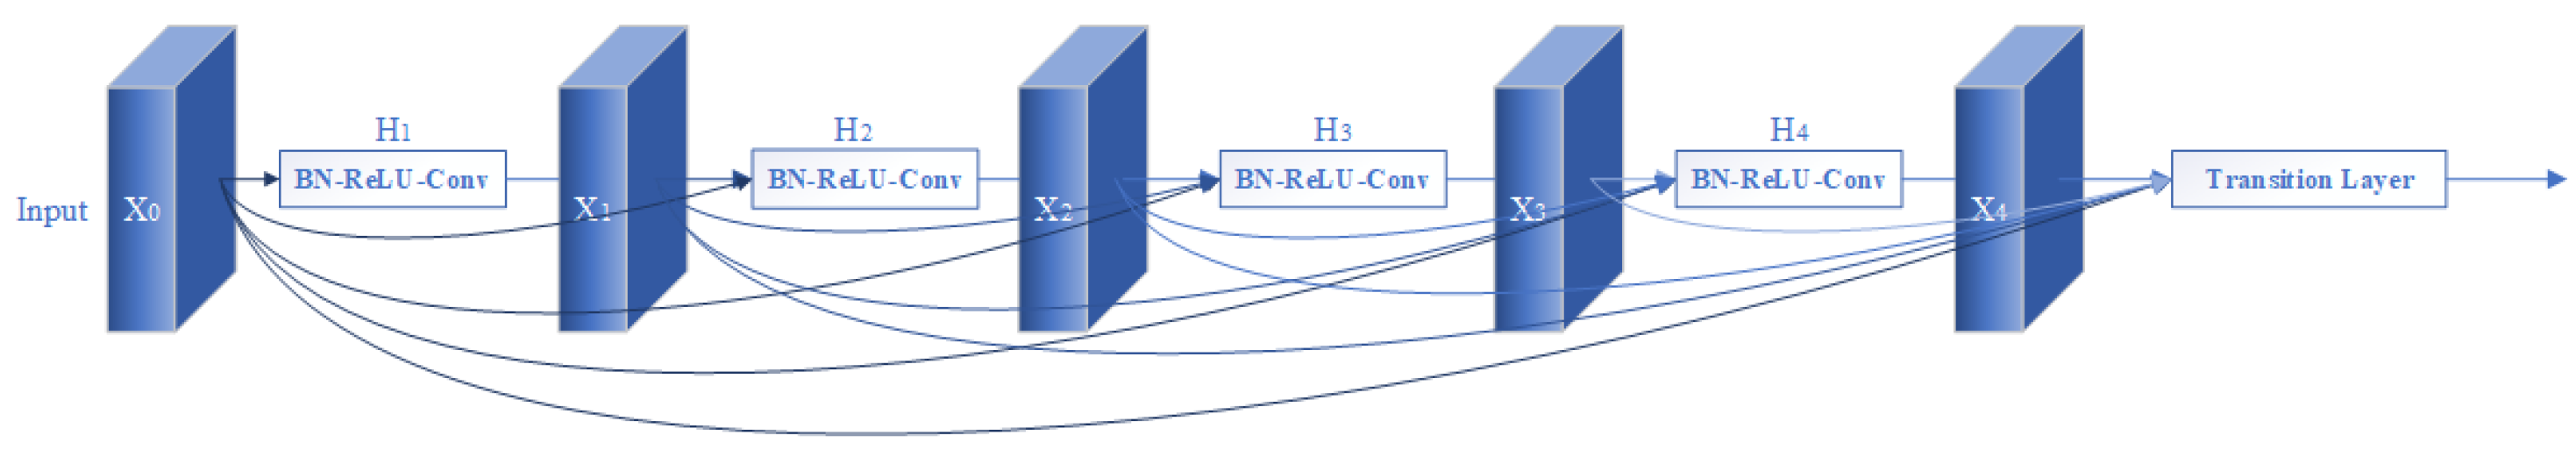
2.3.1. Local Direct Connected Structure Densenet
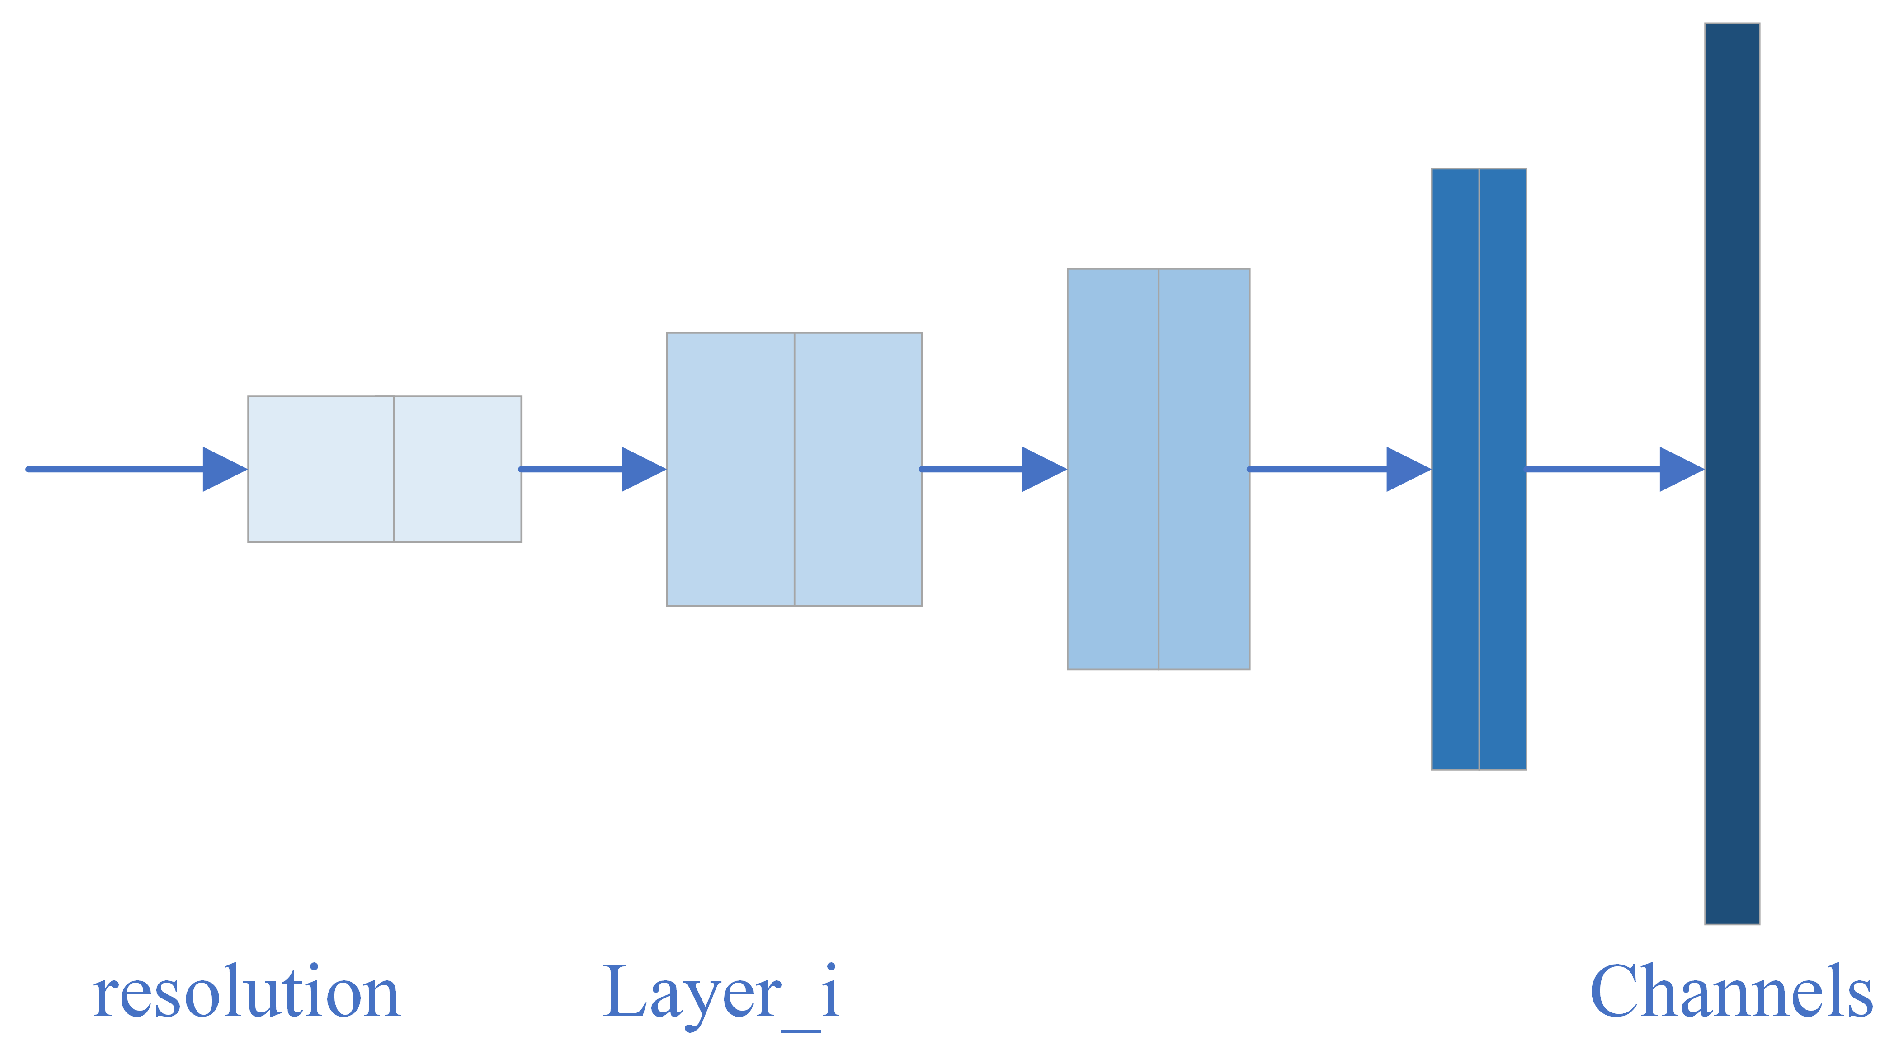
2.3.2. Modular Network Structure Efficientnet
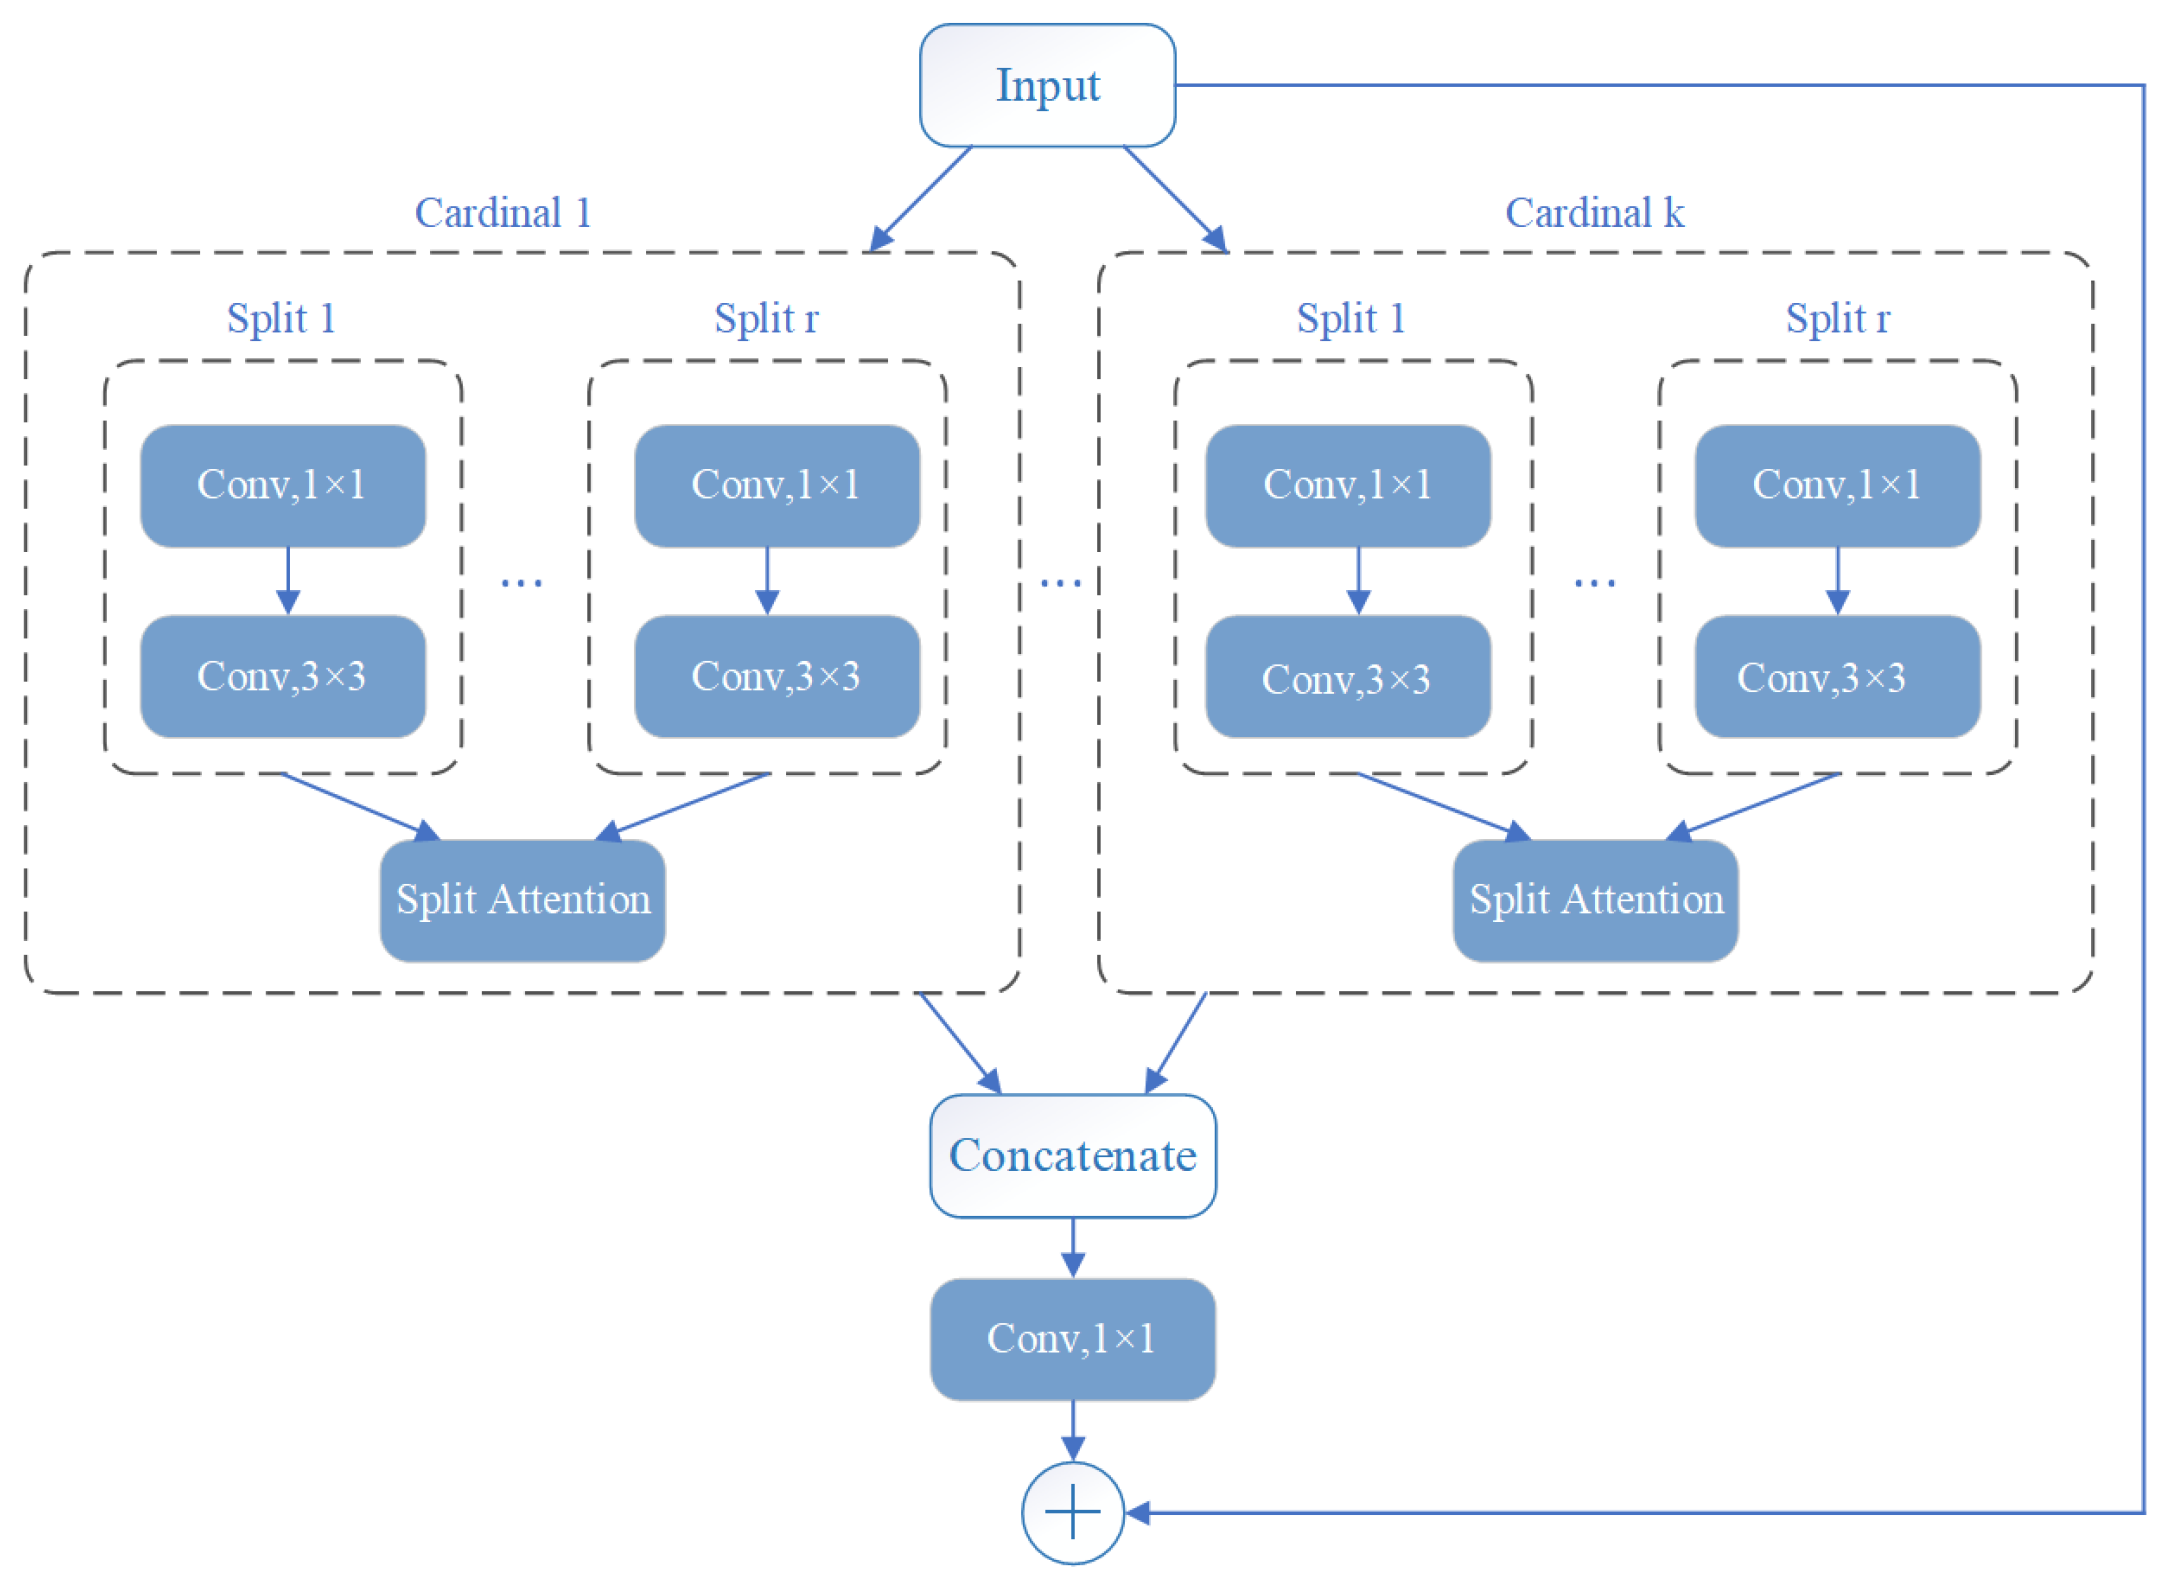
2.3.3. Structures of Multi-Channels ResNeSt
2.4. Training and Testing of Neural Networks
3. Results and Discussion
3.1. Data Preprocessing
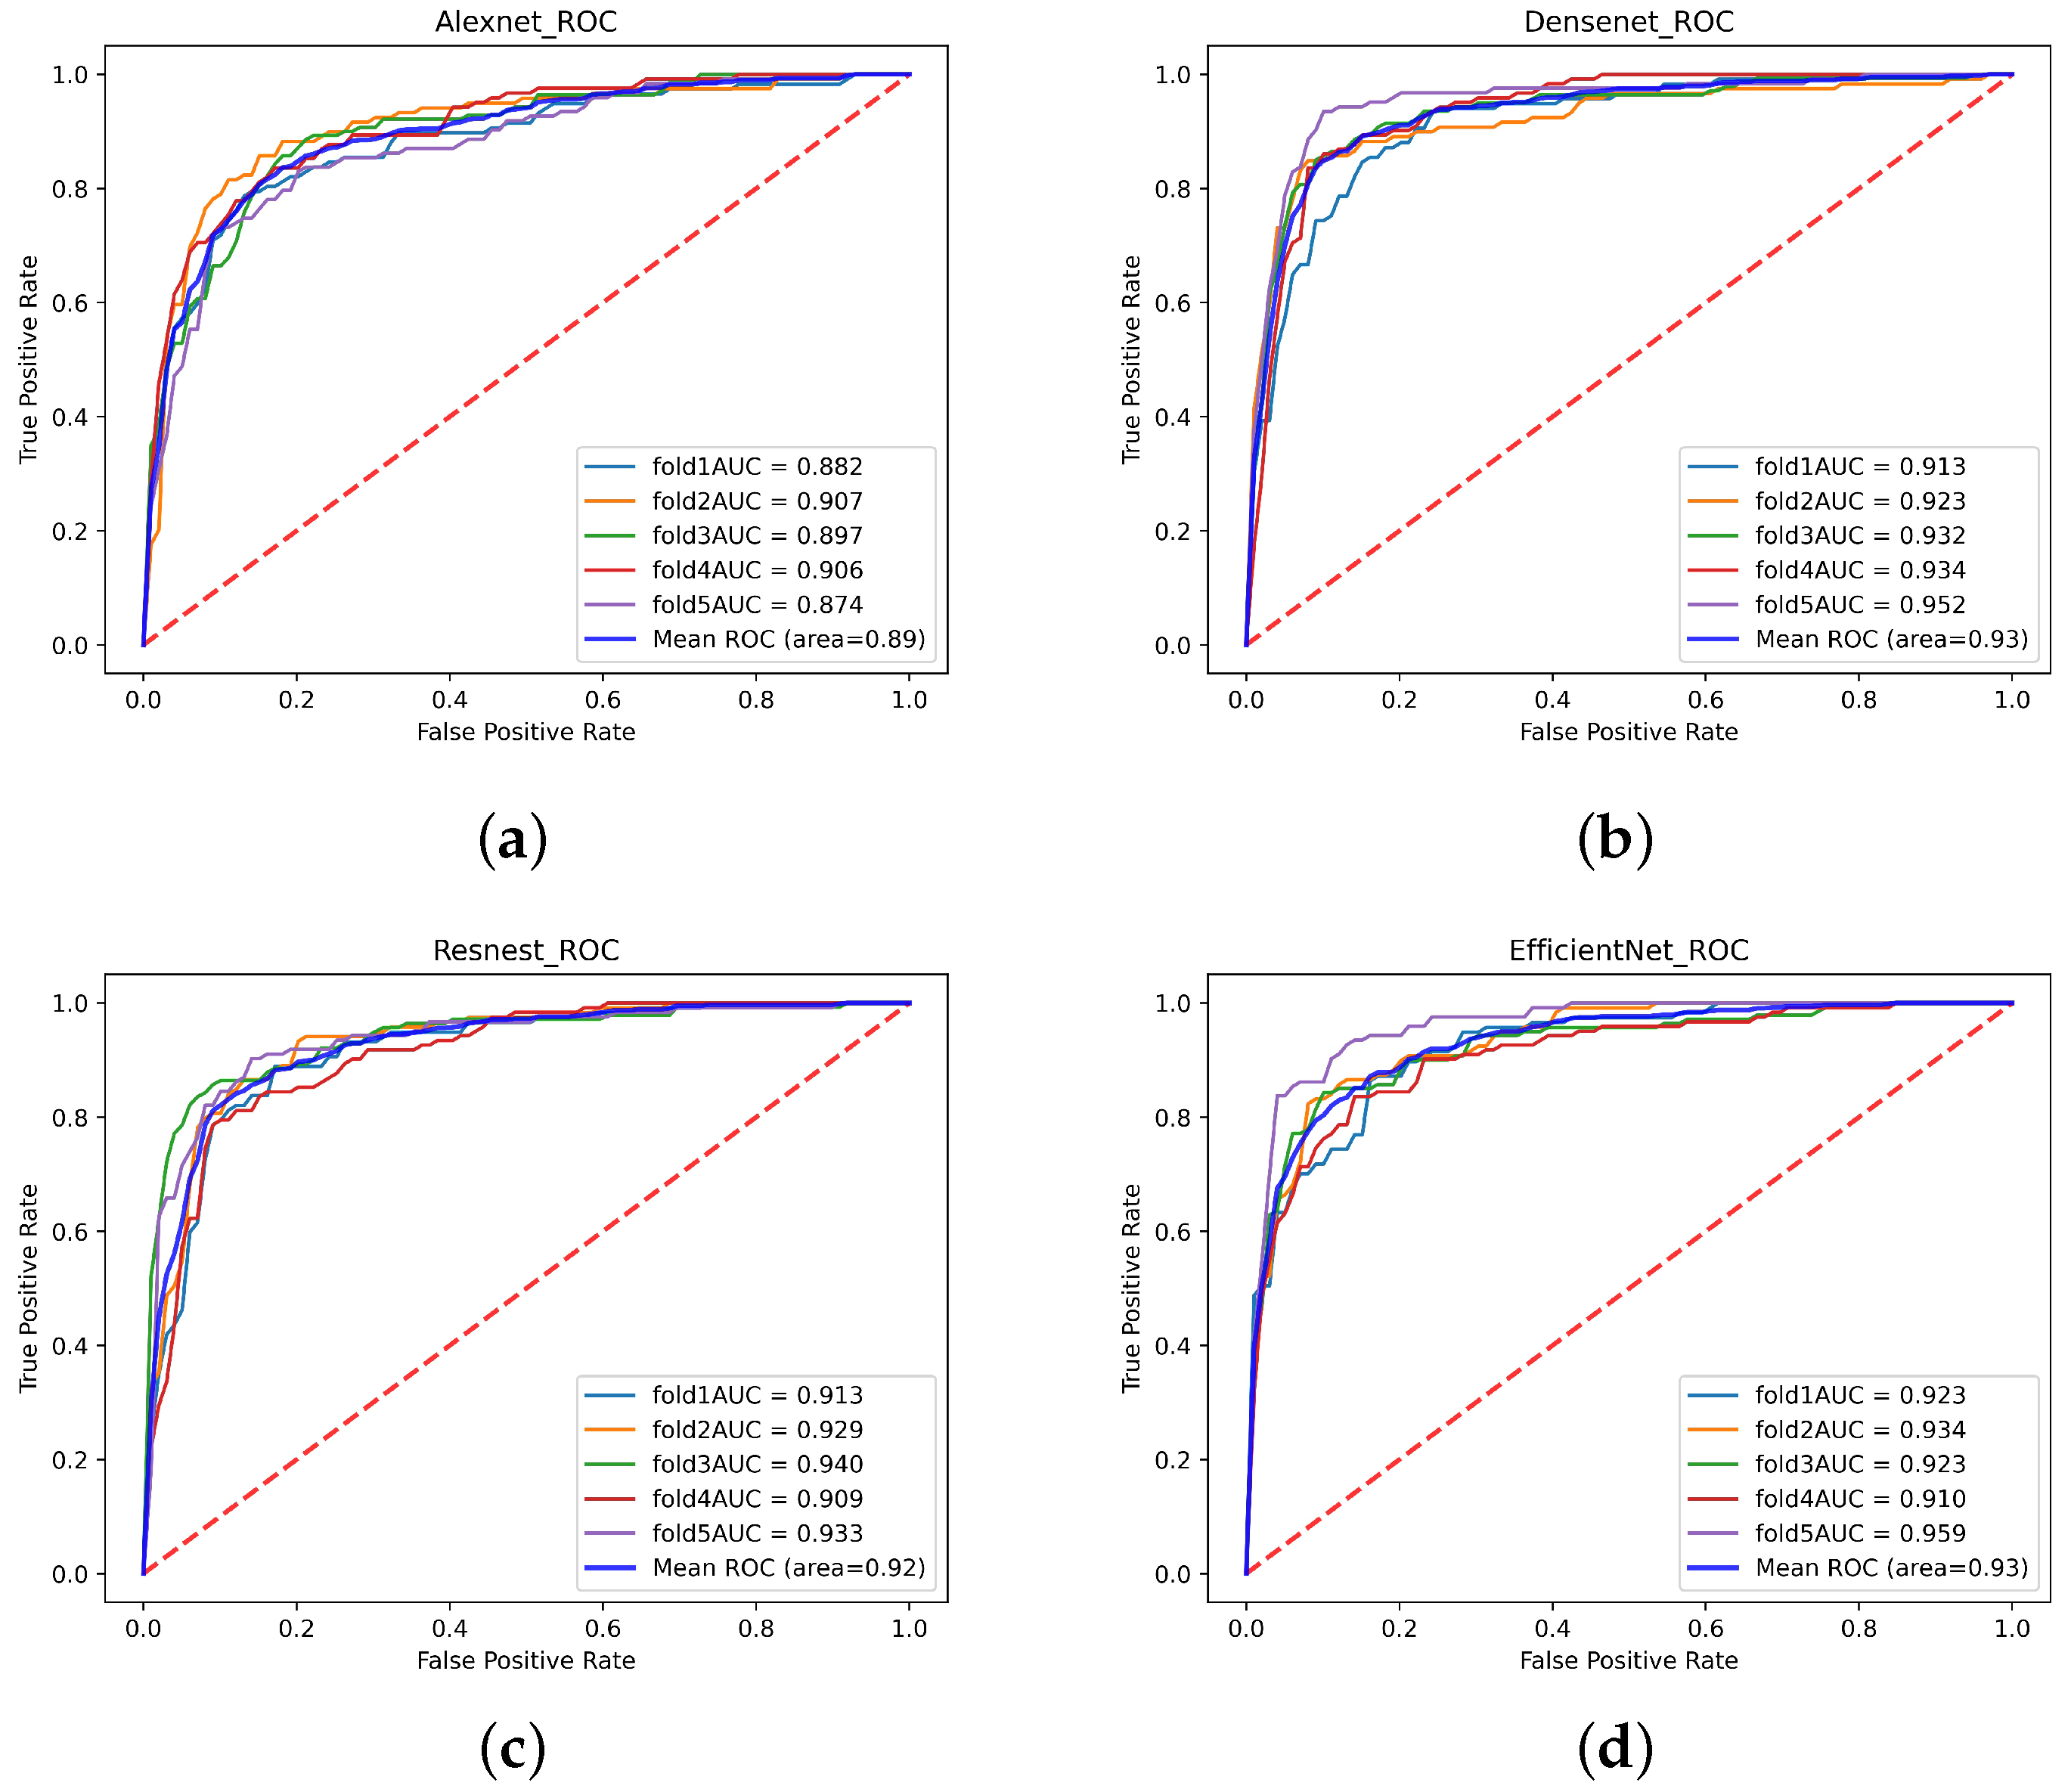
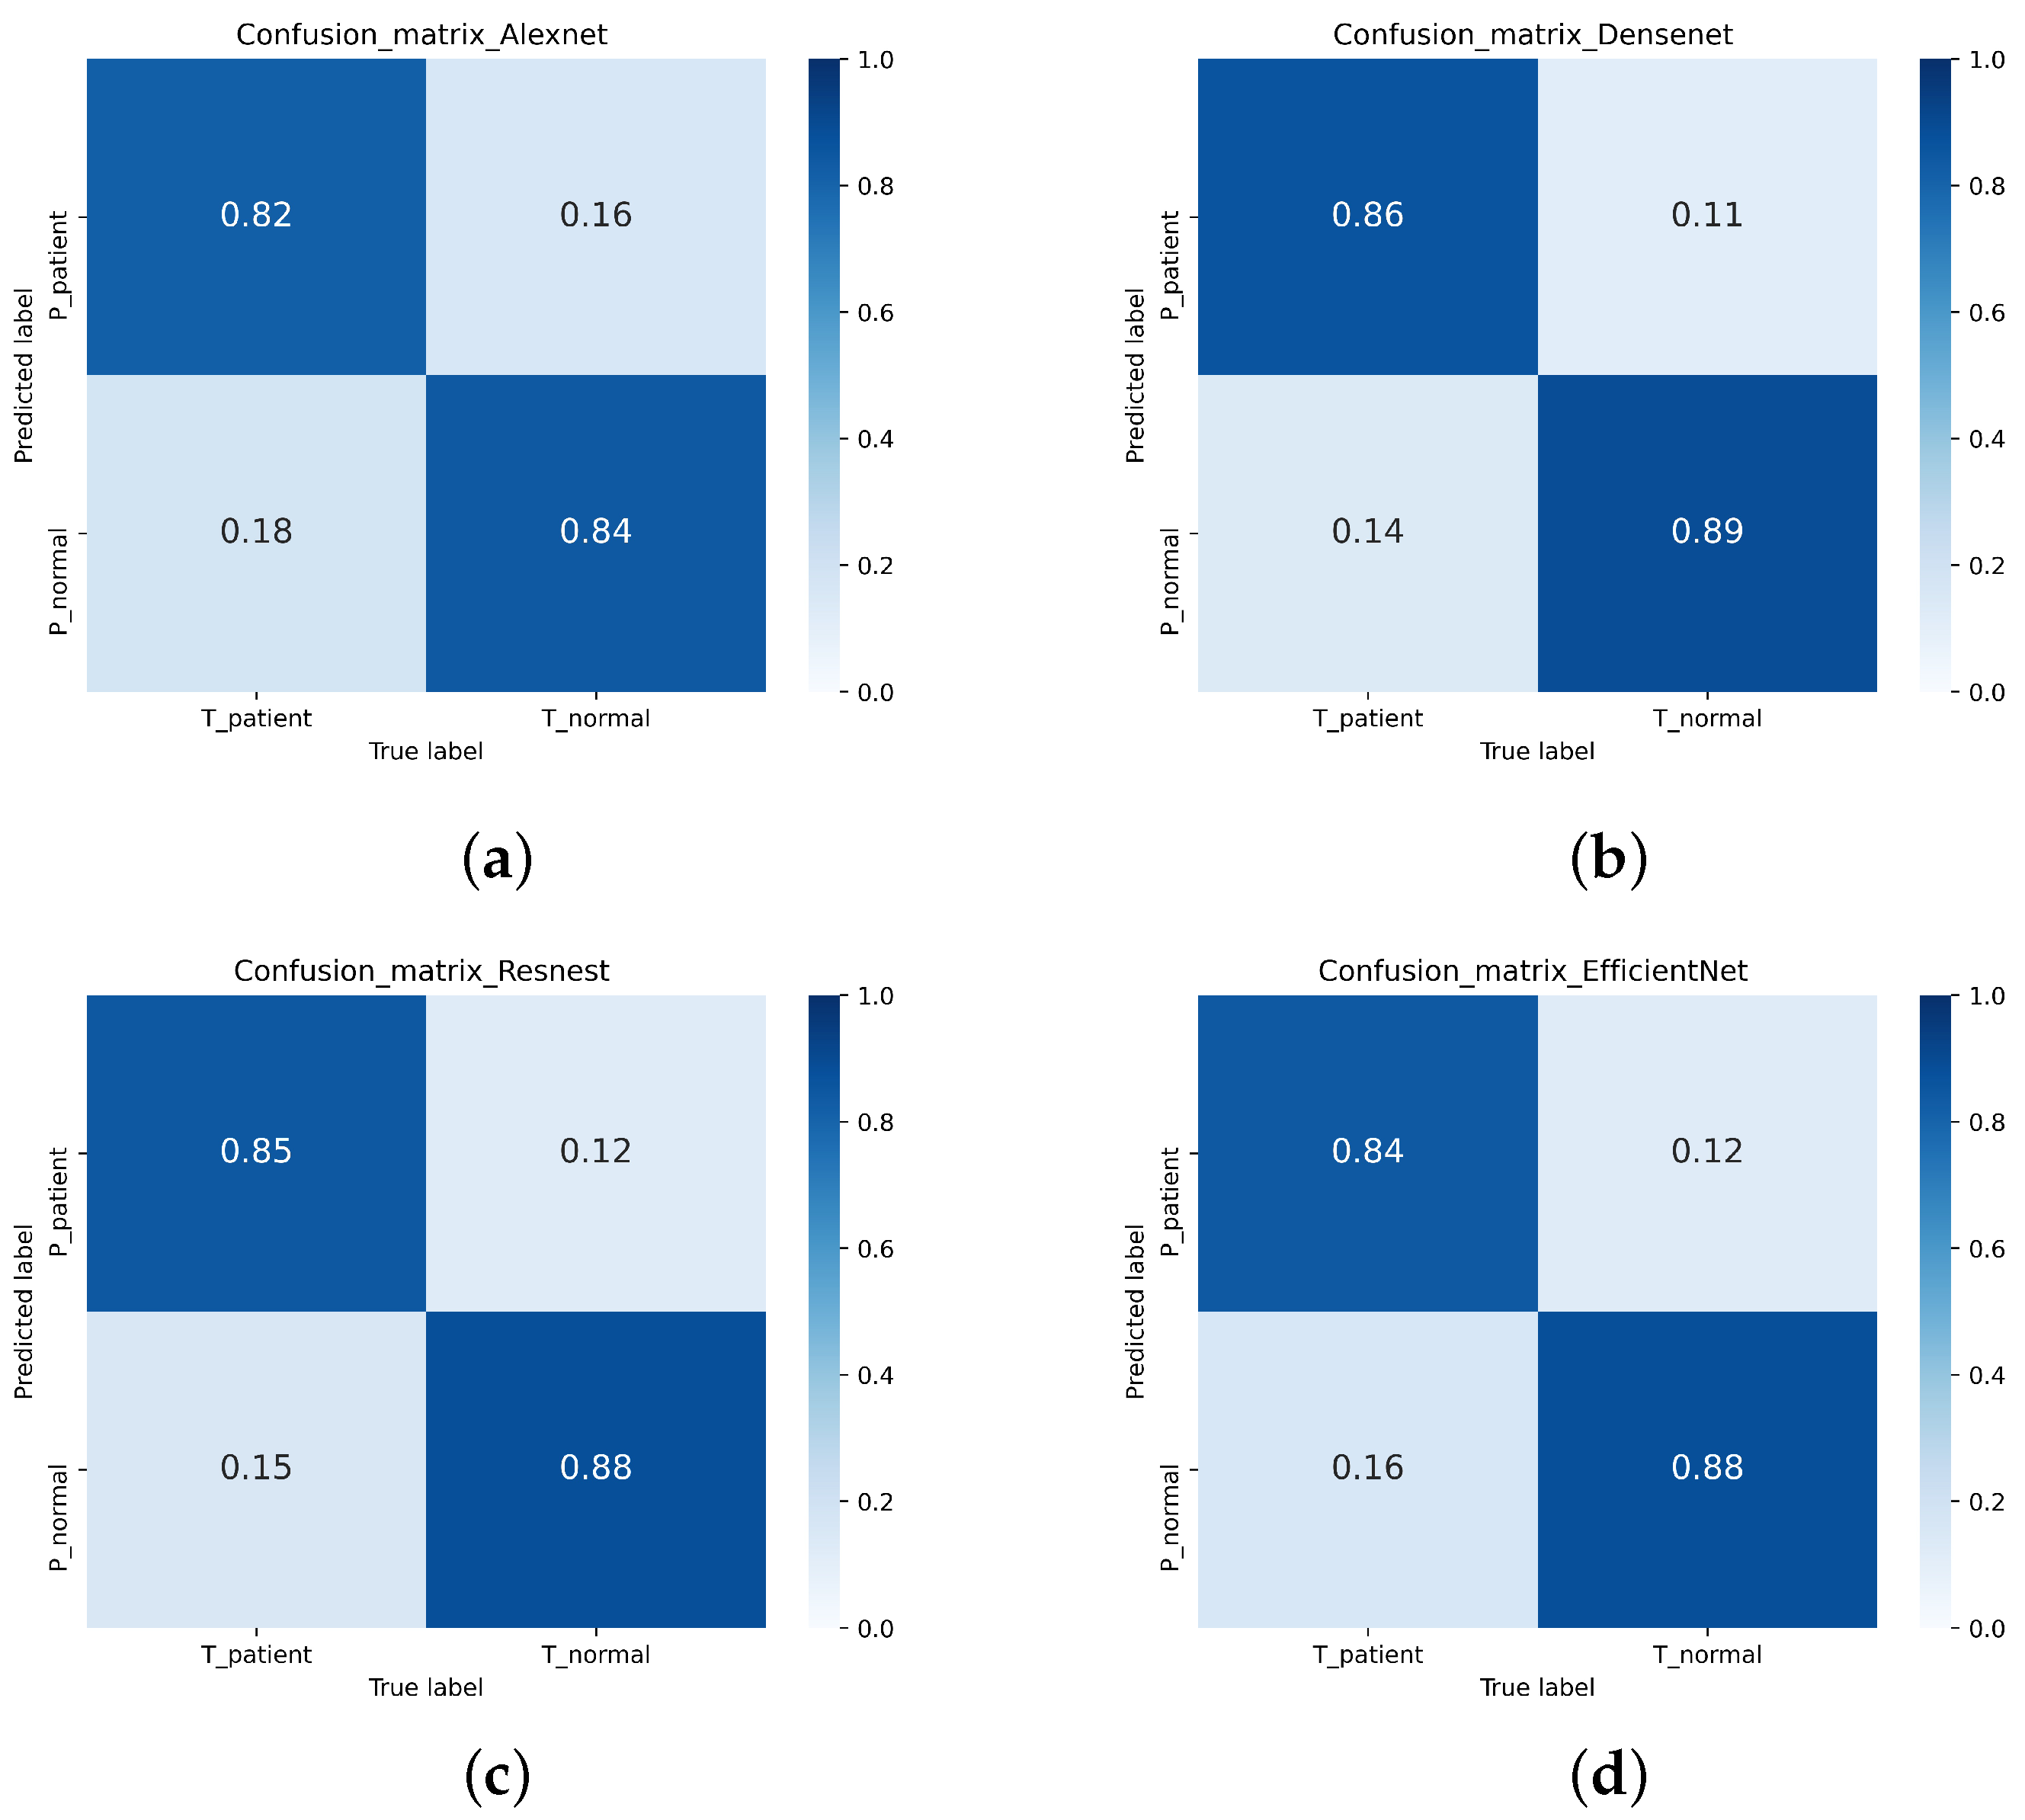
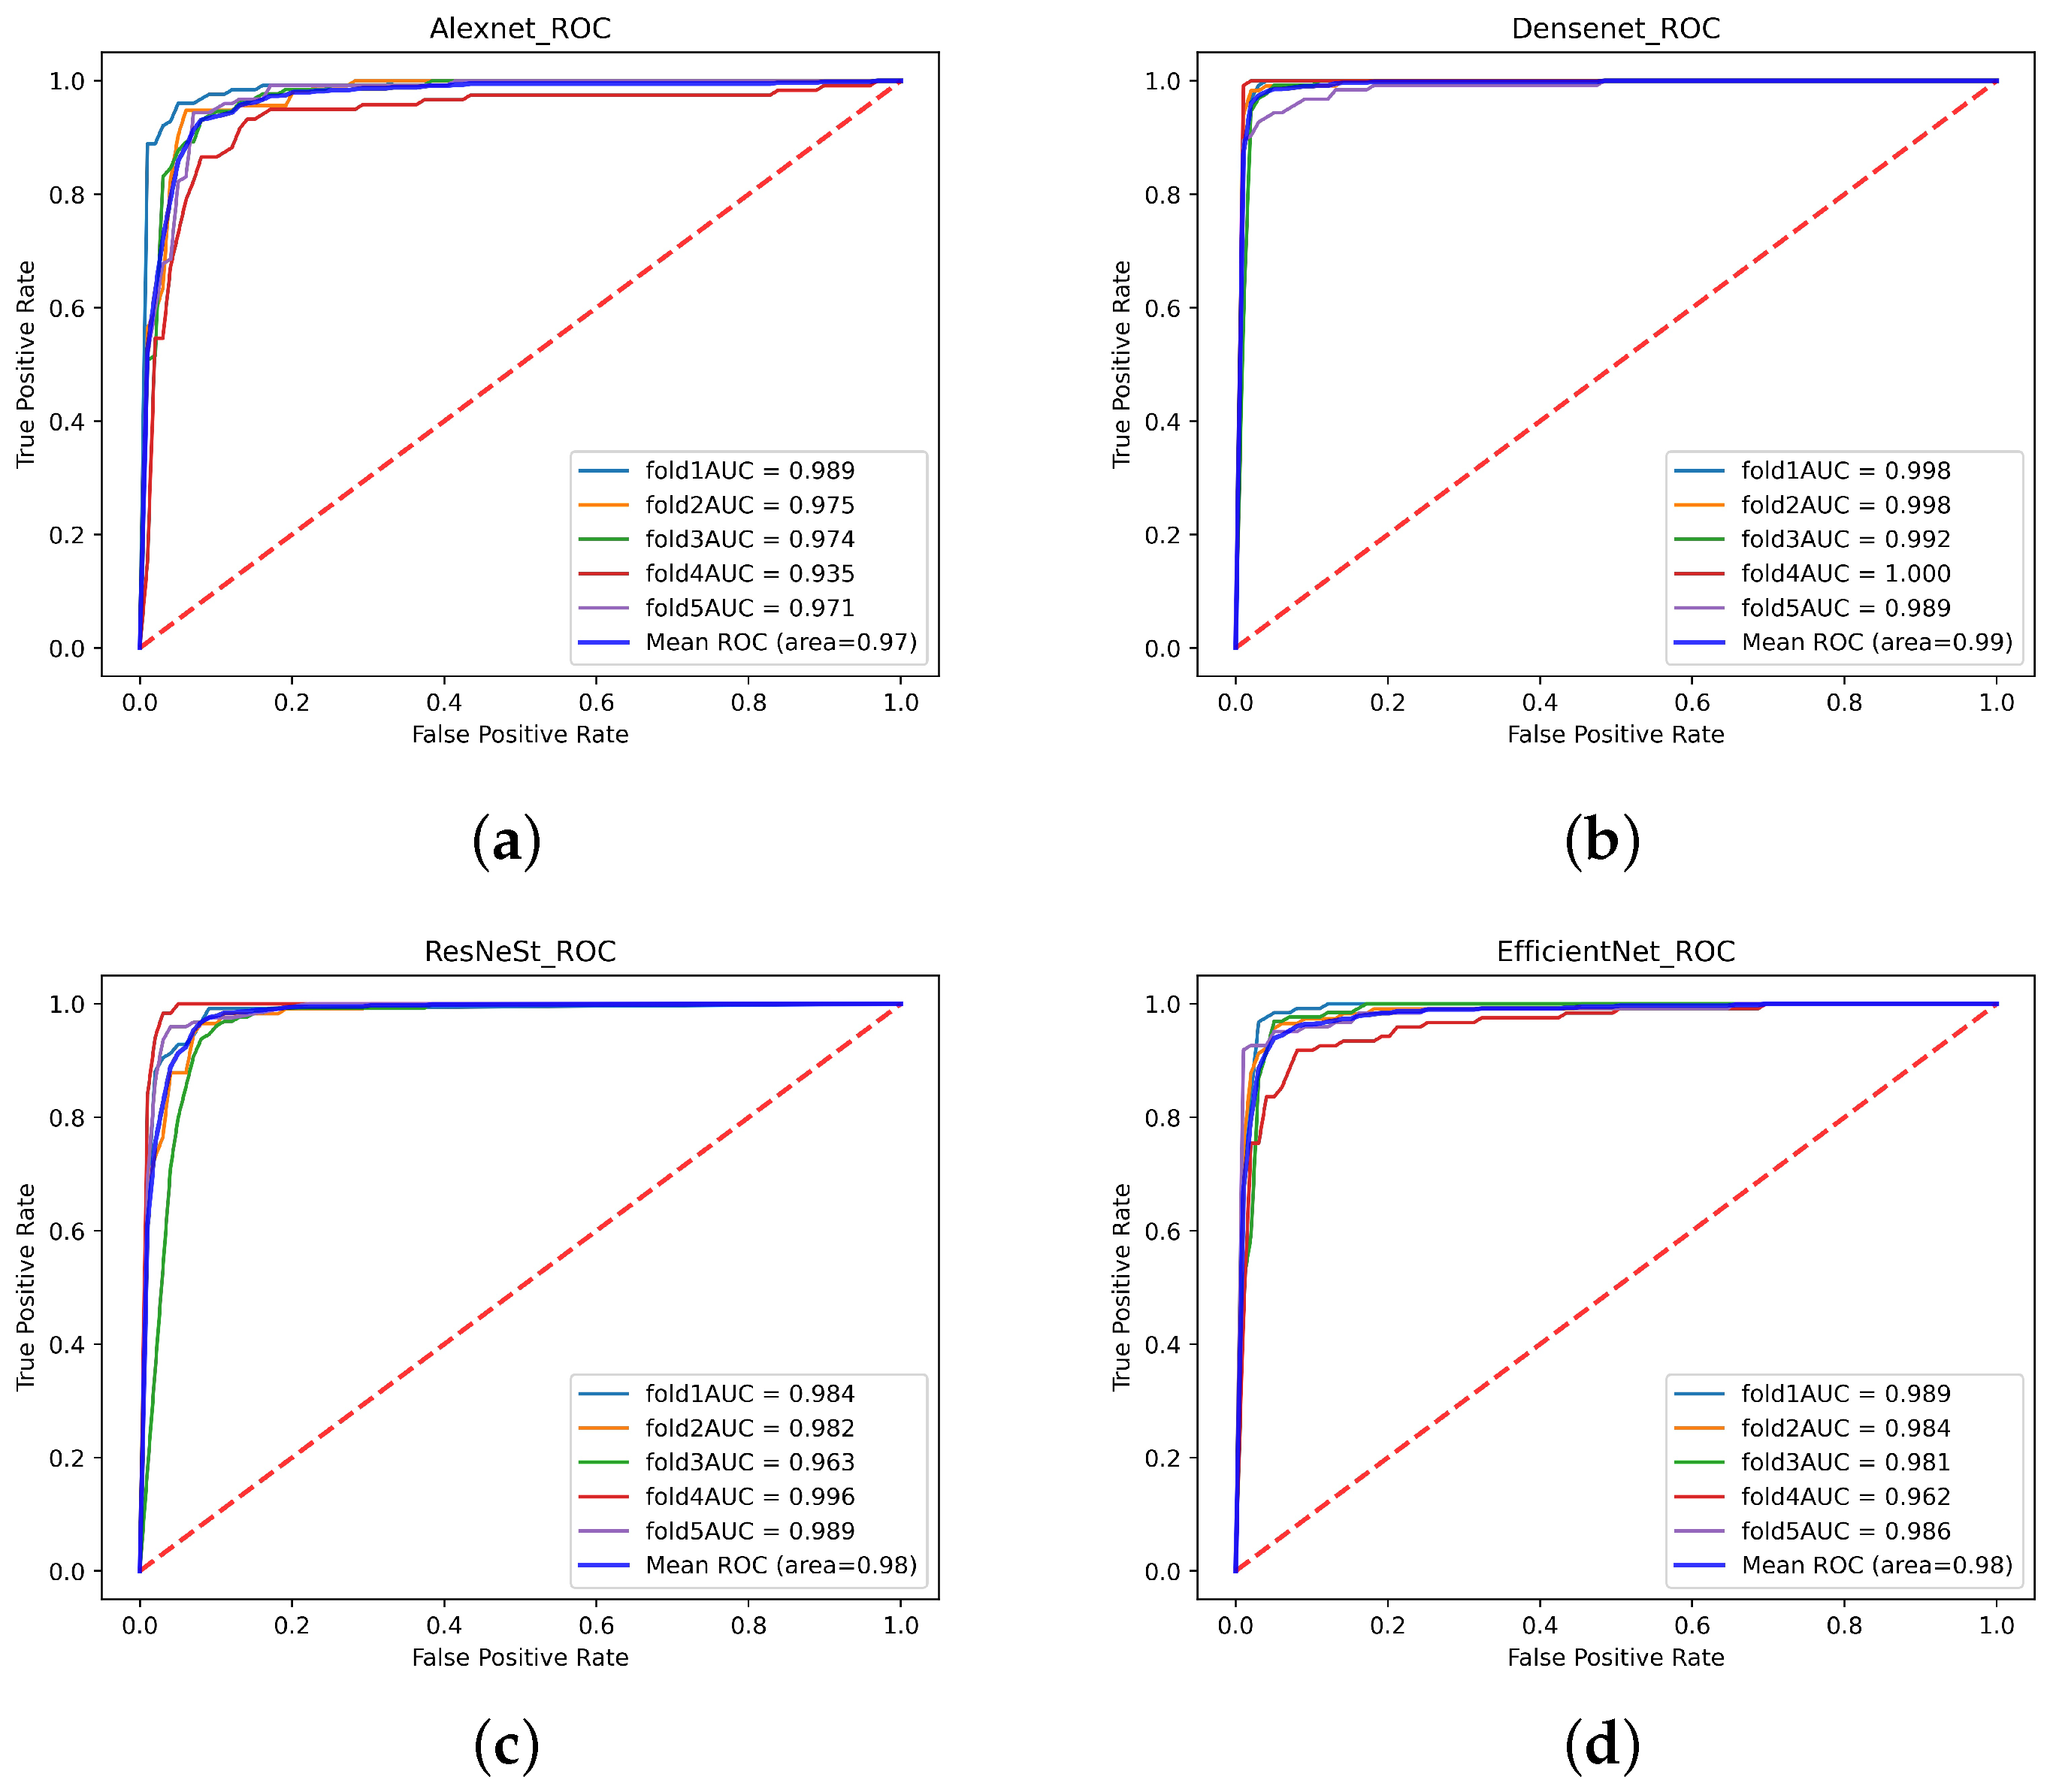
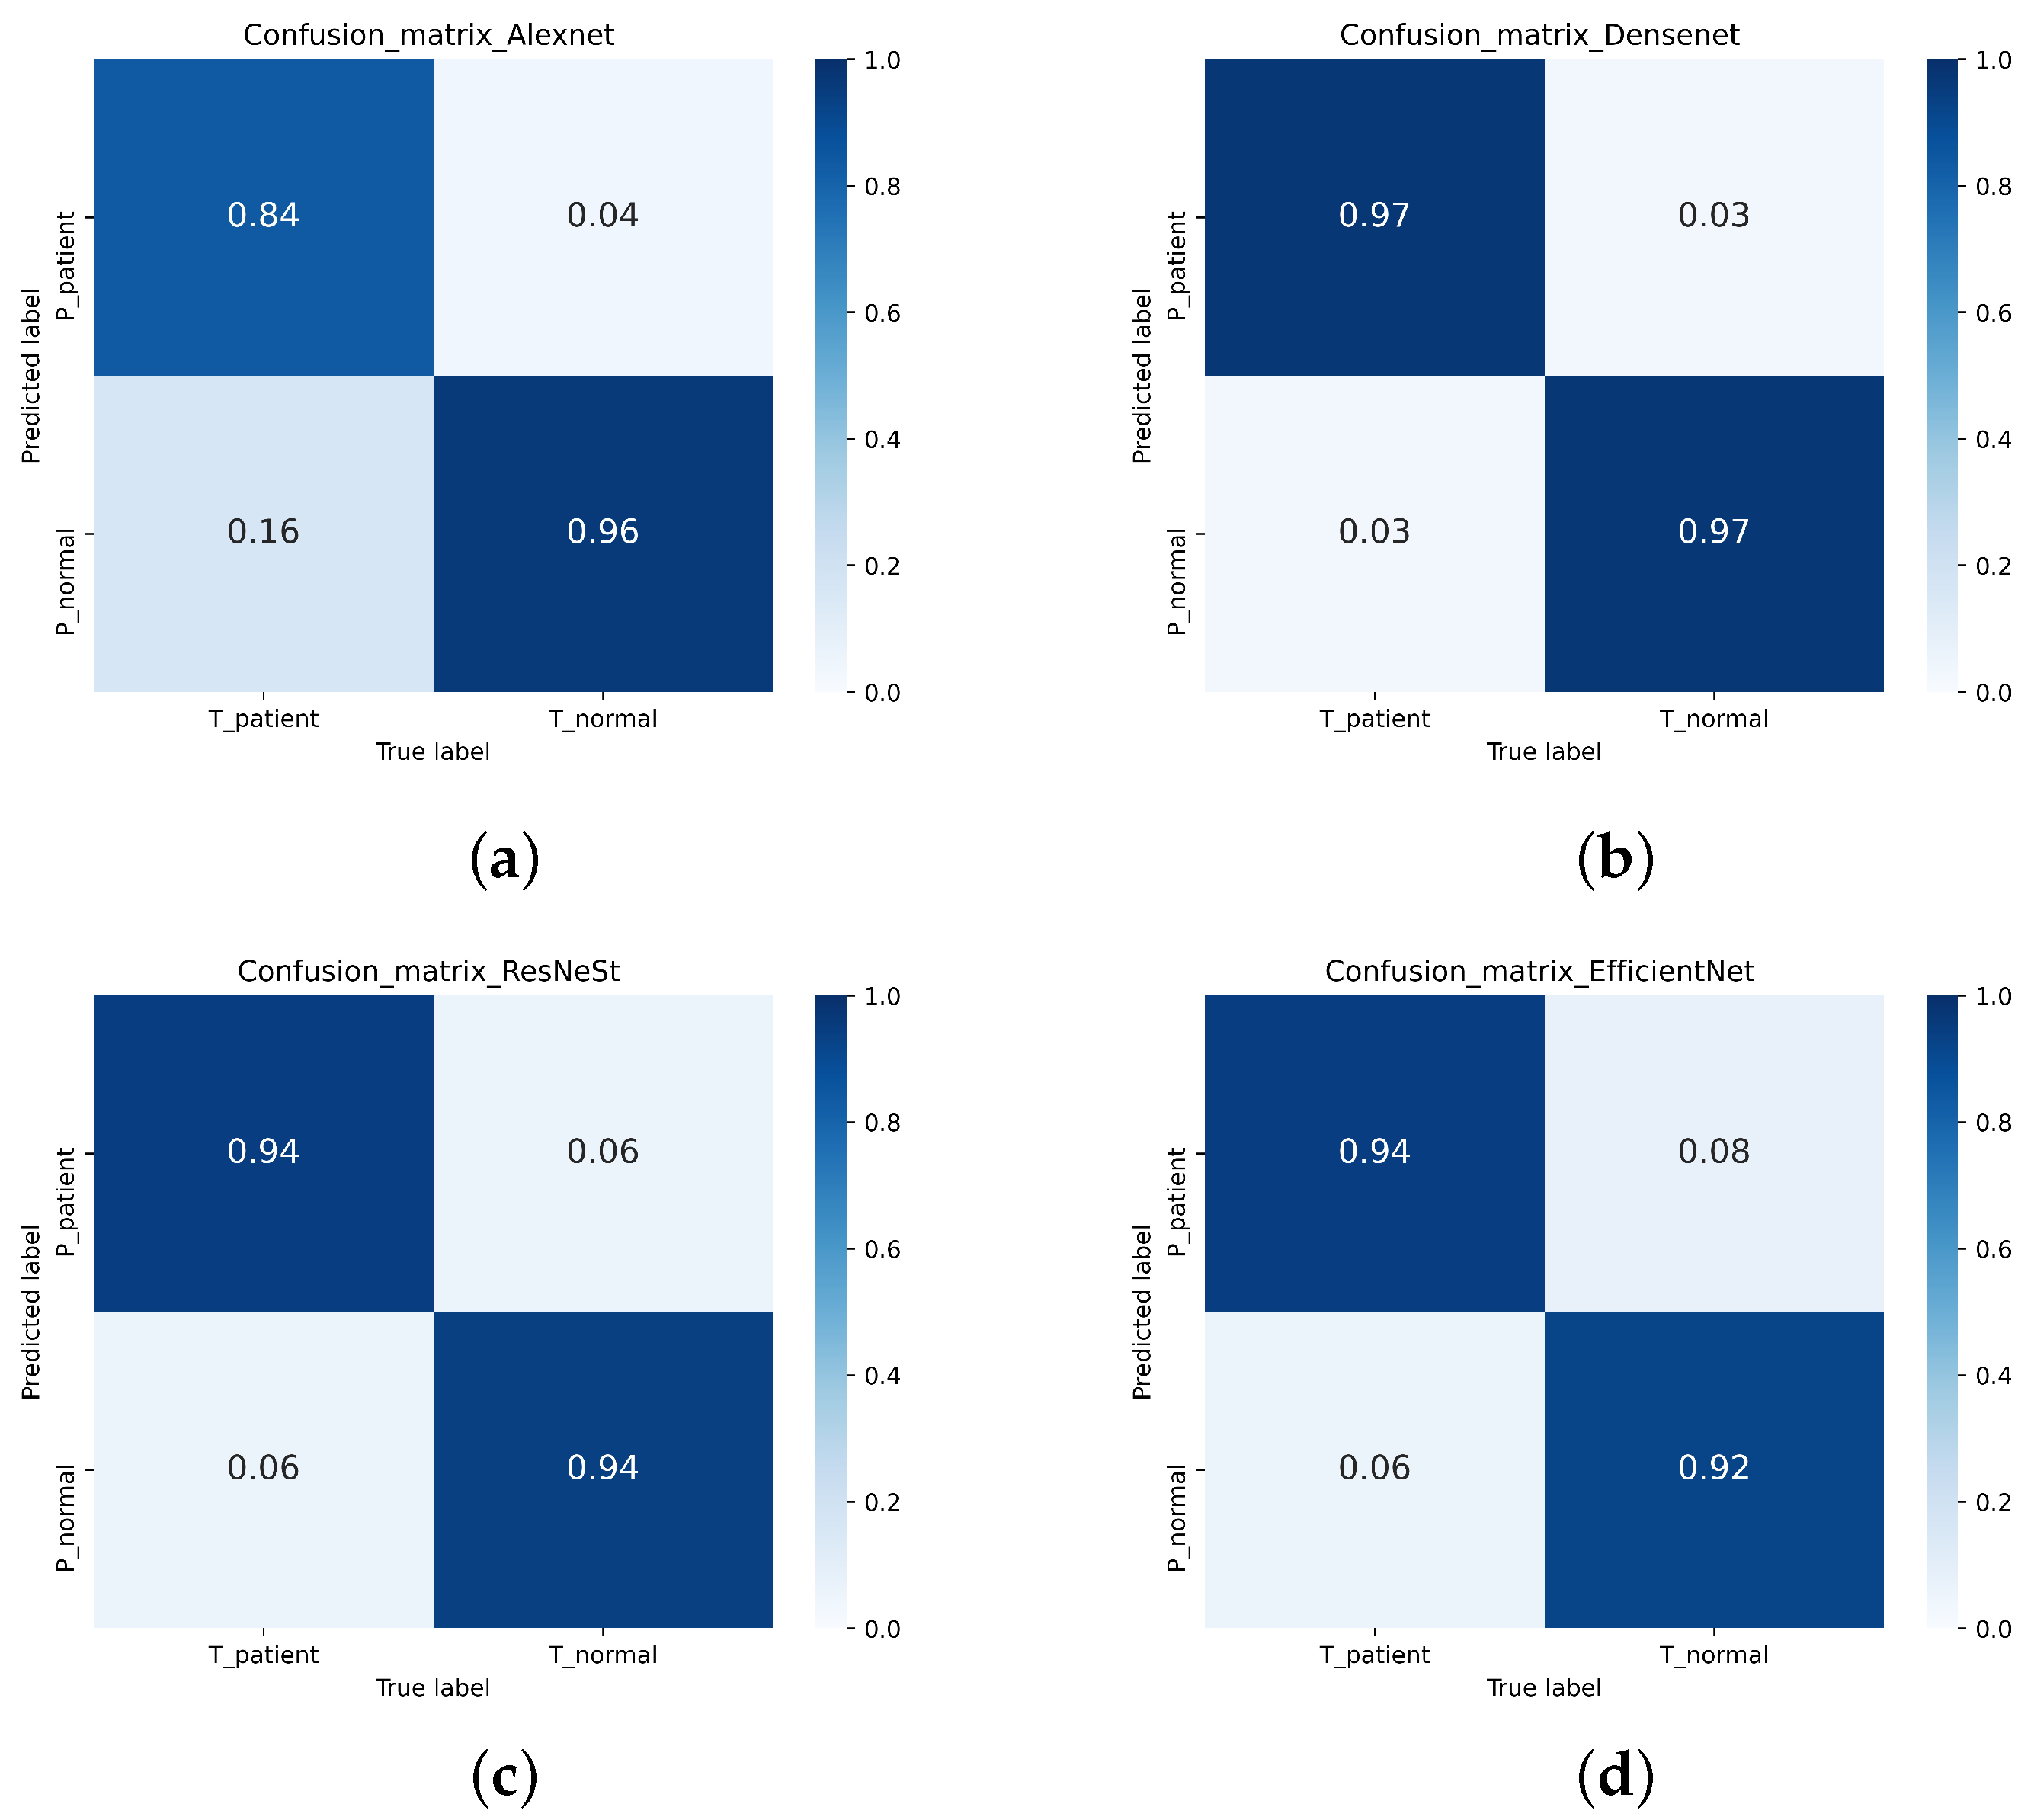
3.2. Image Classification
4. Conclusions
Author Contributions
Funding
Institutional Review Board Statement
Informed Consent Statement
Data Availability Statement
Acknowledgments
Conflicts of Interest
References
- Dai, Y.; Tang, Z.; Wang, Y. Data Driven Intelligent Diagnostics for Parkinson’s Disease. IEEE Access 2019, 7, 106941–106950. [Google Scholar] [CrossRef]
- Yin, D.; Zhao, Y.; Wang, Y.; Zhao, W.; Hu, X. Auxiliary diagnosis of heterogeneous data of Parkinson’s disease based on improved convolution neural network. Multimed. Tools Appl. 2020, 79, 24199–24224. [Google Scholar] [CrossRef]
- Wang, W.; Lee, J.; Harrou, F.; Sun, Y. Early Detection of Parkinson’s Disease Using Deep Learning and Machine Learning. IEEE Access 2020, 8, 147635–147646. [Google Scholar] [CrossRef]
- Sivaranjini, S.; Sujatha, C.M. Deep learning based diagnosis of Parkinson’s disease using convolutional neural network. Multimed. Tools Appl. 2019, 79, 15467–15479. [Google Scholar] [CrossRef]
- Oh, B.H.; Moon, H.C.; Kim, A.; Kim, H.J.; Cheong, C.J.; Park, Y.S. Prefrontal and hippocampal atrophy using 7-tesla magnetic resonance imaging in patients with Parkinson’s disease. Acta Radiol. Open 2021, 10, 2058460120988097. [Google Scholar] [CrossRef] [PubMed]
- Solana-Lavalle, G.; Rosas-Romero, R. Classification of PPMI MRI scans with voxel-based morphometry and machine learning to assist in the diagnosis of Parkinson’s disease. Comput. Methods Programs Biomed. 2020, 198, 105793. [Google Scholar] [CrossRef]
- Postuma, R.B.; Berg, D.; Adler, C.H.; Bloem, B.R.; Chan, P.; Deuschl, G.; Gasser, T.; Goetz, C.G.; Halliday, G.; Joseph, L.; et al. The new definition and diagnostic criteria of Parkinson’s disease. Lancet Neurol. 2016, 15, 546–548. [Google Scholar] [CrossRef] [Green Version]
- Dai, Y.; Tao, Z.; Wang, Y.; Zhao, Y.; Hou, J. The Research of Multi-Modality Parkinson’s Disease Image Based on Cross-Layer Convolutional Neural Network. J. Med. Imaging Health Inform. 2019, 9, 1440–1447. [Google Scholar] [CrossRef]
- Tolosa, E.; Wenning, G.; Poewe, W. The diagnosis of Parkinson’s disease. Neurol. Sci. 2006, 5, 75–86. [Google Scholar] [CrossRef]
- Rizzo, G.; Copetti, M.; Arcuti, S.; Martino, D.; Fontana, A.; Logroscino, G. Accuracy of clinical diagnosis of Parkinson disease: A systematic review and meta-analysis. Neurology 2016, 86, 566–576. [Google Scholar] [CrossRef]
- Pyatigorskaya, N.; Gallea, C.; Garcia-Lorenzo, D.; Vidailhet, M.; Lehericy, S. A review of the use of magnetic resonance imaging in Parkinson’s disease. Ther. Adv. Neurol. Disord. 2014, 7, 206–220. [Google Scholar] [CrossRef] [PubMed] [Green Version]
- Heim, B.; Krismer, F.; De Marzi, R.; Seppi, K. Magnetic resonance imaging for the diagnosis of Parkinson’s disease. J. Neural Transm. 2017, 124, 915–964. [Google Scholar] [CrossRef] [PubMed]
- Rojas, G.M.; Raff, U.; Quintana, J.C.; Huete, I.; Hutchinson, M. Image fusion in neuroradiology: Three clinical examples including MRI of Parkinson disease. Comput. Med. Imaging Graph. 2007, 31, 17–27. [Google Scholar] [CrossRef]
- Soltaninejad, S.; Xu, P.; Cheng, I. Parkinson’s Disease Mid-Brain Assessment using MR T2 Images. In Proceedings of the 2019 IEEE 19th International Conference on Bioinformatics and Bioengineering (BIBE), Athens, Greece, 28–30 October 2019. [Google Scholar]
- Yang, B.; Jing, Z.L.; Zhao, H.T. Review of Pixel-Level Image Fusion. J. Shanghai Jiaotong Univ. (Sci.) 2010, 15, 6–12. [Google Scholar] [CrossRef]
- Li, S.; Kang, X.; Fang, L.; Hu, J.; Yin, H. Pixel-level image fusion: A survey of the state of the art. Inf. Fusion 2017, 33, 100–112. [Google Scholar] [CrossRef]
- Choudhary, M.S.; Gupta, P.V.; Kshirsagar, M.Y. Application of Statical Image Fusion in Medical Image Fusion. Int. J. Enhanc. Res. Sci. Technol. Eng. 2013, 2. Available online: http://citeseerx.ist.psu.edu/viewdoc/download?doi=10.1.1.379.1070&rep=rep1&type=pdf (accessed on 20 March 2021).
- De Casso, C.; Visvanathan, V.; Soni-Jaiswall, A.; Kane, T.; Nigam, A. Predictive value of positron emission tomography-computed tomography image fusion in the diagnosis of head and neck cancer: Does it really improve staging and management? J. Laryngol. Otol. 2012, 126, 295–301. [Google Scholar] [CrossRef]
- Yang, R.; Lu, H.; Wang, Y.; Peng, X.; Mao, C.; Yi, Z.; Guo, Y.; Guo, C. CT-MRI Image Fusion-Based Computer-Assisted Navigation Management of Communicative Tumors Involved the Infratemporal-Middle Cranial Fossa. J. Neurol. Surg. Part B Skull Base 2020, 82 (Suppl. 3), e321–e329. [Google Scholar] [CrossRef]
- Bi, L.; Fulham, M.; Li, N.; Liu, Q.; Song, S.; Feng, D.D.; Kim, J. Recurrent feature fusion learning for multi-modality pet-ct tumor segmentation. Comput. Methods Programs Biomed. 2021, 203, 106043. [Google Scholar] [CrossRef]
- Omar, Z.; Stathaki, T. Image Fusion: An Overview. In Proceedings of the 2014 5th International Conference on Intelligent Systems, Modelling and Simulation (ISMS), Langkawi, Malaysia, 27–29 January 2014. [Google Scholar]
- Bhataria, K.C.; Shah, B.K. A Review of Image Fusion Techniques. In Proceedings of the 2018 Second International Conference on Computing Methodologies and Communication (ICCMC), Erode, India, 15–16 February 2018. [Google Scholar]
- Vora, P.D.; Chudasama, M.N. Different Image Fusion Techniques and Parameters: A Review. Int. J. Comput. Sci. Inf. Technol. 2015, 6, 889–892. [Google Scholar]
- Dulhare, U.; Khaled, A.M.; Ali, M.H. A Review on Diversified Mechanisms for Multi Focus Image Fusion; Social Science Electronic Publishing: Rochester, NY, USA, 2019. [Google Scholar]
- Kolekar, M.N.B.; Shelkikar, P.R.P. A Review on Wavelet Transform Based Image Fusion and Classification. Int. J. Appl. Innov. Eng. Manag. 2016, 5, 111–115. [Google Scholar]
- Liu, Y.; Chen, X.; Wang, Z.; Wang, Z.J.; Ward, R.K.; Wang, X. Deep learning for pixel-level image fusion: Recent advances and future prospects. Inf. Fusion 2018, 42, 158–173. [Google Scholar] [CrossRef]
- Liu, Y.; Chen, X.; Peng, H.; Wang, Z. Multi-focus image fusion with a deep convolutional neural network. Inf. Fusion 2017, 36, 191–207. [Google Scholar] [CrossRef]
- Al-Radaideh, A.M.; Rababah, E.M. The role of magnetic resonance imaging in the diagnosis of Parkinson’s disease: A review. Clin. Imaging 2016, 40, 987–996. [Google Scholar] [CrossRef]
- Varanese, S.; Birnbaum, Z.; Rossi, R.; Di Rocco, A. Treatment of Advanced Parkinson’s Disease. Park. Dis. 2010, 2010, 480260. [Google Scholar] [CrossRef] [Green Version]
- Hasford, F. Ultrasound and PET-CT Image Fusion for Prostate Brachytherapy Image Guidance. Ph.D. Thesis, University of Ghana, Accra, Ghana, 2015; pp. 87–115. [Google Scholar]
- Veronica, B. An effective neural network model for lung nodule detection in CT images with optimal fuzzy model. Multimed. Tools Appl. 2020, 79, 14291–14311. [Google Scholar] [CrossRef]
- Kadam, P.; Pawar, S.N. Brain Tumor Segmentation and It’s Features Extraction by using T2 Weighted Brain MRI. Int. J. Adv. Res. Comput. Commun. Eng. 2016, 5. [Google Scholar] [CrossRef]
- Nakamoto, Y. Clinical application of FDG-PET for cancer diagnosis. Nihon Igaku HōShasen Gakkai Zasshi Nippon. Acta Radiol. 2003, 63, 285–293. [Google Scholar] [PubMed]
- Ardekani, B.A.; Braun, M.; Hutton, B.F.; Kanno, I.; Iida, H. A Fully Automatic Multimodality Image Registration Algorithm. J. Comput. Assist. Tomogr. 1995, 19, 615–623. [Google Scholar] [CrossRef]
- Huang, G.; Liu, Z.; Van Der Maaten, L. Weinberger, K.Q. Densely Connected Convolutional Networks. IEEE Comput. Soc. 2017, 2261–2269. [Google Scholar]
- Tan, M.; Le, Q.V. Efficientnet: Rethinking Model Scaling for Convolutional Neural Networks. In International Conference on Machine Learning; PMLR: London, UK, 2019. [Google Scholar]
- Tan, M.; Chen, B.; Pang, R.; Vasudevan, V.; Sandler, M.; Howard, A.; Le, Q.V. MnasNet: Platform-Aware Neural Architecture Search for Mobile. arXiv 2018, arXiv:1807.11626. [Google Scholar]
- Zhang, H.; Wu, C.; Zhang, Z.; Zhu, Y.; Lin, H.; Zhang, Z.; Sun, Y.; He, T.; Mueller, J.; Manmatha, R.; et al. ResNeSt: Split-Attention Networks. arXiv 2020, arXiv:2004.08955. [Google Scholar]
- Rodriguez, J.D.; Perez, A.; Lozano, J.A. Sensitivity Analysis of k-Fold Cross Validation in Prediction Error Estimation. IEEE Trans. Pattern Anal. Mach. Intell. 2010, 32, 569–575. [Google Scholar] [CrossRef]
- Liu, Y.; Liu, S.; Wang, Z. A general framework for image fusion based on multi-scale transform and sparse representation. Inf. Fusion 2015, 24, 147–164. [Google Scholar] [CrossRef]
- Han, Y.Y.; Zhang, J.J.; Chang, B.K.; Yuan, Y.H.; Xu, H. Fused Image Quality Measure Based on Structural Similarity. Adv. Mater. Res. 2011, 255–260, 2072–2076. [Google Scholar] [CrossRef]
- Zhao, F.; Zhao, W.; Yao, L.; Liu, Y. Self-supervised feature adaption for infrared and visible image fusion. Inf. Fusion 2021, 2021, 76. [Google Scholar] [CrossRef]
- Xu, H.; Ma, J.; Jiang, J.; Guo, X.; Ling, H. U2Fusion: A Unified Unsupervised Image Fusion Network. IEEE Trans. Pattern Anal. Mach. Intell. 2020, 502–518. [Google Scholar] [CrossRef] [PubMed]
- Deshmukh, M.; Bhosale, U. Image Fusion and Image Quality Assessment of Fused Images. Int. J. Image Process. 2010, 4, 484. [Google Scholar]


| True Patient | True Normal | |
|---|---|---|
| Predict Patient | TP | FP |
| Predict Normal | FN | TN |
| True Patient | True Normal | |
|---|---|---|
| Predict Patient | ||
| Predict Normal |
| SSIM | SF | MI | STD | CC | |
|---|---|---|---|---|---|
| LP | 0.8176 | 4.14 | 5.466 | 38.81 | 0.5825 |
| RP | 0.7883 | 4.15 | 5.431 | 37.90 | 0.6039 |
| CVT | 0.7860 | 3.96 | 5.458 | 35.64 | 0.6411 |
| NSCT | 0.7939 | 4.04 | 5.468 | 35.94 | 0.6360 |
| This paper | 0.8189 | 4.26 | 6.338 | 63.27 | 0.6350 |
| CNN | Dataset | Accuracy | Recall | Precision | Specificity | -Score |
|---|---|---|---|---|---|---|
| Alexnet | Single-modal | 83.31% | 81.87% | 81.36% | 84.95% | 81.58% |
| Multi-modal | 90.52% | 83.74% | 94.79% | 87.65% | 88.90% | |
| Efficientnet | Single-modal | 86.44% | 84.36% | 85.46% | 87.19% | 84.88% |
| Multi-modal | 93.39% | 94.43% | 91.36% | 95.45% | 92.79% | |
| ResNest | Single-modal | 86.37% | 84.60% | 85.26% | 87.29% | 84.83% |
| Multi-modal | 94.15% | 94.36% | 93.07% | 95.25% | 93.63% | |
| Densenet | Single-modal | 87.76% | 86.45% | 86.49% | 88.86% | 86.78% |
| Multi-modal | 97.19% | 97.09% | 96.79% | 97.59% | 96.91% |
Publisher’s Note: MDPI stays neutral with regard to jurisdictional claims in published maps and institutional affiliations. |
© 2021 by the authors. Licensee MDPI, Basel, Switzerland. This article is an open access article distributed under the terms and conditions of the Creative Commons Attribution (CC BY) license (https://creativecommons.org/licenses/by/4.0/).
Share and Cite
Dai, Y.; Song, Y.; Liu, W.; Bai, W.; Gao, Y.; Dong, X.; Lv, W. Multi-Focus Image Fusion Based on Convolution Neural Network for Parkinson’s Disease Image Classification. Diagnostics 2021, 11, 2379. https://doi.org/10.3390/diagnostics11122379
Dai Y, Song Y, Liu W, Bai W, Gao Y, Dong X, Lv W. Multi-Focus Image Fusion Based on Convolution Neural Network for Parkinson’s Disease Image Classification. Diagnostics. 2021; 11(12):2379. https://doi.org/10.3390/diagnostics11122379
Chicago/Turabian StyleDai, Yin, Yumeng Song, Weibin Liu, Wenhe Bai, Yifan Gao, Xinyang Dong, and Wenbo Lv. 2021. "Multi-Focus Image Fusion Based on Convolution Neural Network for Parkinson’s Disease Image Classification" Diagnostics 11, no. 12: 2379. https://doi.org/10.3390/diagnostics11122379