
Performance of Spectral Photon-Counting Coronary CT Angiography and Comparison with Energy-Integrating-Detector CT: Objective Assessment with Model Observer

 , , , ,
Abstract
:1. Introduction
2. Materials and Methods
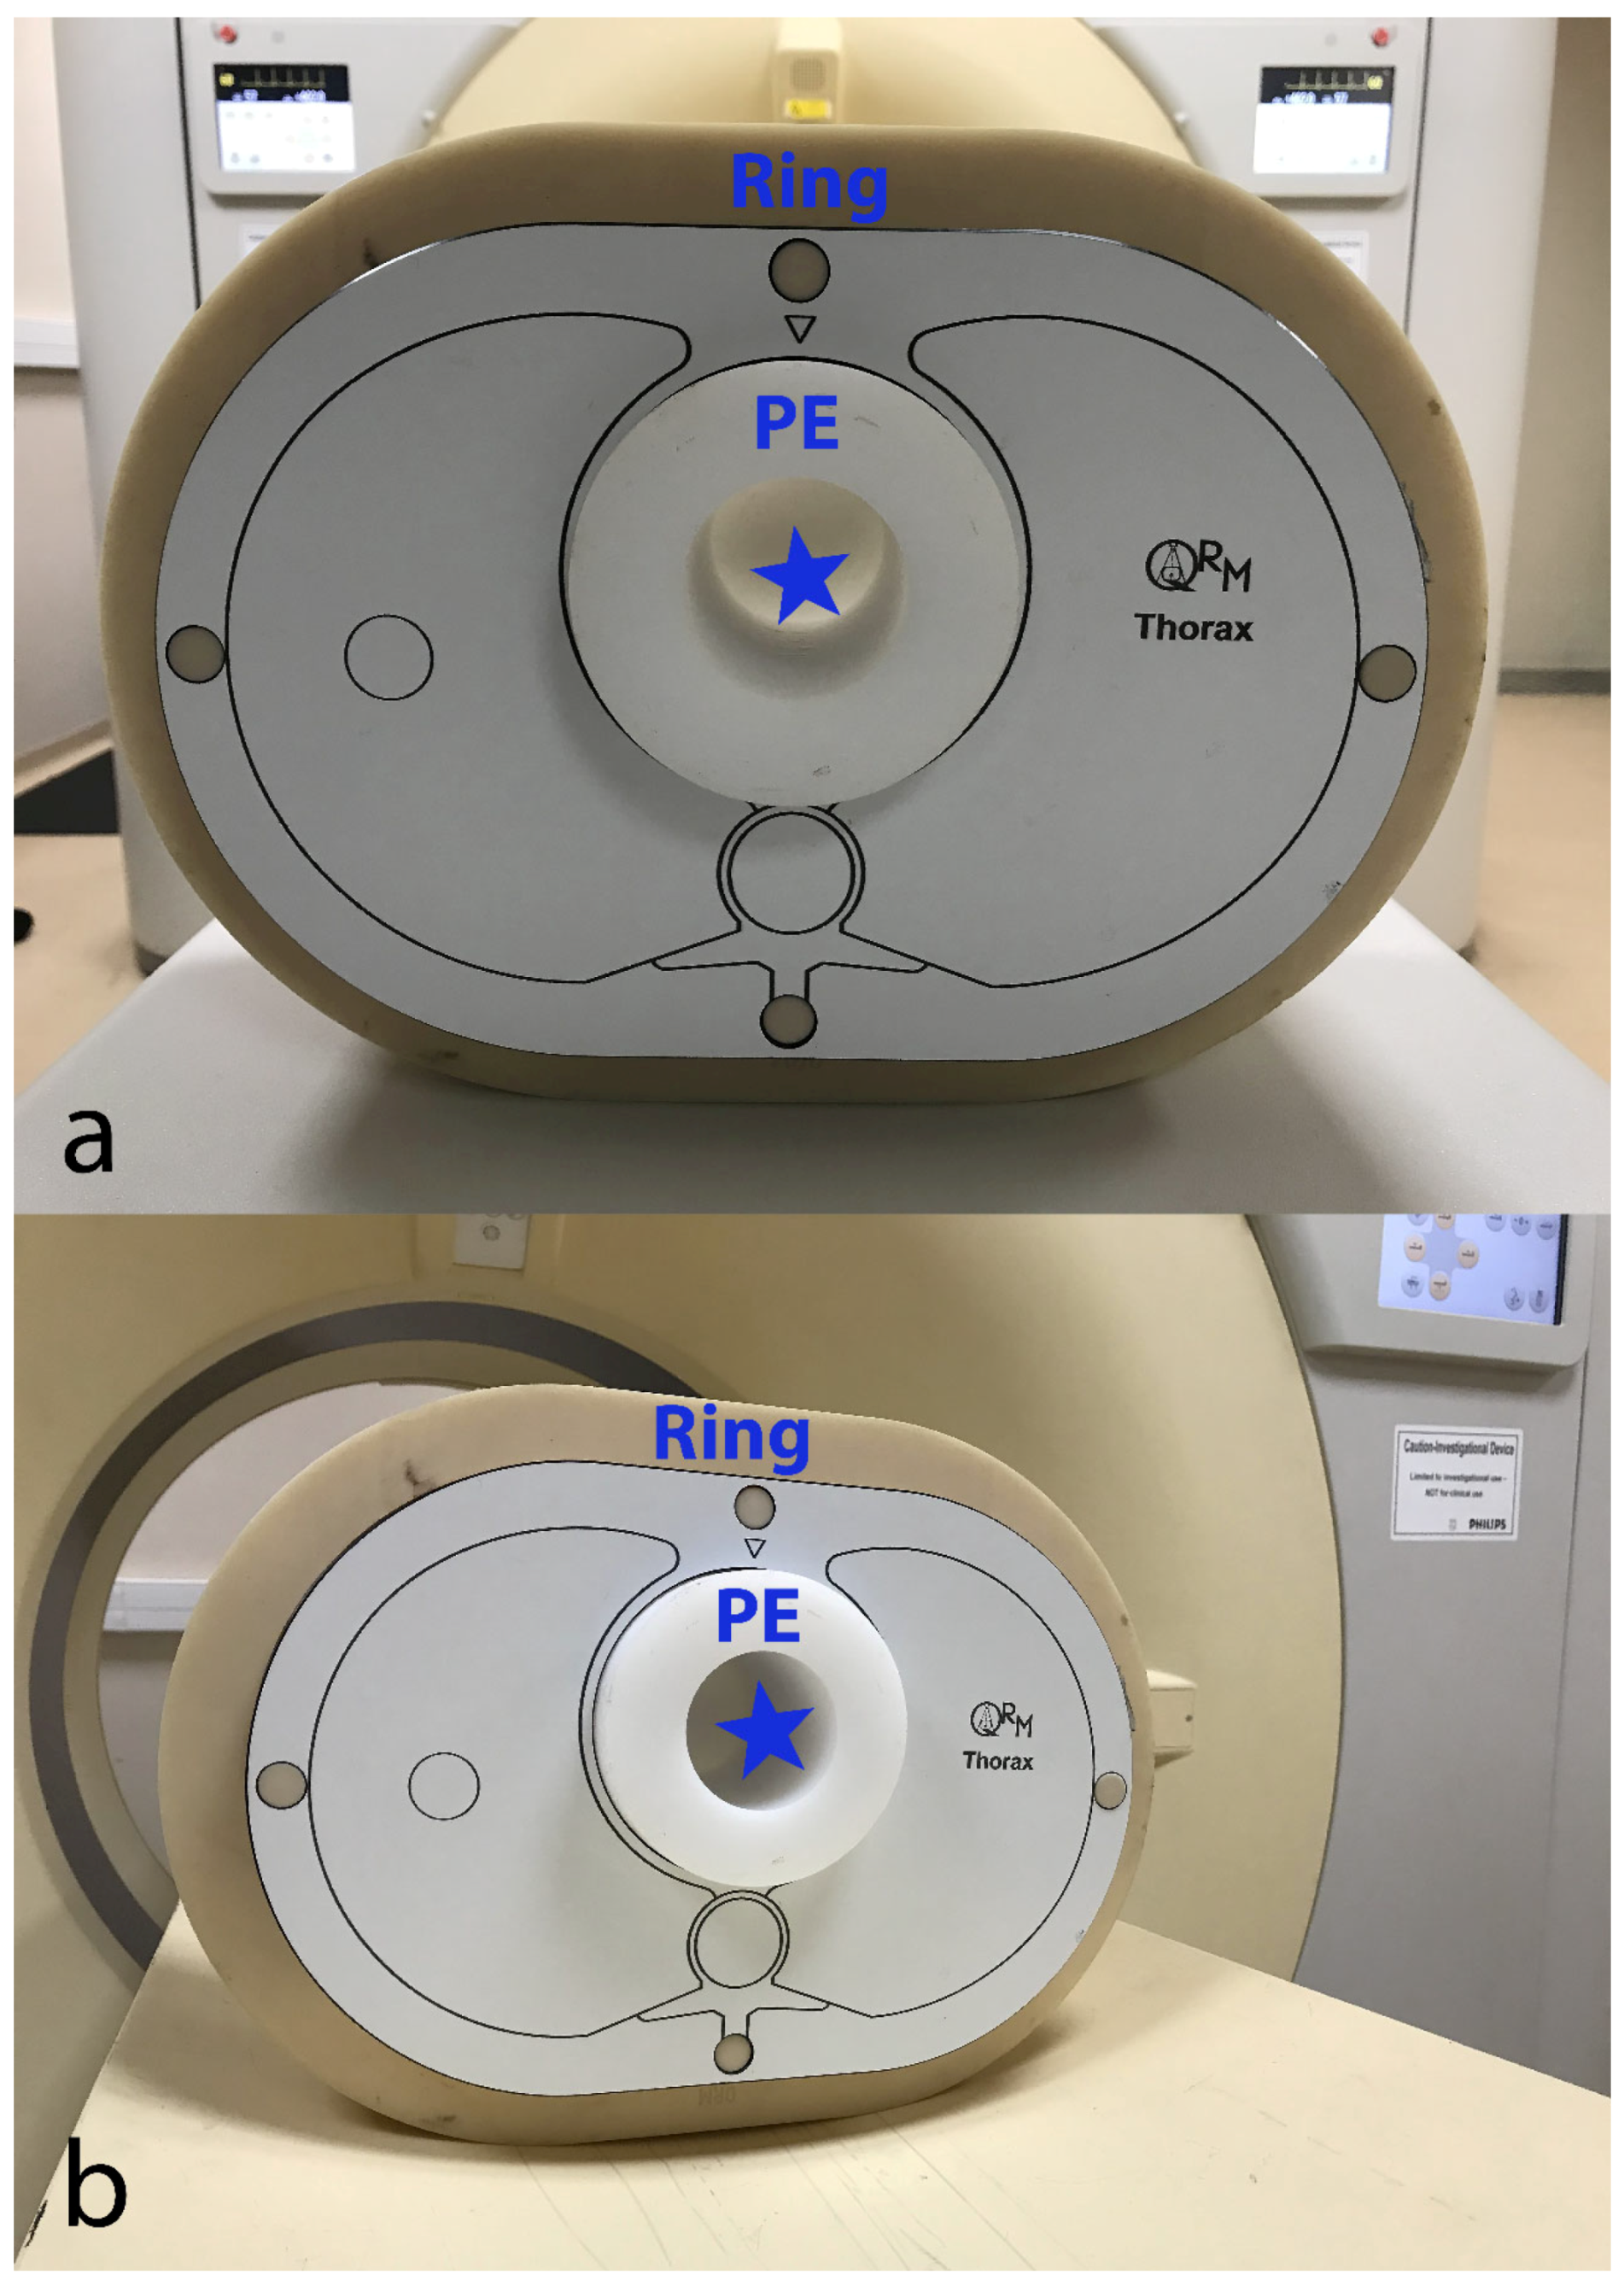
2.1. Experimental Design
2.2. Acquisition Protocol and Image Reconstruction
2.3. Image Analysis
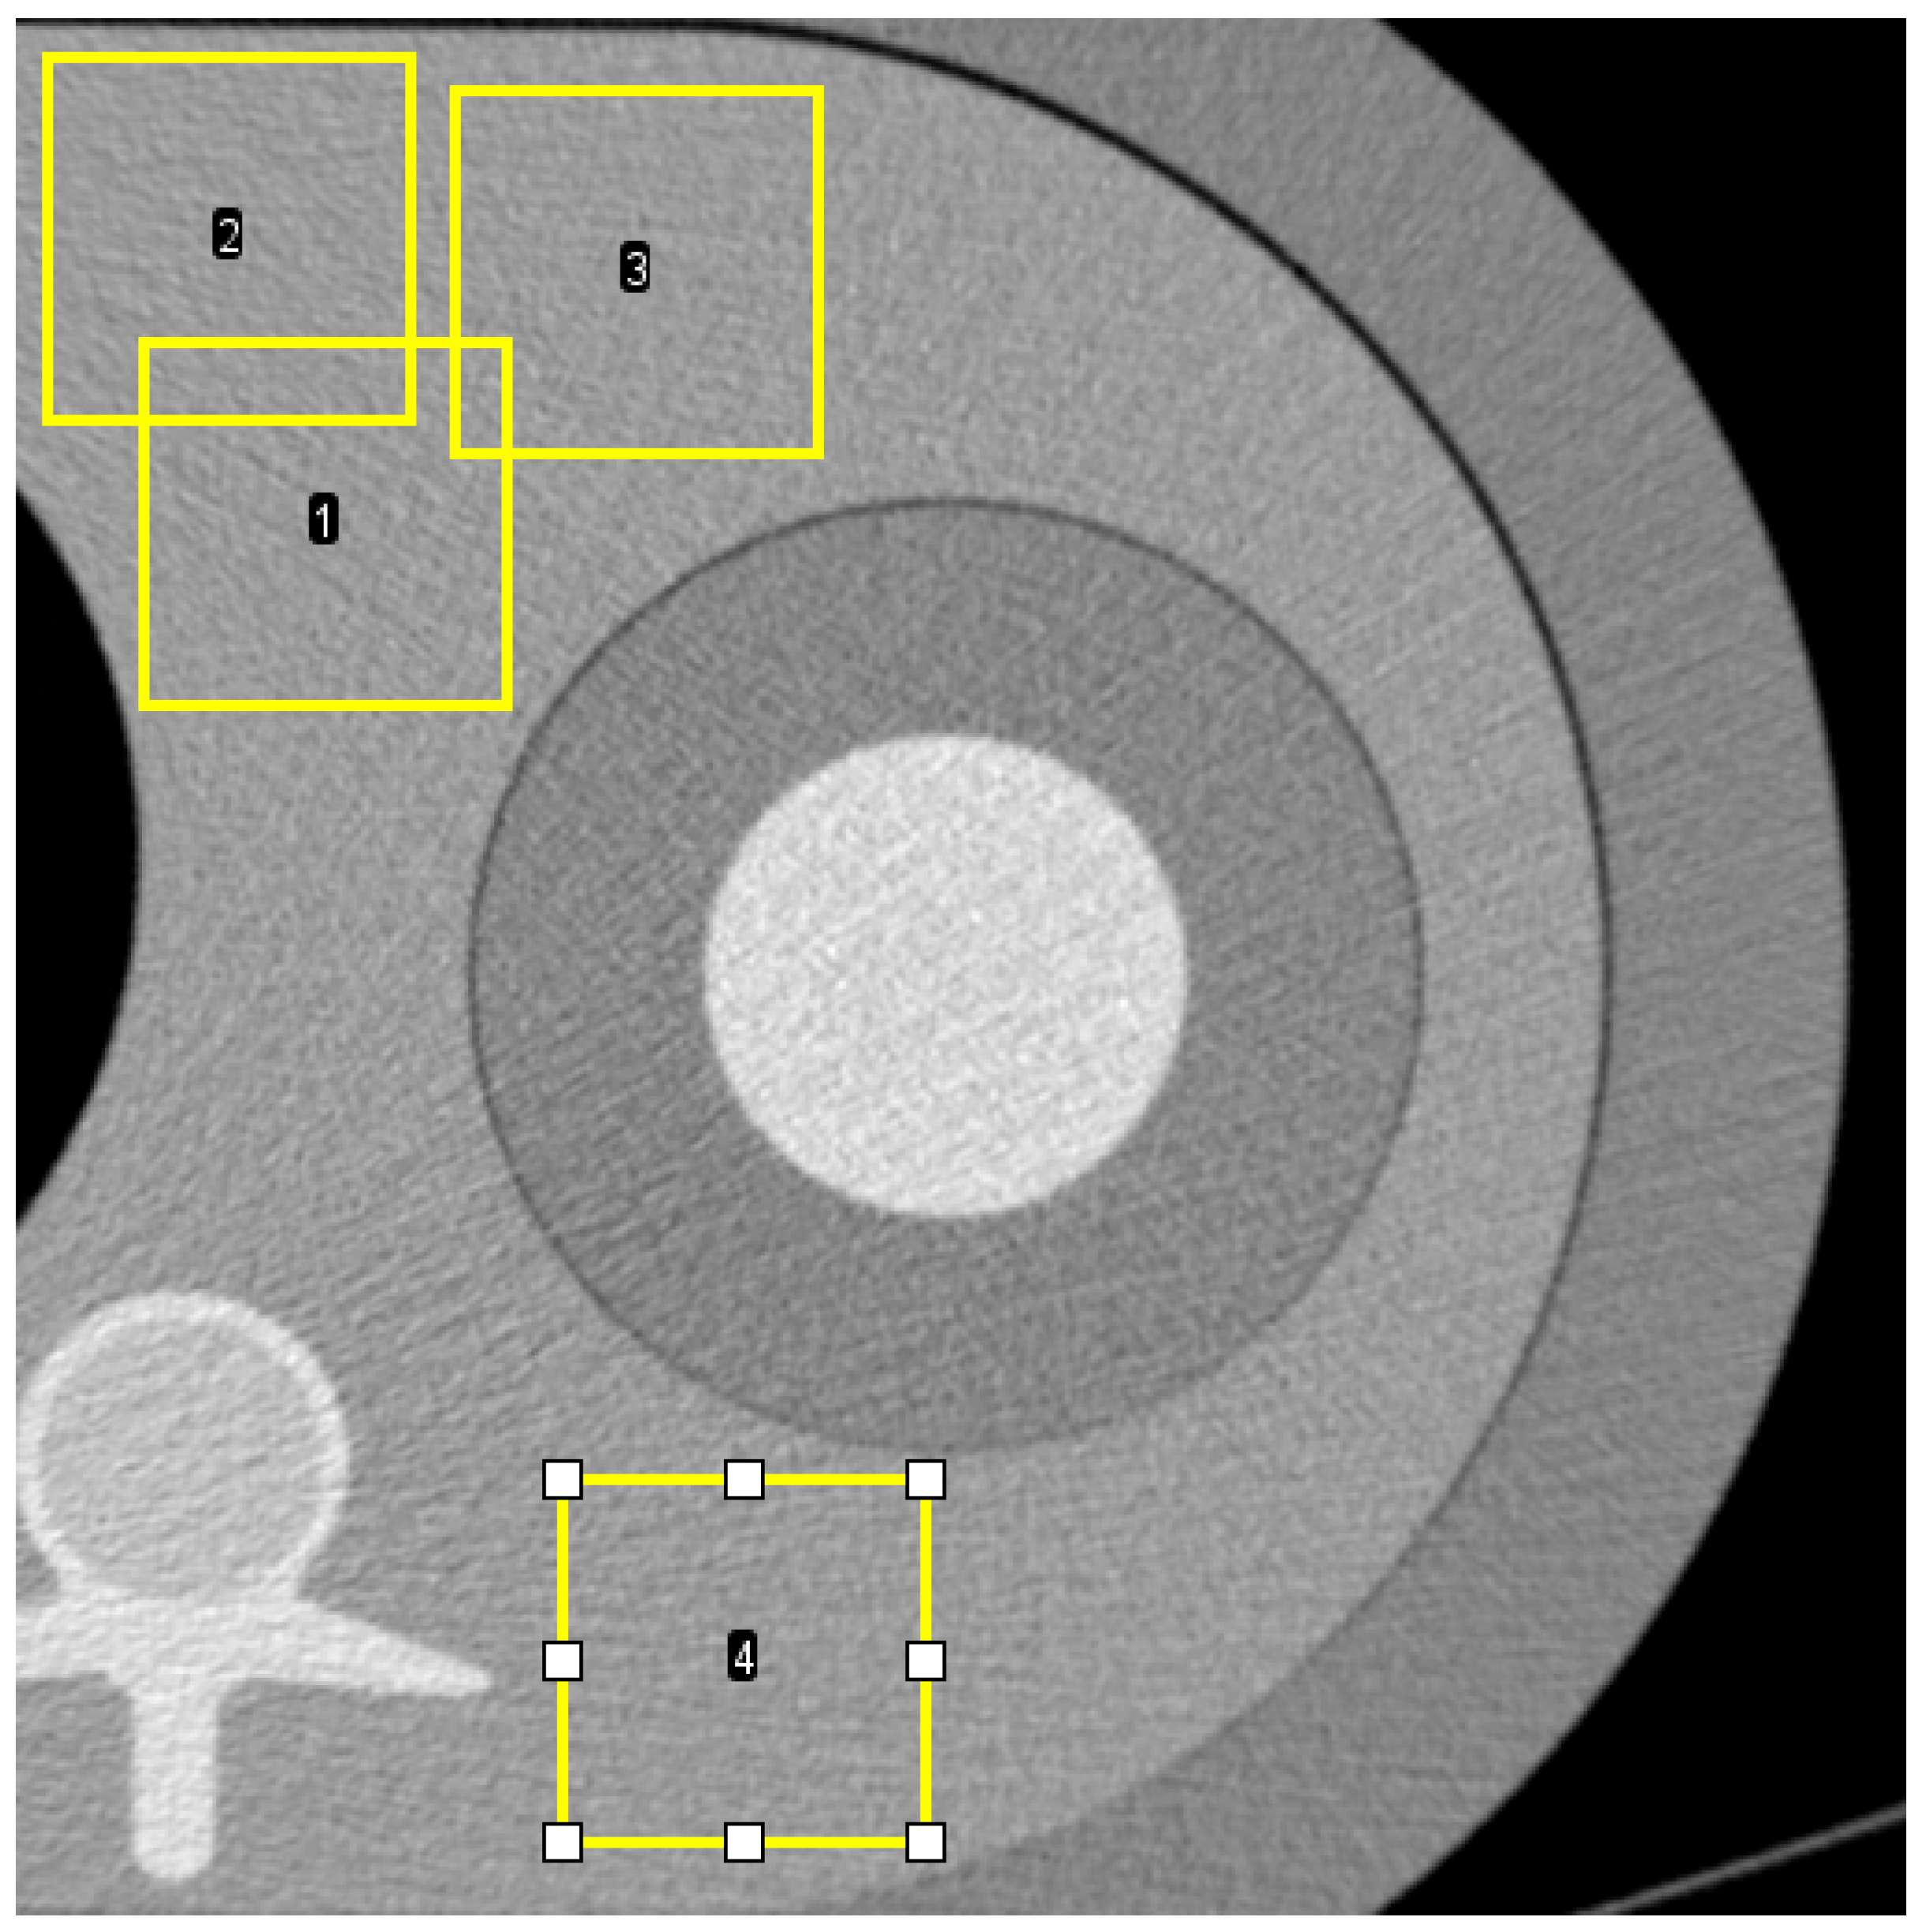
2.3.1. Noise Power Spectrum (NPS)
2.3.2. Target Transfer Function (TTF)
2.3.3. Non-Pre-Whitening with Eye Filter (NPWE) Model
3. Results
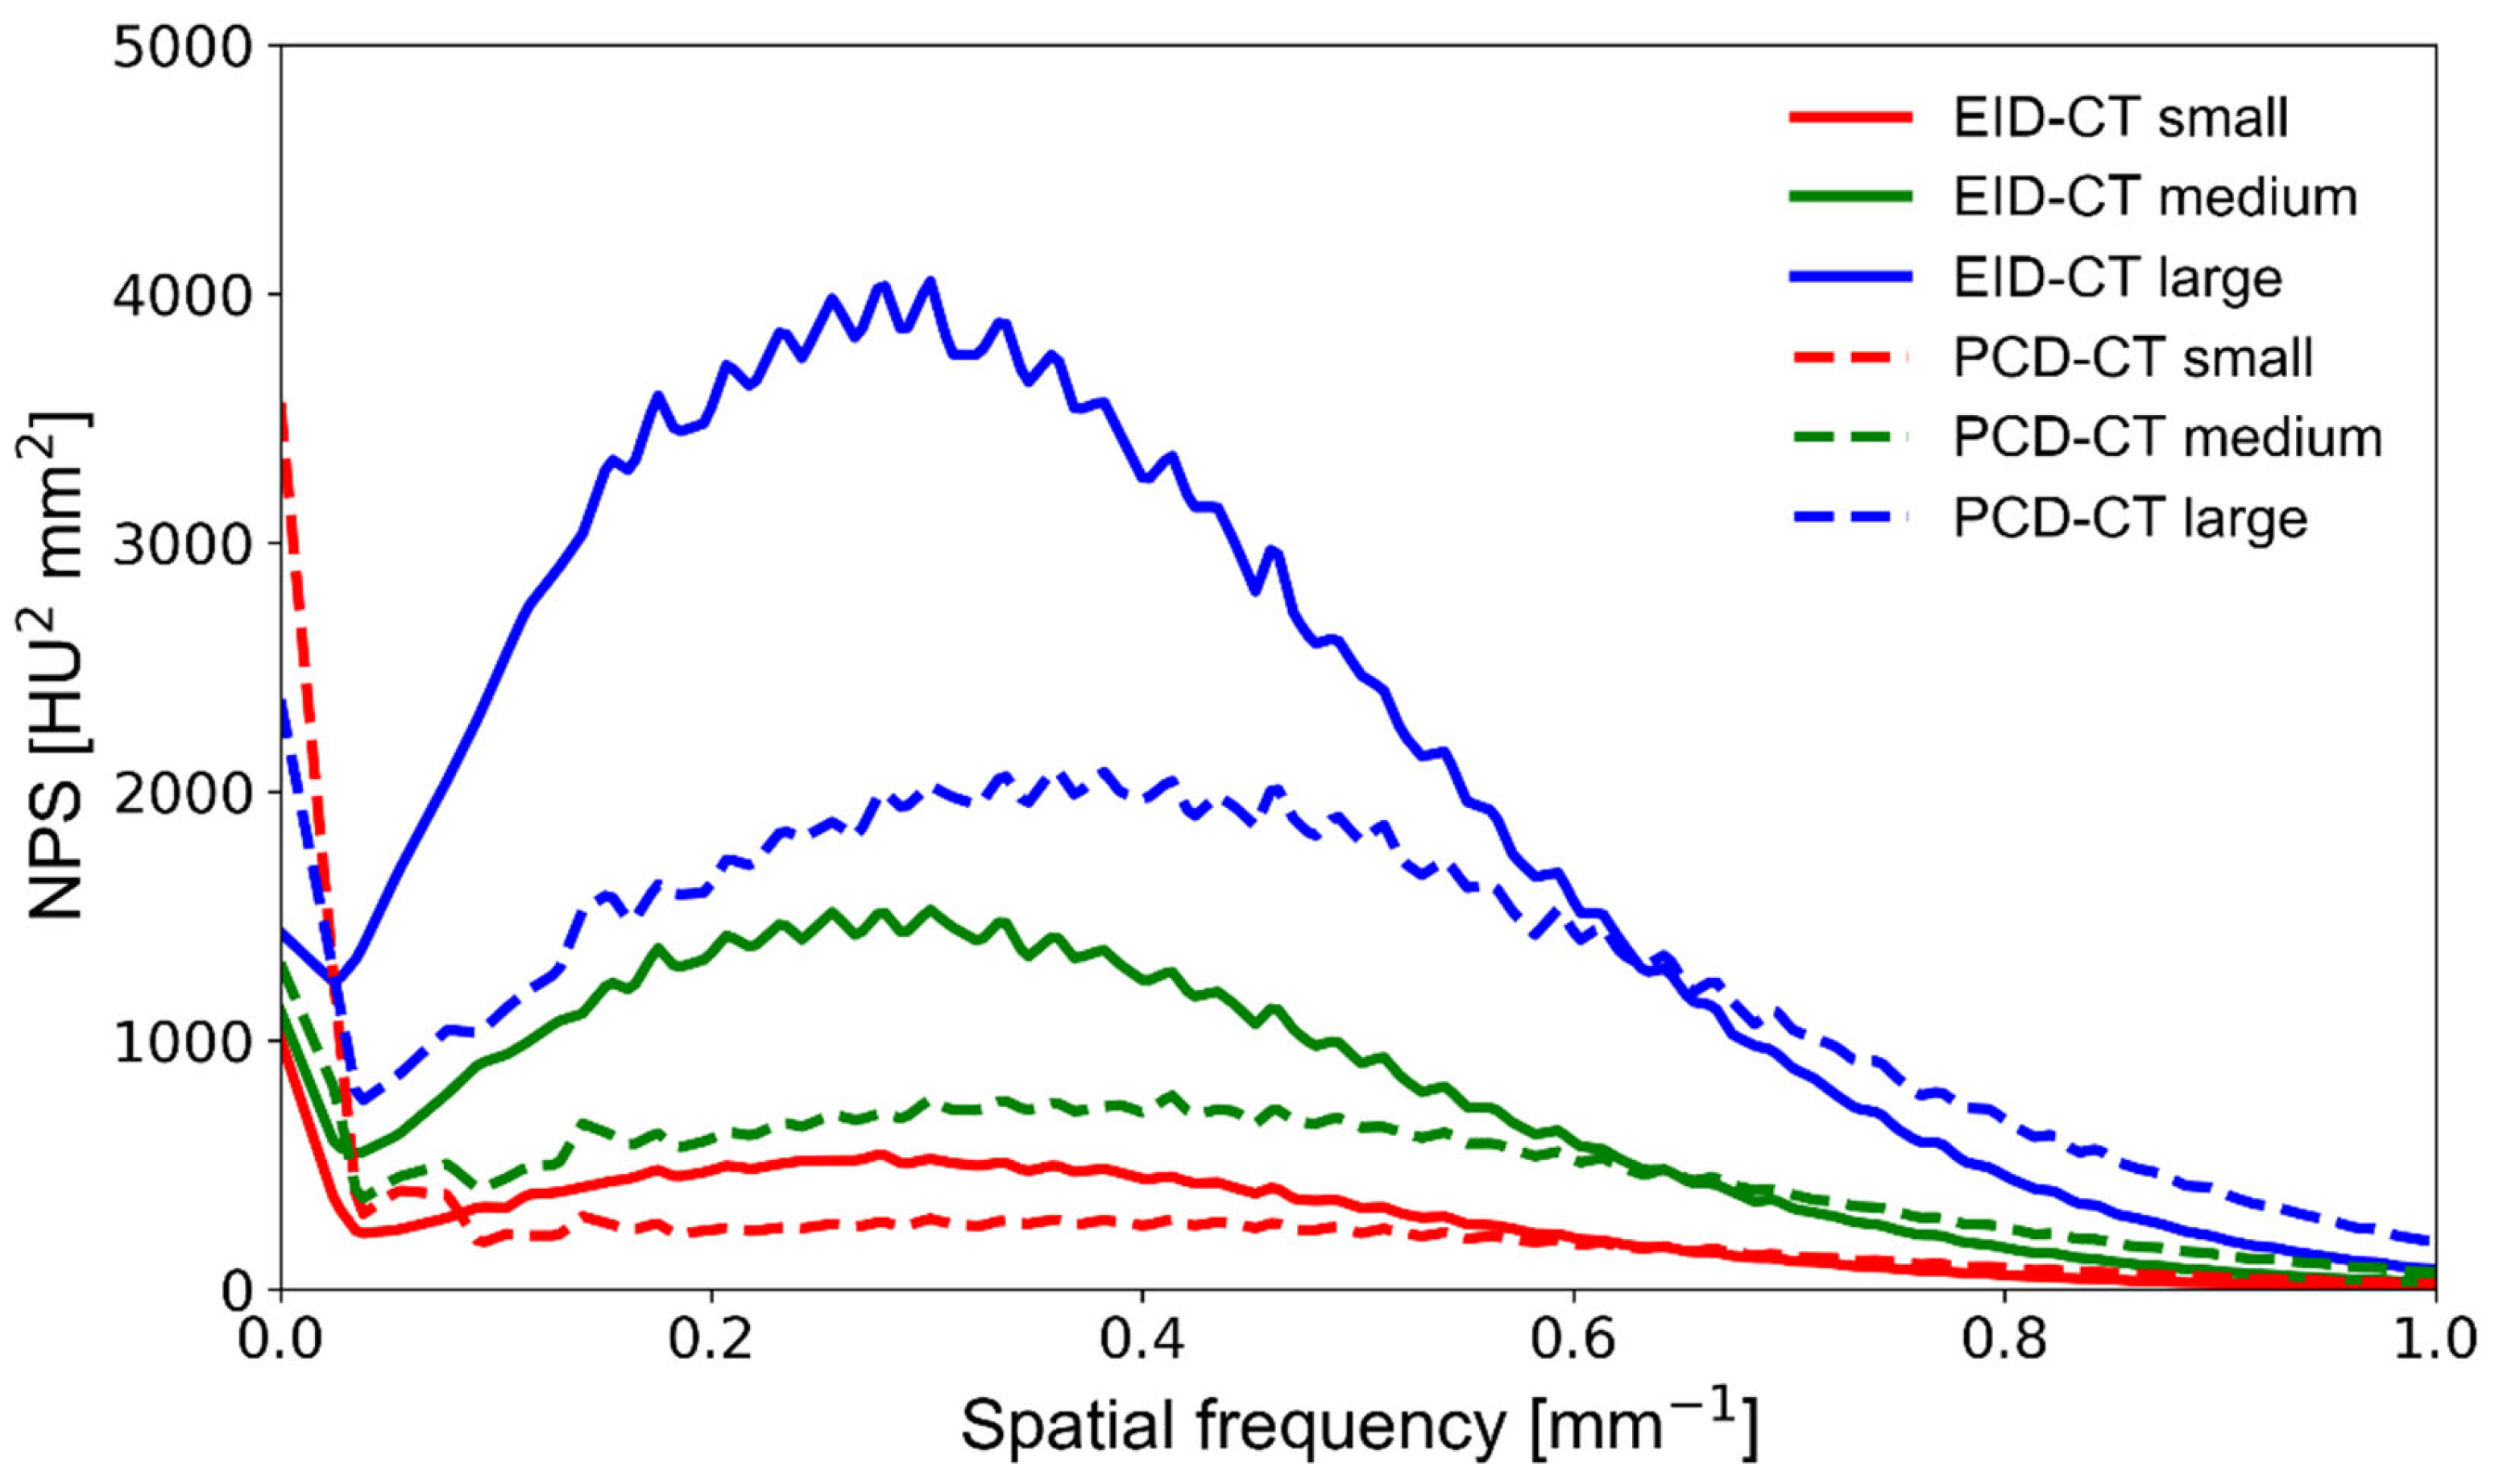
3.1. Noise Power Spectrum
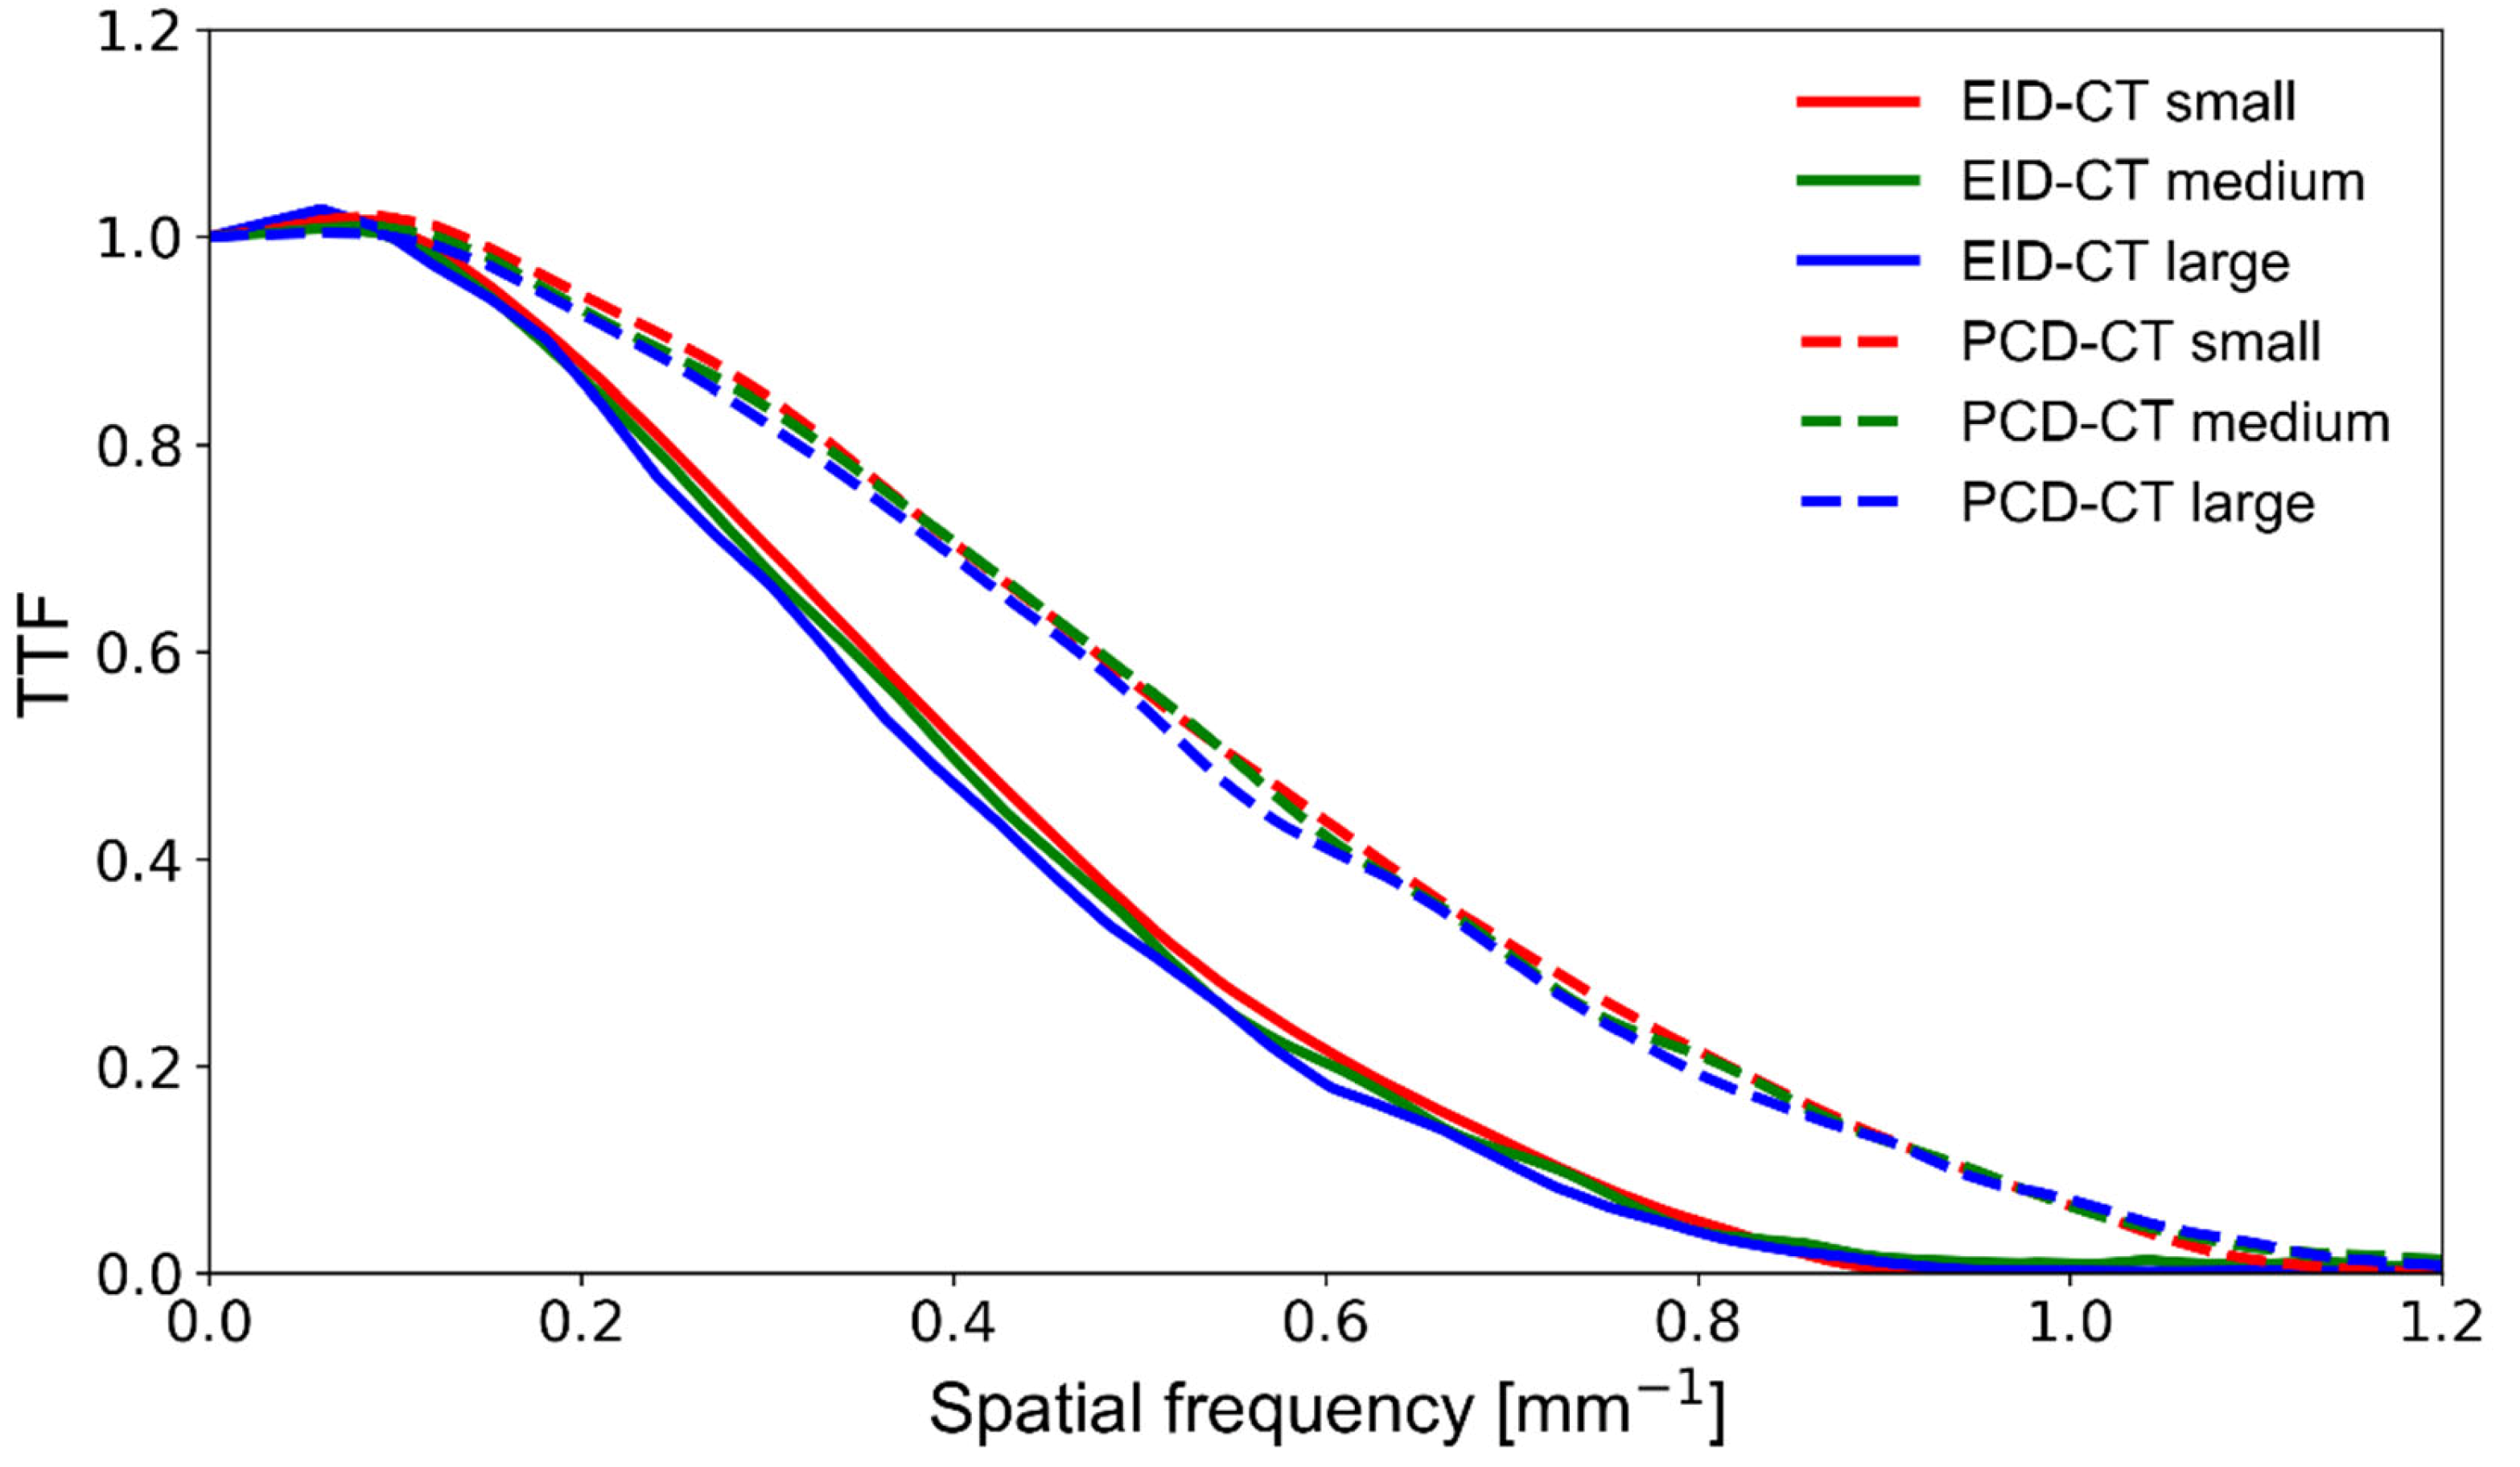
3.2. Target Transfer Function
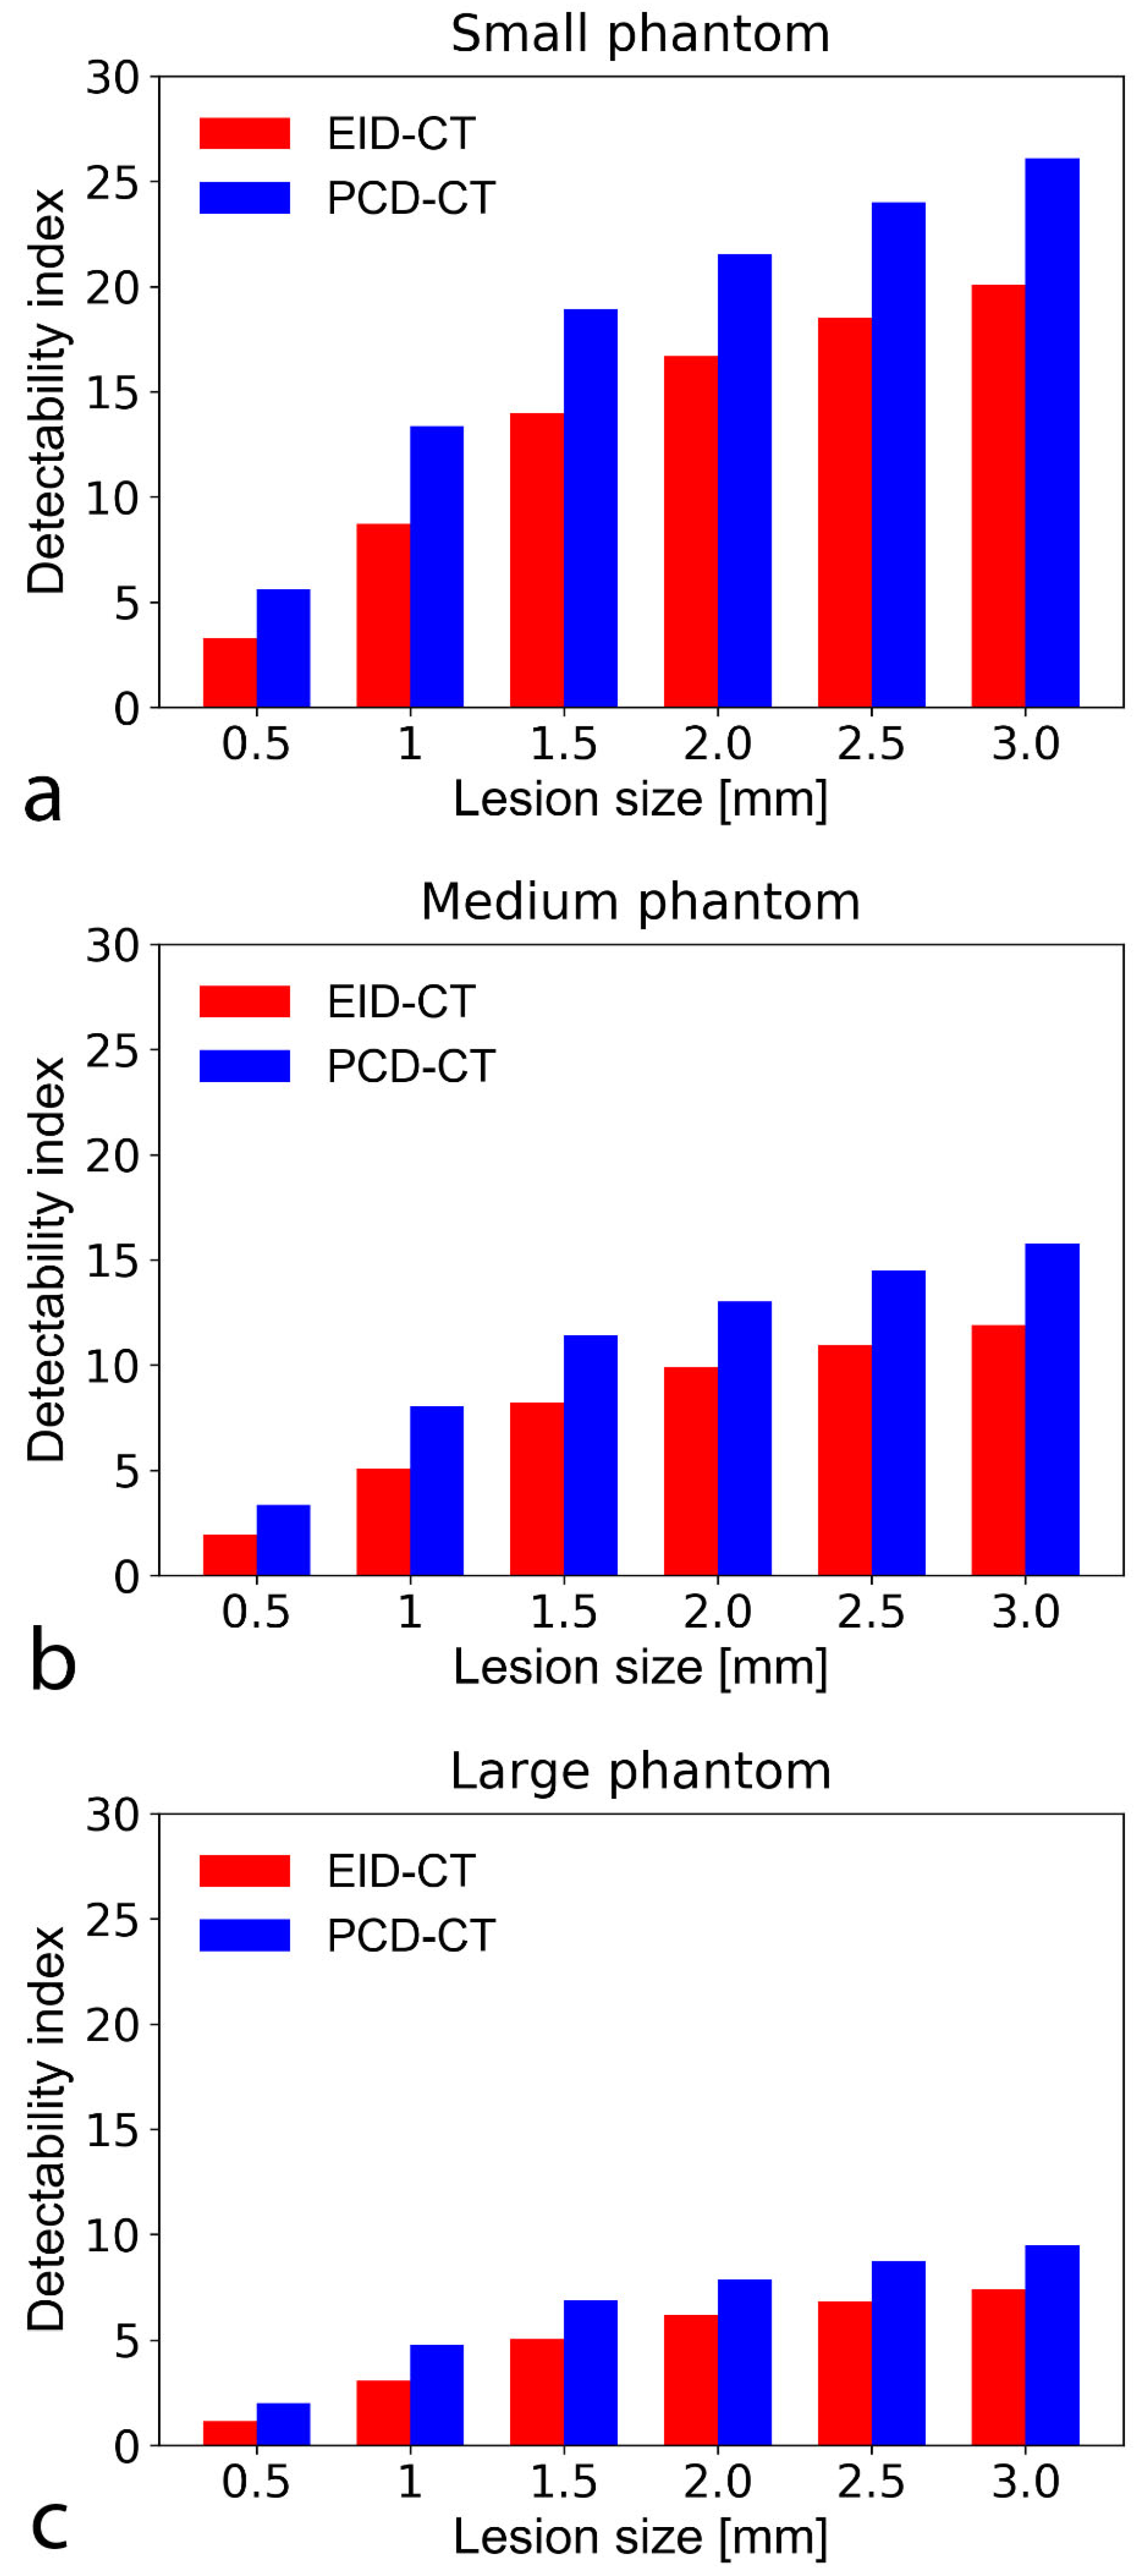
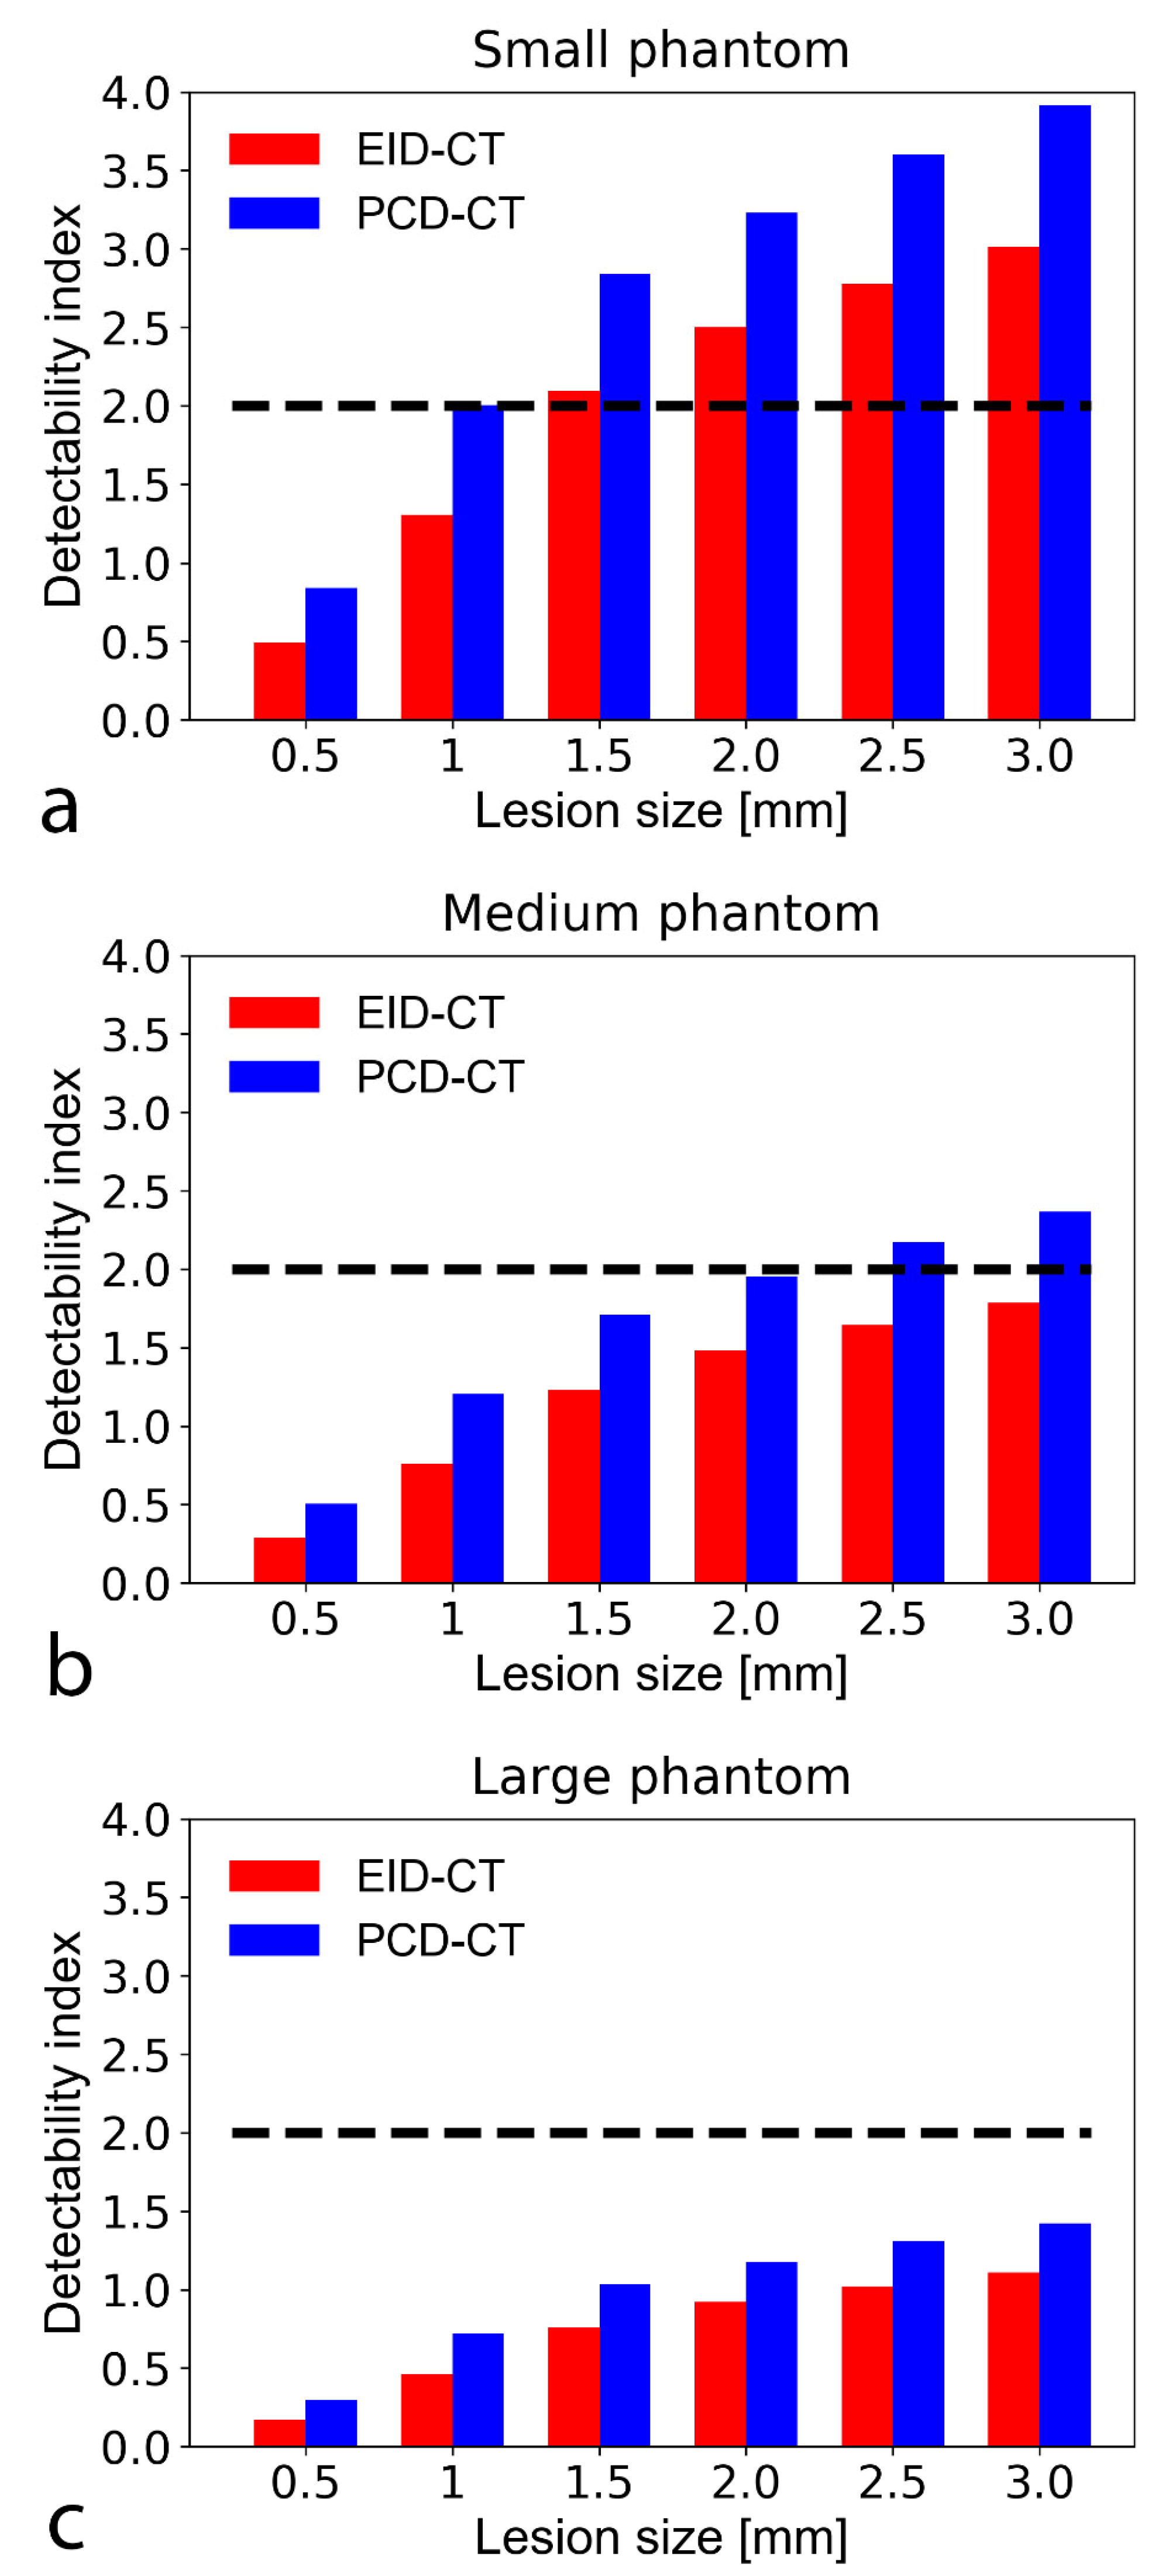
3.3. Non-Pre-Whitening with Eye Filter Model Observer
4. Discussion
5. Conclusions
Author Contributions
Funding
Institutional Review Board Statement
Informed Consent Statement
Acknowledgments
Conflicts of Interest
References
- Schoepf, U.J.; Zwerner, P.L.; Savino, G.; Herzog, C.; Kerl, J.M.; Costello, P. Coronary CT angiography. Radiology 2007, 244, 48–63. [Google Scholar] [CrossRef] [PubMed]
- Hounsfield, G.N. Computerized transverse axial scanning (tomography). 1. Description of system. Br. J. Radiol. 1973, 46, 1016–1022. [Google Scholar] [CrossRef]
- Cavallo, A.U.; Patterson, A.J.; Thomas, R.; Alaiti, M.A.; Attizzani, G.F.; Laukamp, K.; Hokamp, N.G.; Bezerra, H.; Gilkeson, R.; Rajagopalan, S. Low dose contrast CT for transcatheter aortic valve replacement assessment: Results from the prospective SPECTACULAR study (spectral CT assessment prior to TAVR). J. Cardiovasc. Comput. Tomogr. 2020, 14, 68–74. [Google Scholar] [CrossRef] [PubMed]
- Rotzinger, D.C.; Si-Mohamed, S.A.; Yerly, J.; Boccalini, S.; Becce, F.; Boussel, L.; Meuli, R.A.; Qanadli, S.D.; Douek, P.C. Reduced-iodine-dose dual-energy coronary CT angiography: Qualitative and quantitative comparison between virtual monochromatic and polychromatic CT images. Eur. Radiol. 2021, 31, 7132–7142. [Google Scholar] [CrossRef]
- Bae, K.; Jeon, K.N.; Cho, S.B.; Park, S.E.; Moon, J.I.; Baek, H.J.; Choi, B.H. Improved opacification of a suboptimally enhanced pulmonary artery in chest CT: Experience using a dual-layer detector spectral CT. Am. J. Roentgenol. 2018, 210, 734–741. [Google Scholar] [CrossRef] [PubMed]
- Si-Mohamed, S.; Dupuis, N.; Tatard-Leitman, V.; Rotzinger, D.; Boccalini, S.; Dion, M.; Vlassenbroek, A.; Coulon, P.; Yagil, Y.; Shapira, N.; et al. Virtual versus true non-contrast dual-energy CT imaging for the diagnosis of aortic intramural hematoma. Eur. Radiol. 2019, 29, 6762–6771. [Google Scholar] [CrossRef] [PubMed]
- Sandfort, V.; Persson, M.; Pourmorteza, A.; Noël, P.B.; Fleischmann, D.; Willemink, M.J. Spectral photon-counting CT in cardiovascular imaging. J. Cardiovasc. Comput. Tomogr. 2020, 15, 218–225. [Google Scholar] [CrossRef]
- Taguchi, K.B.I.; Iniewski, K. Spectral, Photon. Counting Computed Tomography: Technology and Applications; CRC Press: Boca Raton, FL, USA, 2020. [Google Scholar]
- Taguchi, K.; Iwanczyk, J.S. Vision 20/20: Single photon counting x-ray detectors in medical imaging. Med. Phys. 2013, 40, 100901. [Google Scholar] [CrossRef]
- Si-Mohamed, S.; Bar-Ness, D.; Sigovan, M.; Cormode, D.P.; Coulon, P.; Coche, E.; Vlassenbroek, A.; Normand, G.; Boussel, L.; Douek, P. Review of an initial experience with an experimental spectral photon-counting computed tomography system. Nucl. Instrum. Methods Phys. Res. Sect. A Accel. Spectrometers Detect. Assoc. Equip. 2017, 873, 27–35. [Google Scholar] [CrossRef]
- Willemink, M.J.; Varga-Szemes, A.; Schoepf, U.J.; Codari, M.; Nieman, K.; Fleischmann, D.; Mastrodicasa, D. Emerging methods for the characterization of ischemic heart disease: Ultrafast Doppler angiography, micro-CT, photon-counting CT, novel MRI and PET techniques, and artificial intelligence. Eur. Radiol. Exp. 2021, 5, 1–14. [Google Scholar] [CrossRef]
- Samei, E.; Bakalyar, D.; Boedeker, K.L.; Brady, S.; Fan, J.; Leng, S.; Myers, K.J.; Popescu, L.M.; Giraldo, J.C.R.; Ranallo, F.; et al. Performance evaluation of computed tomography systems: Summary of AAPM task group 233. Med. Phys. 2019, 46, e735–e756. [Google Scholar] [CrossRef] [Green Version]
- Verdun, F.R.; Racine, D.; Ott, J.G.; Tapiovaara, M.J.; Toroi, P.; Bochud, F.O.; Veldkamp, W.J.H.; Schegerer, A.; Bouwman, R.W.; Giron, I.H.; et al. Image quality in CT: From physical measurements to model observers. Phys. Med. 2015, 31, 823–843. [Google Scholar] [CrossRef] [PubMed] [Green Version]
- Boccalini, S.; Si-Mohamed, S.; Dessouky, R.; Sigovan, M.; Boussel, L.; Douek, P. Feasibility of human vascular imaging of the neck with a large field-of-view spectral photon-counting CT system. Diagn. Interv. Imaging 2021, 102, 329–332. [Google Scholar] [CrossRef]
- Si-Mohamed, S.; Boccalini, S.; Rodesch, P.; Dessouky, R.; Lahoud, E.; Broussaud, T.; Sigovan, M.; Gamondes, D.; Coulon, P.; Yagil, Y.; et al. Feasibility of lung imaging with a large field-of-view spectral photon-counting CT system. Diagn. Interv. Imaging 2021, 102, 305–312. [Google Scholar] [CrossRef] [PubMed]
- Sharp, P.; Barber, D.C.; Brown, D.G.; Burgess, A.E.; Metz, C.E.; Myers, K.J.; Taylor, C.J.; Wagner, R.F.; Brooks, R.; Hill, C.R.; et al. Report 54. J. Int. Comm. Radiat. Units Meas. 2016, 28, 1. [Google Scholar] [CrossRef]
- Rotzinger, D.C.; Racine, D.; Beigelman-Aubry, C.; Alfudhili, K.M.; Keller, N.; Monnin, P.; Verdun, F.R.; Becce, F. Task-based model observer assessment of a partial model-based iterative reconstruction algorithm in thoracic oncologic multidetector CT. Sci. Rep. 2018, 8, 1–12. [Google Scholar] [CrossRef]
- Johnson, T.R.; Nikolaou, K.; Wintersperger, B.J.; Fink, C.; Rist, C.; Leber, A.W.; Knez, A.; Reiser, M.F.; Becker, C.R. Optimization of contrast material administration for electrocardiogram-gated computed tomographic angiography of the chest. J. Comput. Assist. Tomogr. 2007, 31, 265–271. [Google Scholar] [CrossRef]
- Dwivedi, G.; Liu, Y.; Tewari, S.; Inacio, J.; Pelletier-Galarneau, M.; Chow, B.J. Incremental Prognostic Value of Quantified Vulnerable Plaque by Cardiac Computed Tomography: A Pilot Study. J. Thorac. Imaging 2016, 31, 373–379. [Google Scholar] [CrossRef]
- Saremi, F.; Achenbach, S. Coronary plaque characterization using CT. AJR Am. J. Roentgenol. 2015, 204, W249–W260. [Google Scholar] [CrossRef]
- Schlett, C.L.; Maurovich-Horvat, P.; Ferencik, M.; Alkadhi, H.; Stolzmann, P.; Scheffel, H.; Seifarth, H.; Nakano, M.; Do, S.; Vorpahl, M.; et al. Histogram analysis of lipid-core plaques in coronary computed tomographic angiography: Ex vivo validation against histology. Investig. Radiol. 2013, 48, 646–653. [Google Scholar] [CrossRef] [PubMed]
- Clark, D.P.; Holbrook, M.; Lee, C.L.; Badea, C.T. Photon-counting cine-cardiac CT in the mouse. PLoS ONE 2019, 14, e0218417. [Google Scholar] [CrossRef] [Green Version]
- Si-Mohamed, S.A.; Greffier, J.; Miailhes, J.; Boccalini, S.; Rodesch, P.-A.; Vuillod, A.; van der Werf, N.; Dabli, D.; Racine, D.; Rotzinger, D.; et al. Comparison of image quality between spectral photon-counting CT and dual-layer CT for the evaluation of lung nodules: A phantom study. Eur. Radiol. 2021, 1–9. [Google Scholar] [CrossRef]
- Sandstedt, M.; Marsh, J.; Rajendran, K.; Gong, H.; Tao, S.; Persson, A.; Leng, S.; McCollough, C. Improved coronary calcification quantification using photon-counting-detector CT: An ex vivo study in cadaveric specimens. Eur. Radiol. 2021, 31, 6621–6630. [Google Scholar] [CrossRef] [PubMed]
- Leng, S.; Gutjahr, R.; Ferrero, A.; Kappler, S.; Henning, A.; Halaweish, A.; Zhou, W.J.M.; McCollough, C. Ultra-high spatial resolution multi-energy CT using photon counting detector technology. Proc. SPIE Int. Soc. Opt. Eng. 2017, 11, 10132. [Google Scholar]
- Lin, E.; Alessio, A. What are the basic concepts of temporal, contrast, and spatial resolution in cardiac CT? J. Cardiovasc. Comput. Tomogr. 2009, 3, 403–408. [Google Scholar] [CrossRef] [PubMed] [Green Version]
- Puchner, S.B.; Ferencik, M.; Maurovich-Horvat, P.; Nakano, M.; Otsuka, F.; Kauczor, H.; Virmani, R.; Hoffmann, U.; Schlett, C.L. Iterative image reconstruction algorithms in coronary CT angiography improve the detection of lipid-core plaque–a comparison with histology. Eur. Radiol. 2015, 25, 15–23. [Google Scholar] [CrossRef]
- Solomon, J.; Mileto, A.; Ramirez-Giraldo, J.C.; Samei, E. Diagnostic Performance of an Advanced Modeled Iterative Reconstruction Algorithm for Low-Contrast Detectability with a Third-Generation Dual-Source Multidetector CT Scanner: Potential for Radiation Dose Reduction in a Multireader Study. Radiology 2015, 275, 735–745. [Google Scholar] [CrossRef]
- Budoff, M.J.; Dowe, D.; Jollis, J.G.; Gitter, M.; Sutherland, J.; Halamert, E.; Scherer, M.; Bellinger, R.; Martin, A.; Benton, R.; et al. Diagnostic performance of 64-multidetector row coronary computed tomographic angiography for evaluation of coronary artery stenosis in individuals without known coronary artery disease: Results from the prospective multicenter ACCURACY (Assessment by Coronary Computed Tomographic Angiography of Individuals Undergoing Invasive Coronary Angiography) trial. J. Am. Coll. Cardiol. 2008, 52, 1724–1732. [Google Scholar] [PubMed] [Green Version]
- Do, S.; Karl, W.C.; Liang, Z.; Kalra, M.; Brady, T.J.; Pien, H.H. A decomposition-based CT reconstruction formulation for reducing blooming artifacts. Phys. Med. Biol. 2011, 56, 7109–7125. [Google Scholar] [CrossRef] [PubMed]
- Gutjahr, R.; Halaweish, A.F.; Yu, Z.; Leng, S.; Yu, L.; Li, Z.; Jorgensen, S.M.; Ritman, E.L.; Kappler, S.; McCollough, C.H. Human Imaging with Photon Counting-Based Computed Tomography at Clinical Dose Levels: Contrast-to-Noise Ratio and Cadaver Studies. Investig. Radiol. 2016, 51, 421–429. [Google Scholar] [CrossRef] [Green Version]
- Bratke, G.; Hickethier, T.; Bar-Ness, D.; Bunck, A.C.; Maintz, D.; Pahn, G.; Coulon, P.; Si-Mohamed, S.; Douek, P.; Sigovan, M. Spectral photon-counting computed tomography for coronary stent imaging: Evaluation of the potential clinical impact for the delineation of in-stent restenosis. Investig. Radiol. 2020, 55, 61–67. [Google Scholar] [CrossRef] [PubMed]
- Sigovan, M.; Si-Mohamed, S.; Bar-Ness, D.; Mitchell, J.; Langlois, J.; Coulon, P.; Roessl, E.; Blevis, I.; Rokni, M.; Rioufol, G.; et al. Feasibility of improving vascular imaging in the presence of metallic stents using spectral photon counting CT and K-edge imaging. Sci. Rep. 2019, 9, 1–9. [Google Scholar] [CrossRef]
- Racine, D.; Becce, F.; Viry, A.; Monnin, P.; Thomsen, B.; Verdun, F.R.; Rotzinger, D.C. Task-based characterization of a deep learning image reconstruction and comparison with filtered back-projection and a partial model-based iterative reconstruction in abdominal CT: A phantom study. Phys. Med. 2020, 76, 28–37. [Google Scholar] [CrossRef]
- Niu, S.; Zhang, Y.; Zhong, Y.; Liu, G.; Lu, S.; Zhang, X.; Hu, S.; Wang, T.; Yu, G.; Wang, J. Iterative reconstruction for photon-counting CT using prior image constrained total generalized variation. Comput. Biol. Med. 2018, 103, 167–182. [Google Scholar] [CrossRef] [PubMed]
- van der Werf, N.R.; Si-Mohamed, S.; Rodesch, P.A.; van Hamersvelt, R.W.; Greuter, M.J.W.; Boccalini, S.; Greffier, J.; Leiner, T.; Boussel, L.; Willemink, M.J.; et al. Coronary calcium scoring potential of large field-of-view spectral photon-counting CT: A phantom study. Eur. Radiol. 2021. [Google Scholar] [CrossRef] [PubMed]
- van der Werf, N.R.; van Gent, M.; Booij, R.; Bos, D.; van der Lugt, A.; Budde, R.P.J.; Greuter, M.J.W.; van Straten, M. Dose Reduction in Coronary Artery Calcium Scoring Using Mono-Energetic Images from Reduced Tube Voltage Dual-Source Photon-Counting CT Data: A Dynamic Phantom Study. Diagnostics 2021, 11, 2192. [Google Scholar] [CrossRef]
- Solomon, J.; Samei, E. Correlation between human detection accuracy and observer model-based image quality metrics in computed tomography. J. Med. Imaging 2016, 3, 035506. [Google Scholar] [CrossRef]
- Robins, M.; Solomon, J.; Richards, T.; Samei, E. 3D task-transfer function representation of the signal transfer properties of low-contrast lesions in FBP- and iterative-reconstructed CT. Med. Phys. 2018, 45, 4977–4985. [Google Scholar] [CrossRef] [PubMed]
- Mørup, S.D.; Stowe, J.; Precht, H.; Gervig, M.H.; Foley, S. Design of a 3D printed coronary artery model for CT optimization. Radiography 2021. [Google Scholar] [CrossRef]


| CT System | EID-CT | PCD-CT |
|---|---|---|
| Radiation dose level | ||
| CTDIvol (mGy) | 10 | 10 |
| Data acquisition | ||
| Tube potential (kVp) | 120 | 120 |
| Tube current (mA) | 330 | 330 |
| Gantry revolution time (s) | 0.5 | 0.5 |
| Beam collimation (mm) | 32 × 0.672 | 64 × 0.2724 |
| Scan mode | Helical | Helical |
| Automatic exposure control | Off | Off |
| Image reconstruction | ||
| Display field of view (mm) | 200 × 200 | 200 × 200 |
| Matrix size | 512 × 512 | 512 × 512 |
| Section thickness (mm) | 0.6 | 0.6 |
| Section increment (mm) | 0.6 | 0.6 |
| Kernel | High-res B | PCD-High-res B |
| Algorithm | Filtered back-projection | Filtered back-projection |
| Phantom Size | Noise Magnitude Reduction (%) | Peak Frequency Shift (%) |
|---|---|---|
| Small | −9 | 47 |
| Medium | −33 | 37 |
| Large | −38 | 27 |
| TTF Frequency Shifts (%) | ||
|---|---|---|
| Phantom Size | TTF50 | TTF10 |
| Small | 35 | 30 |
| Medium | 37 | 31 |
| Large | 38 | 33 |
Publisher’s Note: MDPI stays neutral with regard to jurisdictional claims in published maps and institutional affiliations. |
© 2021 by the authors. Licensee MDPI, Basel, Switzerland. This article is an open access article distributed under the terms and conditions of the Creative Commons Attribution (CC BY) license (https://creativecommons.org/licenses/by/4.0/).
Share and Cite
Rotzinger, D.C.; Racine, D.; Becce, F.; Lahoud, E.; Erhard, K.; Si-Mohamed, S.A.; Greffier, J.; Viry, A.; Boussel, L.; Meuli, R.A.; et al. Performance of Spectral Photon-Counting Coronary CT Angiography and Comparison with Energy-Integrating-Detector CT: Objective Assessment with Model Observer. Diagnostics 2021, 11, 2376. https://doi.org/10.3390/diagnostics11122376
Rotzinger DC, Racine D, Becce F, Lahoud E, Erhard K, Si-Mohamed SA, Greffier J, Viry A, Boussel L, Meuli RA, et al. Performance of Spectral Photon-Counting Coronary CT Angiography and Comparison with Energy-Integrating-Detector CT: Objective Assessment with Model Observer. Diagnostics. 2021; 11(12):2376. https://doi.org/10.3390/diagnostics11122376
Chicago/Turabian StyleRotzinger, David C., Damien Racine, Fabio Becce, Elias Lahoud, Klaus Erhard, Salim A. Si-Mohamed, Joël Greffier, Anaïs Viry, Loïc Boussel, Reto A. Meuli, and et al. 2021. "Performance of Spectral Photon-Counting Coronary CT Angiography and Comparison with Energy-Integrating-Detector CT: Objective Assessment with Model Observer" Diagnostics 11, no. 12: 2376. https://doi.org/10.3390/diagnostics11122376