
Artificial Intelligence and OCT Angiography in Full Thickness Macular Hole. New Developments for Personalized Medicine

 , , , , and
Abstract
:1. Summary Statement
2. Introduction
3. Methods
4. Deep Neural Networks for Image Embedding
5. Statistical Analysis
6. Results
7. Conclusions
Supplementary Materials
Author Contributions
Funding
Institutional Review Board Statement
Informed Consent Statement
Data Availability Statement
Acknowledgments
Conflicts of Interest
References
- Bodalal, Z.; Trebeschi, S.; Beets-Tan, R. Radiomics: A critical step towards integrated healthcare. Insights Imaging 2018, 9, 911–914. [Google Scholar] [CrossRef]
- Gillies, R.J.; Kinahan, P.E.; Hricak, H. Radiomics: Images Are More than Pictures, They Are Data. Radiology 2016, 278, 563–577. [Google Scholar] [CrossRef] [PubMed]
- De Maria Marchiano, R.; Di Sante, G.; Piro, G.; Carbone, C.; Tortora, G.; Boldrini, L.; Pietragalla, A.; Daniele, G.; Tredicine, M.; Cesario, A.; et al. Translational Research in the Era of Precision Medicine: Where We Are and Where We Will Go. J. Pers. Med. 2021, 11, 216. [Google Scholar] [CrossRef] [PubMed]
- Ting, D.S.W.; Peng, L.; Varadarajan, A.V.; Keane, P.A.; Burlina, P.M.; Chiang, M.F.; Schmetterer, L.; Pasquale, L.R.; Bressler, N.M.; Webster, D.R.; et al. Deep learning in ophthalmology: The technical and clinical considerations. Prog. Retin. Eye Res. 2019, 72, 100759. [Google Scholar] [CrossRef] [PubMed]
- Lepore, D.; Ji, M.H.; Pagliara, M.M.; Lenkowicz, J.; Capocchiano, N.D.; Tagliaferri, L.; Boldrini, L.; Valentini, V.; Damiani, A. Convolutional Neural Network Based on Fluorescein Angiography Images for Retinopathy of Prematurity Management. Transl. Vis. Sci. Technol. 2020, 9, 37. [Google Scholar] [CrossRef] [PubMed]
- Xie, Y.; Nguyen, Q.D.; Hamzah, H.; Lim, G.; Bellemo, V.; Gunasekeran, D.V.; Yip, M.Y.T.; Qi Lee, X.; Hsu, W.; Li Lee, M.; et al. Artificial intelligence for teleophthalmology-based diabetic retinopathy screening in a national programme: An economic analysis modelling study. Lancet Digit. Health 2020, 2, e240–e249. [Google Scholar] [CrossRef]
- Ran, A.R.; Cheung, C.Y.; Wang, X.; Chen, H.; Luo, L.Y.; Chan, P.P.; Wong, M.O.M.; Chang, R.T.; Mannil, S.S.; Young, A.L.; et al. Detection of glaucomatous optic neuropathy with spectral-domain optical coherence tomography: A retrospective training and validation deep-learning analysis. Lancet Digit. Health 2019, 1, e172–e182. [Google Scholar] [CrossRef]
- Waldstein, S.M.; Vogl, W.-D.; Bogunovic, H.; Sadeghipour, A.; Riedl, S.; Schmidt-Erfurth, U. Characterization of Drusen and Hyperreflective Foci as Biomarkers for Disease Progression in Age-Related Macular Degeneration Using Artificial Intelligence in Optical Coherence Tomography. JAMA Ophthalmol. 2020, 138, 740–747. [Google Scholar] [CrossRef]
- Tan, N.Y.Q.; Friedman, D.S.; Stalmans, I.; Ahmed, I.I.K.; Sng, C.C. Glaucoma screening: Where are we and where do we need to go? Curr. Opin. Ophthalmol. 2020, 31, 91–100. [Google Scholar] [CrossRef]
- Srinivasan, V.J.; Chen, Y.; Duker, J.S.; Fujimoto, J.G. In vivo functional imaging of intrinsic scattering changes in the human retina with high-speed ultrahigh resolution OCT. Opt. Express 2009, 17, 3861–3877. [Google Scholar] [CrossRef]
- Kapoor, R.; Whigham, B.T.; Al-Aswad, L.A. Artificial Intelligence and Optical Coherence Tomography Imaging. Asia-Pac. J. Ophthalmol. 2019, 8, 187–194. [Google Scholar] [CrossRef]
- Kermany, D.S.; Goldbaum, M.; Cai, W.; Valentim, C.C.S.; Liang, H.; Baxter, S.L.; McKeown, A.; Yang, G.; Wu, X.; Yan, F.; et al. Identifying Medical Diagnoses and Treatable Diseases by Image-Based Deep Learning. Cell 2018, 172, 1122–1131.e9. [Google Scholar] [CrossRef] [PubMed]
- Jia, Y.; Tan, O.; Tokayer, J.; Potsaid, B.; Wang, Y.; Liu, J.J.; Kraus, M.F.; Subhash, H.; Fujimoto, J.G.; Hornegger, J.; et al. Split-spectrum amplitude-decorrelation angiography with optical coherence tomography. Opt. Express 2012, 20, 4710–4725. [Google Scholar] [CrossRef]
- Savastano, M.C.; Lumbroso, B.; Rispoli, M. In vivo characterization of retinal vascularization morphology using optical coherence tomography angiography. Retina 2015, 35, 2196–2203. [Google Scholar] [CrossRef]
- Dabir, S.; Bhatt, V.; Bhatt, D.; Rajan, M.; Samant, P.; Munusamy, S.; Webers, C.A.B.; Berendschot, T.T.J.M. Need for manual segmentation in optical coherence tomography angiography of neovascular age-related macular degeneration. PLoS ONE 2020, 15, e0244828. [Google Scholar] [CrossRef]
- Lumbroso, B.; Rispoli, M.; Savastano, M.C. Longitudinal optical coherence tomography-angiography study of type 2 naive choroidal neovascularization early response after treatment. Retina 2015, 35, 2242–2251. [Google Scholar] [CrossRef]
- Savastano, M.C.; Rispoli, M.; Lumbroso, B. The incidence of neovascularization in central serous chorioretinopathy by optical coherence tomography angiography. Retina 2021, 41, 302–308. [Google Scholar] [CrossRef] [PubMed]
- Nemiroff, J.; Phasukkijwatana, N.; Sarraf, D. Optical Coherence Tomography Angiography of Deep Capillary Ischemia. Dev. Ophthalmol. 2016, 56, 139–145. [Google Scholar] [CrossRef]
- Gass, J.D. Idiopathic senile macular hole. Its early stages and pathogenesis. Arch. Ophthalmol. 1988, 106, 629–639. [Google Scholar] [CrossRef] [PubMed]
- Fallico, M.; Jackson, T.L.; Chronopoulos, A.; Hattenbach, L.O.; Longo, A.; Bonfiglio, V.; Russo, A.; Avitabile, T.; Parisi, F.; Romano, M. Factors predicting normal visual acuity following anatomically successful macular hole surgery. Acta Ophthalmol. 2020, 99, e324–e329. [Google Scholar] [CrossRef]
- Bacherini, D.; Savastano, M.C.; Dragotto, F.; Finocchio, L.; Lenzetti, C.; Bitossi, A.; Tartaro, R.; Giansanti, F.; Barca, F.; Savastano, A.; et al. Morpho-Functional Evaluation of Full-Thickness Macular Holes by the Integration of Optical Coherence Tomography Angiography and Microperimetry. J. Clin. Med. 2020, 9, 229. [Google Scholar] [CrossRef] [PubMed]
- Savastano, A.; Bacherini, D.; Savastano, M.C.; Finocchio, L.; Dragotto, F.; Lenzetti, C.; Rossana, M.; Tomaso, C.; Stanislao, R. Optical coherence tomography angiography findings before and after vitrectomy for macular holes: Useful or Useless? Retina 2021, 41, 1379–1388. [Google Scholar] [CrossRef] [PubMed]
- Krizhevsky, A.; Sutskever, I.; Hinton, G.E. ImageNet classification with deep convolutional neural networks. Commun ACM 2017, 60, 84–90. [Google Scholar] [CrossRef]
- Long, J.; Shelhamer, E.; Darrell, T. Fully convolutional networks for semantic segmentation. In Proceedings of the 2015 IEEE Conference on Computer Vision and Pattern Recognition (CVPR), Boston, MA, USA, 7–12 June 2015; pp. 3431–3440. [Google Scholar] [CrossRef]
- Ronneberger, O.; Fischer, P.; Brox, T. U-Net: Convolutional Networks for Biomedical Image Segmentation. In Medical Image Computing and Computer-Assisted Intervention–MICCAI 2015; Lecture Notes in Computer Science; Navab, N., Hornegger, J., Wells, W.M., Frangi, A.F., Eds.; Springer International Publishing: Cham, Switzerland, 2015; pp. 234–241. [Google Scholar] [CrossRef]
- Lin, W.; Hasenstab, K.; Moura Cunha, G.; Schwartzman, A. Comparison of handcrafted features and convolutional neural networks for liver MR image adequacy assessment. Sci. Rep. 2020, 10, 20336. [Google Scholar] [CrossRef] [PubMed]
- Szegedy, C.; Vanhoucke, V.; Ioffe, S.; Shlens, J.; Wojna, Z. Rethinking the Inception Architecture for Computer Vision. In Proceedings of the 2016 IEEE Conference on Computer Vision and Pattern Recognition (CVPR), Las Vegas, NV, USA, 27–30 June 2016; pp. 2818–2826. [Google Scholar] [CrossRef]
- Simonyan, K.; Zisserman, A. Very Deep Convolutional Networks for Large-Scale Image Recognition. arXiv 2014, arXiv:14091556. Available online: http://arxiv.org/abs/1409.1556 (accessed on 3 July 2021).
- Iandola, F.N.; Han, S.; Moskewicz, M.W.; Ashraf, K.; Dally, W.J.; Keutzer, K. SqueezeNet: AlexNet-level accuracy with 50× fewer parameters and <0.5 MB model size. arXiv 2016, arXiv:160207360. Available online: http://arxiv.org/abs/1602.07360 (accessed on 3 July 2021).
- Forsaa, V.A.; Lindtjørn, B.; Kvaløy, J.T.; Frøystein, T.; Krohn, J. Epidemiology and morphology of full-thickness macular holes. Acta Ophthalmol. 2018, 96, 397–404. [Google Scholar] [CrossRef] [PubMed]
- Obata, S.; Ichiyama, Y.; Kakinoki, M.; Sawada, O.; Saishin, Y.; Ito, T.; Tomioka, M.; Ohji, M. Prediction of postoperative visual acuity after vitrectomy for macular hole using deep learning-based artificial intelligence. Graefes Arch. Clin. Exp. Ophthalmol. 2021. Epub ahead of print. [Google Scholar] [CrossRef] [PubMed]


| # Eyes | 35 |
|---|---|
| Age (years) | 70.45 ± 8.24 |
| Female/male | 21/14 |
| FTMH Size/diameter (µm) | 186.28 ± 39.85 |
| Duration of disease persistence (Months) | 4.45 ± 2.5 |
| CNN Type | Image Type | 1-Year Visual Acuity Mean (Standard Deviation)— Cluster 1 | 1-Year Visual Acuity Mean (Standard Deviation)— Cluster 2 | t-Test p-Value |
|---|---|---|---|---|
| Inception V3 | Superficial Images | 59.64 (18.40) | 51.52 (20.50) | 0.252 |
| Deep Images | 61.70 (17.20) | 49.87 (20.50) | 0.081 | |
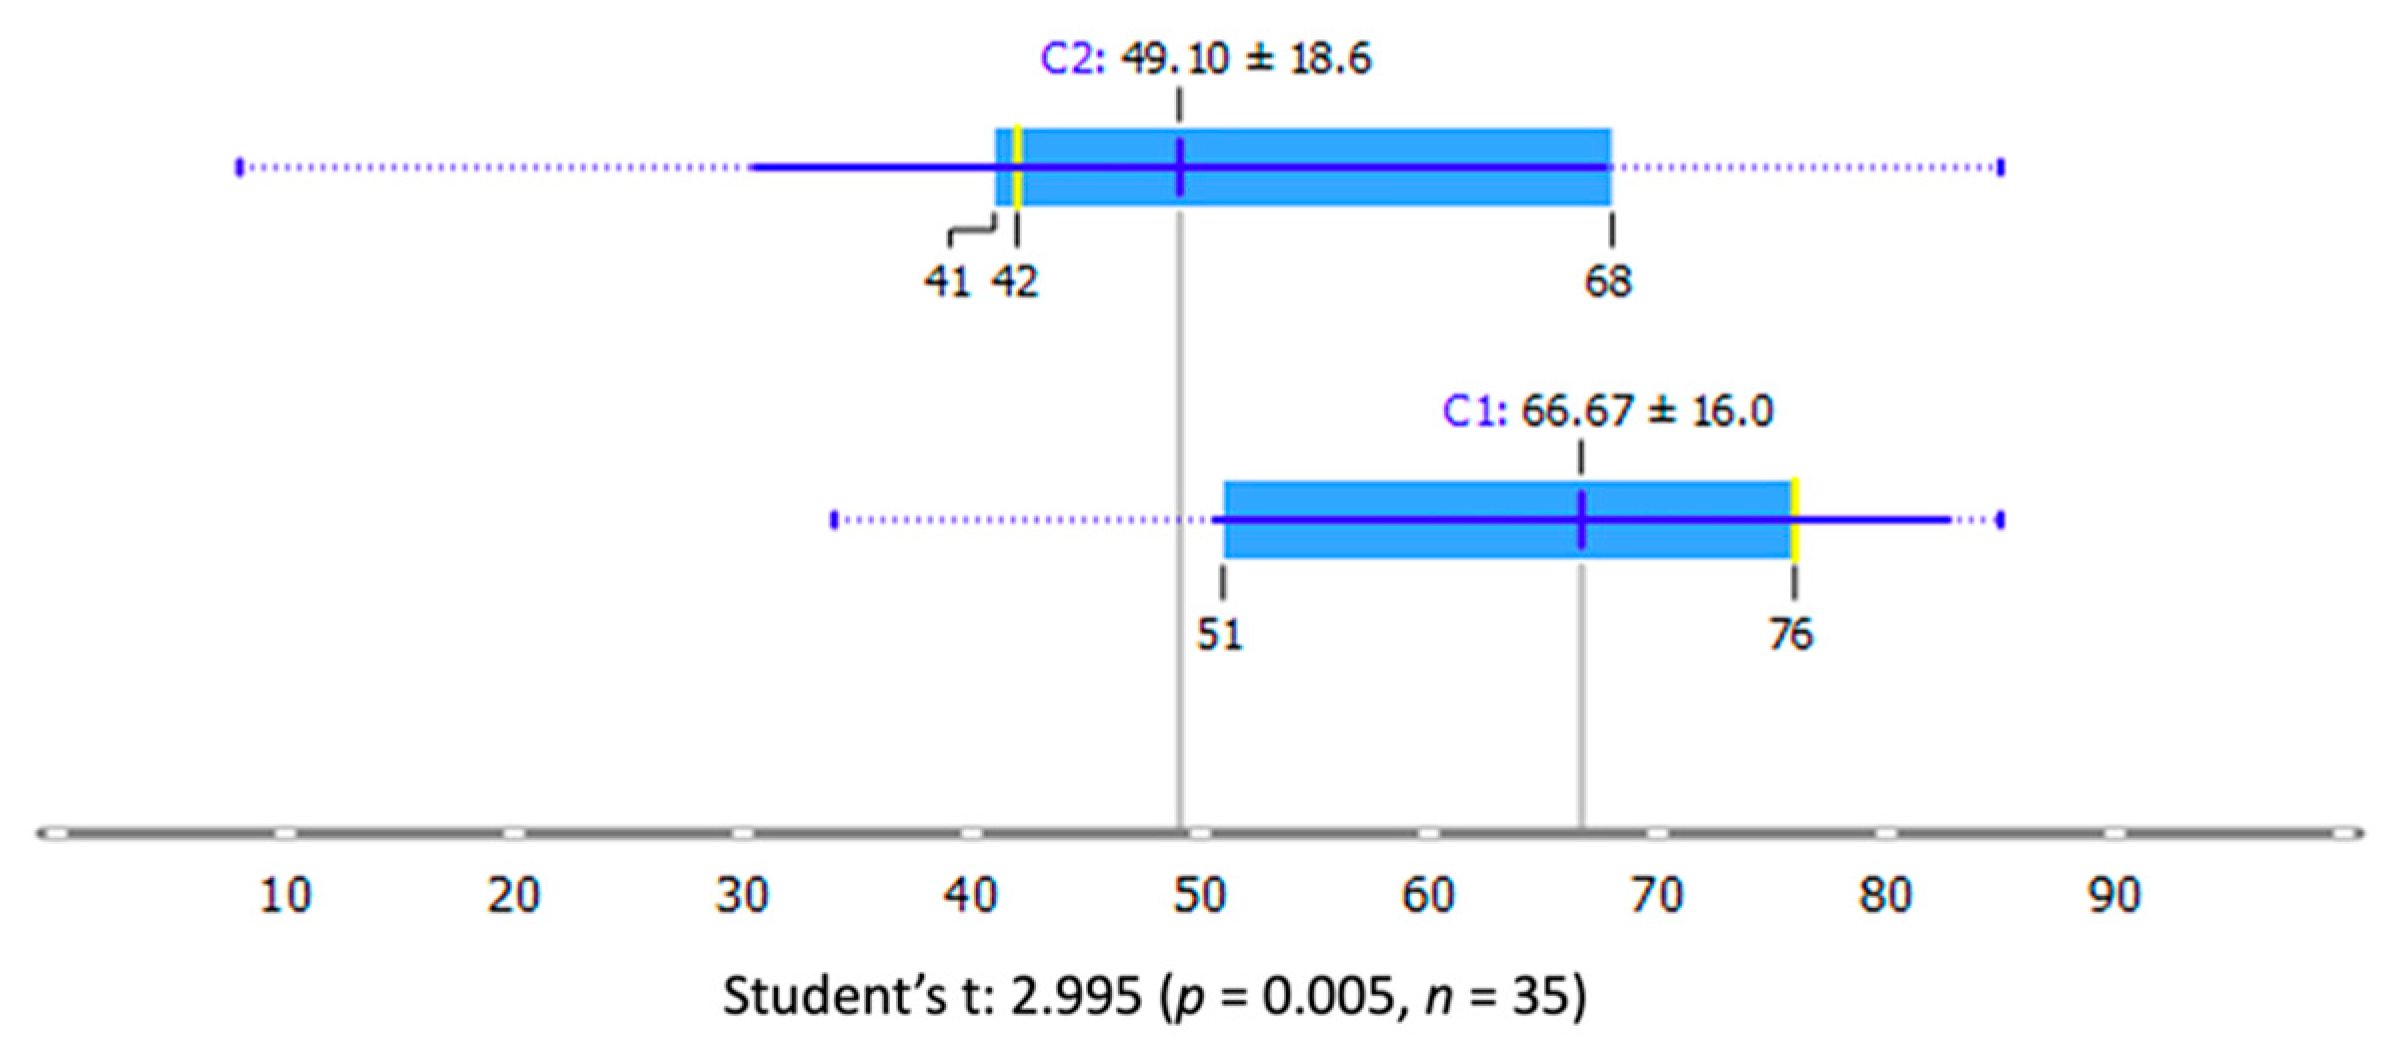
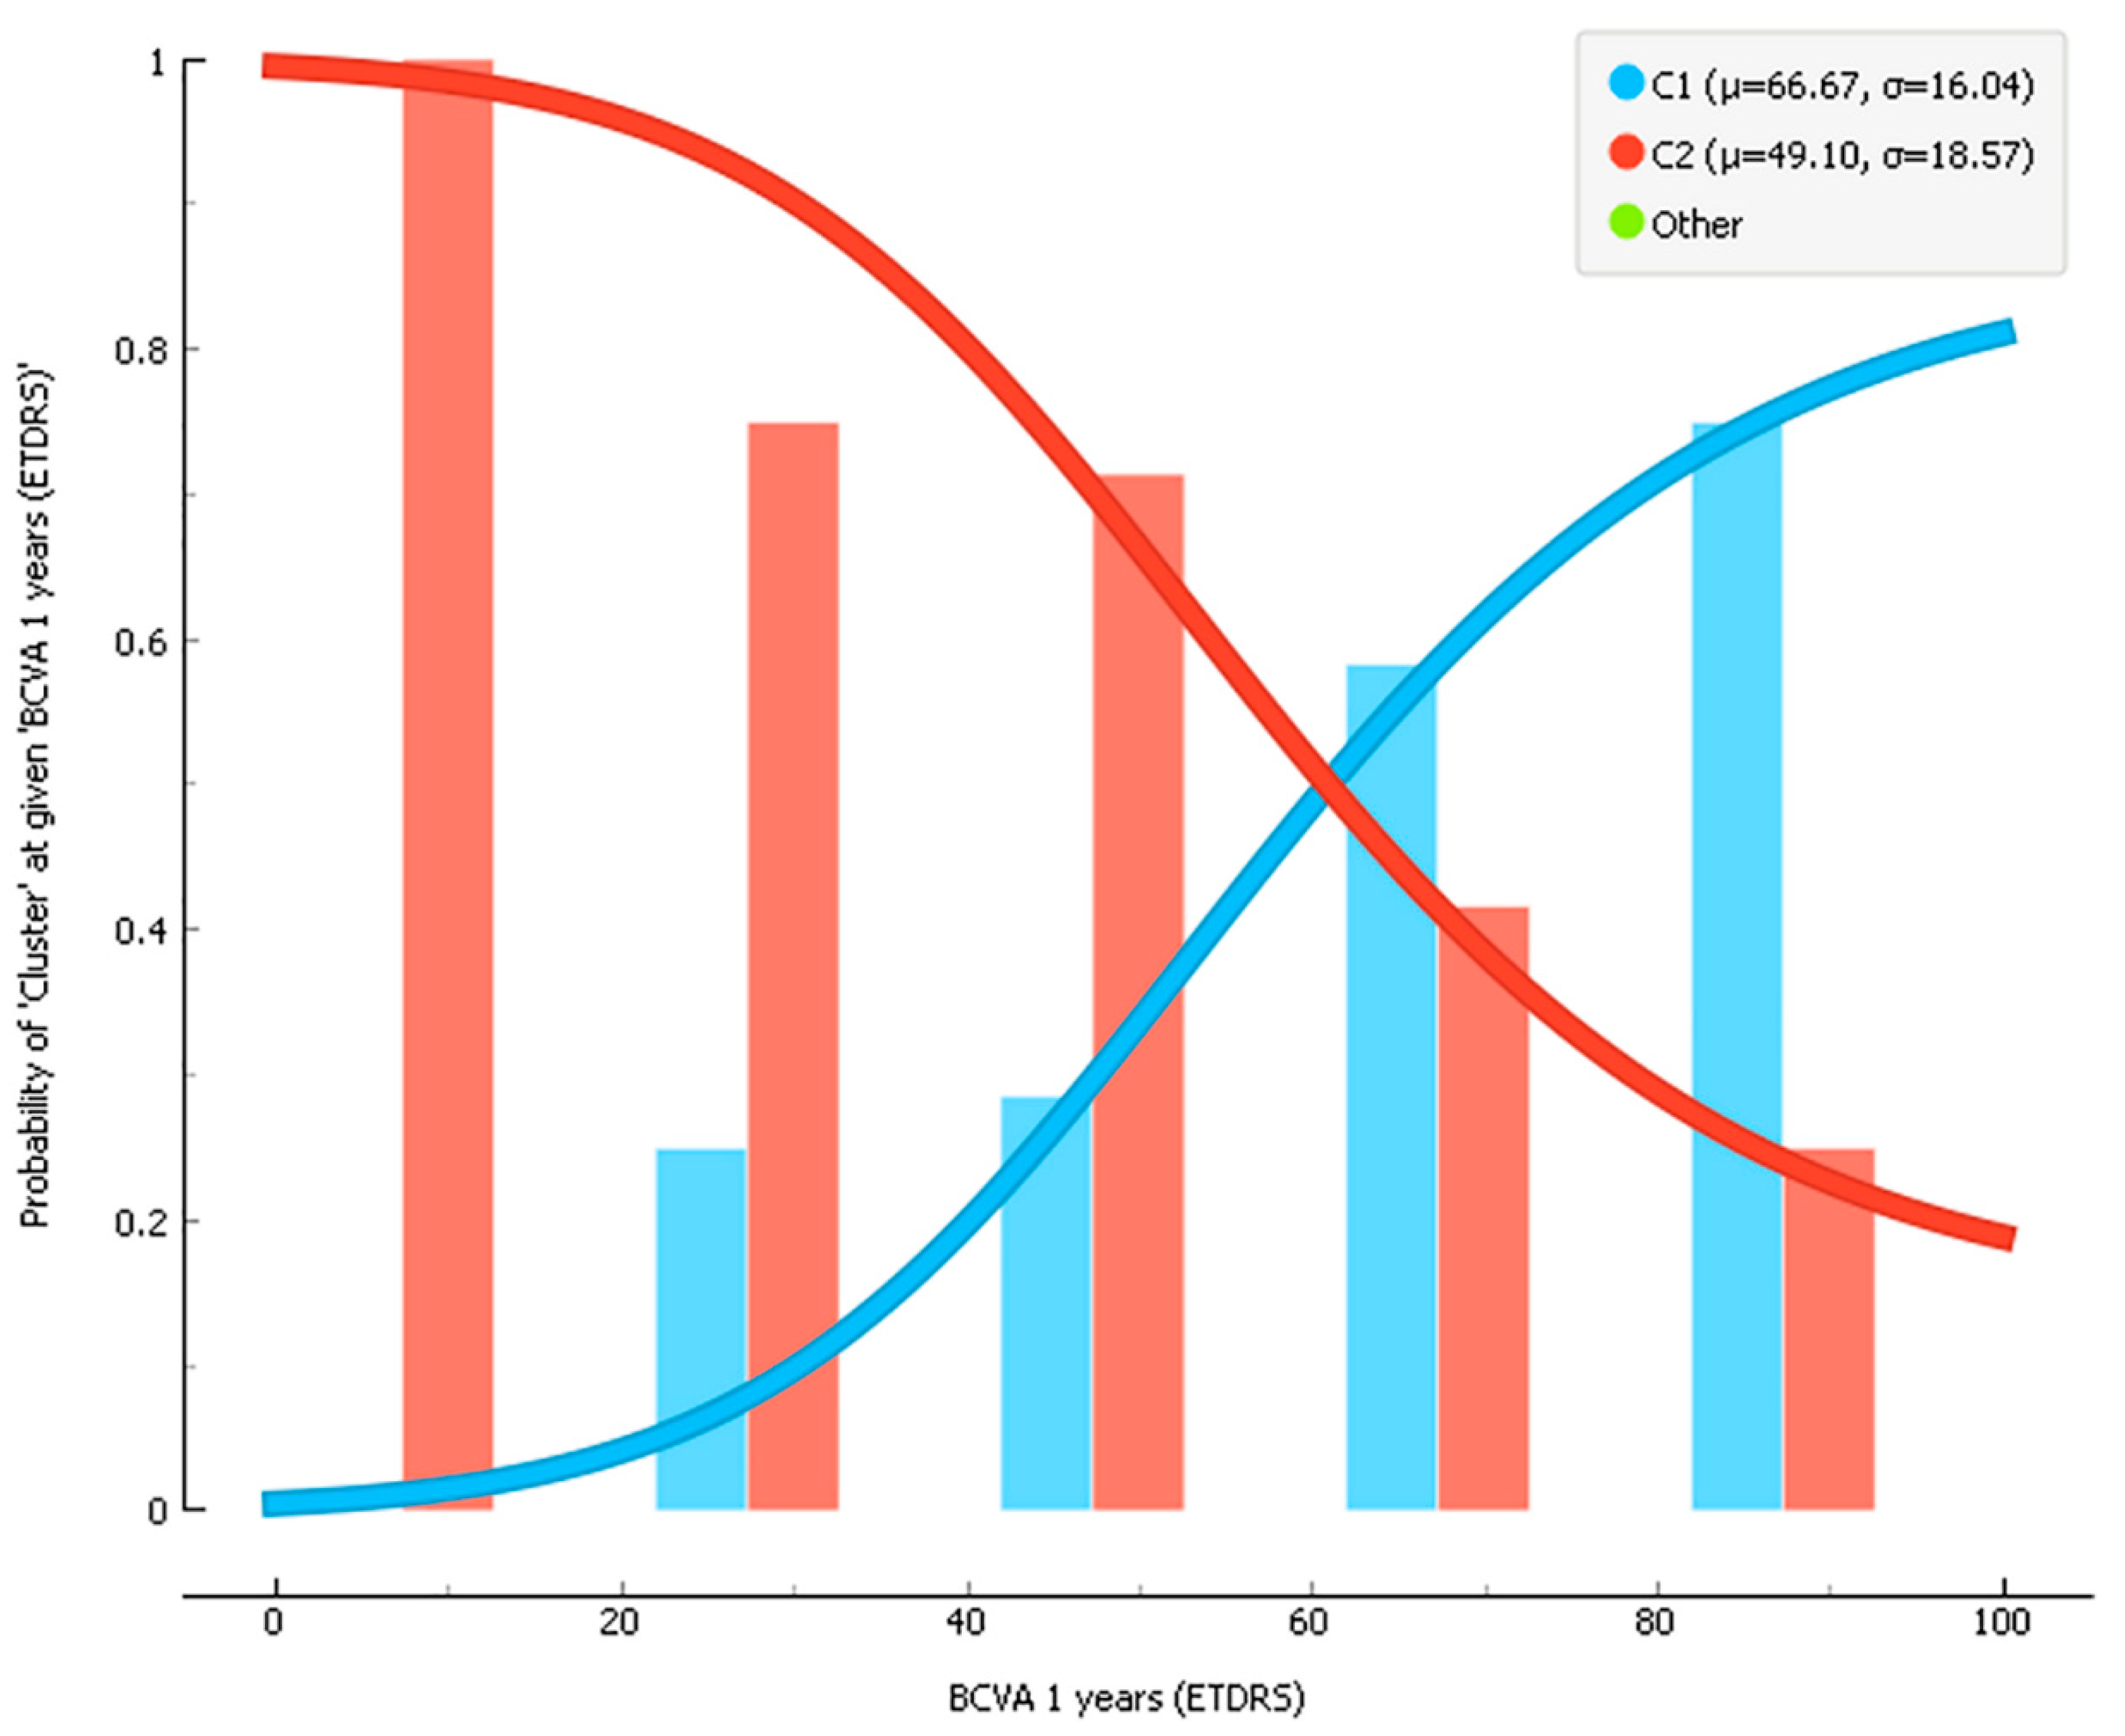
| Superficial + Deep Images | 66.67 (16.00) | 49.10 (18.60) | 0.005 ** | |
| VGG-16 | Superficial Images | 62.29 (15.90) | 52.86 (20.80) | 0.139 |
| Deep Images | 59.96 (17.6) | 43.29 (21.40) | 0.092 | |
| Superficial + Deep Images | 63.85 (15.40) | 52.36 (20.50) | 0.070 | |
| VGG-19 | Superficial Images | 67.80 (11.90) | 52.16 (20.20) | 0.008 ** |
| Deep Images | 60.50 (18.20) | 45.44 (19.20) | 0.060 | |
| Superficial + Deep Images | 59.92 (14.00) | 54.91 (21.70) | 0.416 | |
| SqueezeNet | Superficial Images | 59.03 (18.00) | 45.00 (22.40) | 0.196 |
| Deep Images | - | - | - | |
| Superficial + Deep Images | 66.90 (13.4) | 52.52 (20.10) | 0.021 * |
Publisher’s Note: MDPI stays neutral with regard to jurisdictional claims in published maps and institutional affiliations. |
© 2021 by the authors. Licensee MDPI, Basel, Switzerland. This article is an open access article distributed under the terms and conditions of the Creative Commons Attribution (CC BY) license (https://creativecommons.org/licenses/by/4.0/).
Share and Cite
Rizzo, S.; Savastano, A.; Lenkowicz, J.; Savastano, M.C.; Boldrini, L.; Bacherini, D.; Falsini, B.; Valentini, V. Artificial Intelligence and OCT Angiography in Full Thickness Macular Hole. New Developments for Personalized Medicine. Diagnostics 2021, 11, 2319. https://doi.org/10.3390/diagnostics11122319
Rizzo S, Savastano A, Lenkowicz J, Savastano MC, Boldrini L, Bacherini D, Falsini B, Valentini V. Artificial Intelligence and OCT Angiography in Full Thickness Macular Hole. New Developments for Personalized Medicine. Diagnostics. 2021; 11(12):2319. https://doi.org/10.3390/diagnostics11122319
Chicago/Turabian StyleRizzo, Stanislao, Alfonso Savastano, Jacopo Lenkowicz, Maria Cristina Savastano, Luca Boldrini, Daniela Bacherini, Benedetto Falsini, and Vincenzo Valentini. 2021. "Artificial Intelligence and OCT Angiography in Full Thickness Macular Hole. New Developments for Personalized Medicine" Diagnostics 11, no. 12: 2319. https://doi.org/10.3390/diagnostics11122319