The proposed Multi-Level Deep Convolutional Neural Network (ML-DCNN) was tested on the personal laptop with an Intel Core i7, 2.60 GHz CPU with 8GB RAM in the MATLAB R2018a and different resultant statistical values were calculated.
Dataset Pre-Processing
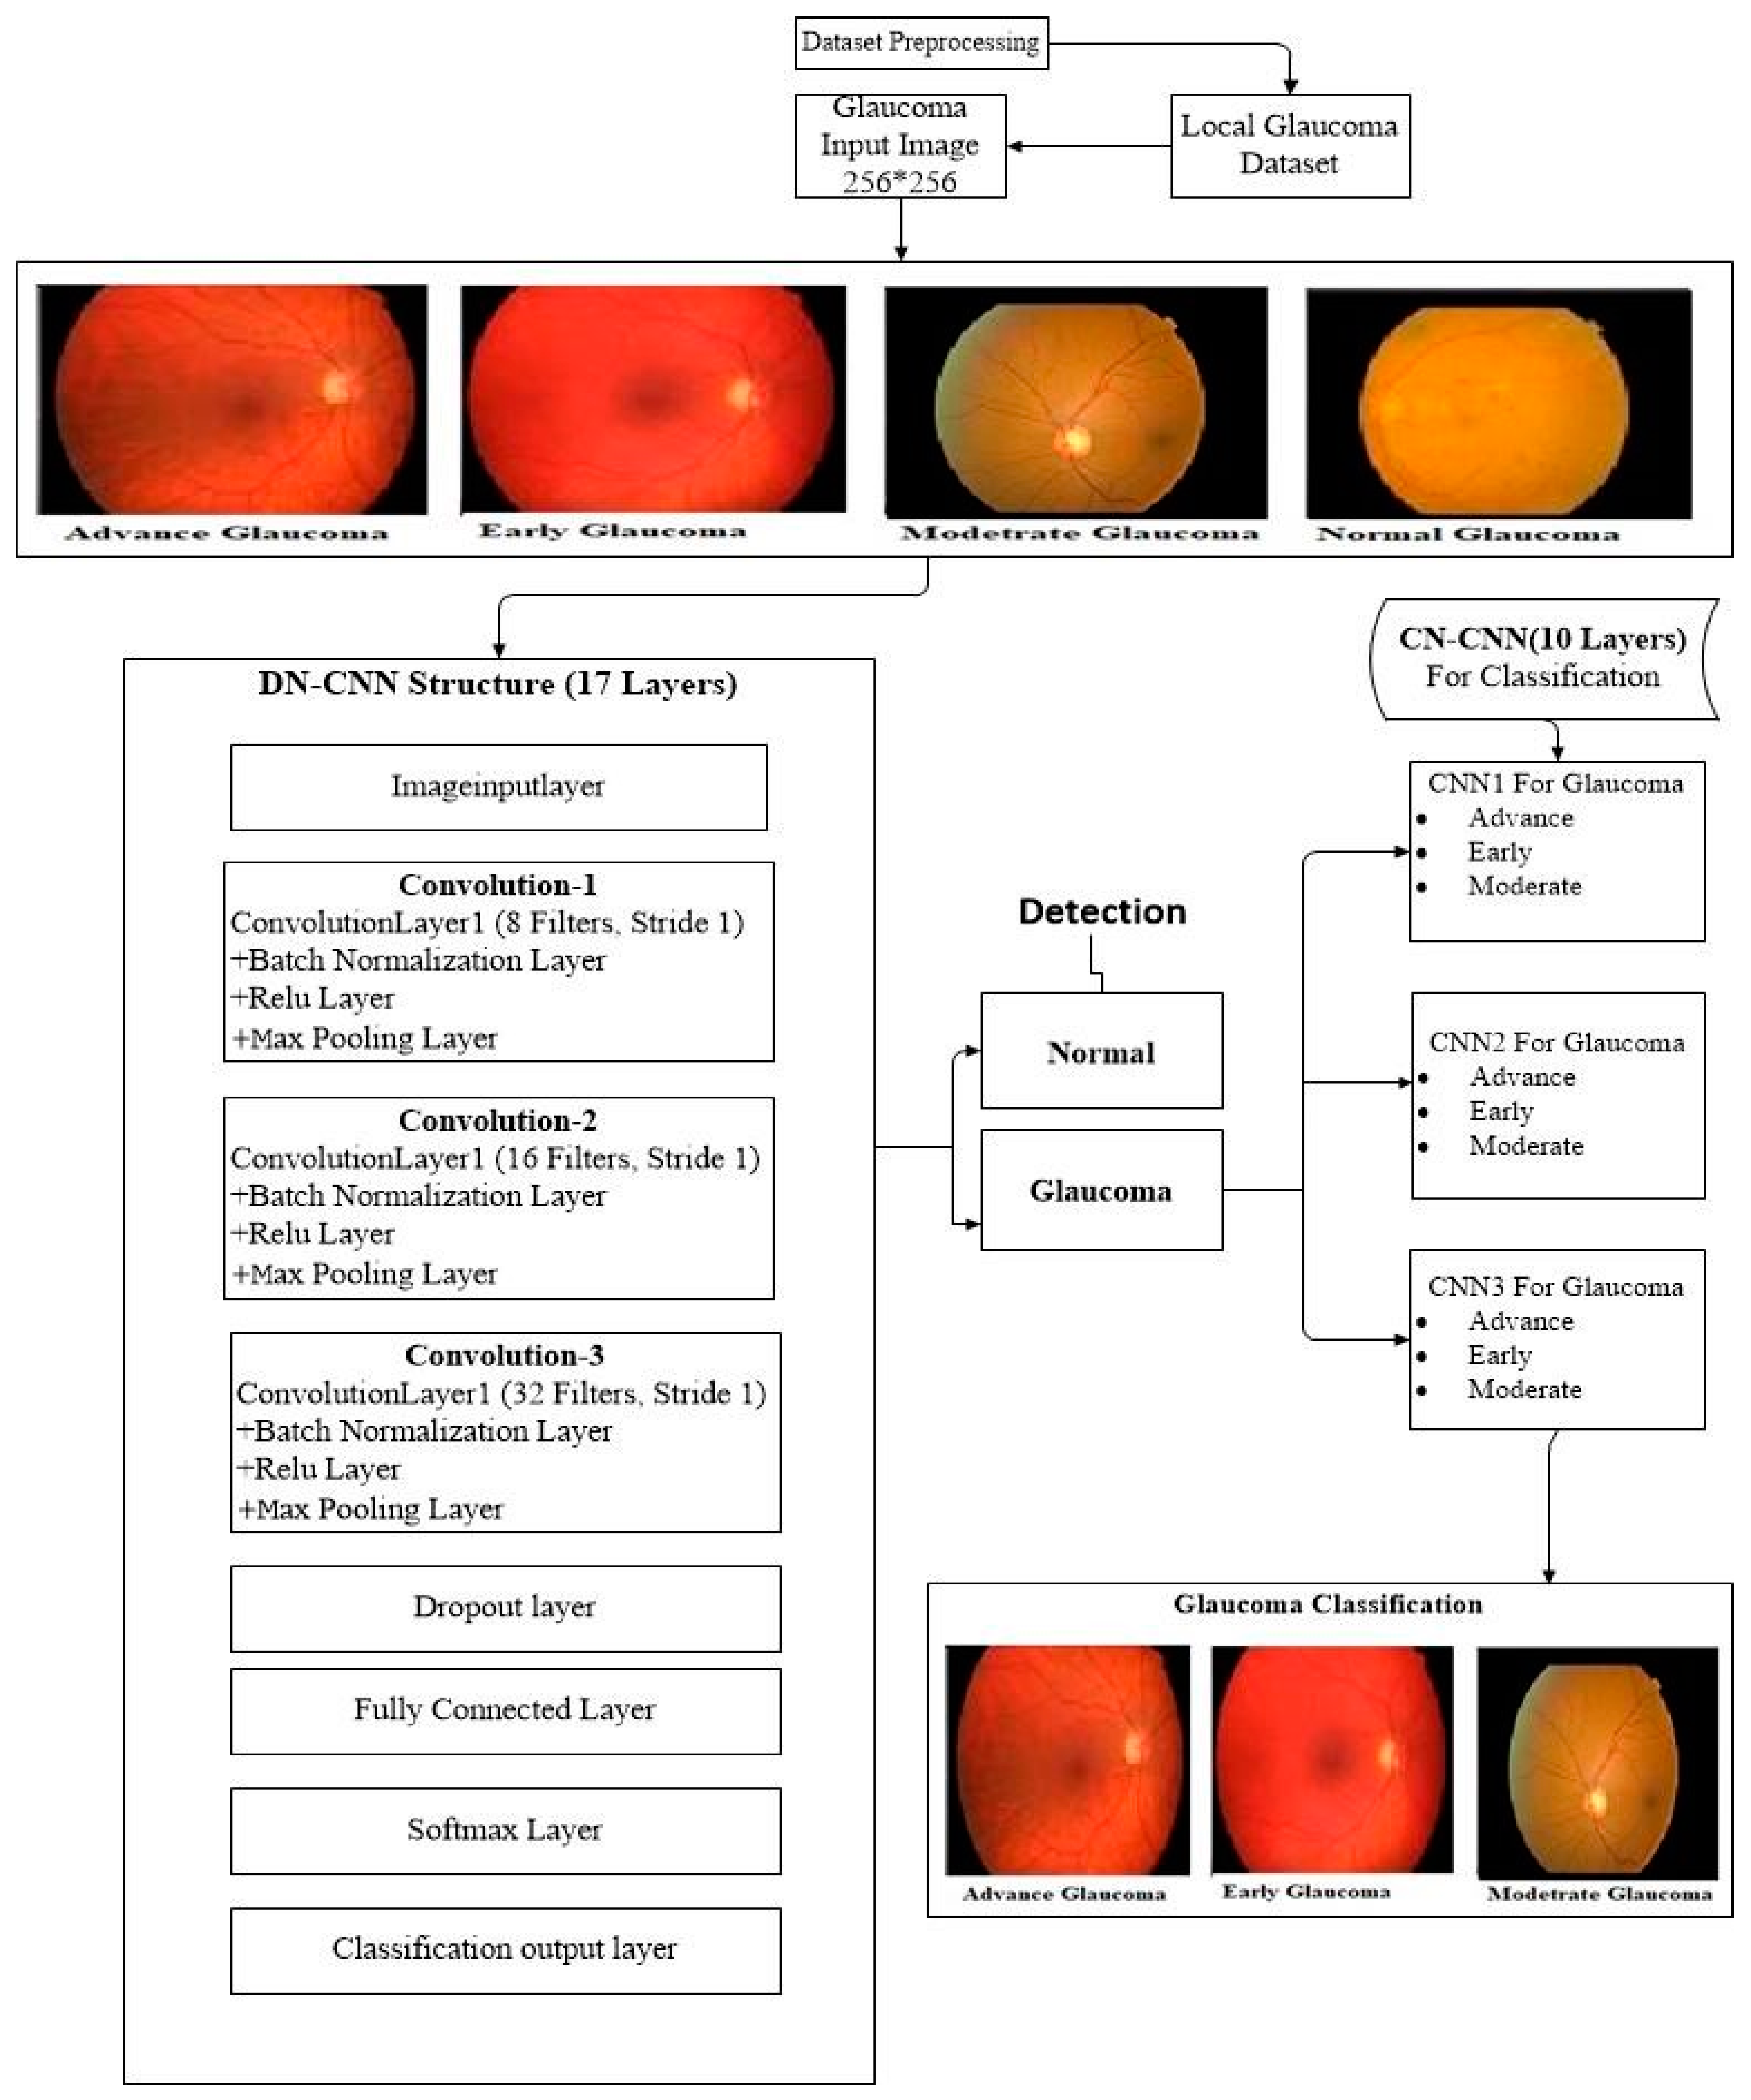
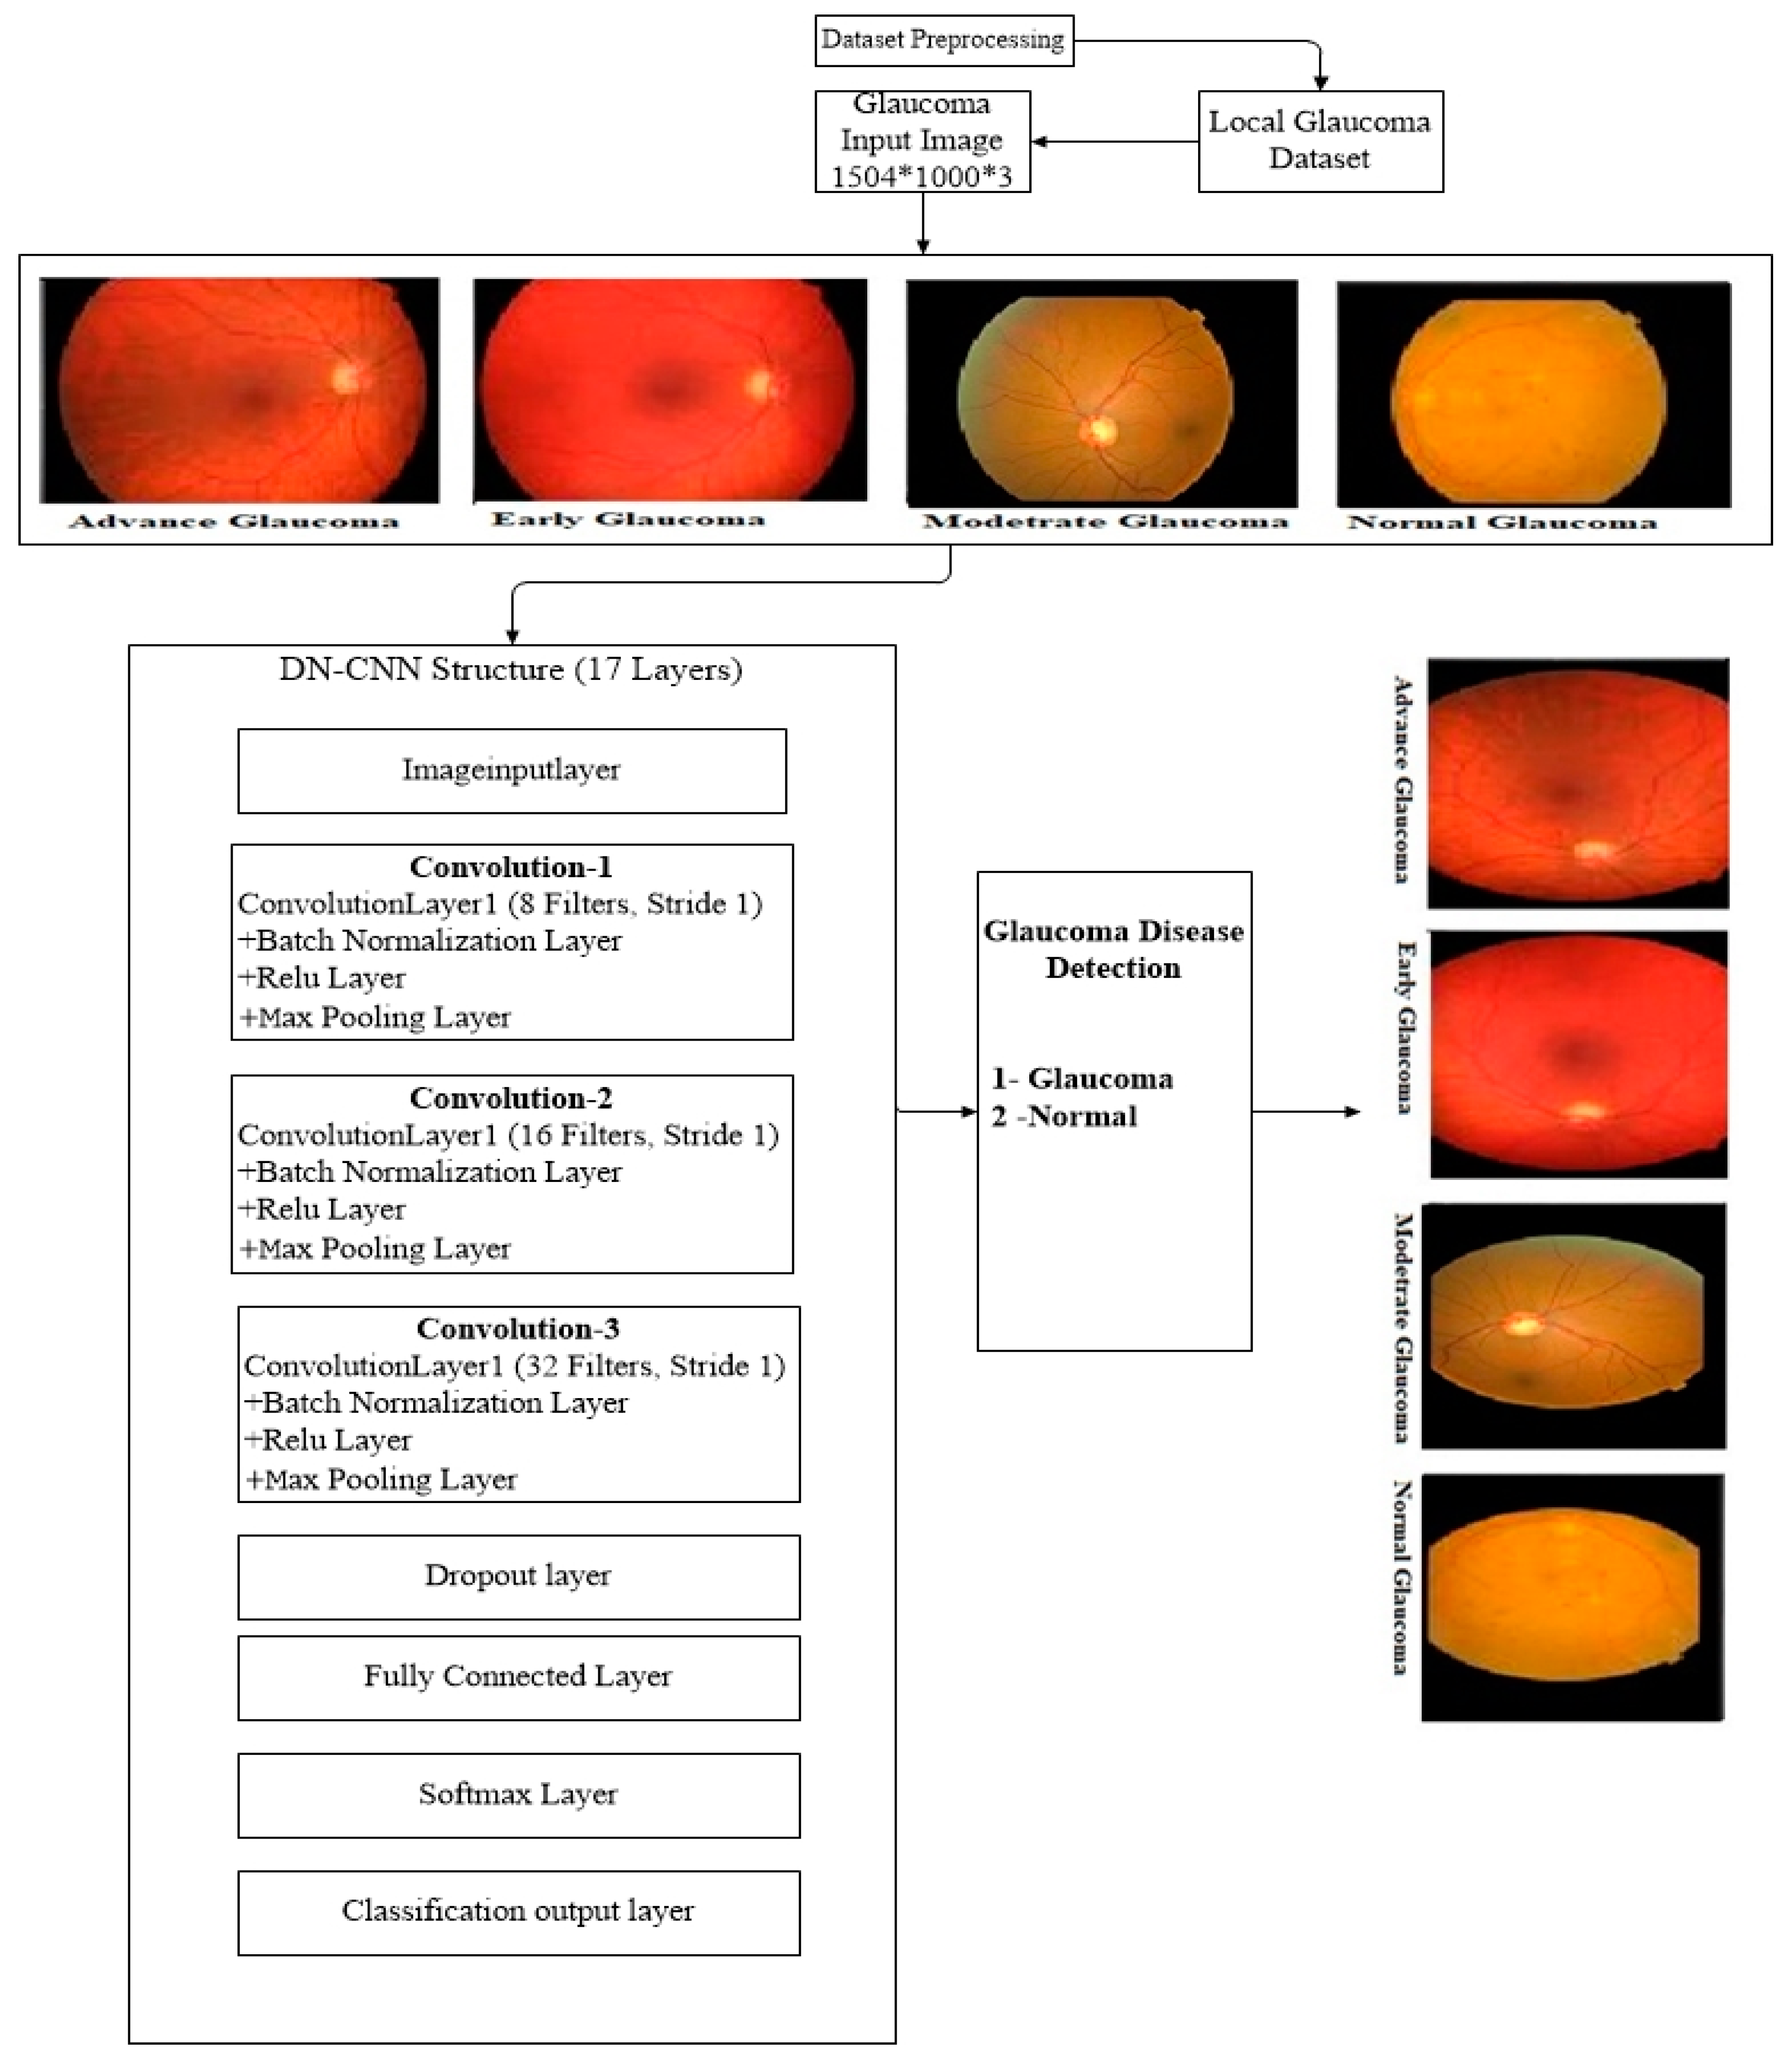
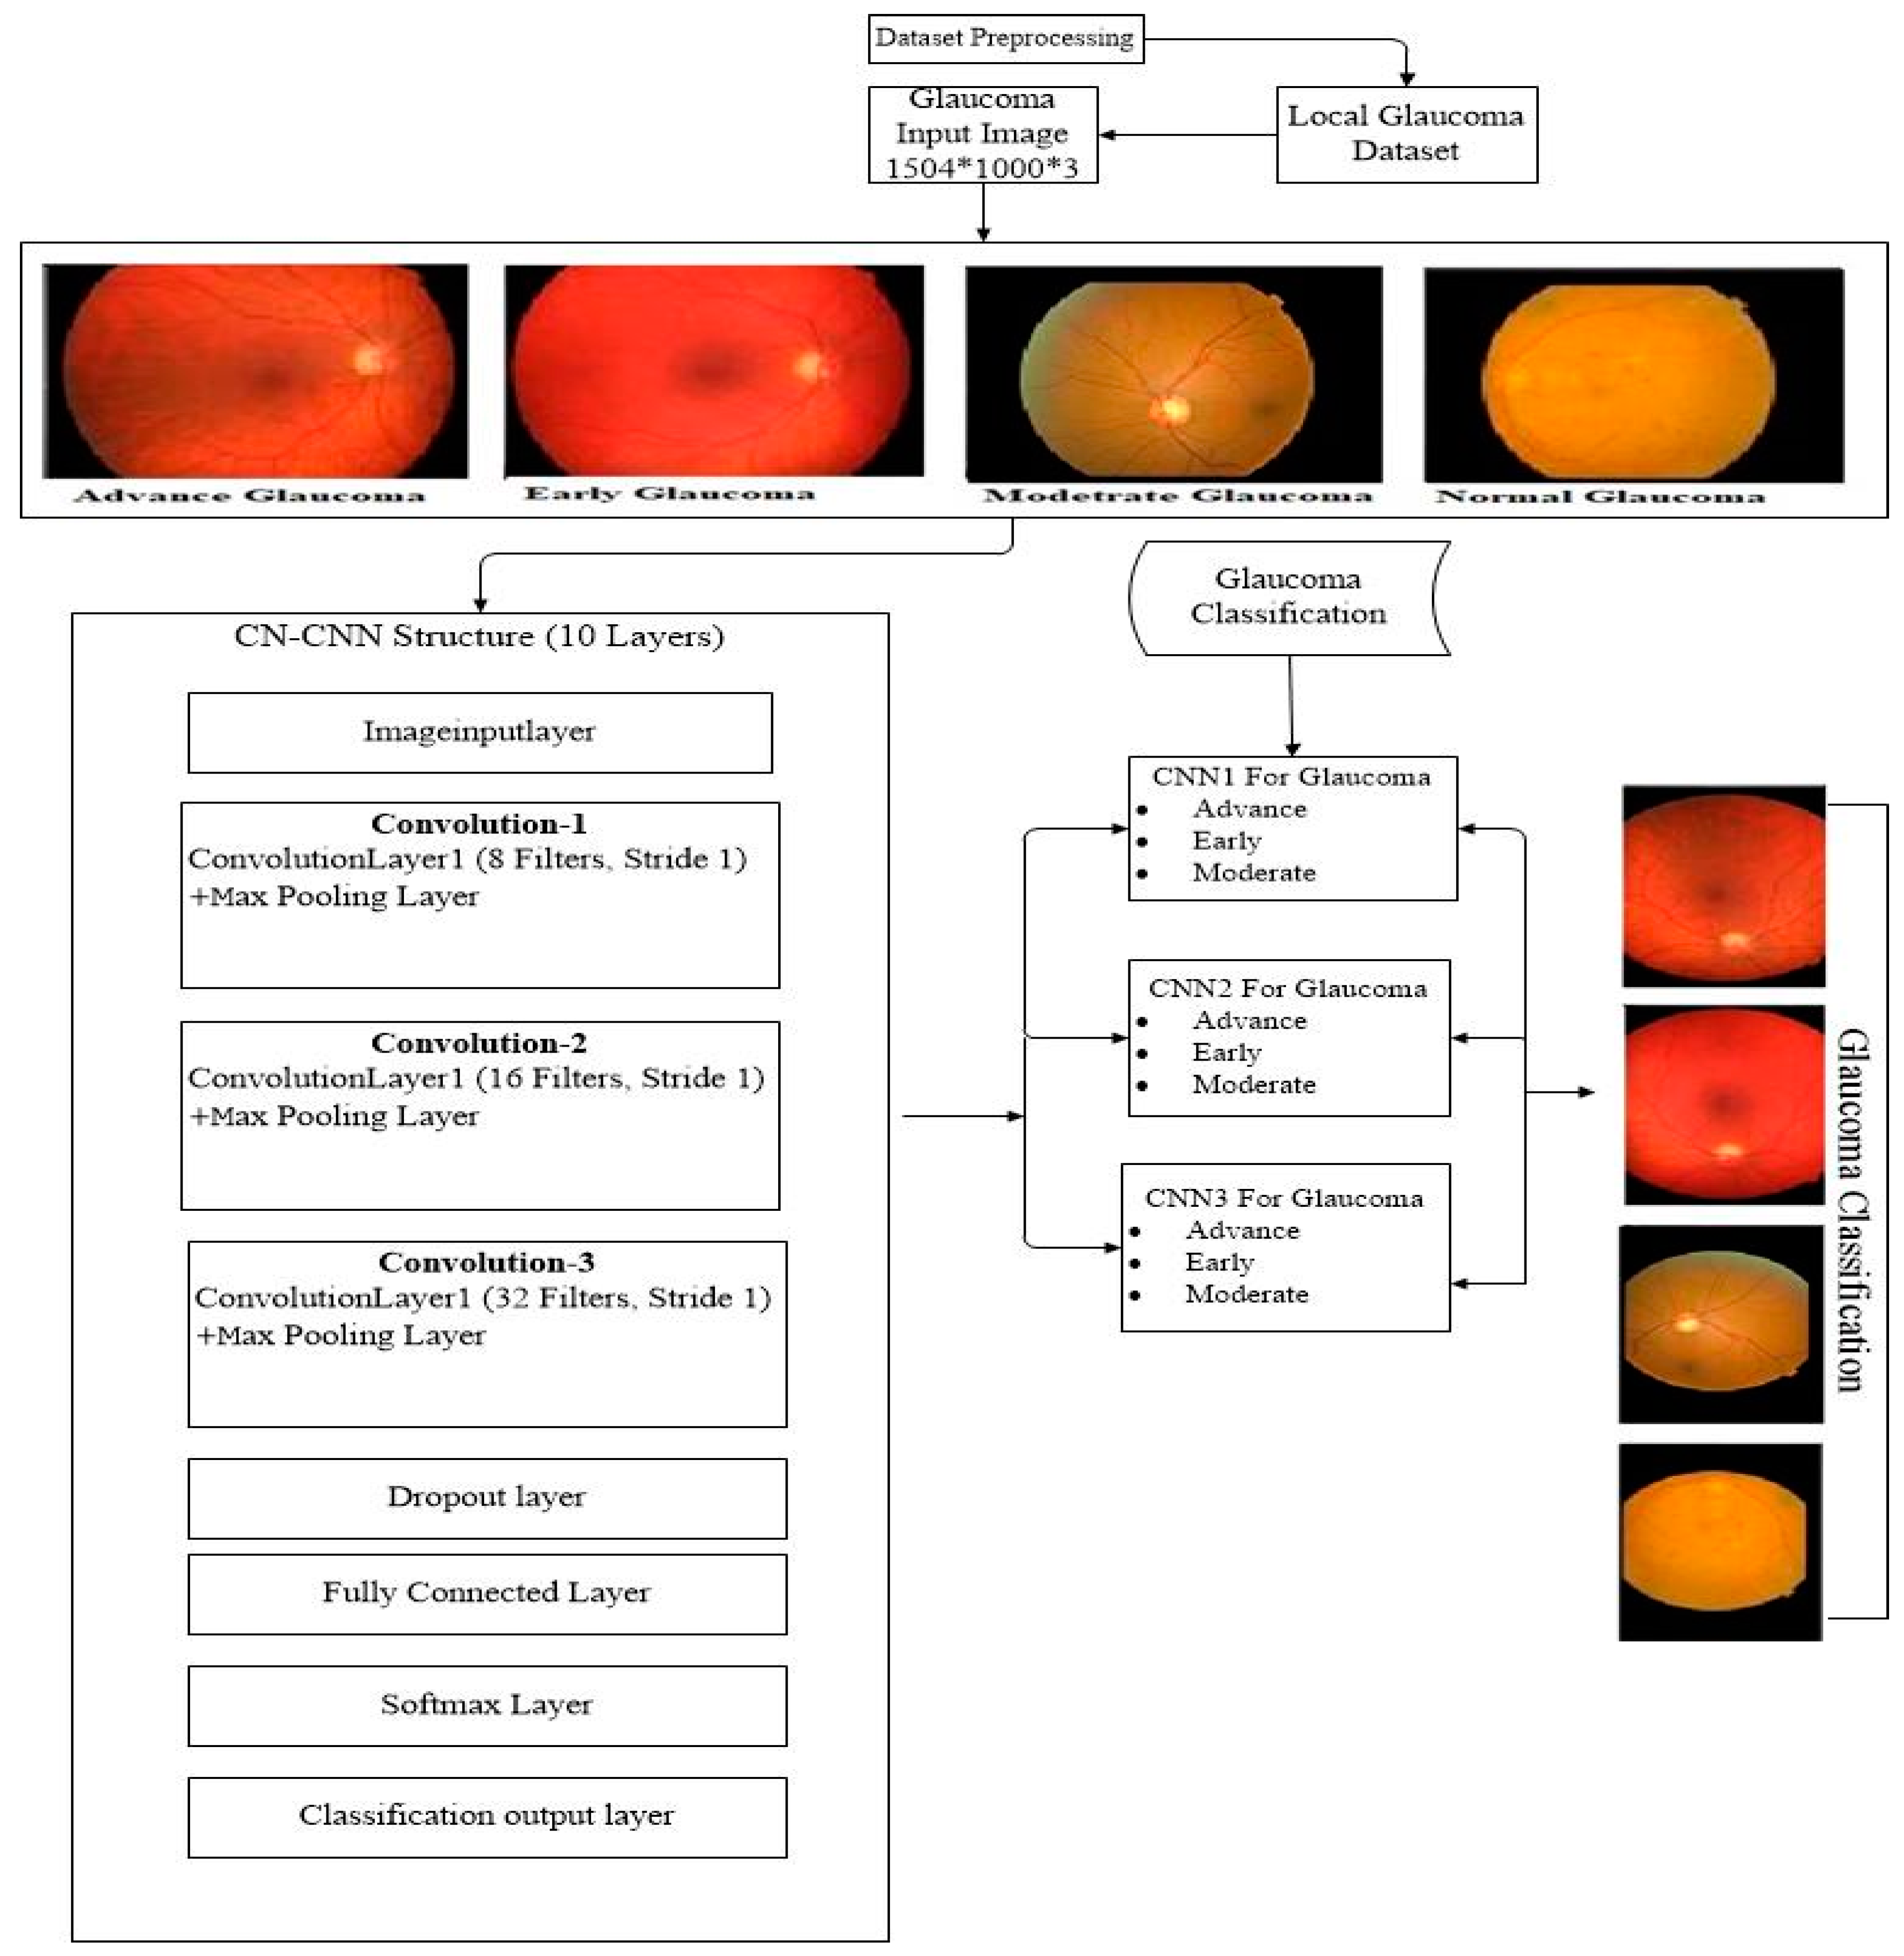
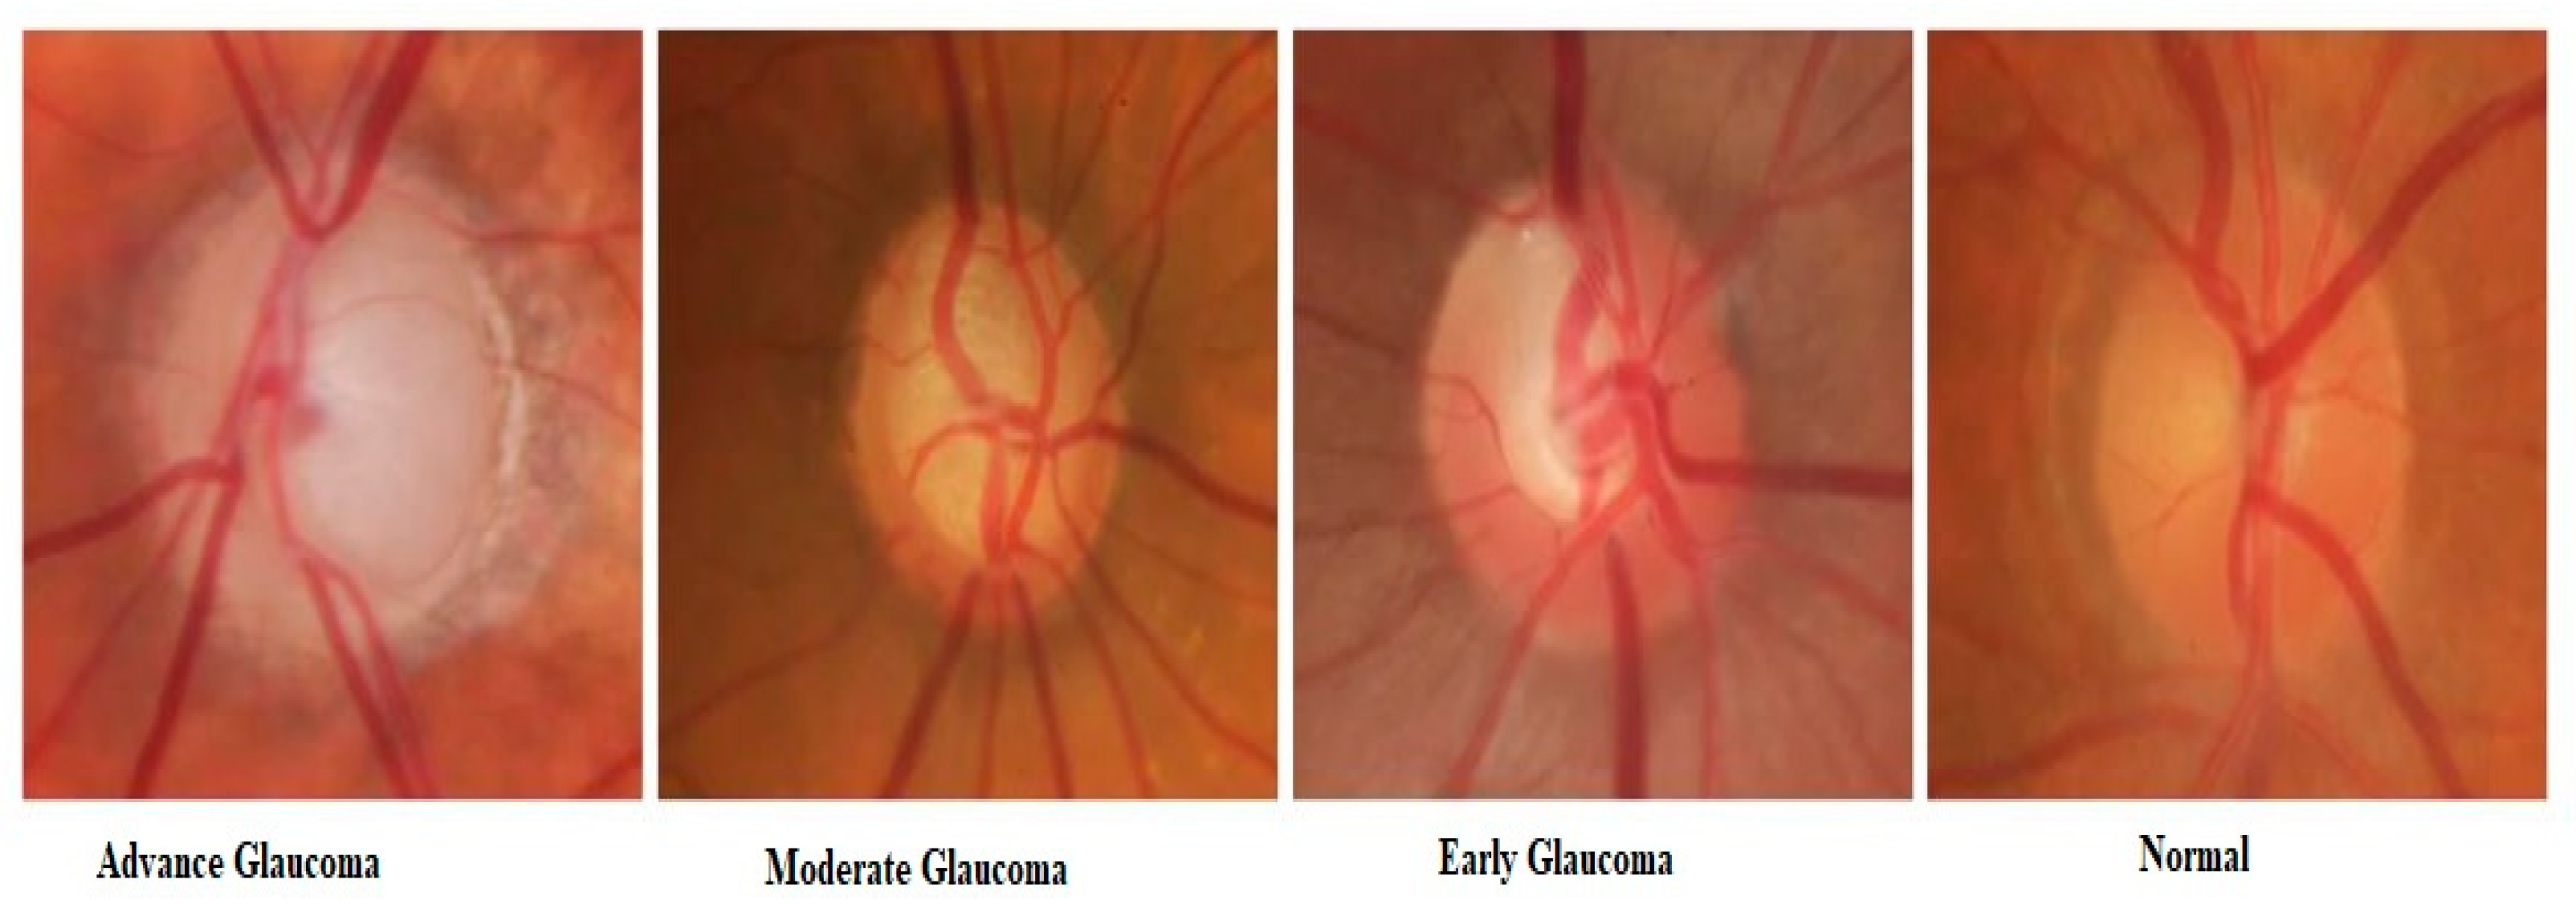
The local retinal glaucoma image dataset is pre-processed by an adaptive histogram equalizer to decrease the amount of noise existing in the images. The local retinal glaucoma dataset images are acquired from different private and public resources in different hospitals. The dataset consists of a total of 1338 retinal images. Each image belongs to one of four classes i.e., Normal, Early Glaucoma, Moderate Glaucoma, Advanced Glaucoma. The dataset is a kind of imbalanced dataset because there are about 79% of images that belong to one class and the remaining 21% of images belong to the remaining three classes. There are 8.96% early glaucoma images, 5.98% moderate glaucoma images, 5.98% advanced glaucoma images, and 79.08% normal images (with no glaucoma). The detail of the dataset and its distribution into training, validation, and testing subsets has been shown in
Table 3. To do training and testing on the given dataset, the dataset of 803 images is divided into four categories as advance, early, moderate, and normal with 50, 75, 50, and 628 images, respectively, as shown in the third column of
Table 4. The dataset is divided into test, training, and validation datasets. The ratio of testing, validation, and training dataset is 23%, 17%, and 60%, respectively, as shown in
Table 4. Three expert clinical assistants were requested to make a difference between four stages of glaucoma eye disease as shown in
Figure 5. The majority of voting was used to assign labels to the images where experts disagreed.
The results of the proposed ML-DCNN are calculated with the help of the following statistical equations.
Here, TP denotes true positive that is correctly identified between glaucoma images, and TN explains the true negative that identified wrongly classified images. Whereas, false positive (FP) and false-negative (FN) denotes the correctly and wrongly identified classes, as shown in
Figure 6.
The performance of these parametric equations is calculated on 300 test retinal glaucoma disease images based on a ground truth and proposed ML-DCNN model, as shown in
Table 5 and
Figure 6.
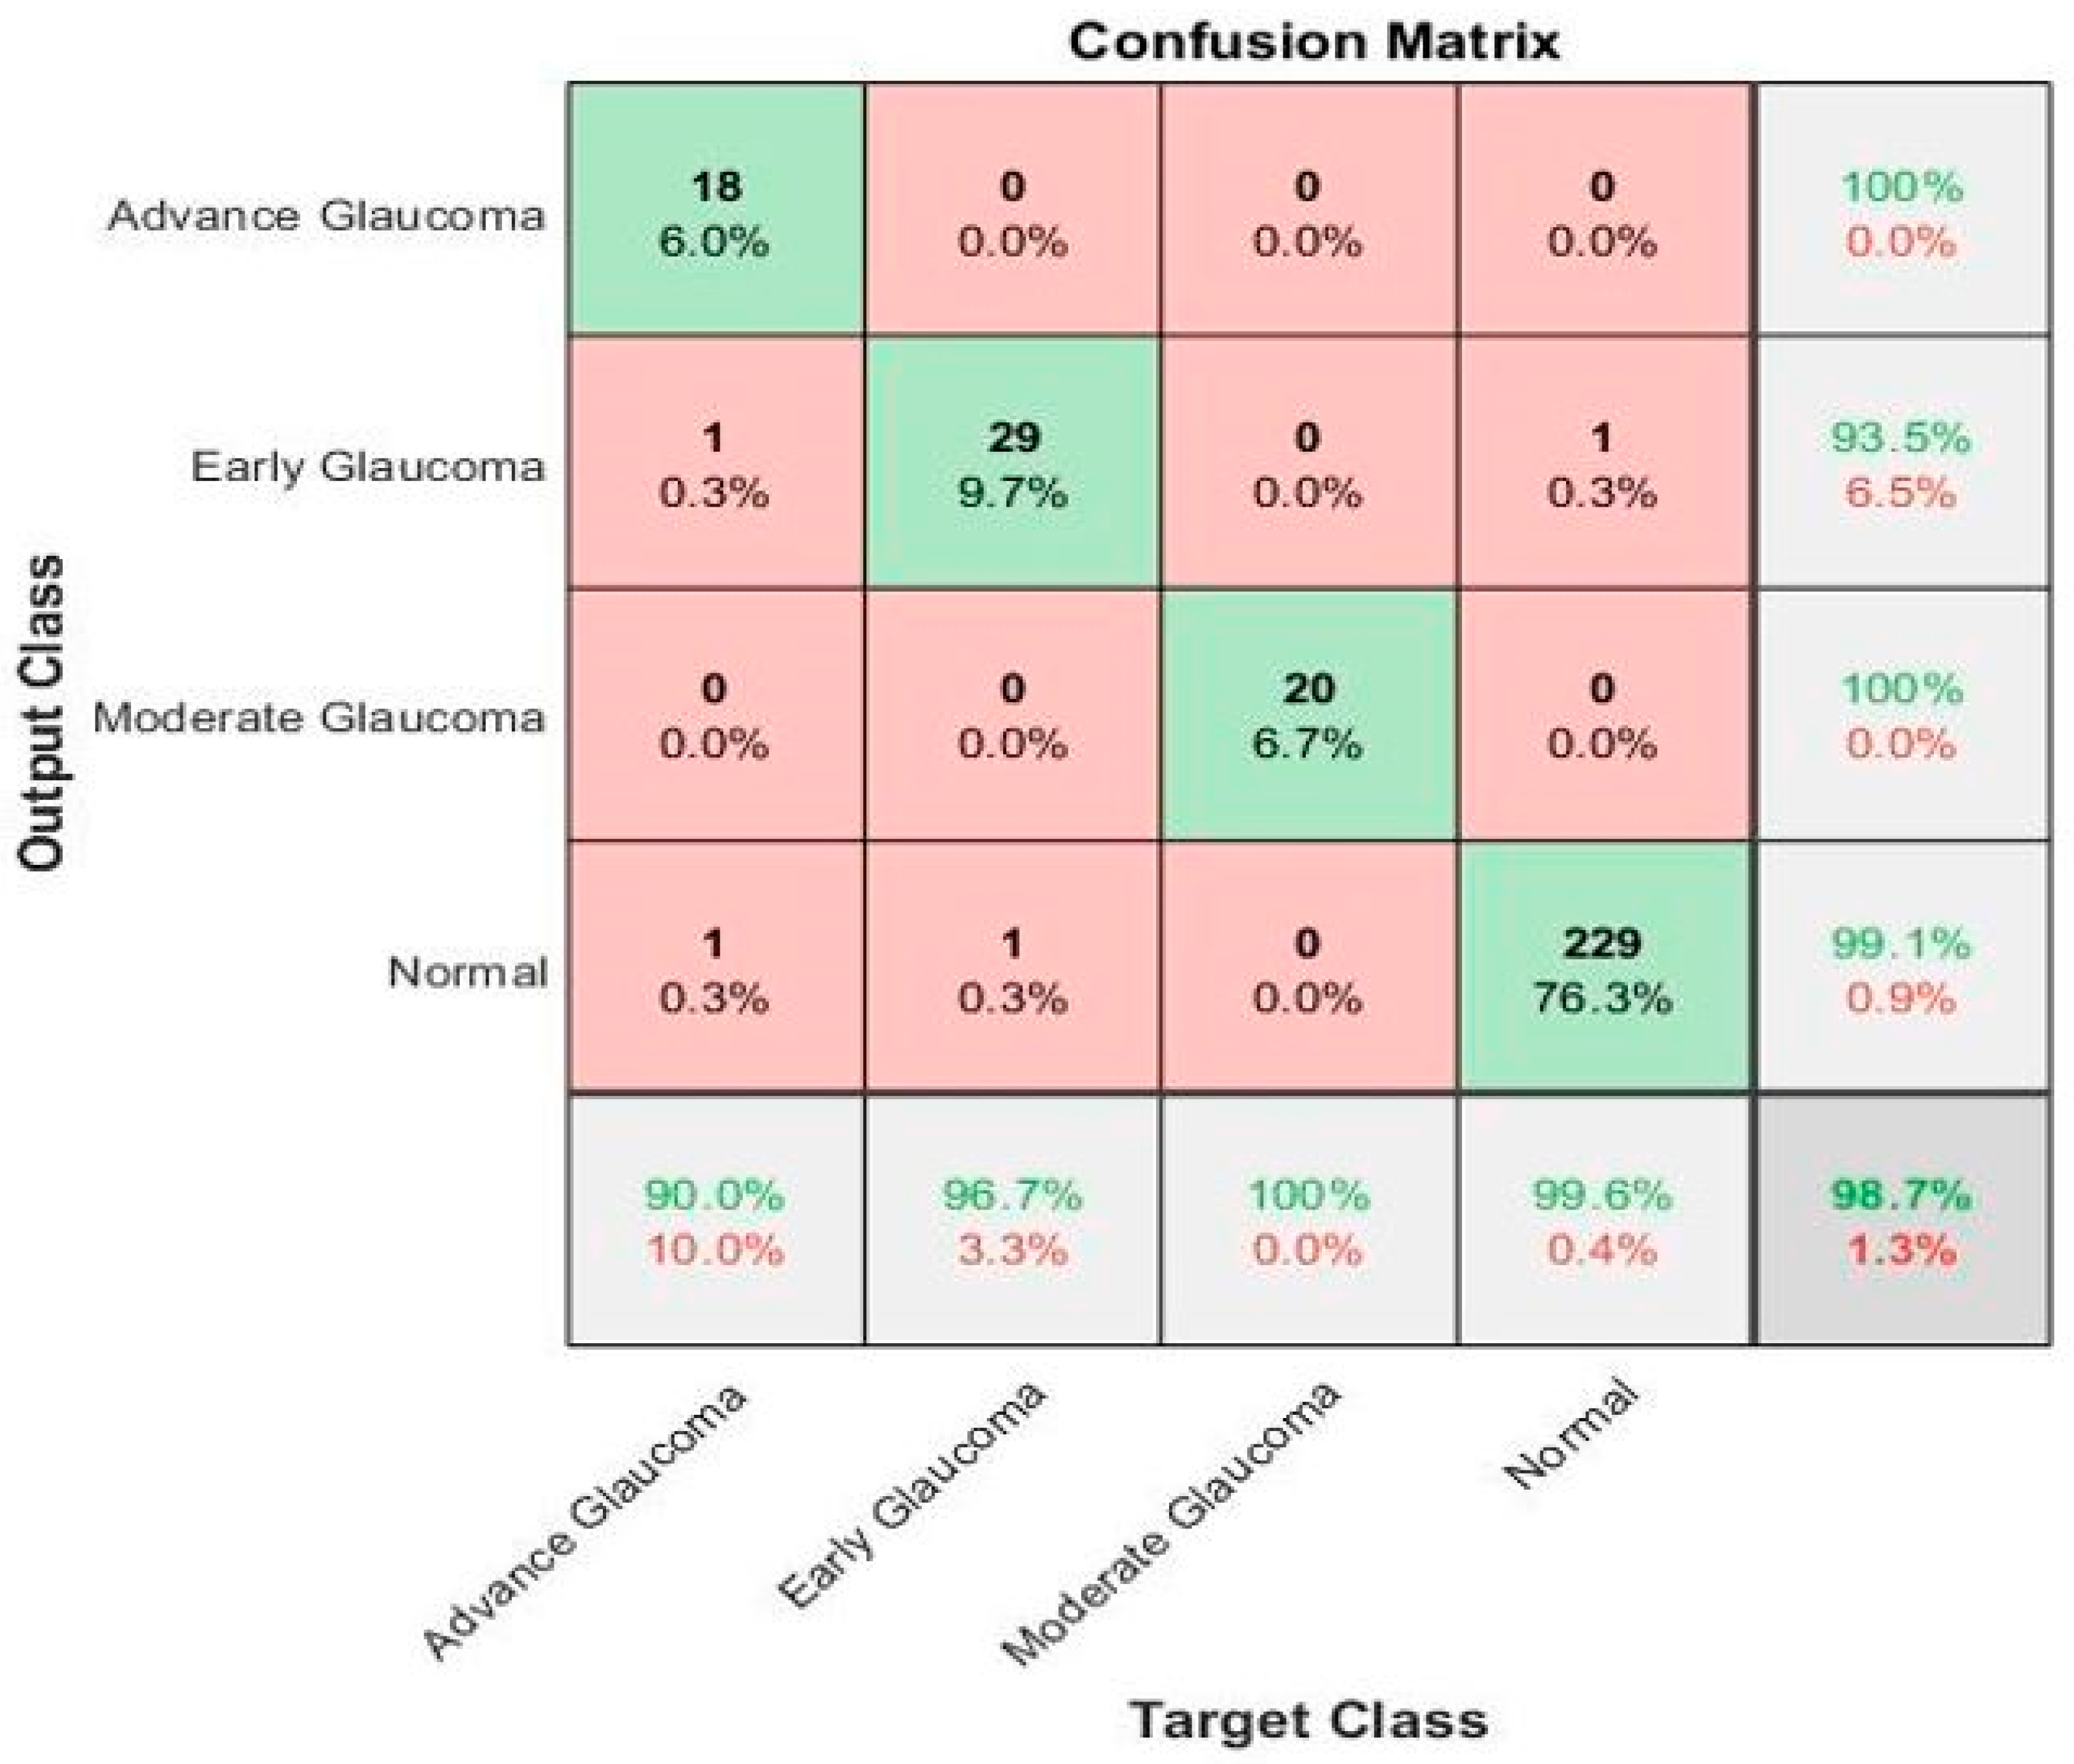
The confusion matrix in
Figure 6 shows the results of the recognition rate of different classes on the testing dataset. The rows show the predicted values of the classes and the columns explained the true class values. The diagonal cells show the total number of observations that are correctly classified. The off-diagonal cells explain the incorrect classification of observations. Each cell includes the total number of observations and their percentage. The predicted values’ percentage that is correctly and incorrectly classified for each class is presented in the far-right column of the confusion matrix. These values are also called the precision (positive predictive value) and false discovery rate, correspondingly. The correct and incorrect classification percentages of all the classes are explained in the row at the bottom end. These values are frequently called the recall (or true positive rate) and false negative rate, correspondingly. The overall accuracy is shown in the bottom-right cell of the confusion matrix.
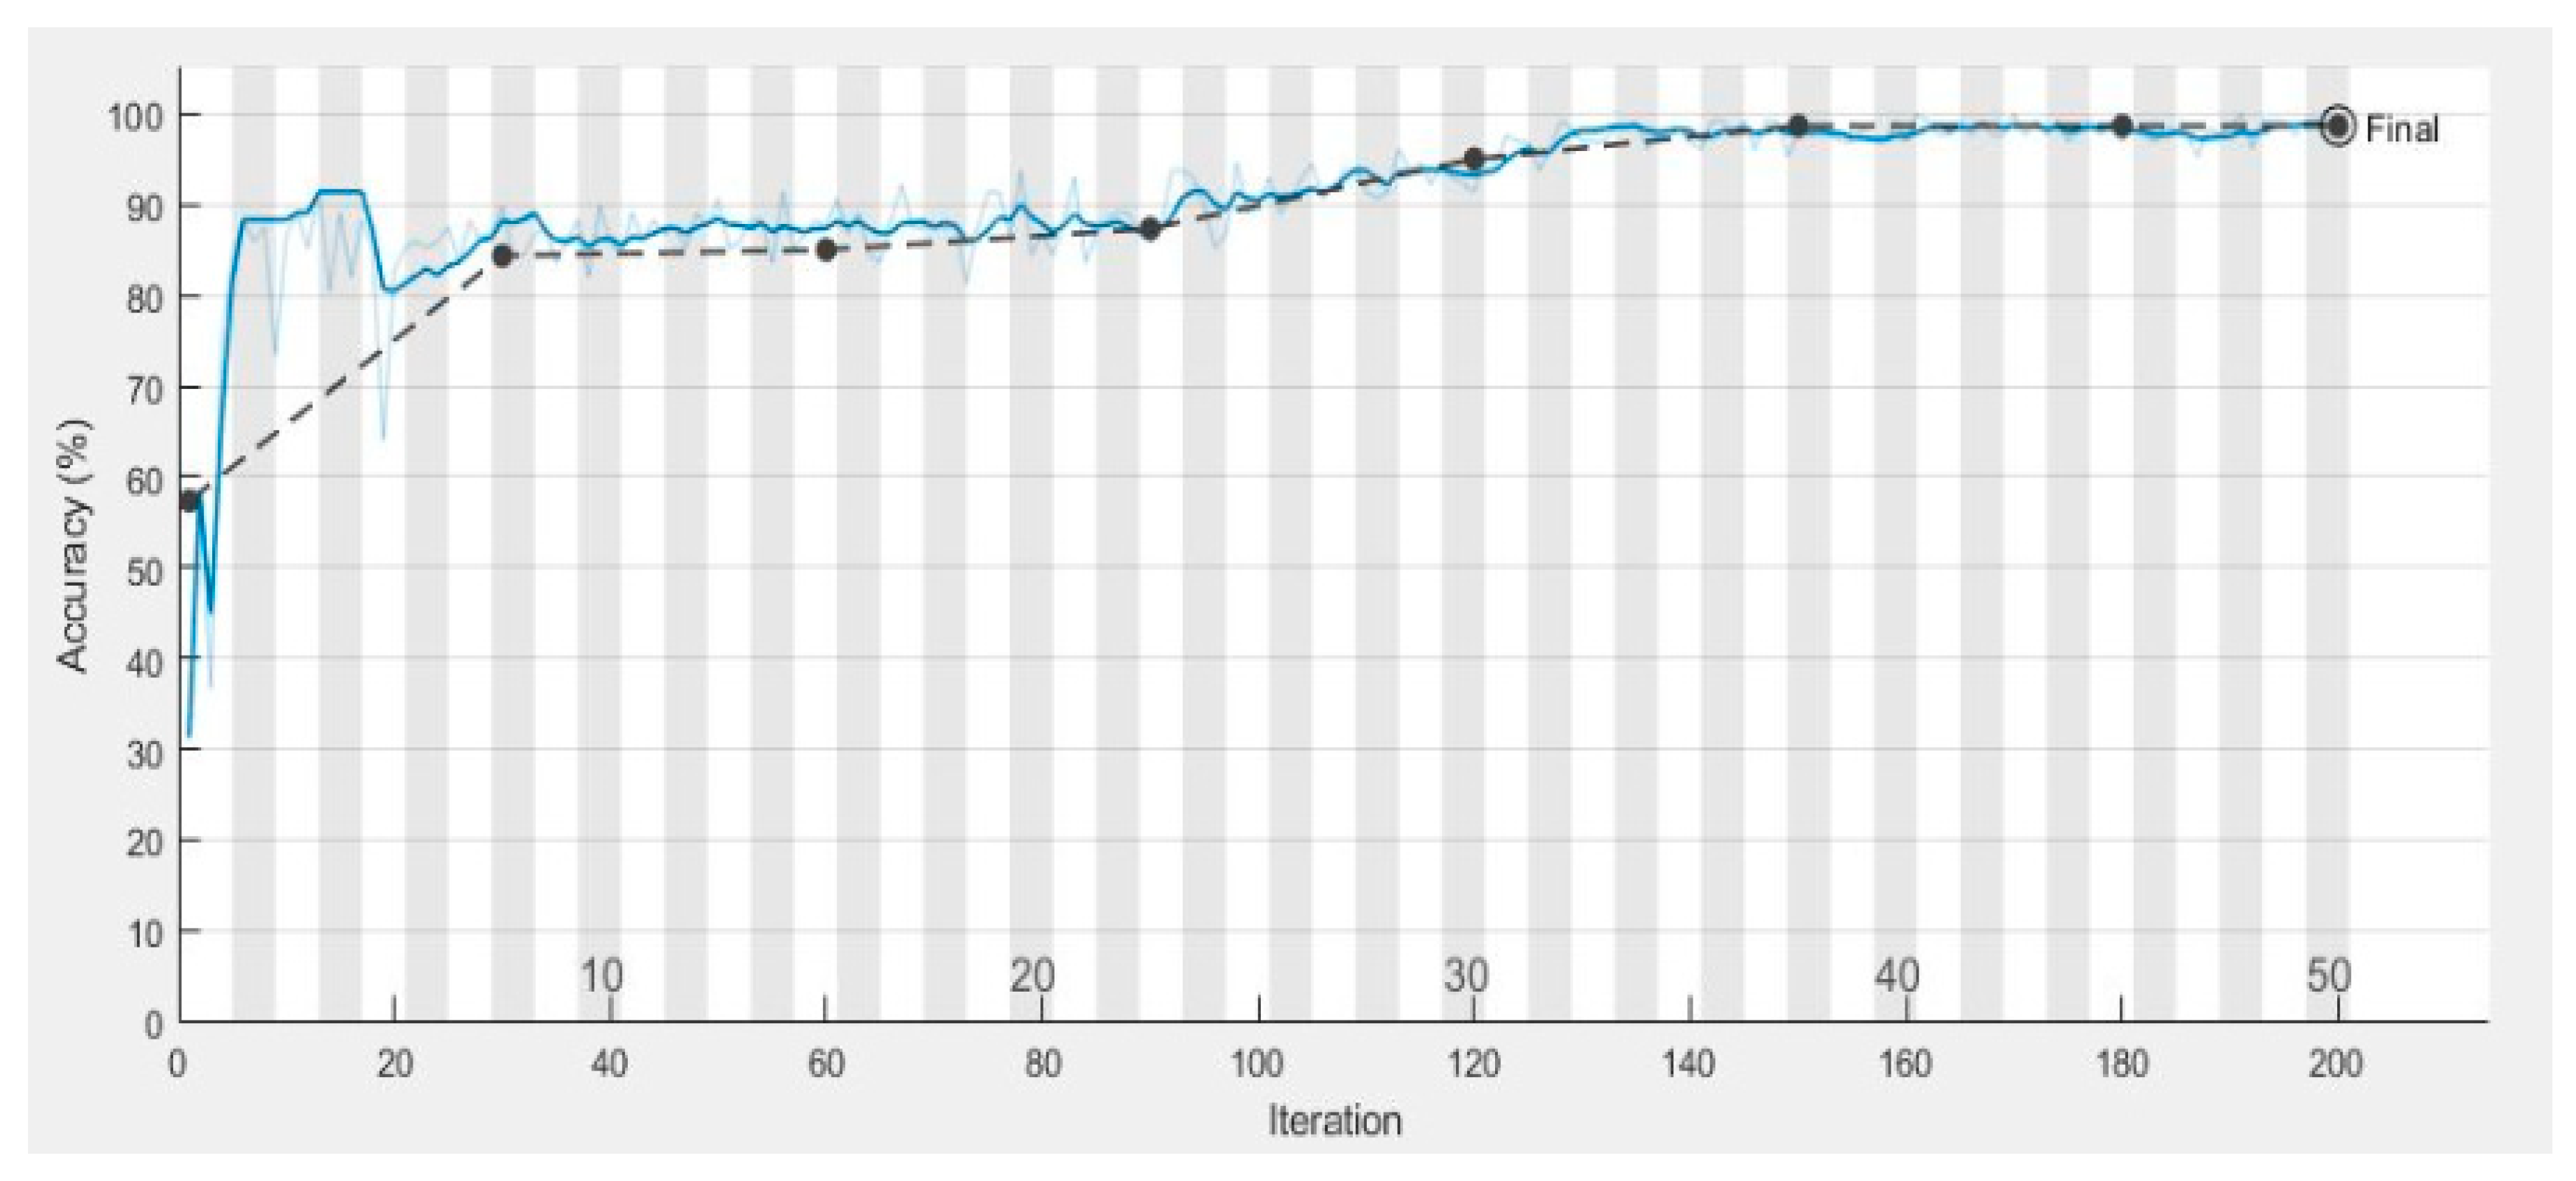
Figure 7 shows the validation and training accuracy which is 98.7%, and
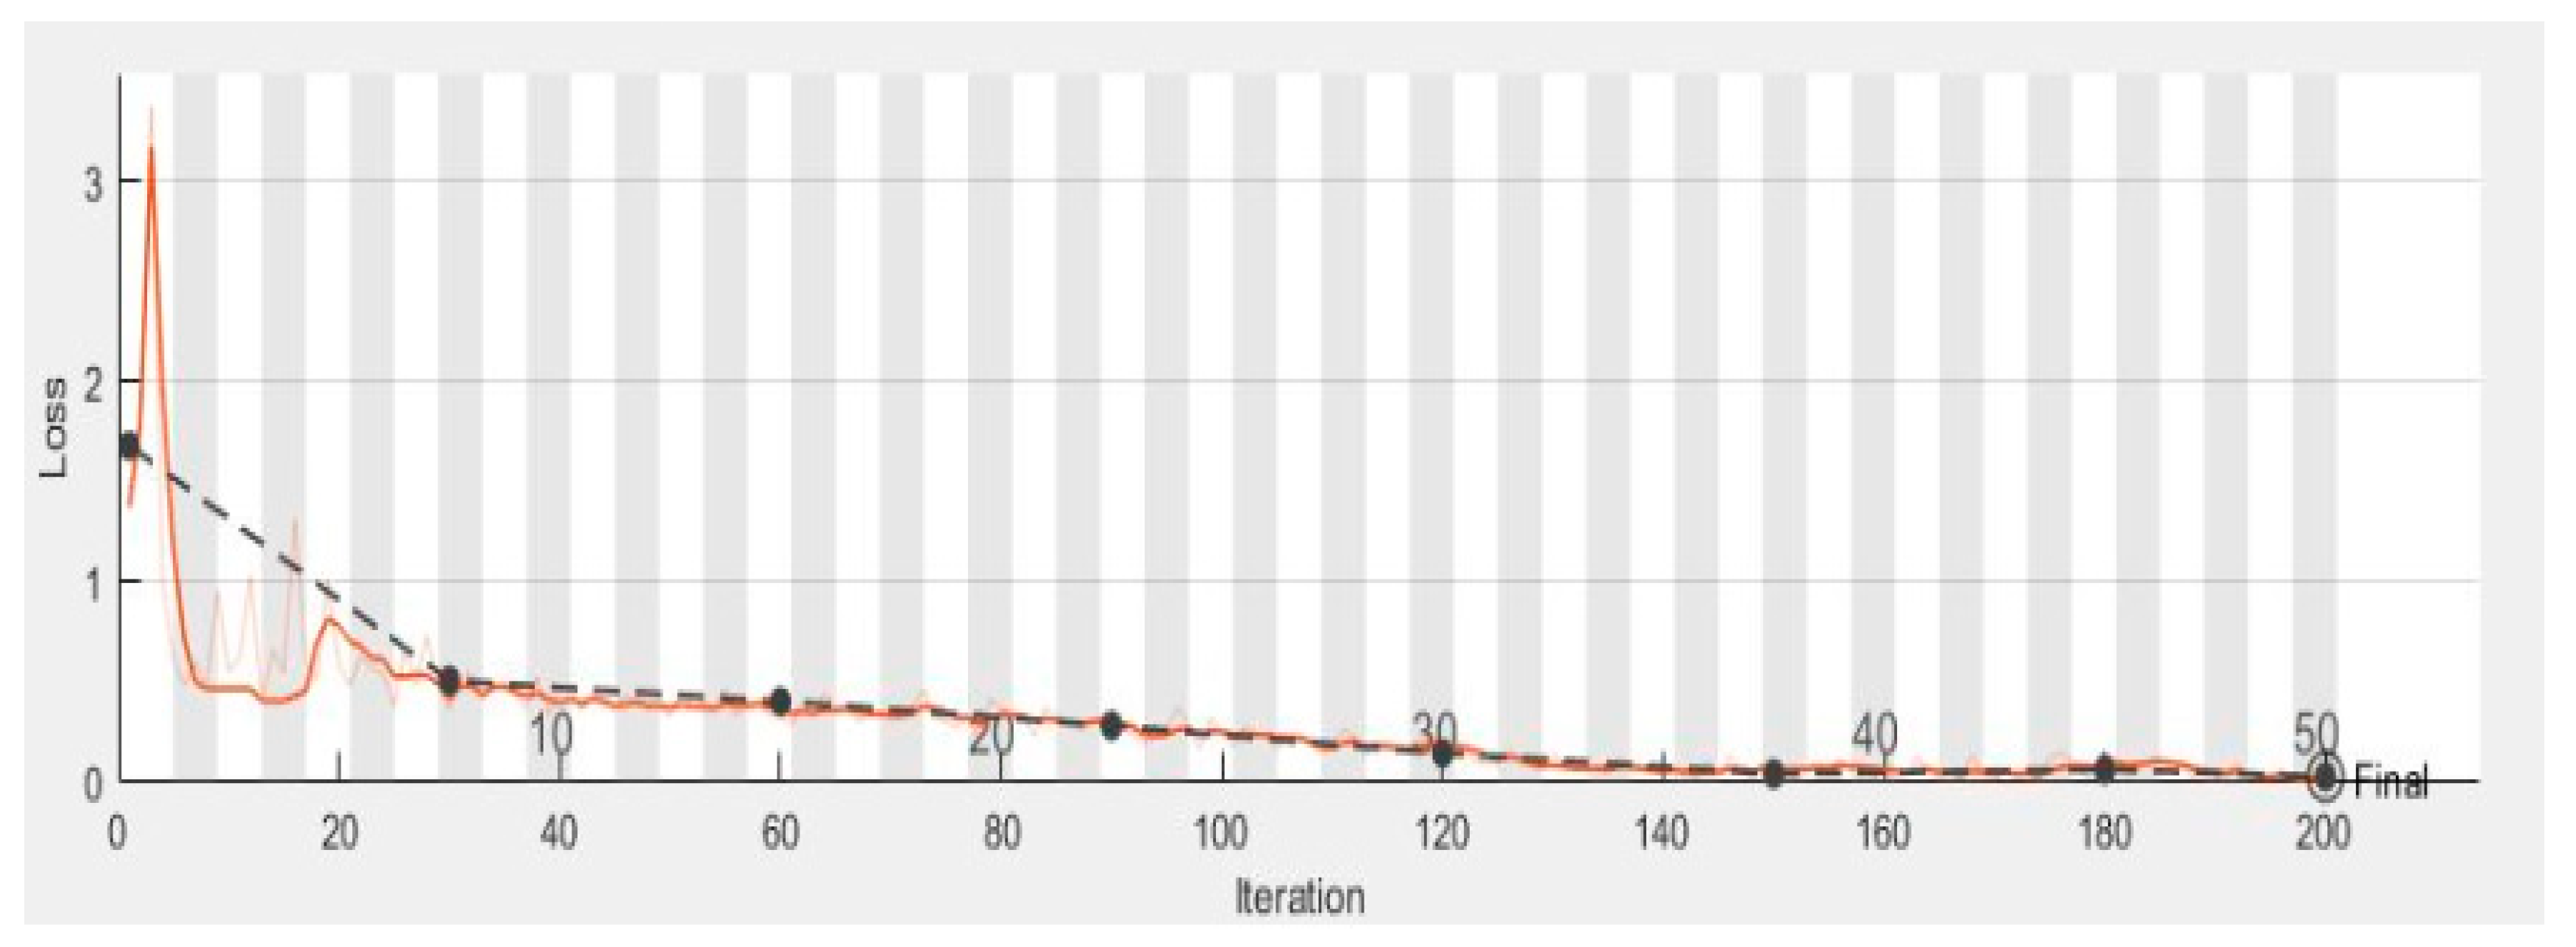
Figure 8 shows the validation and training loss.
Table 4 shows a comparison of the performance of the proposed ML-DCNN algorithm. It shows the performance in the form of an average SE 98.16%, SP 99.35%, ACC 99.28%, and PRC 96.41%. The proposed ML-DCNN glaucoma model obtained different statistical values for advanced glaucoma, early glaucoma, moderate glaucoma, and normal glaucoma categories as shown in
Table 4. The obtained outcomes are comparable to the state-of-the-art systems and achieved competitive results to solve the glaucoma eye disease problems for complex glaucoma eye disease cases.
Next, we evaluated our proposed framework on the complete dataset of glaucoma images. The confusion matrix in
Figure 9 shows the results of the recognition rate of different classes on the local retinal glaucoma image dataset. The rows show the predicted values of the classes and the columns explained the true class values. The diagonal cells show the total number of observations that are correctly classified. The off-diagonal cells explain the incorrect classification of observations. Each cell includes the total number of observations and their percentage. The predicted values’ percentages that are correctly and incorrectly classified for each class are presented in the far-right column of the confusion matrix.
These values are also called the precision (positive predictive value) and false discovery rate, correspondingly. The correct and incorrect classification percentages of all the classes are explained in the row at the bottom end. These values are frequently called the recall (or true positive rate) and the false negative rate, correspondingly. The overall accuracy is shown in the bottom-right cell of the confusion matrix.
Table 5 shows the performance evaluation of the proposed ML-DCNN model on the local retinal glaucoma image dataset. It shows the performance in the form of an average SE 97.04%, SP 98.99%, ACC 99.39%, and PRC 98.2% is observed on a complete dataset. The obtained outcomes are comparable to the state-of-the-art systems and achieved competitive results to solve the glaucoma eye disease problems for complex glaucoma eye disease cases.
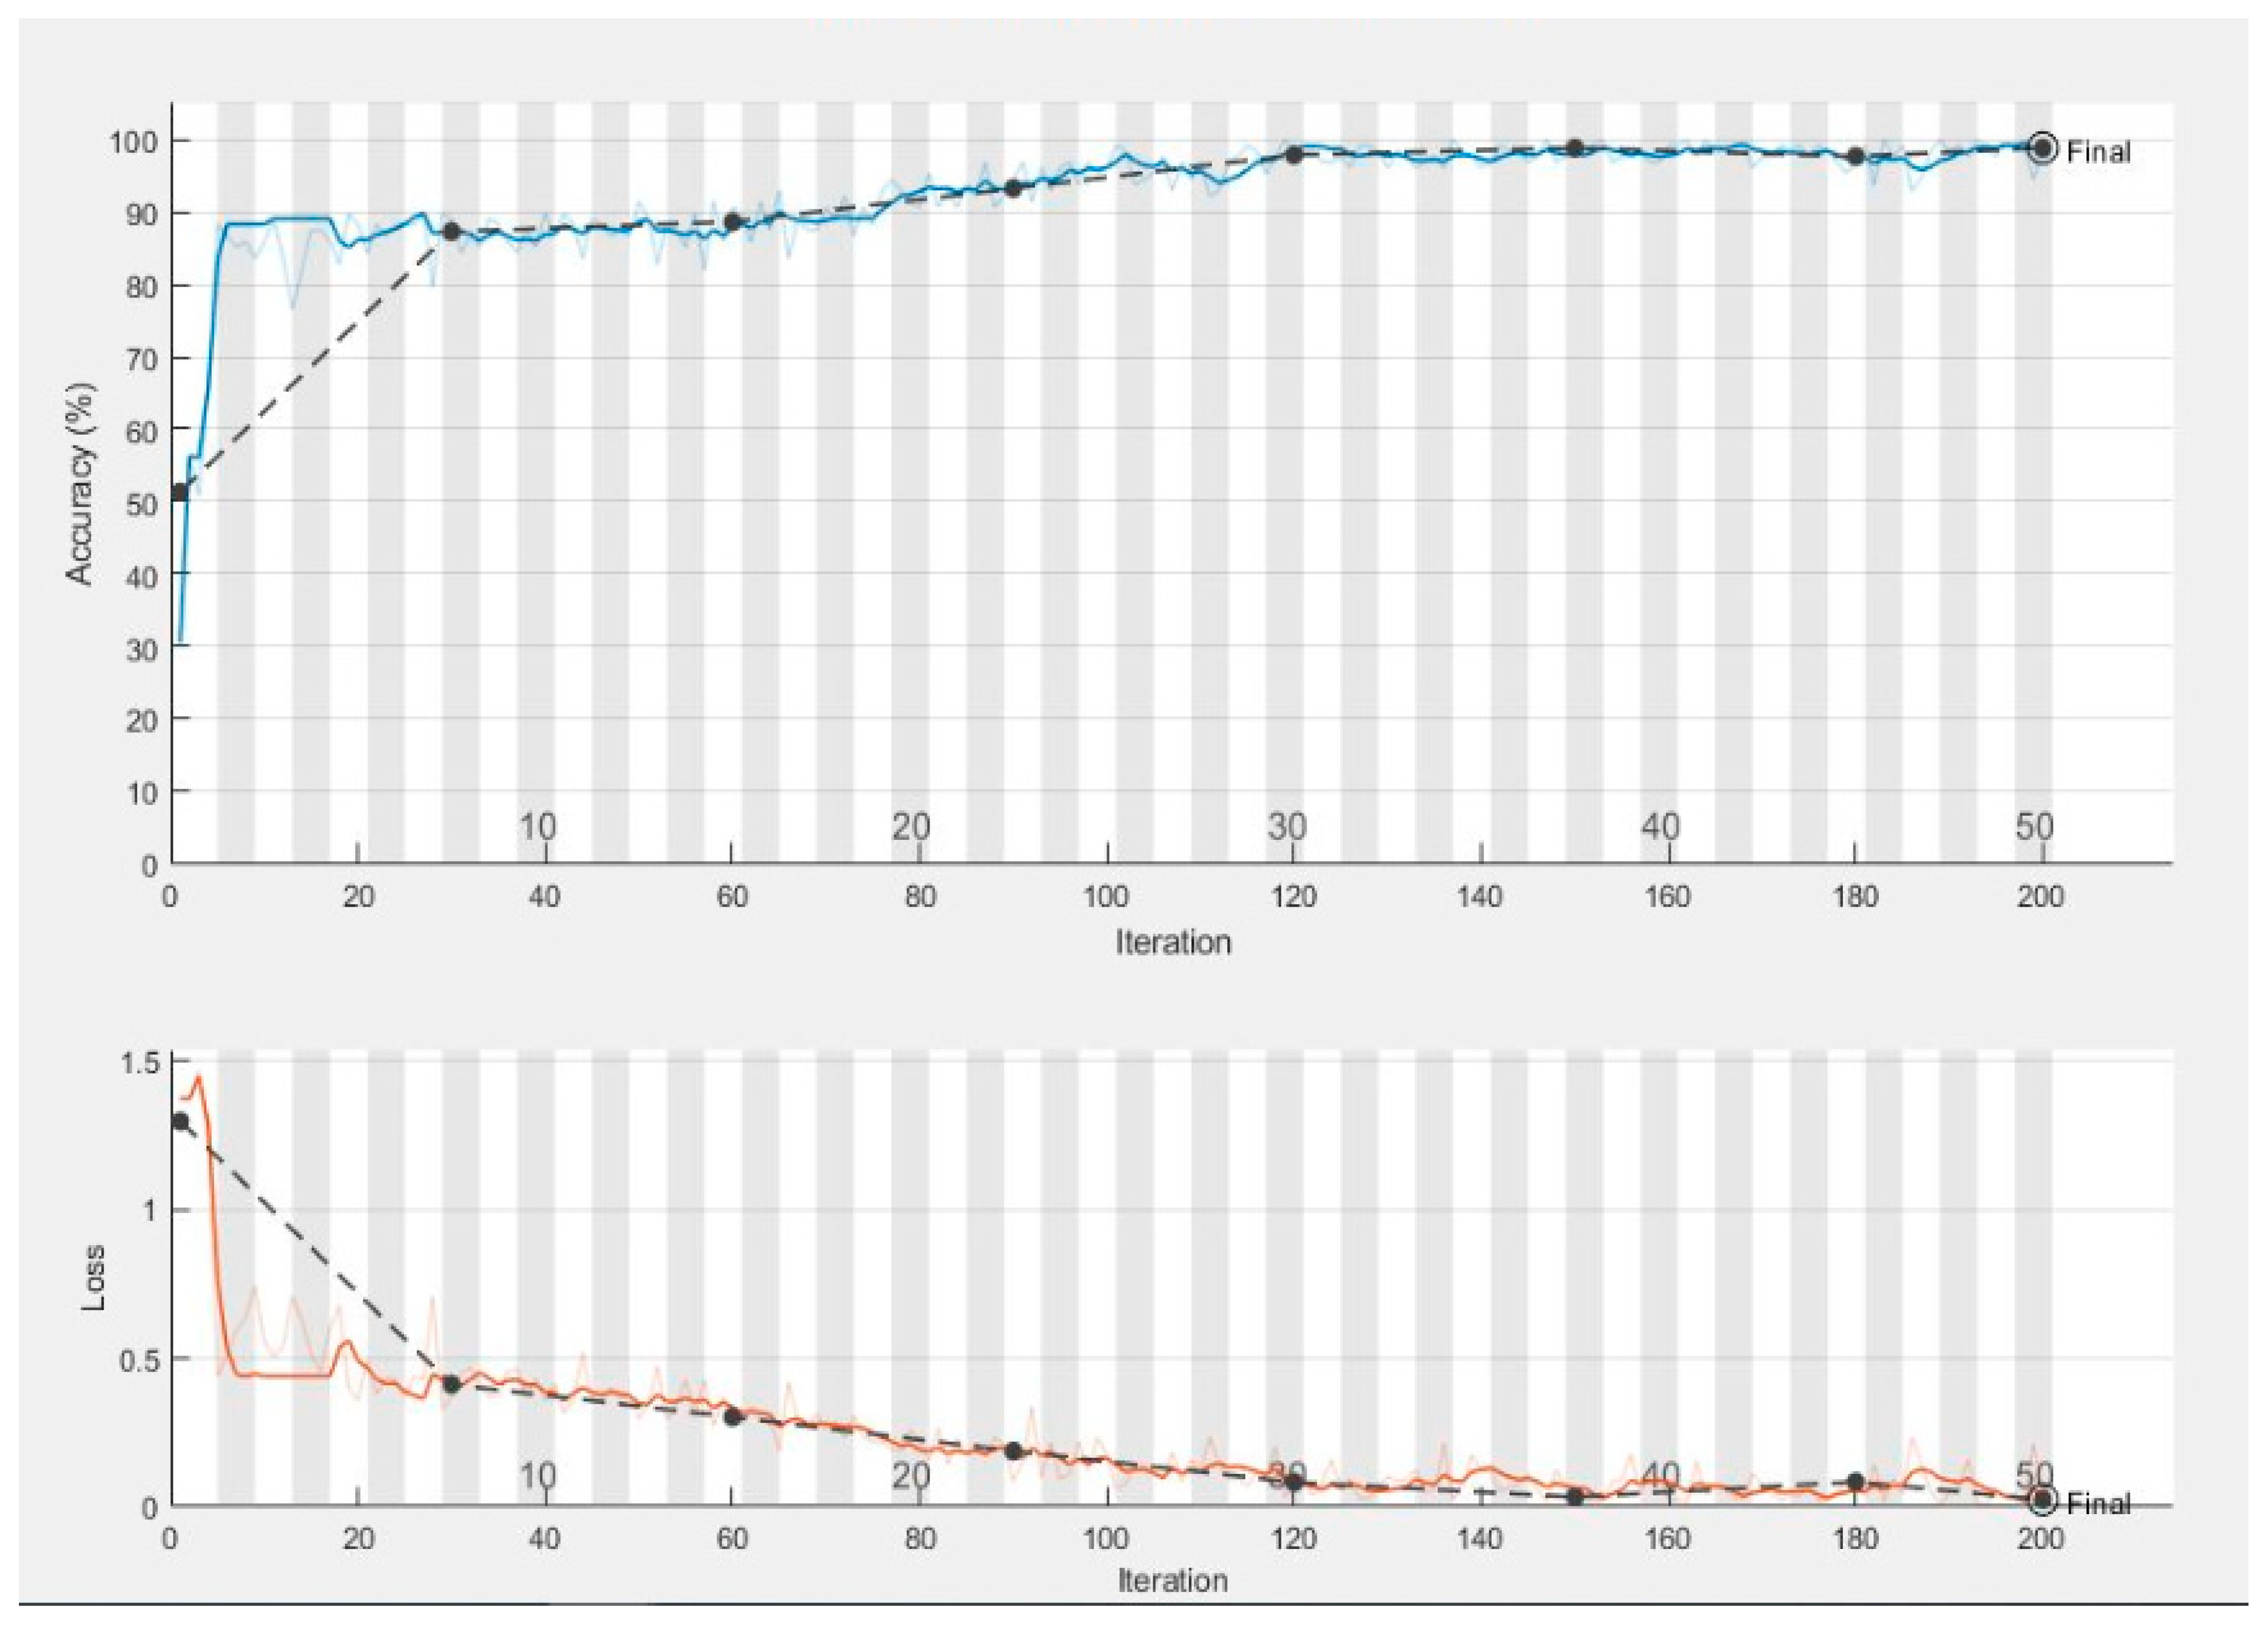
In
Figure 10 the complete training process is represented graphically. The smooth line shows the training and the dotted line shows the validation of the dataset. In the end, we compared the results of our proposed model with the stat of the art techniques for glaucoma eye disease problem.
Table 6 shows the results of the state-of-the-art systems for the classification of advanced glaucoma, early glaucoma, moderate glaucoma, and normal glaucoma categories of glaucoma eye disease in recent years. As shown in
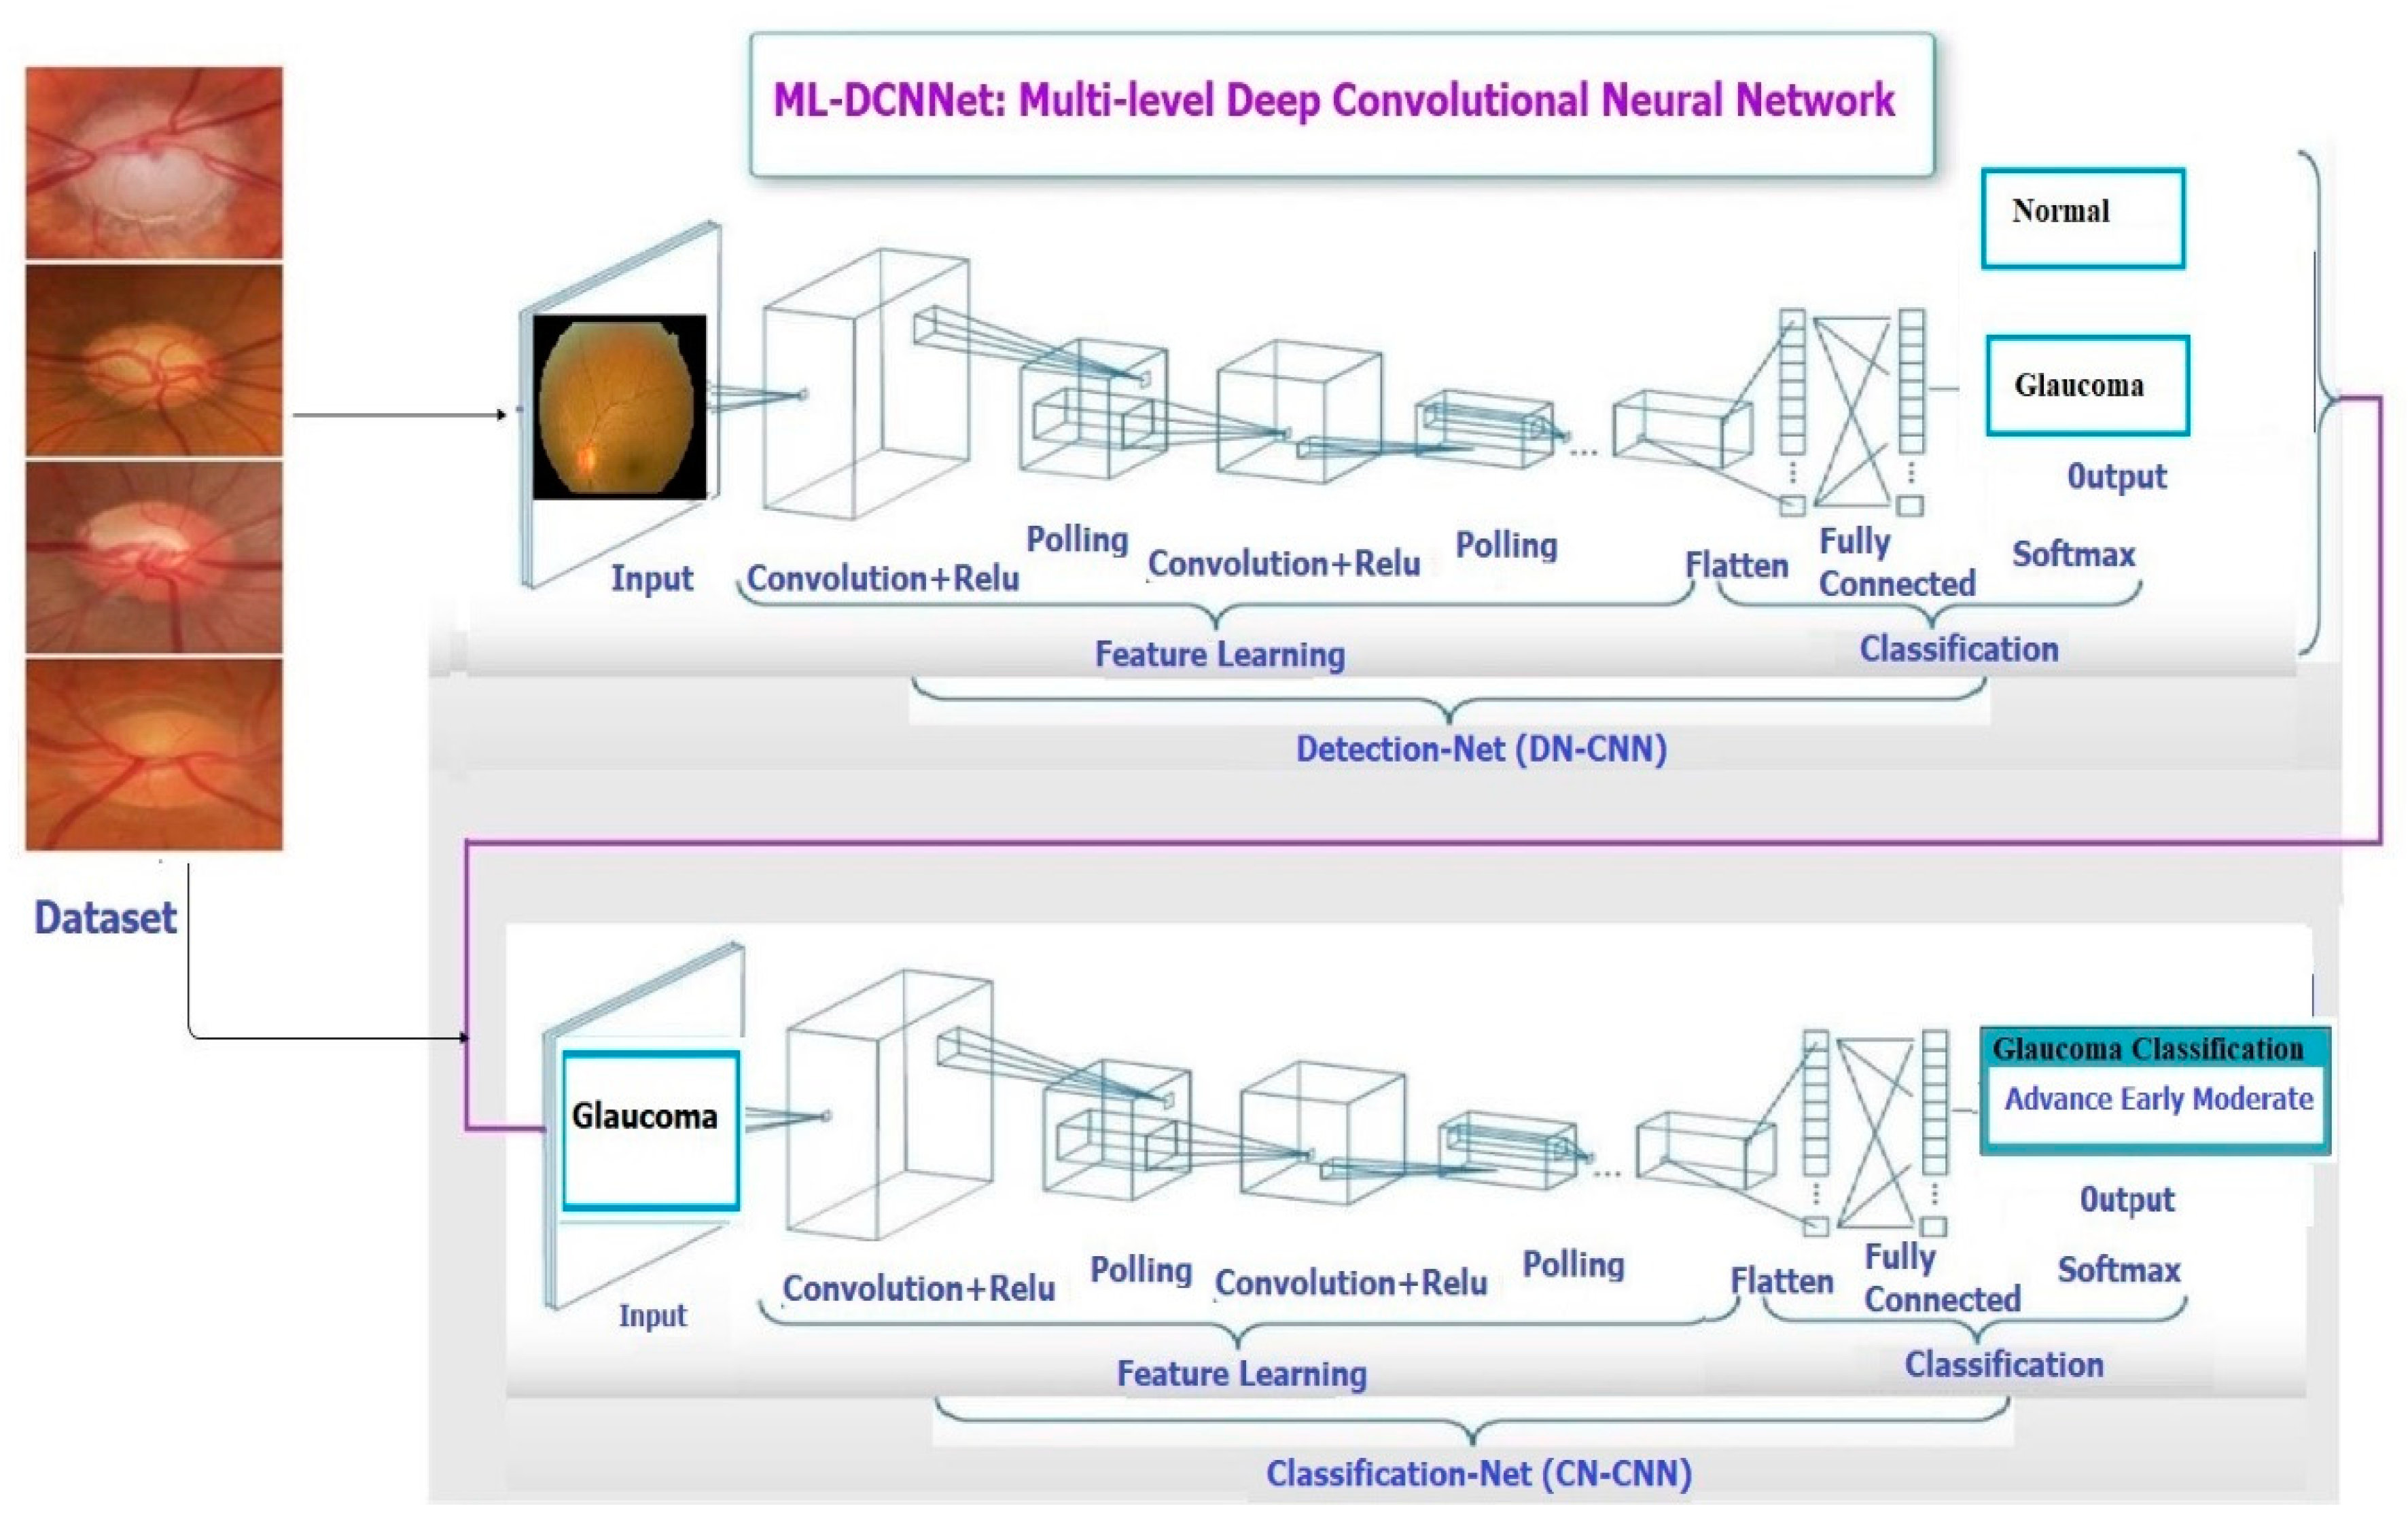
Table 6, the proposed ML-DCNN algorithm gets better statistical values when compared to the other methods for the recognition of eye disease. The reason is that the ML-DCNN glaucoma model works in two parts one for glaucoma detection and the other one is glaucoma classification.

 ,
, 


