The Role of Fecal Calprotectin in Patients with Systemic Sclerosis and Small Intestinal Bacterial Overgrowth (SIBO)

 , and
, and
Abstract
:1. Introduction
2. Patients and Methods
3. Results
4. Discussion
5. Conclusions
Author Contributions
Funding
Acknowledgments
Conflicts of Interest
References
- Ayling, R.M.; Kok, K. Fecal Calprotectin. Adv. Clin. Chem 2018, 87, 161–190. [Google Scholar] [CrossRef] [PubMed]
- Moore, B.W. A soluble protein characteristic of the nervous system. Biochem. Biophys. Res. Commun 1965, 19, 739–744. [Google Scholar] [CrossRef]
- Røseth, A.G.; Fagerhol, M.K.; Aadland, E.; Schjønsby, H. Assessment of the neutrophil dominating protein calprotectin in feces a methodological study. Scand. J. Gastroenterol 1992, 27, 793–798. [Google Scholar] [CrossRef] [PubMed]
- Besold, A.N.; Culbertson, E.M.; Nam, L.; Hobbs, R.P.; Boyko, A.; Maxwell, C.N.; Chazin, W.J.; Marques, A.R.; Culotta, V.C. Antimicrobial action of calprotectin that does not involve metal withholding. Metallomics 2018, 10, 1728–1742. [Google Scholar] [CrossRef] [PubMed]
- Kehl-Fie, T.E.; Chitayat, S.; Hood, M.; Damo, S.; Restrepo, N.; Garcia, C.; Munro, K.A.; Chazin, W.J.; Skaar, E.P. Nutrient metal sequestration by calprotectin inhibits bacterial superoxide defense, enhancing neutrophil killing of Staphylococcus aureus. Cell Host Microbe 2011, 10, 158–164. [Google Scholar] [CrossRef] [PubMed] [Green Version]
- Nakashige, T.G.; Zygiel, E.M.; Drennan, C.L.; Nolan, E.M. Nickel sequestration by the host-defence protein human calprotectin. J. Am. Chem. Soc. 2017, 139, 8828–8836. [Google Scholar] [CrossRef] [PubMed] [Green Version]
- D’Angelo, F.; Felley, C.; Frossard, J.L. Calprotectin in Daily Practice: Where Do We Stand in 2017? Digestion 2017, 95, 293–301. [Google Scholar] [CrossRef]
- Vogl, T.; Tenbrock, K.; Ludwig, S.; Leukert, N.; Ehrhardt, C.; van Zoelen, M.A.D.; Nacken, W.; Foell, D.; van der Poll, T.; Sorg, C. Mrp8 and Mrp14 are endogenous activators of Toll-like receptor 4, promoting lethal, endotoxin-induced shock. Nat. Med. 2007, 13, 1042–1049. [Google Scholar] [CrossRef]
- D’Haens, G.; Ferrante, M.; Vermeire, S.; Baert, F.; Noman, M.; Moortgat, L.; Geens, P.; Iwens, D.; Aerden, I.; Van Assche, G.; et al. Fecal calprotectin is a surrogate marker for endoscopic lesions in inflammatory bowel disease. Inflamm Bowel Dis. 2012, 18, 2218–2224. [Google Scholar] [CrossRef]
- Sipponen, T.; Kolho, K.L. Fecal calprotectin in diagnosis and clinical assessment of inflammatory bowel disease. Scand J. Gastroenterol. 2015, 50, 74–80. [Google Scholar] [CrossRef]
- Tibble, J.; Teahon, K.; Thjodleifsson, B.; Roseth, A.; Sigthorsson, G.; Bridger, S.; Foster, R.; Sherwood, R.; Fagerhol, M.; Bjarnason, I. A simple method for assessing intestinal inflammation in Crohn’s disease. Gut 2000, 47, 506–513. [Google Scholar] [CrossRef] [PubMed] [Green Version]
- Carroccio, A.; Iacono, G.; Cottone, M.; Di Prima, L.; Cartabellotta, F.; Cavataio, F.; Scalici, C.; Montalto, G.; Di Fede, G.; Rini, G.B.; et al. Diagnostic accuracy of fecal calprotectin assay in distinguishing organic causes of chronic diarrhea from irritable bowel syndrome: A prospective study in adults and children. Clin. Chem. 2003, 49, 861–867. [Google Scholar] [PubMed]
- Costa, F.; Mumolo, M.G.; Ceccarelli, L.; Bellini, M.; Romano, M.R.; Sterpi, C.; Ricchiuti, A.; Marchi, S.; Bottai, M. Calprotectin is a stronger predictive marker of relapse in ulcerative colitis than in Crohn’s disease. Gut 2005, 54, 364–368. [Google Scholar] [CrossRef]
- Dolwani, S.; Metzner, M.; Wassell, J.J.; Yong, A.; Hawthorne, A.B. Diagnostic accuracy of faecal calprotectin estimation in prediction of abnormal small bowel radiology. Aliment. Pharm. Ther. 2004, 20, 615–621. [Google Scholar] [CrossRef] [PubMed]
- D’Inca, R.; Dal Pont, E.; Di Leo, V.; Ferronato, A.; Fries, W.; Vettorato, M.G.; Martines, D.; Sturniolo, G.C. Calprotectin and lactoferrin in the assessment of intestinal inflammation and organic disease. Int J. Colorectal Dis. 2007, 22, 429–437. [Google Scholar] [CrossRef]
- Schoepfer, A.M.; Trummler, M.; Seeholzer, P.; Seibold-Schmid, B.; Seibold, F. Discriminating IBD from IBS: Comparison of the test performance of fecal markers, blood leukocytes, CRP, and IBD antibodies. Inflamm Bowel Dis. 2008, 14, 32–39. [Google Scholar] [CrossRef]
- Schroder, O.; Naumann, M.; Shastri, Y.; Povse, N.; Stein, J. Prospective evaluation of faecal neutrophil-derived proteins in identifying intestinal inflammation: Combination of parameters does not improve diagnostic accuracy of calprotectin. Aliment. Pharm. Ther. 2007, 26, 1035–1042. [Google Scholar] [CrossRef]
- Manceau, H.; Chicha-Cattoir, V.; Puy, H.; Peoc’h, K. Fecal calprotectin in inflammatory bowel diseases: Update and perspectives. Clin. Chem Lab. Med. 2017, 55, 474–483. [Google Scholar] [CrossRef]
- Davidson, F.; Lock, R.J. Paediatric reference ranges for faecal calprotectin: A UK study. Ann. Clin. Biochem. 2017, 54, 214–218. [Google Scholar] [CrossRef]
- Denton, C.P.; Khanna, D. Systemic sclerosis. Lancet 2017, 390, 1685–1699. [Google Scholar] [CrossRef]
- Bures, J.; Cyrany, J.; Kohoutova, D.; Förstl, M.; Rejchrt, S.; Kvetina, J.; Vorisek, V.; Kopacova, M. Small intestinal bacterial overgrowth syndrome. World J. Gastroenterol. 2010, 16, 2978–2990. [Google Scholar] [CrossRef] [PubMed]
- Sakkas, L.I.; Simopoulou, T.; Daoussis, D.; Liossis, S.N.; Potamianos, S. Intestinal Involvement in Systemic Sclerosis: A Clinical Review. Dig. Dis Sci. 2018, 63, 834–844. [Google Scholar] [CrossRef] [PubMed]
- Jaeger, V.K.; Wirz, E.G.; Allanore, Y.; Rossbach, P.; Riemekasten, G.; Hachulla, E.; Distler, O.; Airo, P.; Carreira, P.E.; Gurman, A.B.; et al. Incidences and Risk Factors of Organ Manifestations in the Early Course of Systemic Sclerosis: A Longitudinal EUSTAR Study. PLoS ONE 2016, 11, e0163894. [Google Scholar] [CrossRef] [PubMed]
- Miazga, A.; Osiński, M.; Cichy, W.; Żaba, R. Current views on the etiopathogenesis, clinical manifestation, diagnostics, treatment and correlation with other nosological entities of SIBO. Adv. Med. Sci. 2015, 60, 118–124. [Google Scholar] [CrossRef]
- Quigley, E.M.M. The Spectrum of Small Intestinal Bacterial Overgrowth (SIBO). Curr Gastroenterol Rep. 2019, 21, 3. [Google Scholar] [CrossRef]
- Quigley, E.M. Small intestinal bacterial overgrowth: What it is and what it is not. Curr. Opin. Gastroenterol. 2014, 30, 141–146. [Google Scholar] [CrossRef]
- Kaye, S.A.; Lim, S.G.; Taylor, M.; Patel, S.; Gillespie, S.; Black, C.M. Small bowel bacterial overgrowth in systemic sclerosis: Detection using direct and indirect methods and treatment outcome. Br. J. Rheumatol. 1995, 34, 265–269. [Google Scholar] [CrossRef]
- Marie, I.; Leroi, A.M.; Menard, J.F.; Levesque, H.; Quillard, M.; Ducrotte, P. Fecal calprotectin in systemic sclerosis and review of the literature. Autoimmun. Rev. 2015, 14, 547–554. [Google Scholar] [CrossRef]
- Andréasson, K.; Saxne, T.; Scheja, A.; Bartosik, I.; Mandl, T.; Hesselstrand, R. Faecal levels of calprotectin in systemic sclerosis are stable over time and are higher compared to primary Sjögren’s syndrome and rheumatoid arthritis. Arthritis Res. 2014, 16, R46. [Google Scholar] [CrossRef] [Green Version]
- Andréasson, K.; Scheja, A.; Saxne, T.; Ohlsson, B.; Hesselstrand, R. Faecal calprotectin: A biomarker of gastrointestinal disease in systemic sclerosis. J. Intern. Med. 2011, 270, 50–57. [Google Scholar] [CrossRef]
- van den Hoogen, F.; Khanna, D.; Fransen, J.; Johnson, S.R.; Baron, M.; Tyndall, A.; Matucci-Cerinic, M.; Naden, R.; Riemekasten, G.; Carreira, P.; et al. 2013 classification criteria for systemic sclerosis: An American College of Rheumatology/European League against Rheumatism collaborative initiative. Arthritis Rheum. 2013, 65, 2737–2747. [Google Scholar] [CrossRef] [PubMed] [Green Version]
- Khanna, D.; Nagaraja, V.; Gladue, H.; Chey, W.; Pimentel, M.; Frech, T. Measuring Response in the Gastrointestinal Tract in systemic sclerosis. Curr. Opin. Rheumatol. 2013, 25, 700–706. [Google Scholar] [CrossRef] [PubMed] [Green Version]
- Gyger, G.; Baron, M. Systemic sclerosis: Gastrointestinal disease and its management. Rheum. Dis. Clin. N. Am. 2015, 41, 459–473. [Google Scholar] [CrossRef] [PubMed]
- Yang, H.; Xu, D.; Li, M.T.; Yao, Y.; Jin, M.; Zeng, X.F.; Qian, J. Gastrointestinal manifestations on impaired quality of life in systemic sclerosis. J. Dig. Dis. 2019, 20, 256–261. [Google Scholar] [CrossRef]
- Emmanuel, A. Current management of the gastrointestinal complications of systemic sclerosis. Nat. Rev. Gastroenterol Hepatol. 2016, 13, 461–472. [Google Scholar] [CrossRef] [Green Version]
- Marie, I.; Ducrotté, P.; Denis, P.; Hellot, M.F.; Levesque, H. Outcome of small-bowel motor impairment in systemic sclerosis—A prospective manometric 5-yr follow-up. Rheumatol. Oxf. 2007, 46, 150–153. [Google Scholar] [CrossRef] [Green Version]
- McFarlane, I.M.; Bhamra, M.S.; Kreps, A.; Iqbal, S.; Al-Ani, F.; Aponte, C.S.; Grant, C.; Singh, S.; Awwal, K.; Koci, K.; et al. Gastrointestinal Manifestations of Systemic Sclerosis. Rheumatol. Sunnyvale 2018, 8, 235. [Google Scholar] [CrossRef]
- Akesson, A.; Wollheim, F.A. Organ manifestations in 100 patients with progressive systemic sclerosis: A comparison between the CREST syndrome and diffuse scleroderma. Br. J. Rheumatol. 1989, 28, 81–86. [Google Scholar] [CrossRef]
- Polkowska-Pruszyńska, B.; Gerkowicz, A.; Szczepanik-Kułak, P.; Krasowska, D. Small intestinal bacterial overgrowth in systemic sclerosis: A review of the literature. Arch. Derm. Res. 2019, 311, 1–8. [Google Scholar] [CrossRef] [Green Version]
- Erdogan, A.; Rao, S.S.; Gulley, D.; Jacobs, C.; Lee, Y.Y.; Badger, C. Small intestinal bacterial overgrowth: Duodenal aspiration vs. glucose breath test. Neurogastroenterol Motil. 2015, 27, 481–489. [Google Scholar] [CrossRef]
- McMahan, Z.H. Gastrointestinal involvement in systemic sclerosis: An update. Curr. Opin. Rheumatol. 2019, 31, 561–568. [Google Scholar] [CrossRef] [PubMed]
- Jacobs, C.; Coss, A.E.; Attaluri, A.; Valestin, J.; Rao, S.S.C. Dysmotility and ppi use are independent risk factors for small intestinal bacterial and/or fungal overgrowth. Aliment. Pharm. Ther. 2013, 37, 1103–1111. [Google Scholar] [CrossRef] [PubMed] [Green Version]
- Walecka, I. Systemic sclerosis and the gastrointestinal tract. Prz. Gastroenterol. 2017, 12, 163–168. [Google Scholar] [CrossRef] [PubMed] [Green Version]


| Variable | Study Group | Absence of SIBO 1 | Presence of SIBO 1 | p | Fecal Calprotectin Levels [ug/g] Me | p | ||
|---|---|---|---|---|---|---|---|---|
| Gender Female Male | 39 (97.5%) 1 (2.5%) | 20 (95.2%) 1 (4.8%) | 19 (100%) - | 0.9596 | 118 20 | - | ||
| Disease subtype dcSCC 2 IcSCC 3 | 6 (15.4%) 33 (84.6%) | 2 (9.52%) 19 (90.48%) | 4 (22.2%) 14 (77.8%) | 0.5153 | 221.00 74 | 0.0943 | ||
| Antibodies ACA 4 Scl-70 5 Not specified ACA 4/Scl-70 5 | 22 (59.5%) 12 (32.4%) 1 (2.7%) 2 (5.4%) | 12 (60%) 7 (35%) - 1 (5%) | 10 (58.8%) 5 (29.4%) 1 (5.9%) 1 (5.9%) | 0.7338 | 72 206 227 717 | 0.0729 | ||
| Gastrointestinal comorbidities No Yes | 24 (60%) 16 (40%) | 12 (57.1%) 9 (42.9%) | 12 (63.2%) 7 (36.8%) | 0.9485 | 96.5 119 | 0.2227 | ||
| Gastrointestinal comorbidities GERD 6 Esophagal hiatal hernia Others (i.a. mechanical bowel obstruction) | 5 (31.3%) 7 (43.7%) 4 (25%) | 3 (33.3%) 4 (44.4%) 2 (22.2%) | 2 (28.6%) 3 (42.9%) 2 (28.6%) | 0.9539 | 162 66.5 380 | 0.3878 | ||
| SIBO 1 presence No Yes | 21 (52.5%) 19 (47.5%) | 21 (100%) - | - 19 (100%) | - | 24 206 | 0.0010 | ||
| SIBO 1 eradication No Yes | 4 (26.7%) 11 (73.3%) | - | 4 (26.7%) 11 (73.3%) | - | 7 345 156 | 8 311 137 | 7 0.1059 | 8 0.1198 |
| 8Characteristics of the control group | ||||||||
| Variable | Control group | Absence of SIBO | Presence of SIBO | p | Fecal calprotectin levels [ug/g] Me | P | ||
| Gender Female Male | 36 (92.3%) 3 (7.7%) | 31 (91.2%) 3 (8.8%) | 5 (100%) - | 0.8357 | 20 33 | 0.1617 | ||
| Variable | Study Group | |||||
|---|---|---|---|---|---|---|
| SIBO Absence | SIBO Presence | |||||
| n | rho | p | n | rho | p | |
| Age (years) | 19 | 0.505 | 0.0275 | 17 | −0.006 | 0.9813 |
| Weight (kilograms) | 19 | −0.143 | 0.5592 | 17 | 0.215 | 0.4076 |
| BMI 1 | 19 | −0.150 | 0.5387 | 17 | 0.140 | 0.5928 |
| Disease duration (years) | 19 | 0.093 | 0.7038 | 17 | 0.336 | 0.1873 |
| TP 2 (g/dL) | 6 | 0.395 | 0.4387 | 4 | −0.400 | 0.6000 |
| Albumins (% TP) | 6 | −0.273 | 0.6004 | 4 | 0.200 | 0.8000 |
| ESR 3 (mm/h) | 16 | 0.208 | 0.4405 | 15 | −0.075 | 0.7905 |
| AST 4 (IU/L) | 19 | −0.404 | 0.0865 | 17 | 0.125 | 0.6326 |
| ALT 5 (U/L) | 19 | −0.567 | 0.0114 | 16 | 0.153 | 0.5717 |
| CRP 6 (mg/L) | 19 | 0.564 | 0.0120 | 17 | 0.064 | 0.8078 |
| C3 7 (g/dL) | 14 | −0.199 | 0.4952 | 12 | 0.252 | 0.4299 |
| C4 7 (g/L) | 14 | −0.034 | 0.9072 | 12 | −0.462 | 0.1309 |
| CK 8 (IU/L) | 3 | −0.500 | 0.6667 | 10 | −0.122 | 0.7379 |
| Rheumatoid factor (IU/mL) | 5 | −0.344 | 0.5707 | 7 | −0.079 | 0.8666 |
| NT-proBNP (pg/mL) | 14 | 0.474 | 0.0866 | 13 | 0.319 | 0.2886 |
| Leukocytes (K/µL) | 19 | 0.580 | 0.0093 | 17 | 0.267 | 0.2996 |
| Neutrophils (K/µL) | 19 | 0.781 | 0.0001 | 17 | 0.561 | 0.0191 |
| Variables | Fecal Calprotectin Levels | ||
|---|---|---|---|
| n | rho | p | |
| Age (years) | 36 | 0.180 | 0.2940 |
| Weight (kilograms) | 36 | −0.016 | 0.9257 |
| BMI 1 | 36 | −0.063 | 0.7138 |
| Disease duration (years) | 36 | 0.250 | 0.1413 |
| TP 2 (g/dL) | 10 | −0.018 | 0.9596 |
| Albumins (% TP) | 10 | 0.178 | 0.6229 |
| ESR 3 (mm/h) | 31 | 0.144 | 0.4407 |
| CRP 4 (mg/L) | 36 | 0.331 | 0.0483 |
| C3 5 (g/dL) | 26 | 0.131 | 0.5241 |
| C4 5 (g/L) | 26 | −0.198 | 0.3317 |
| CK 6 (IU/L) | 13 | 0.011 | 0.9715 |
| Rheumatoid factor (IU/mL) | 12 | −0.212 | 0.5082 |
| NT-proBNP (pg/mL) | 27 | 0.370 | 0.0578 |
| FC 7 (after eradication) | 8 | 0.623 | 0.0991 |
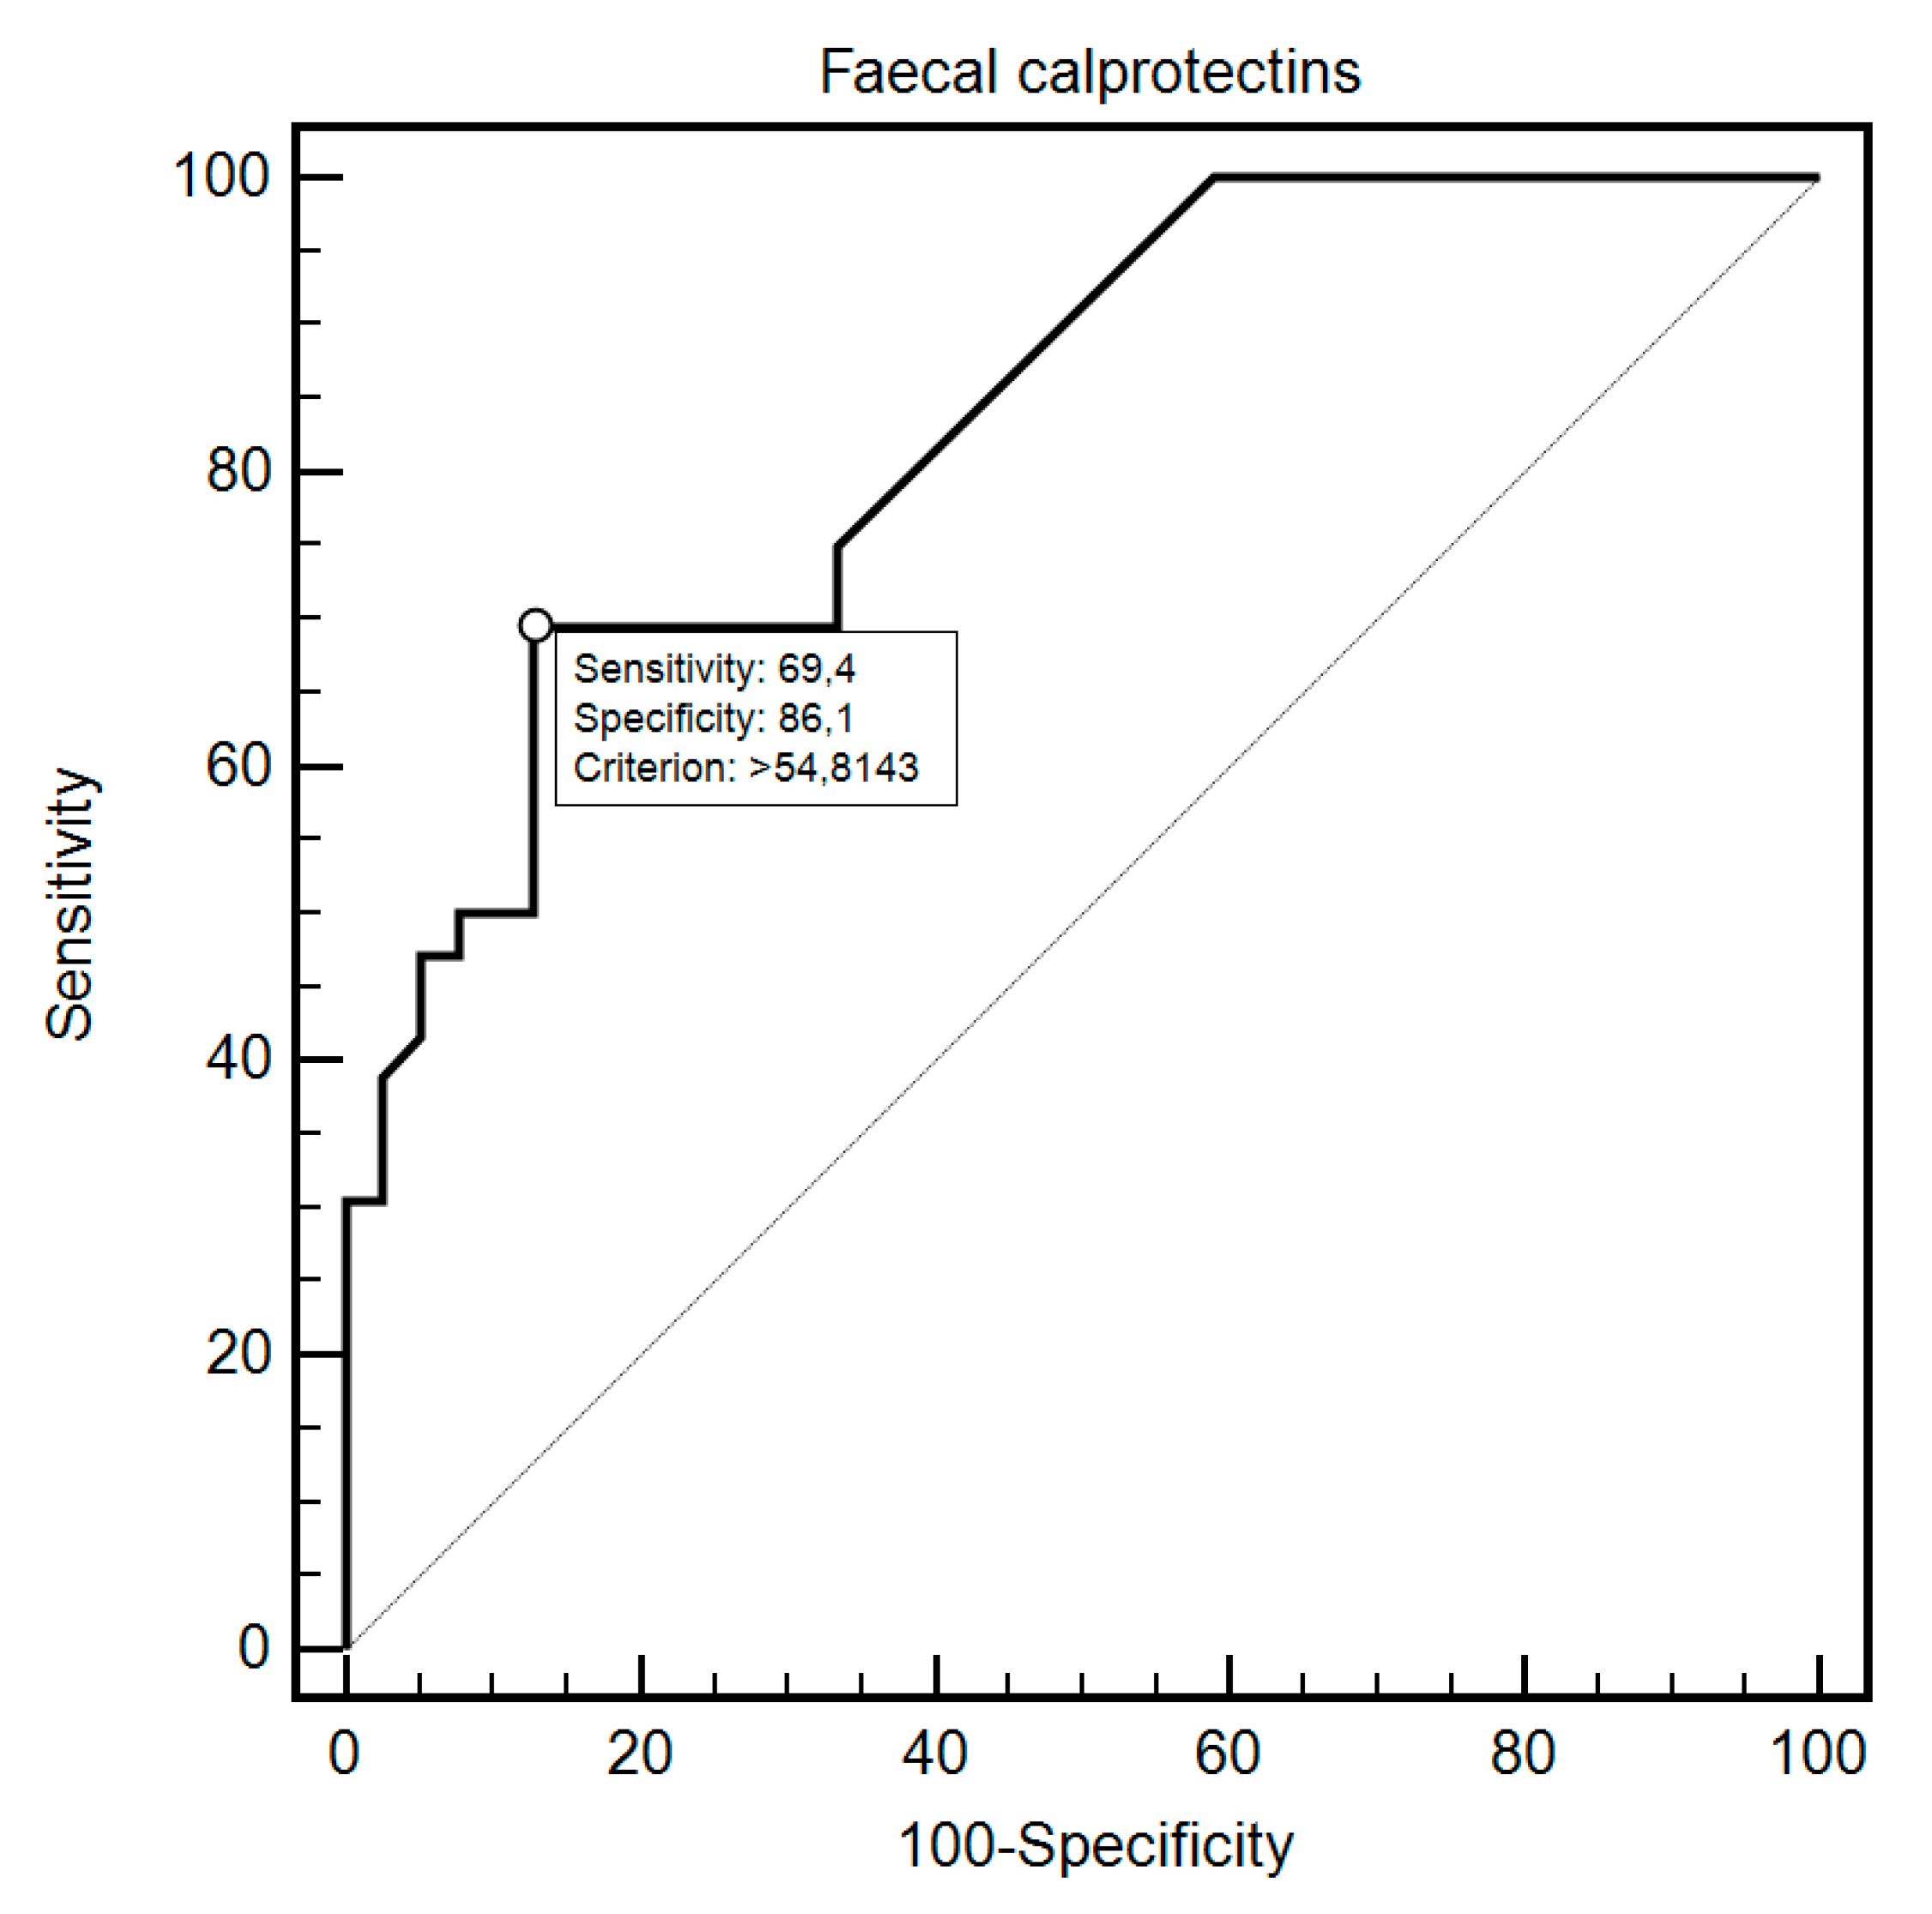
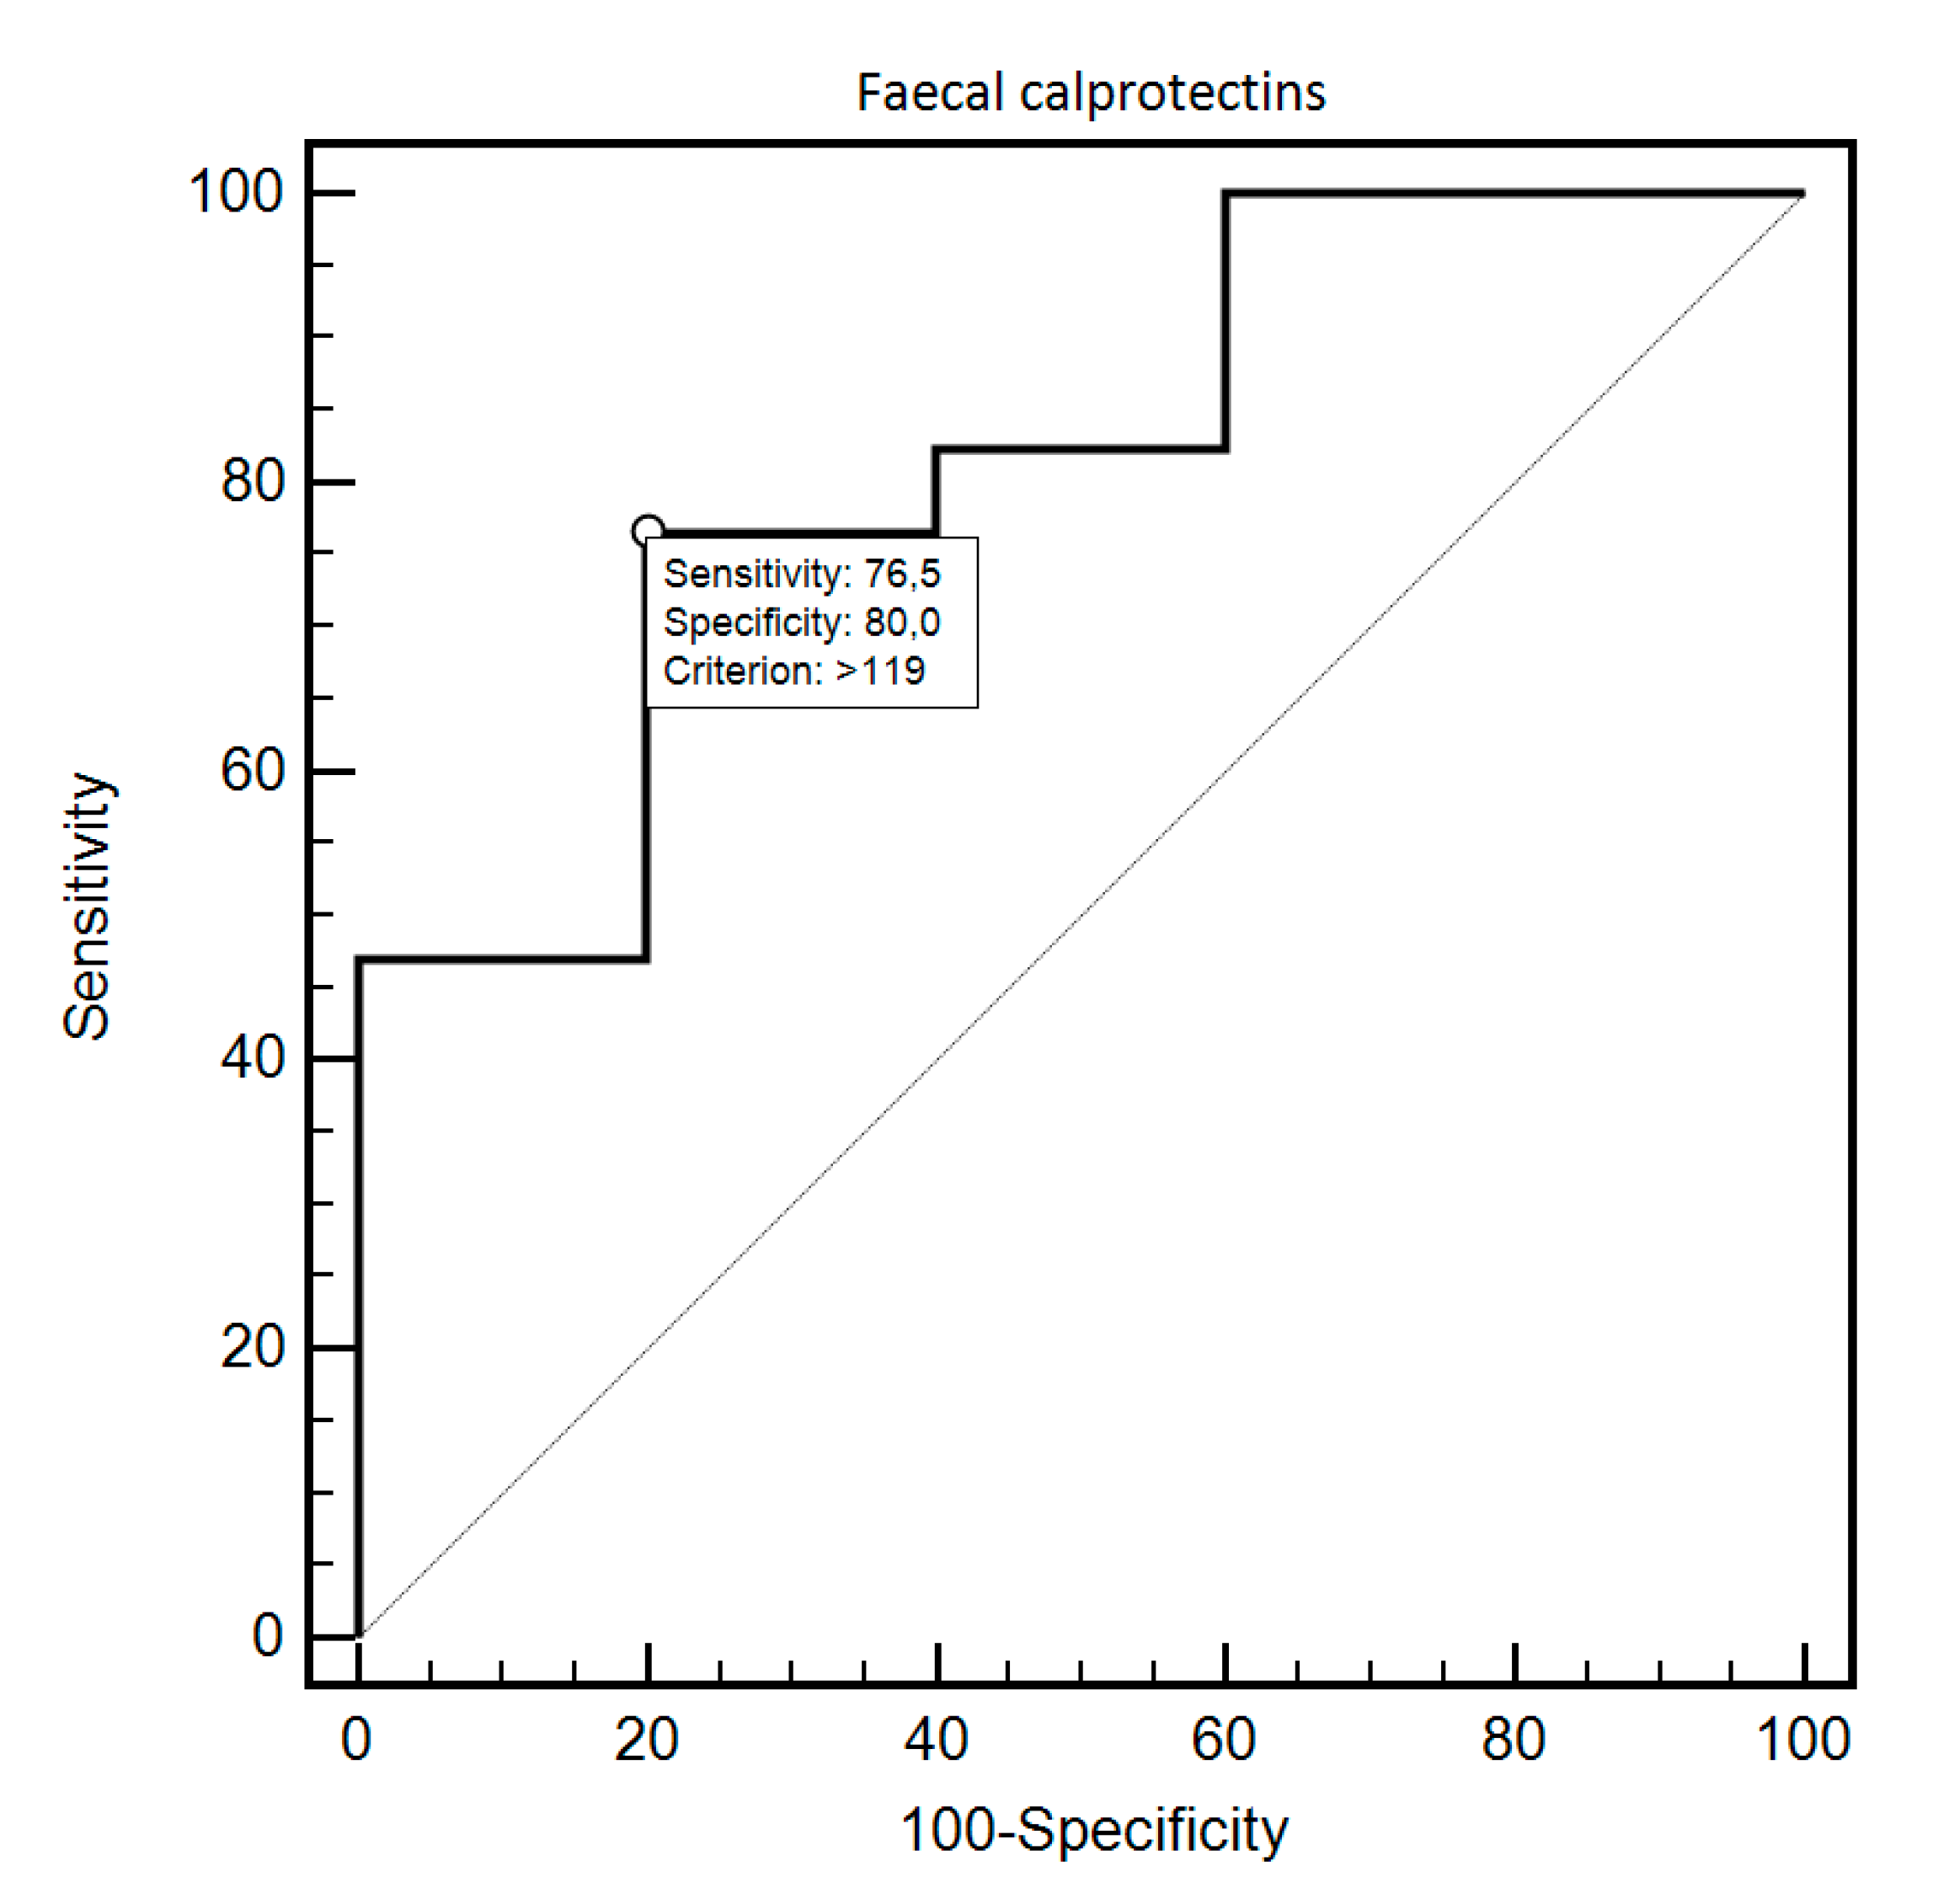
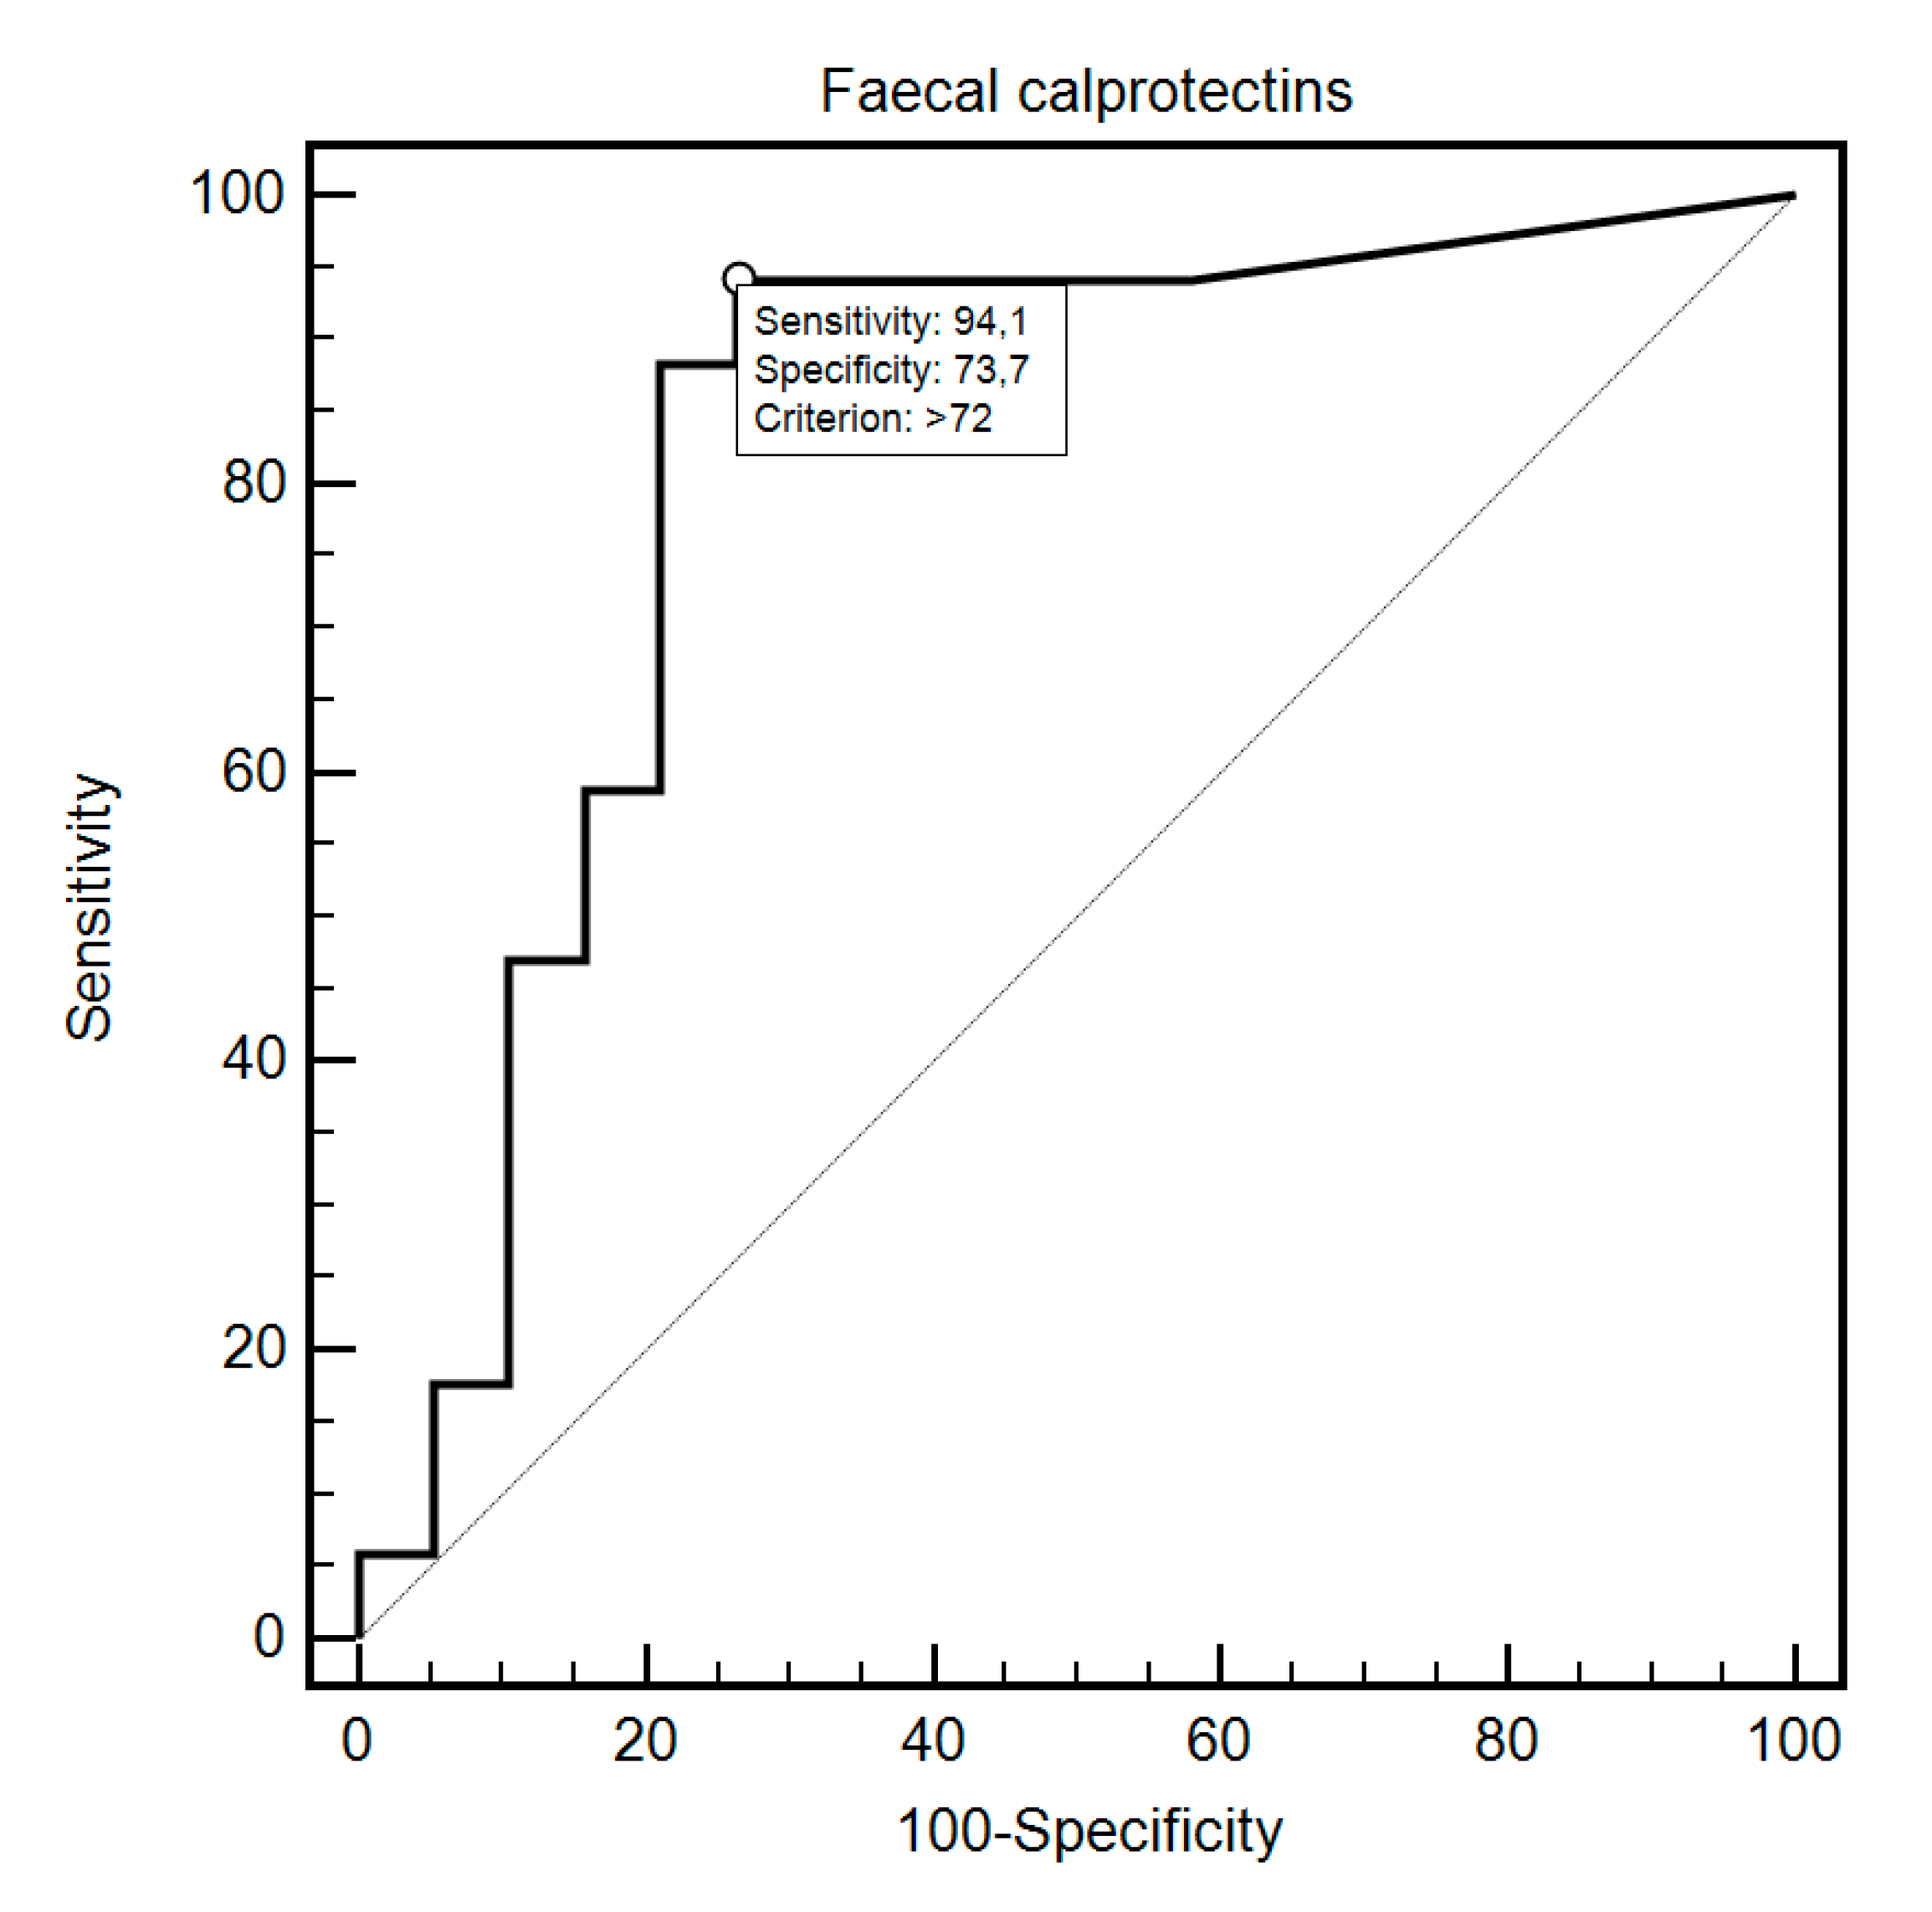
| Fecal Calprotectin | Sensitivity | Specificity | Criterion | AUC (95%CI) | p |
|---|---|---|---|---|---|
| Group Study vs. Control | 69.44% | 87.18% | >60 | 0.83 (0.73–0.91) | <0.0001 |
| SIBO 1 presence Study vs. Control | 76.47% | 80% | >119 | 0.81 (0.59–0.94) | 0.0054 |
| SIBO 1 (study group) Yes No | 94.12% | 73.68% | >72 | 0.82 (0.66–0.93) | <0.0001 |
| Eradication (study group) Yes No | 90% | 75% | ≤254 | 0.80 (0.51–0.96) | 0.0509 |
| Disease subtype dcSCC 2 IcSCC 3 | 75.86% | 66.67% | ≤162 | 0.72 (0.54–0.86) | 0.0477 |
| Antibodies type ACA 4 Scl-70 5, unknown, ACA 4/Scl-70 5 | 90% | 61.54% | ≤162 | 0.74 (0.56–0.88) | 0.0096 |
| Antibodies type Scl-70 5 ACA 4, unknown, ACA 4/Scl-70 5 | 54.55% | 86.36% | >206 | 0.66 (0.48–0.82) | 0.1131 |
| Gastrointestinal diseases Yes No | 66.67% | 75% | >152 | 0.68 (0.47–0.85) | 0.2076 |
© 2020 by the authors. Licensee MDPI, Basel, Switzerland. This article is an open access article distributed under the terms and conditions of the Creative Commons Attribution (CC BY) license (http://creativecommons.org/licenses/by/4.0/).
Share and Cite
Polkowska-Pruszyńska, B.; Gerkowicz, A.; Rawicz-Pruszyński, K.; Krasowska, D. The Role of Fecal Calprotectin in Patients with Systemic Sclerosis and Small Intestinal Bacterial Overgrowth (SIBO). Diagnostics 2020, 10, 587. https://doi.org/10.3390/diagnostics10080587
Polkowska-Pruszyńska B, Gerkowicz A, Rawicz-Pruszyński K, Krasowska D. The Role of Fecal Calprotectin in Patients with Systemic Sclerosis and Small Intestinal Bacterial Overgrowth (SIBO). Diagnostics. 2020; 10(8):587. https://doi.org/10.3390/diagnostics10080587
Chicago/Turabian StylePolkowska-Pruszyńska, Beata, Agnieszka Gerkowicz, Karol Rawicz-Pruszyński, and Dorota Krasowska. 2020. "The Role of Fecal Calprotectin in Patients with Systemic Sclerosis and Small Intestinal Bacterial Overgrowth (SIBO)" Diagnostics 10, no. 8: 587. https://doi.org/10.3390/diagnostics10080587