1. Introduction
The occurrence or activity of the gene product from its coding gene can be investigated through gene expression analyses. The study of gene expression profiling of cells and tissue has become a major tool for discovery in medicine [
1]. It is a profound indicator of biological activity where a change in a biological process results from a changing gene expression pattern. Gene expression data analysis requires suitable tools for storing and managing relevant data. Microarrays have been identified as a promising technology to generate huge amounts of information related to the gene expression data [
2,
3].
DNA microarray experiments permit the portrayal of genome-wide expression variations in various areas like disease and health. These DNA microarrays store data in a consistent expression data matrix. Microarrays have been progressively applied in various medical and biological research activities to solve an array of glitches ranging from human tumor detection to environmental stress alleviation [
4,
5]. Along with contemporary sequencing tools, the microarray technique continues to be an exceptional methodology for large-scale expression analysis and concepts commonly used in genomic technologies. Microarrays can be utilized for conducting very high-end parallel tests of DNA, RNA, proteins, etc., for expression analysis, the detection of mutation, or re-sequencing [
6]. Microarrays have an inherent capacity to spatially sort molecular species such that their concentrations can be autonomously estimated [
7].
Genes portraying coordinated expression across a wide range of experimental settings indicate the incidence of functional linkages between genes. Gene co-expression networks can be used for candidate disease gene prioritization, functional gene annotation, and the identification of regulatory genes. Co-expression networks are effectively only able to identify correlations; they indicate which genes are active simultaneously, which often indicates that they are active in the same biological process, but do not normally confer information about causality or distinguish between regulatory and regulated genes [
8,
9]. Thus, co-expression gene networks can associate the genes of unknown function with biological processes in an intuitive way [
10,
11]. Co-expression networks are connection situations based on the extent of correlation between pairs of genes across a gene expression dataset. There have been a number of studies that support the flexibility of co-expression analysis for inferring and annotating gene functions [
12,
13,
14,
15].
The statistical tests for differential gene expression analysis provide the details of the candidate genes having, individually, a sufficiently low p-value. Nevertheless, it is a challenging task to interpret each single p-value for complex systems that involve numerous interacting genes. Thus, a method for gene expression analysis based on game theory is proposed [
16], wherein a class of microarray games is introduced to quantitatively evaluate the relevance of each gene in generating or regulating the condition of the onset of disease. The main advantage of this approach is the possibility to compute a numerical index, i.e., a relevance index, which represents the relevance of each gene under a certain condition taking into account the expression behavior of the other genes under the same condition.
A supplementary feature of this game theoretic approach is that it provides an innovative property-driven classification of the Shapley value in order to contextualize and validate the use of the Shapley value as a significance index for genes. In some studies, several salient genes are identified according to the Shapley value, and their relations with the pathogenesis of neuroblastic tumors are evaluated [
17,
18]. Microarray games have been used to quantitatively evaluate the relevant genes involved in disease manifestation [
16,
19,
20]. The Shapley value attributed to a certain gene in a given microarray game corresponds to the relevance of that gene for the mechanisms governing the genomic effects of the condition under study. Further, it provides a characterization of a relevance index for genes, which is mainly based on the role they play inside gene-regulatory pathways
. The identification of salient genes that mediate cancer etiology, progression, or therapy response is a challenging task due to the complexity and heterogeneity in cancer biology.
Gene interactions prescribed by some network structure among the participating genes are a recent area of study. The potential applications of network analysis include determining protein or gene function, designing effective strategies for treating various diseases, or providing the early diagnosis of disorders. The information of microarray data must be statistically processed and analyzed to identify the genes that are useful for the diagnosis and prognosis of genetic diseases. Various game theoretic tools are applied to analyze the gene expression data [
16,
18,
21,
22,
23]. All these techniques have been proposed to identify the genes that have various important roles in the onset of a genetic disease.
In this paper, we develop a model of network games to analyze the microarray data of gene co-expression networks under the cooperative framework. While considering such a network, both genes and their connecting links play an imperative role in shaping its overall structure, and therefore, the Shapley value should be substituted by its network counterpart. The standard values for network games are the Myerson value, which is a player based value or allocation rule, and the position value, which is a link based value or allocation rule [
24]. The choice of a particular type of value, player based or link based, depends on the physical problem. If players are more important, we adopt the player based rule, and if the links are more important, we take the link based rule. In our present work, we focus on the gene co-expression networks and the network game over such co-expression networks. Therefore, our emphasis is more towards the linking abilities of the genes that lead to the introduction of the Link Relevance Index (LRI) as a suitable candidate for explaining the relevance of the genes rather than the player based values. We argue that network games can more accurately describe the interactions among genes as they consider not only the cooperation among agents (genes), but also account for how the agents (genes) are connected in a network. We evaluated LRI for the gene co-expression networks, which is analogues to the Shapely value. Therefore, our study involves a more detailed description of genetic markers and their combined effects.
Throughout this paper, we work on a matrix of gene expression values that have been already pre-processed, according to the previous methods. Firstly, we build the theoretical background of the gene co-expression network games, propose the LRI of a network game as a solution representing the significance of each of the genes, and finally, compare the results obtained from the existing methods with our results. The LRI, as we see later, stresses more the links formed by the genes and their respective contributions in the network.
2. Materials and Methods
We recall some basic concepts related to the development of our model from [
9,
16,
17,
18,
21,
23,
25,
26,
27,
28] in
Section 2.1,
Section 2.2,
Section 2.3. In
Section 2.4, we introduce the microarray network games and the corresponding LRI. We also obtain a characterization of the LRI in the context of gene expression networks.
2.1. Cooperative Games with Transferable Utilities
Let
be a finite set of players and
the power set of
N, i.e., the set of all the subsets of
N. A cooperative game with Transferable Utilities (TU) is a pair
, where
is the characteristic function with
. Every subset
S of
N is called a coalition, and its worth is given by the real number
. The set
N of all the players is called the grand coalition. The class of all TU-games on the player set
N is denoted by
. The main assumption in TU-games is that the grand coalition
N will eventually form. A solution is a function
that assigns a vector
to each game
. The Shapley value, which assigns to each player his/her average marginal contribution over all the coalitions, is perhaps the most popular solution concept that builds on some standard rationality axioms [
29]. Formally, given a TU-game
, for each player
, the Shapley value
is defined by,
where
and
are the cardinalities of coalitions
S and
N, respectively.
An alternative representation of the Shapley value can be given as:
where the coefficients
are called the Harsanyi dividends [
30] and given by,
2.2. Microarray Games
Microarray games were defined as TU-games in [
16] that account for the relevance of groups of genes in relation to a specific condition. A Microarray Experimental Situation (MES), which is the basis of the microarray games, is defined as follows (see [
16] for more details).
Let be a set of n genes, a set of r reference samples, i.e., the set of cells from normal tissues, and be the set of cells from tissues with a genetic disease. In a microarray experiment, each sample is associated with an expression profile , where represents the expression value of the gene i in sample j. These expression values are called the dataset of the microarray experiment. The dataset allows for comparison among the expression intensities of genes from different samples. These datasets are presented as two real-valued expression matrices and . An MES is the tuple . In practice, the genes from the samples in that are abnormally expressed with respect to the set are distinguished according to some discriminant function m. The overexpressed genes pertaining to the discriminant function m are assigned one and the normal ones zero. Thus, each MES can be represented by a Boolean matrix , where is the number of arrays with the Boolean values (zero and one). A coalition that realizes the association between the expression property and the condition on a single array is called a winning coalition for that array. Let be the jth column of . The support of , denoted by is the set .
The microarray game corresponding to
is the TU-game
, where
is such that
denotes the rate of occurrences of coalition
T as a winning coalition, i.e., as a superset of the supports in the Boolean matrix
. Formally, for each
,
is the value given by,
where
is the cardinality of the set
. The class of microarray games is denoted by the symbol
. The Shapley value is shown to be a solution to the microarray games by genetically interpreting its properties.
2.3. Network Game
Let be a nonempty set of players that are connected in some network relationship. A link is an unordered pair of players , where . For simplicity, write to represent the link . The set = of all subsets of N of size two is called the complete network. Let denote the set of all possible networks on N. With an abuse of notation, by , we mean that i and j are linked under the network g. For instance, if , then is the network where there is a link between Players 1 and 2 and another link between Players 2 and 3, but there is no link between Players 1 and 3. Therefore, with the above notation, we have and similarly . Let be the set of players who have at least one link in g; that is, . Let denote the number of players involved in g. Take to be the number of links in g. By , we denote the set of links that player i is involved in g, so that . The number of elements in given by is also called the degree of the node in the network g and is denoted by deg(i). For any , , denote by the network obtained through adding networks and and by the network obtained from by subtracting its subnetwork . With an abuse of notation, we use to denote for every link . A path in a network between players i and j is a sequence of players such that for each , with and . The path relationships in a network naturally partition a network into different maximally connected subgraphs that are commonly referred to as components. A component of a network g is a non-empty subnetwork such that:
if and where , then there exists a path in between i and j and
if and , then .
Thus, the components of a network are the maximally connected subgraphs of a network. The set of components of g is denoted by . Note that for all . In our framework, we do not consider the isolated players, i.e., the nodes without any link as components.
Definition 1. A function with the condition is called a value function where ∅ denotes the empty network. The set of all value functions on G is denoted by V. Under the standard addition and scalar multiplication of functions, namely and for each and , V is a linear space.
Definition 2. Given , each of the following special value functions makes a basis for V. Note that the notion of a basis in V is critical to axiomatizing the solution concepts. Since each value function is a linear combination of its basis vectors, the corresponding characterization of a solution in terms of the basis vectors ensures the same characterization of the original game.
Definition 3. A value function is component additive if: Definition 4. A network game is a pair, , where N is a set of players and v is a value function on V. If the player set N is fixed, we denote a network game simply by the value function v.
Definition 5. An allocation rule is a function V that assigns a value to each player .
Thus, an allocation rule in a network game describes how the value generated by the network is allocated among the players. For a survey on the alternative allocation rules for network games, we recommend [
25,
31]. An allocation rule
Y is link based if there exists a function
such that:
Thus, a link based allocation rule allocates the total worth of a network to the players in two steps: the value is first allocated among the links treating them as players, and then, it is divided equally between the nodes (players) forming each such link. The position value [
25,
27,
28,
32] is one of the popular link based allocation rules that is based on the Shapley value [
29] of the links in a network. It is denoted by
and given by (see [
28]),
An equivalent form of the position value using the unanimity coefficients
due to [
28] is given below.
Observe that the position value in a network game
receives half of the Shapley value of each of the links in which the player is involved. In what follows next, we present a recent characterization of the position value due to [
28]. As an a priori requirement, we state the following definitions.
Definition 6. An allocation rule Y defined on is additive if:for each pair of network games with component additive value functions and . Definition 7. For , the link is superfluous in the network game if:for each network . Definition 8. An allocation rule Y defined on satisfies the superfluous link property if:for each network game with a component additive value function v and all links that are superfluous in . The superfluous link property states that if a link in the network is insignificant in terms of the value the network accrues, the allocation rule also does not consider that link for the computation of the value for each player. This idea is similar to the null-player property of TU-games [
25].
Definition 9. A value function v is link anonymous on g if such that .
Link anonymity states that when all the links in a network are interchangeable for the purpose of determining the values of the subnetworks, the relative allocations of the players in the network are determined by the respective number of links in which each player is involved. This idea is similar to that of the symmetry axiom of the Shapley value for TU-games [
25].
Definition 10. An allocation rule Y on is link anonymous if for every network and link anonymous value function on g, there exists an such that: Definition 11. An allocation rule Y satisfies efficiency if for all network games .
In [
28], the following characterization theorem of the position value is proven. This result is used in a later part of this paper.
Theorem 1. ([28], p. 16) The position value is the unique allocation rule on the domain of all value functions that satisfies efficiency, additivity, the superfluous link property, and link anonymity. 2.4. Microarray Network Games and the Link Relevance Index
To obtain a microarray network game, we construct a gene co-expression network and then define a value function on this network. Recall from
Section 1 that the co-expression networks are connection situations based on the extent of correlation between pairs of genes across a gene expression dataset. Here, nodes are genes and connections are defined by the co-expression of two genes. Often, we consider the Pearson correlation coefficient as the initial measure of gene co-expression [
8]. This measure is then transformed into an adjacency matrix, according to different alternative statistical procedures. When the network game is fully described, we obtain this network game. The LRI of the nodes are indicative of the salient genes responsible for the onset of a disease. In the following, we first describe how the gene co-expression network is obtained.
2.4.1. Construction of Gene Co-Expression Networks
We follow a general framework for the construction of gene co-expression networks (for details, see [
33]). In such networks, each gene corresponds to a node, and nodes are connected if the corresponding genes are significantly co-expressed across appropriately chosen tissue samples. In reality, it is tricky to define the connections between the nodes in such networks. To correlate the degrees of two nodes
i and
j, we use the Pearson Correlation Coefficient (PCC). The PCC (or the
r-value) between two nodes is defined as the covariance of the two nodes divided by the product of their standard deviations. If
N is the number of samples and
and
the expression values of genes
i and
j of the corresponding samples, then the PCC is calculated as follows.
Consider the MES . Construct a real matrix using a discriminant function m on the entries of and . In , zeroes represent the normal genes, and the nonzero entries represent the diseased genes with different expression levels of respective samples, which is unlike the Boolean matrix of a microarray game. From , we obtain the adjacency matrix for the gene co-expression network based on some biologically motivated criterion (referred to as the scale-free topology criterion). This is done by defining first a similarity measure between each pair of genes i and j. Denote by the absolute value of the Pearson correlation coefficient, . Note that . Genes with no correlation are assigned a value near , while genes that are strongly correlated are assigned a value near . We denote the similarity matrix by . S can be considered to be a weighted network.
To transform the similarity matrix into an adjacency matrix, an adjacency function needs to be defined. The adjacency function is a monotonically increasing function that maps the interval
into
. The most widely used adjacency function is the signum function, which involves the threshold parameter
; see [
33]. The signum function is defined as follows,
There are several approaches for choosing the threshold parameter . Sometimes, information gets lost due to hard thresholding. For example, if two genes are correlated with coefficient , they are considered to be disconnected with regard to a hard threshold . The signum adjacency function forms an unweighted network. Thus, the gene co-expression network is represented by the adjacency matrix A =, where is one if the connection between two nodes i and j exists and zero otherwise, so the diagonal elements should be zero. Let us denote by the gene co-expression network with respect to the MES .
The following example is a slight modification of Example 1 in [
16] (pg 259), which highlights the process of obtaining a gene co-expression network from an MES.
Example 1. Consider the MES such that the normal sample and the diseased sample are reported in the following tables, respectively.
| Sample 1 | Sample 2 | Sample 3 | Sample 4 |
| Gene 1 | 0.4 | 0.2 | 0.3 | 0.6 |
| Gene 2 | −12 | 10 | 4 | 5 |
| Gene 3 | 4.8 | 3.5 | 5.5 | 6.3 |
| Gene 4 | 12 | 14 | 17 | 19 |
| Gene 5 | 3.1 | 4.6 | 7.2 | 5.6 |
| Sample 1 | Sample 2 | Sample 3 |
| Gene 1 | 0.9 | 0.4 | 0.1 |
| Gene 2 | −11 | 13 | 18 |
| Gene 3 | 2.7 | 1.9 | 5.6 |
| Gene 4 | 10 | 20 | 15 |
| Gene 5 | 2.1 | 6.3 | 1.6 |
The dataset of a microarray experiment is presented in terms of the logarithms of the relative gene expression ratios of the target sample with the reference sample. A positive number indicates a higher gene expression in the target sample than in the reference one, whereas a negative number indicates a lower expression in the target sample.
Now, construct a real matrix from the expression matrices by using a discriminant method
m such that for each
and each
:
The corresponding real matrix is:
In this matrix, zero represents the normal genes, and the real numbers represent the diseased genes with different expression levels of the respective samples. The similarity matrix
S with respect to
is given by:
Considering soft threshold
, it follows that
S represents a weighted network where all genes are connected to each other with some weights. Choosing the power
, the resulting network displays an approximate scale-free topology. However, one potential drawback of the soft threshold is that the network becomes too complex to track the relationship among the nodes. Therefore, the selection of a suitable threshold that allows the connection weights up to a certain level is a critical step. After applying a threshold, we obtain the resulting matrix as an unweighted network. Let us take
for the sake of illustration. Then, the adjacency matrix corresponding to
S becomes:
Thus, is the required gene co-expression network over the microarray experiment situation E and . Similarly, for , the corresponding network will be = .
2.4.2. Microarray Network Games
Once the co-expression network has been constructed, i.e., the adjacency matrix has been formed, we have to define a value function v on G, the set of all possible networks on N. Let and denote, respectively, the set of genes and the number of genes that form the network . For instance, in Example 1, and .
Definition 12. Given the co-expression network , let the support of gene in be defined as the set of links in that gene i is involved in, i.e., for . Therefore, following the standard notations, we have .
Consider the network in Example 1. The supports of the respective genes are , , , , and .
Definition 13. Let be the set of genes. Given an MES and the corresponding gene co-expression network , a microarray network game with respect to E and is the triple where is a network game with the value function v that assigns to each the average number of genes having connections in . Formally, we define the value function as:where = for each . Thus, the value function
v determines the collective influence of a set of genes who are connected through a co-expression network. In practice,
is the average number of genes added over all components that are contained in the set of links where both the genes are involved together in the onset of the disease determined by the network
g. It follows that an equivalent form of the value function
v as a sum of the basis games
defined in Equation (
4) in a microarray network game
is given by:
where we choose the coefficients
such that
. If no ambiguity on
N arises, we denote a microarray network game by the pair
. The class of microarray network games with player set
N is denoted by
.
Example 2. In Example 1, recall that is the gene co-expression network and the set of genes. The value function v of the microarray network game is given by, Thus we have, , v({45}) =, v({12, 23}) = v({12, 45}) =v({23, 45})= , , and for all .
The value function
v of the microarray network game
picks up the information that can be used to define the role of each link in each co-expression of genes by applying suitable solution concepts of network games. The value function
v specifies the total value that is generated by a given network structure. The calculation of the value may involve both costs and benefits in networks and is a richer object than a characteristic function of the microarray game. This is because the value depends on the network structure in addition to the coalition of players involved [
26].
2.4.3. LRI for Microarray Network Games and Its Characterization
In the previous subsection, we discussed the allocation rules for network games. An allocation rule for microarray network games describes how the value generated by a network is allocated among the genes. We call it the LRI. Define the function
on the class of microarray network games as follows.
where
and, hence,
are defined as in Equation (
14). The following example shows the relevance of
F in Example 2.
Example 3. Let us consider the network in Example 2. Using Equation (16), we compute F for different g as follows: The numerical values are indicative of the individual contributions of the genes in the network g, given the microarray network game .
In what follows next, we define the LRI based on properties similar to the ones that are used to characterize the position value. Recall that the superfluous link property states that the presence or absence of a link between players that has no influence on the value of any network also has no influence on the allocations of respective players in a network. The interpretation of the superfluous link property in the genetic context is simple and intuitive. If a link is deleted from the gene co-expression network, i.e., the expression of two genes along this link is controlled, then the corresponding allocation rule also does not consider the effects of their link. Thus, a link is superfluous in the microarray network game if for all networks .
Definition 14. An allocation rule Y on satisfies the superfluous gene link property if for all microarray network games and all links that are superfluous in .
Proposition 1. F given by Equation (16) satisfies the superfluous gene link property. Proof. The proof follows from the simple fact that in a microarray network game , the superfluous links are those links that are not in . □
Recall that link anonymity states that when all the links in a network are interchangeable for the purpose of determining the values of the sub-networks, the relative allocations of the players in the network are determined by the relative number of links in which each player is involved. In the context of gene co-expression networks, the anonymity property says that the value of a gene co-expression network is derived from the structure of the network and not the labels of the genes who occupy various positions. Owing to this property, genes survive, swapping from one organism to the other, as recently observed in [
34].
Definition 15. Let the microarray network game be link anonymous, i.e., for every pair of such that . An allocation rule Y on satisfies the gene link anonymity if there exists for each such that for each link anonymous microarray network game .
Proposition 2. F given by Equation (16) satisfies link anonymity. Proof. Since F is a function of the respective sizes of the networks g, , and (), the result follows immediately from the definition. □
Now, we define the LRI for the class of microarray network games as follows.
Definition 16. An allocation rule is called an LRI on the class of microarray network games if it satisfies efficiency, additivity, the superfluous gene link property, and the gene link anonymity.
The following is a characterization theorem of the LRI.
Theorem 2. F given by Equation (16) is the unique LRI on . Proof. The additivity of
F easily follows from the well-known fact that the unanimity coefficients are additive in value functions. Using Proposition 1 and a result in graph theory that states that
, we have,
Thus, we see that F satisfies all the axioms of an LRI. For the converse part, let the function satisfy these properties. Then, Y can be extended to a function that also satisfies these properties. It is straight forward to show that is the position value on such that . Thus, by the uniqueness of the position value, . This completes the proof. □
Remark 1. In particular, when in Equation (16), an equivalent form of the LRI can be obtained as follows. Take and . Thus, denotes the set of neighbors of i in (i.e., all the nodes that are directly connected to i) and the number of neighbors of node j (that is the degree of j in the graph). Next, consider the game (refer to Equation (5)) with . By Theorem 2, satisfies gene link anonymity. Therefore, we have: Moreover, by Equation (14) and the additivity of F, we have that: Observe that if , , while , for all . It follows that, Equation (17) suggests that, according to the LRI, a node is more important if connected to too many nodes that are not very well connected. This formula is very close (at least in the interpretation) to the Shapley values given in [19,20] for TU-games defined on a gene network. However, the two approaches are completely different both in the game formulation and in the definition of the index. Another important difference between them is that in Equation (17), each node contributes to its relevance a fixed amount of one, whereas in the formula of the Shapley value in [19,20], it contributes with the value of . 3. Results and Discussions
We tested our model on a previously reported colon cancer dataset [
4,
16,
35,
36] (
http://genomics-pubs.princeton.edu/oncology/affydata/index.html.) containing the expression of 2000 genes with highest minimal intensity across 62 tissues. In the expression data measured using Affymetrix oligonucleotide microarrays, forty tumor samples and a set of 22 normal samples exist. An adjacency matrix is obtained using the signum function based hard thresholding approach, which encodes edge information for each pair of nodes in the network. A pair of genes is said to be connected by an edge if their similarity value, which is calculated using the Pearson correlation, is greater than a threshold. We considered the threshold value to be
for our experiment.
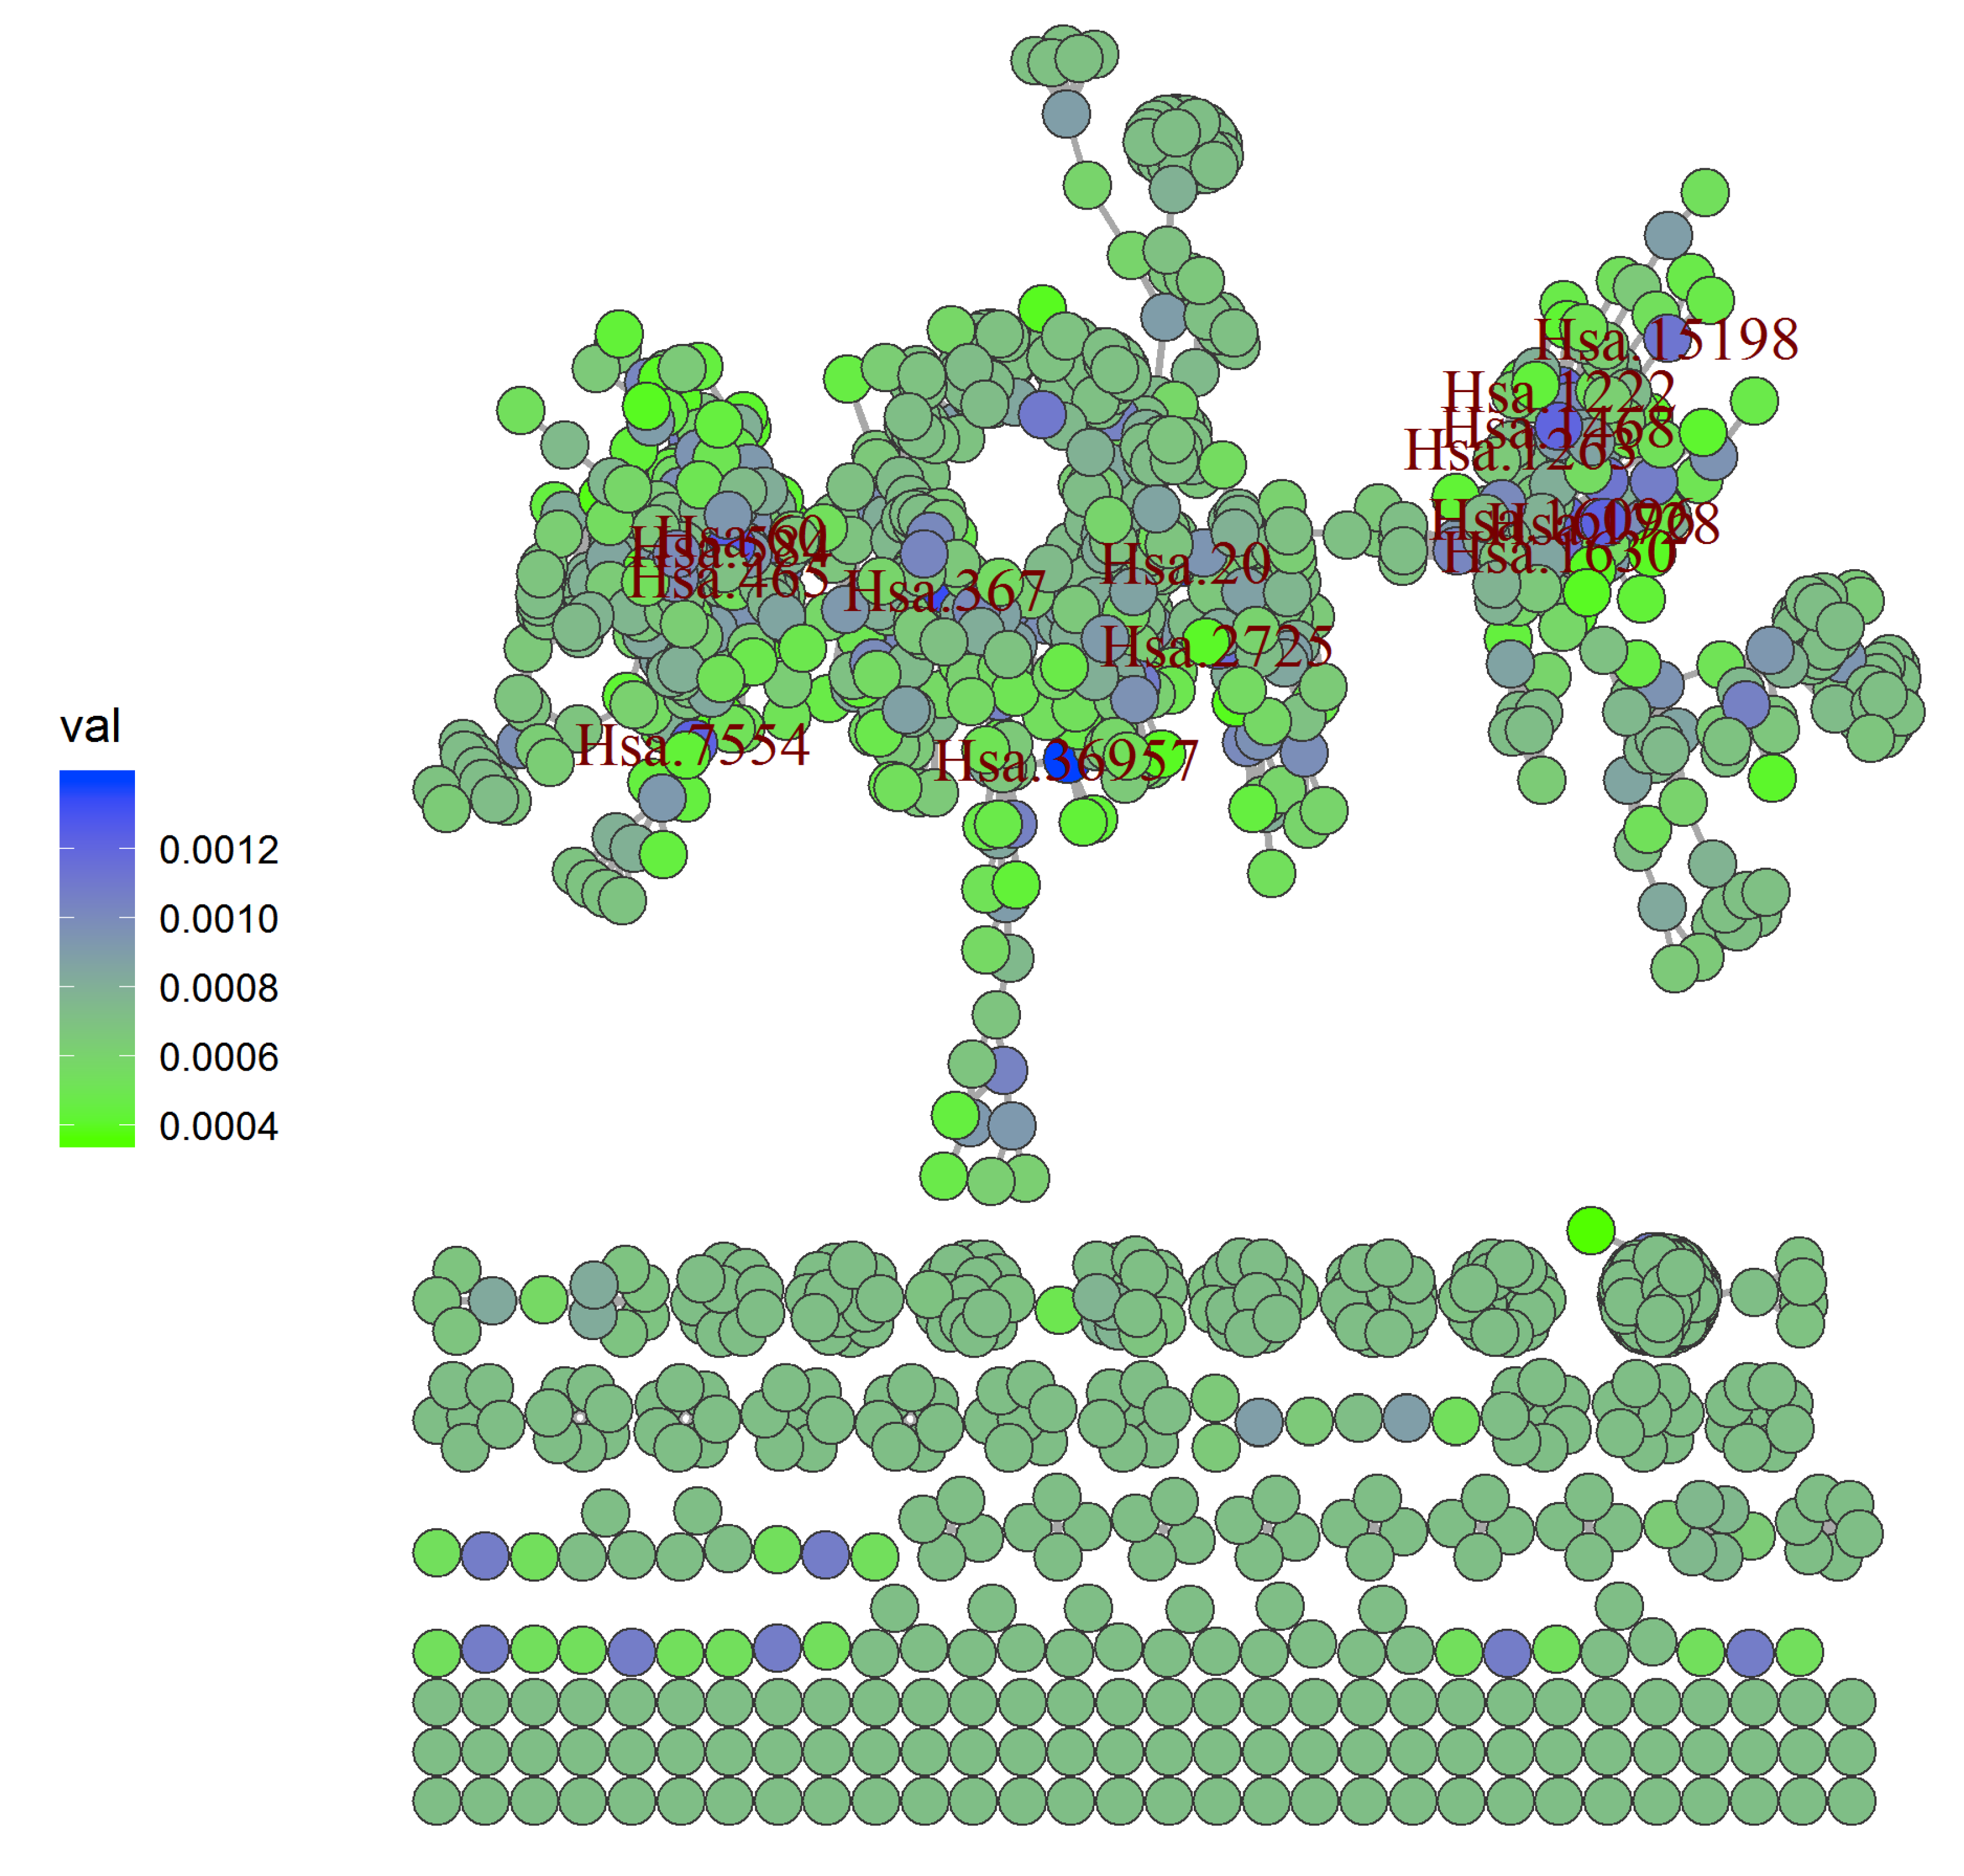
A network (
Figure 1) was constructed employing the LRI on the colon cancer dataset (refer
Section 3). The network was made utilizing the igraph [
37] package in R [
38] by using the adjacency matrix generated after removing isolated points. The colors of the nodes connote the link relevance index varying from least (green) to highest (blue). Affy IDs of the top 15 genes are used to label the highest LRI nodes. The top fifteen genes selected by their highest LRI and its corresponding Shapley values reflect various cellular mechanisms (
Table 1). Most of them were previously observed to be associated with the colon cancer.
We further analyzed if the genes were similarly ranked by the two methodologies
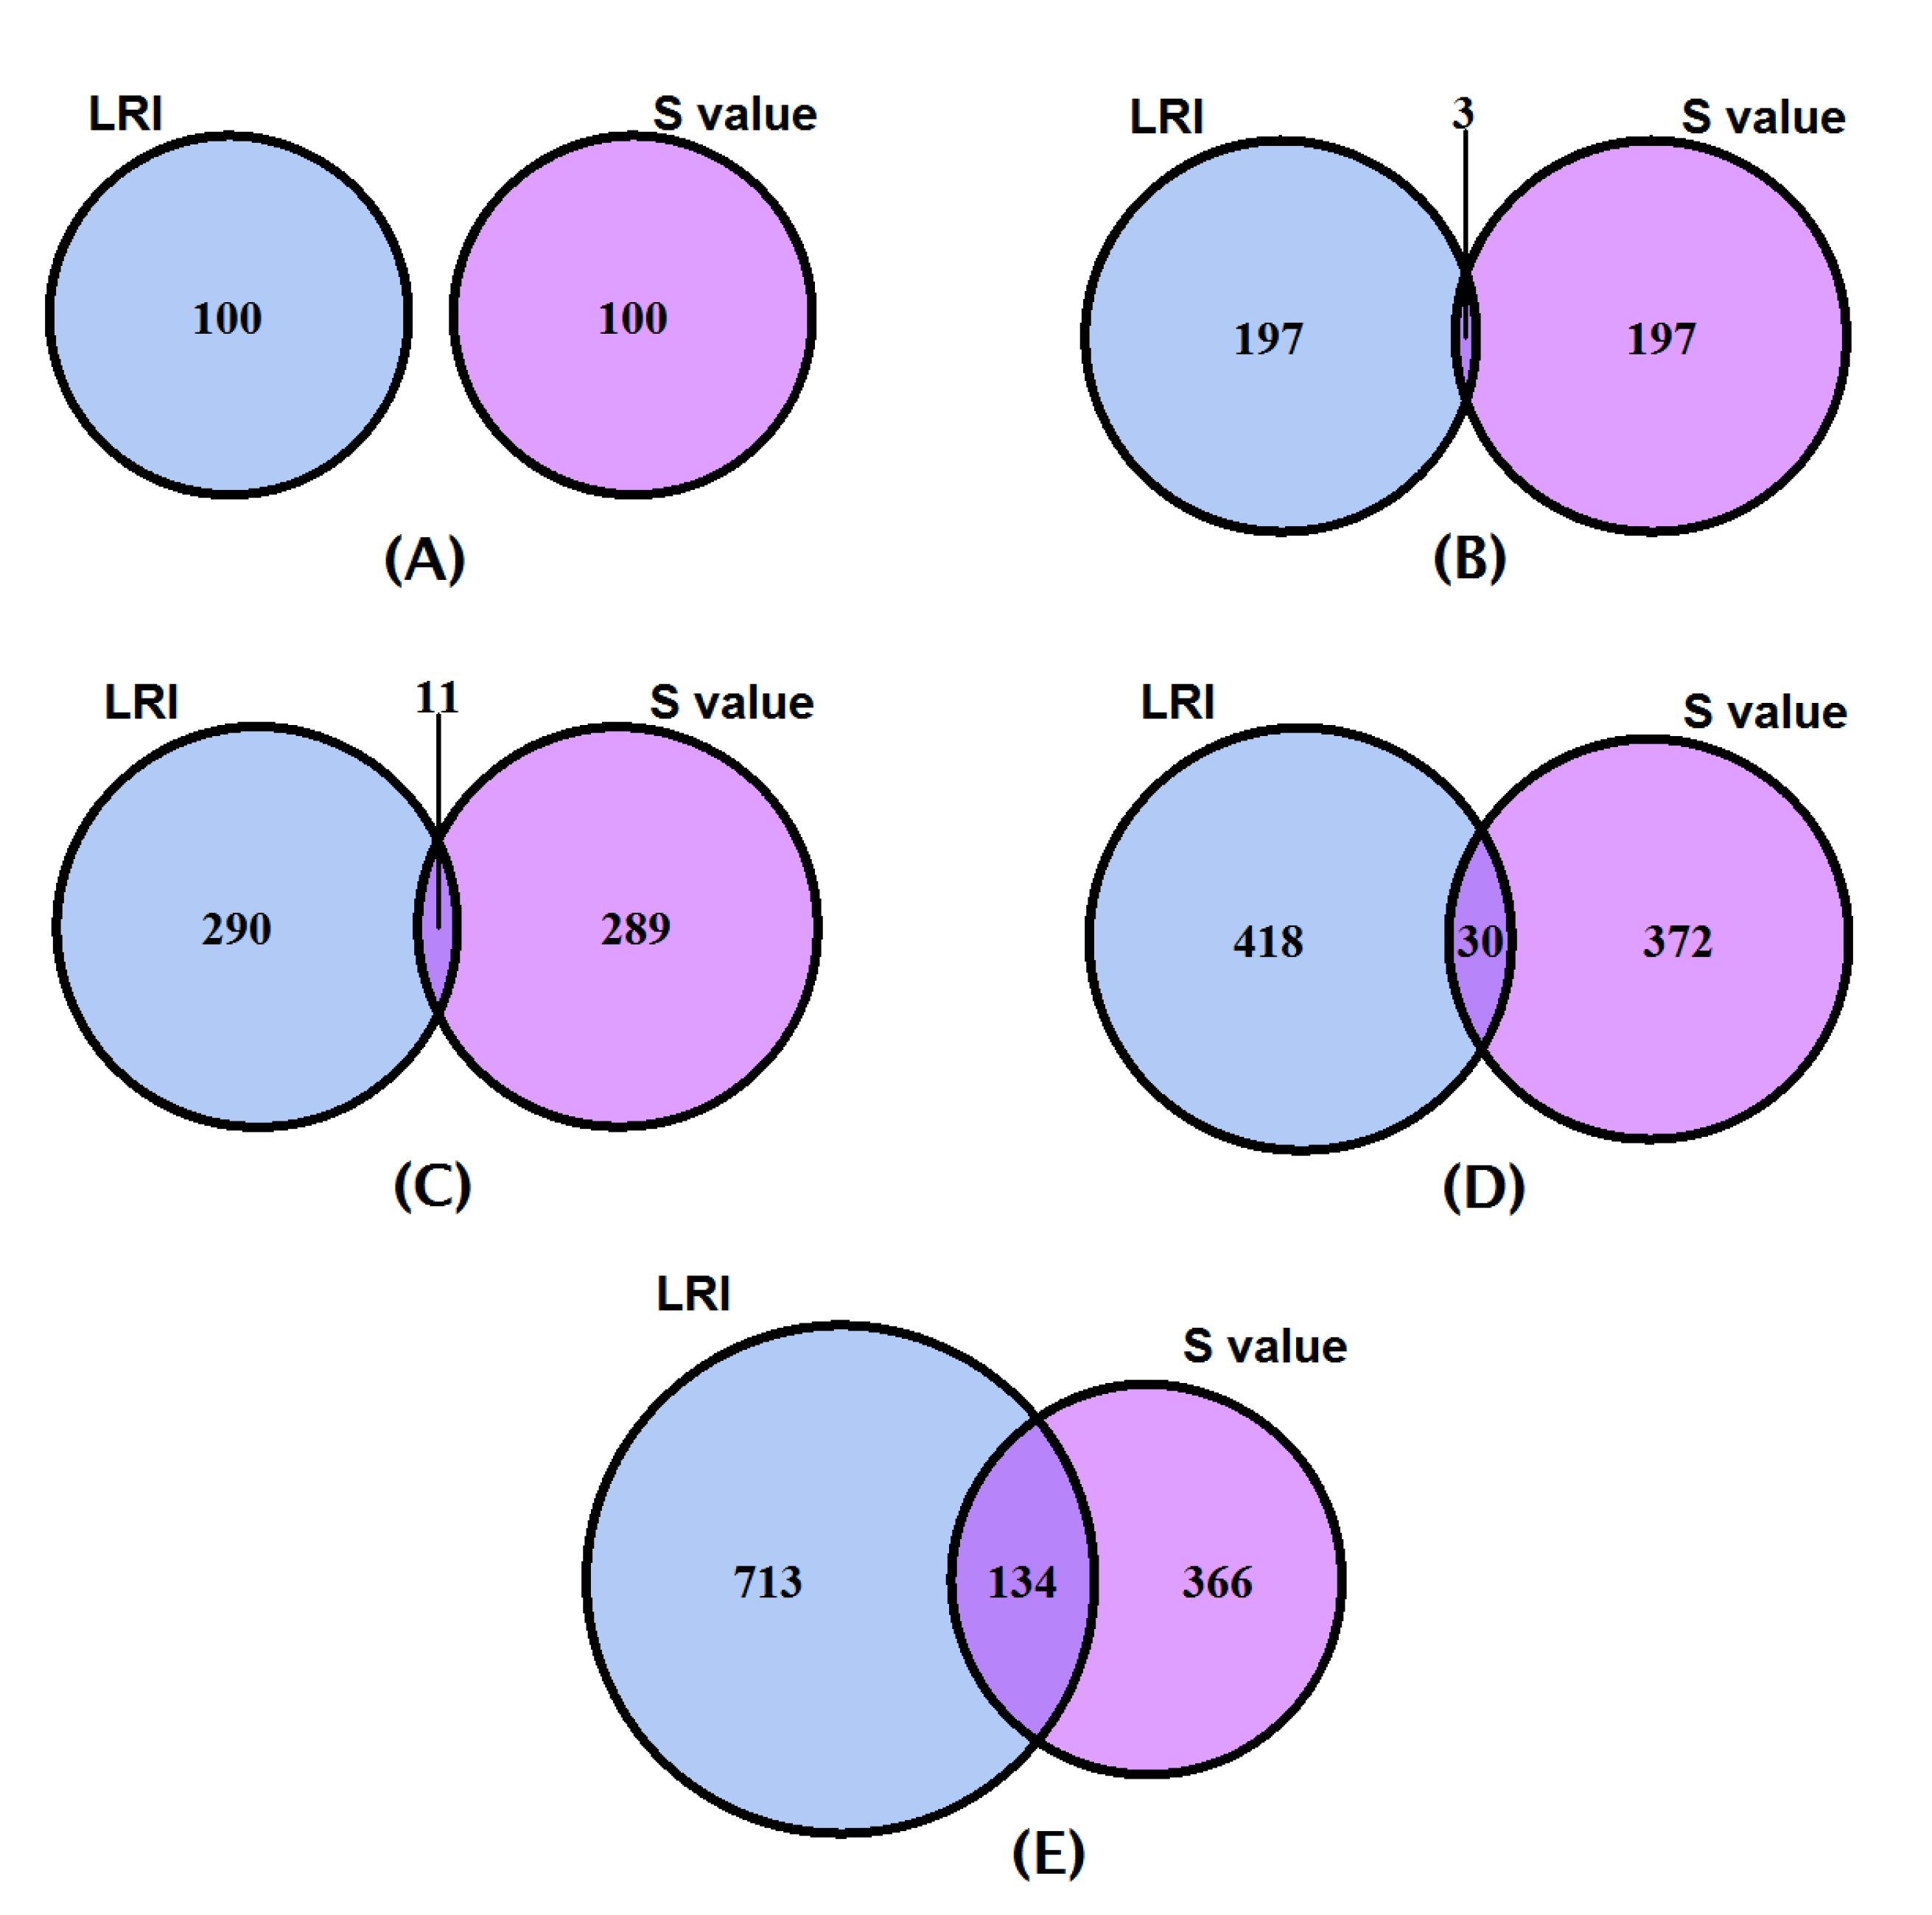
, the LRI and the Shapely value. The LRI and the Shapely value depict no overlap between the top 100 genes (
Figure 2A). However, the top 200, 300, 400, and 500 genes (
Figure 2B–E) exhibit 3, 11, 30, and 134 gene overlaps, respectively, between the two indices, suggesting there is a difference in the relative scoring of the genes using the two methodologies and therefore less similarity in the top selected gene sets.
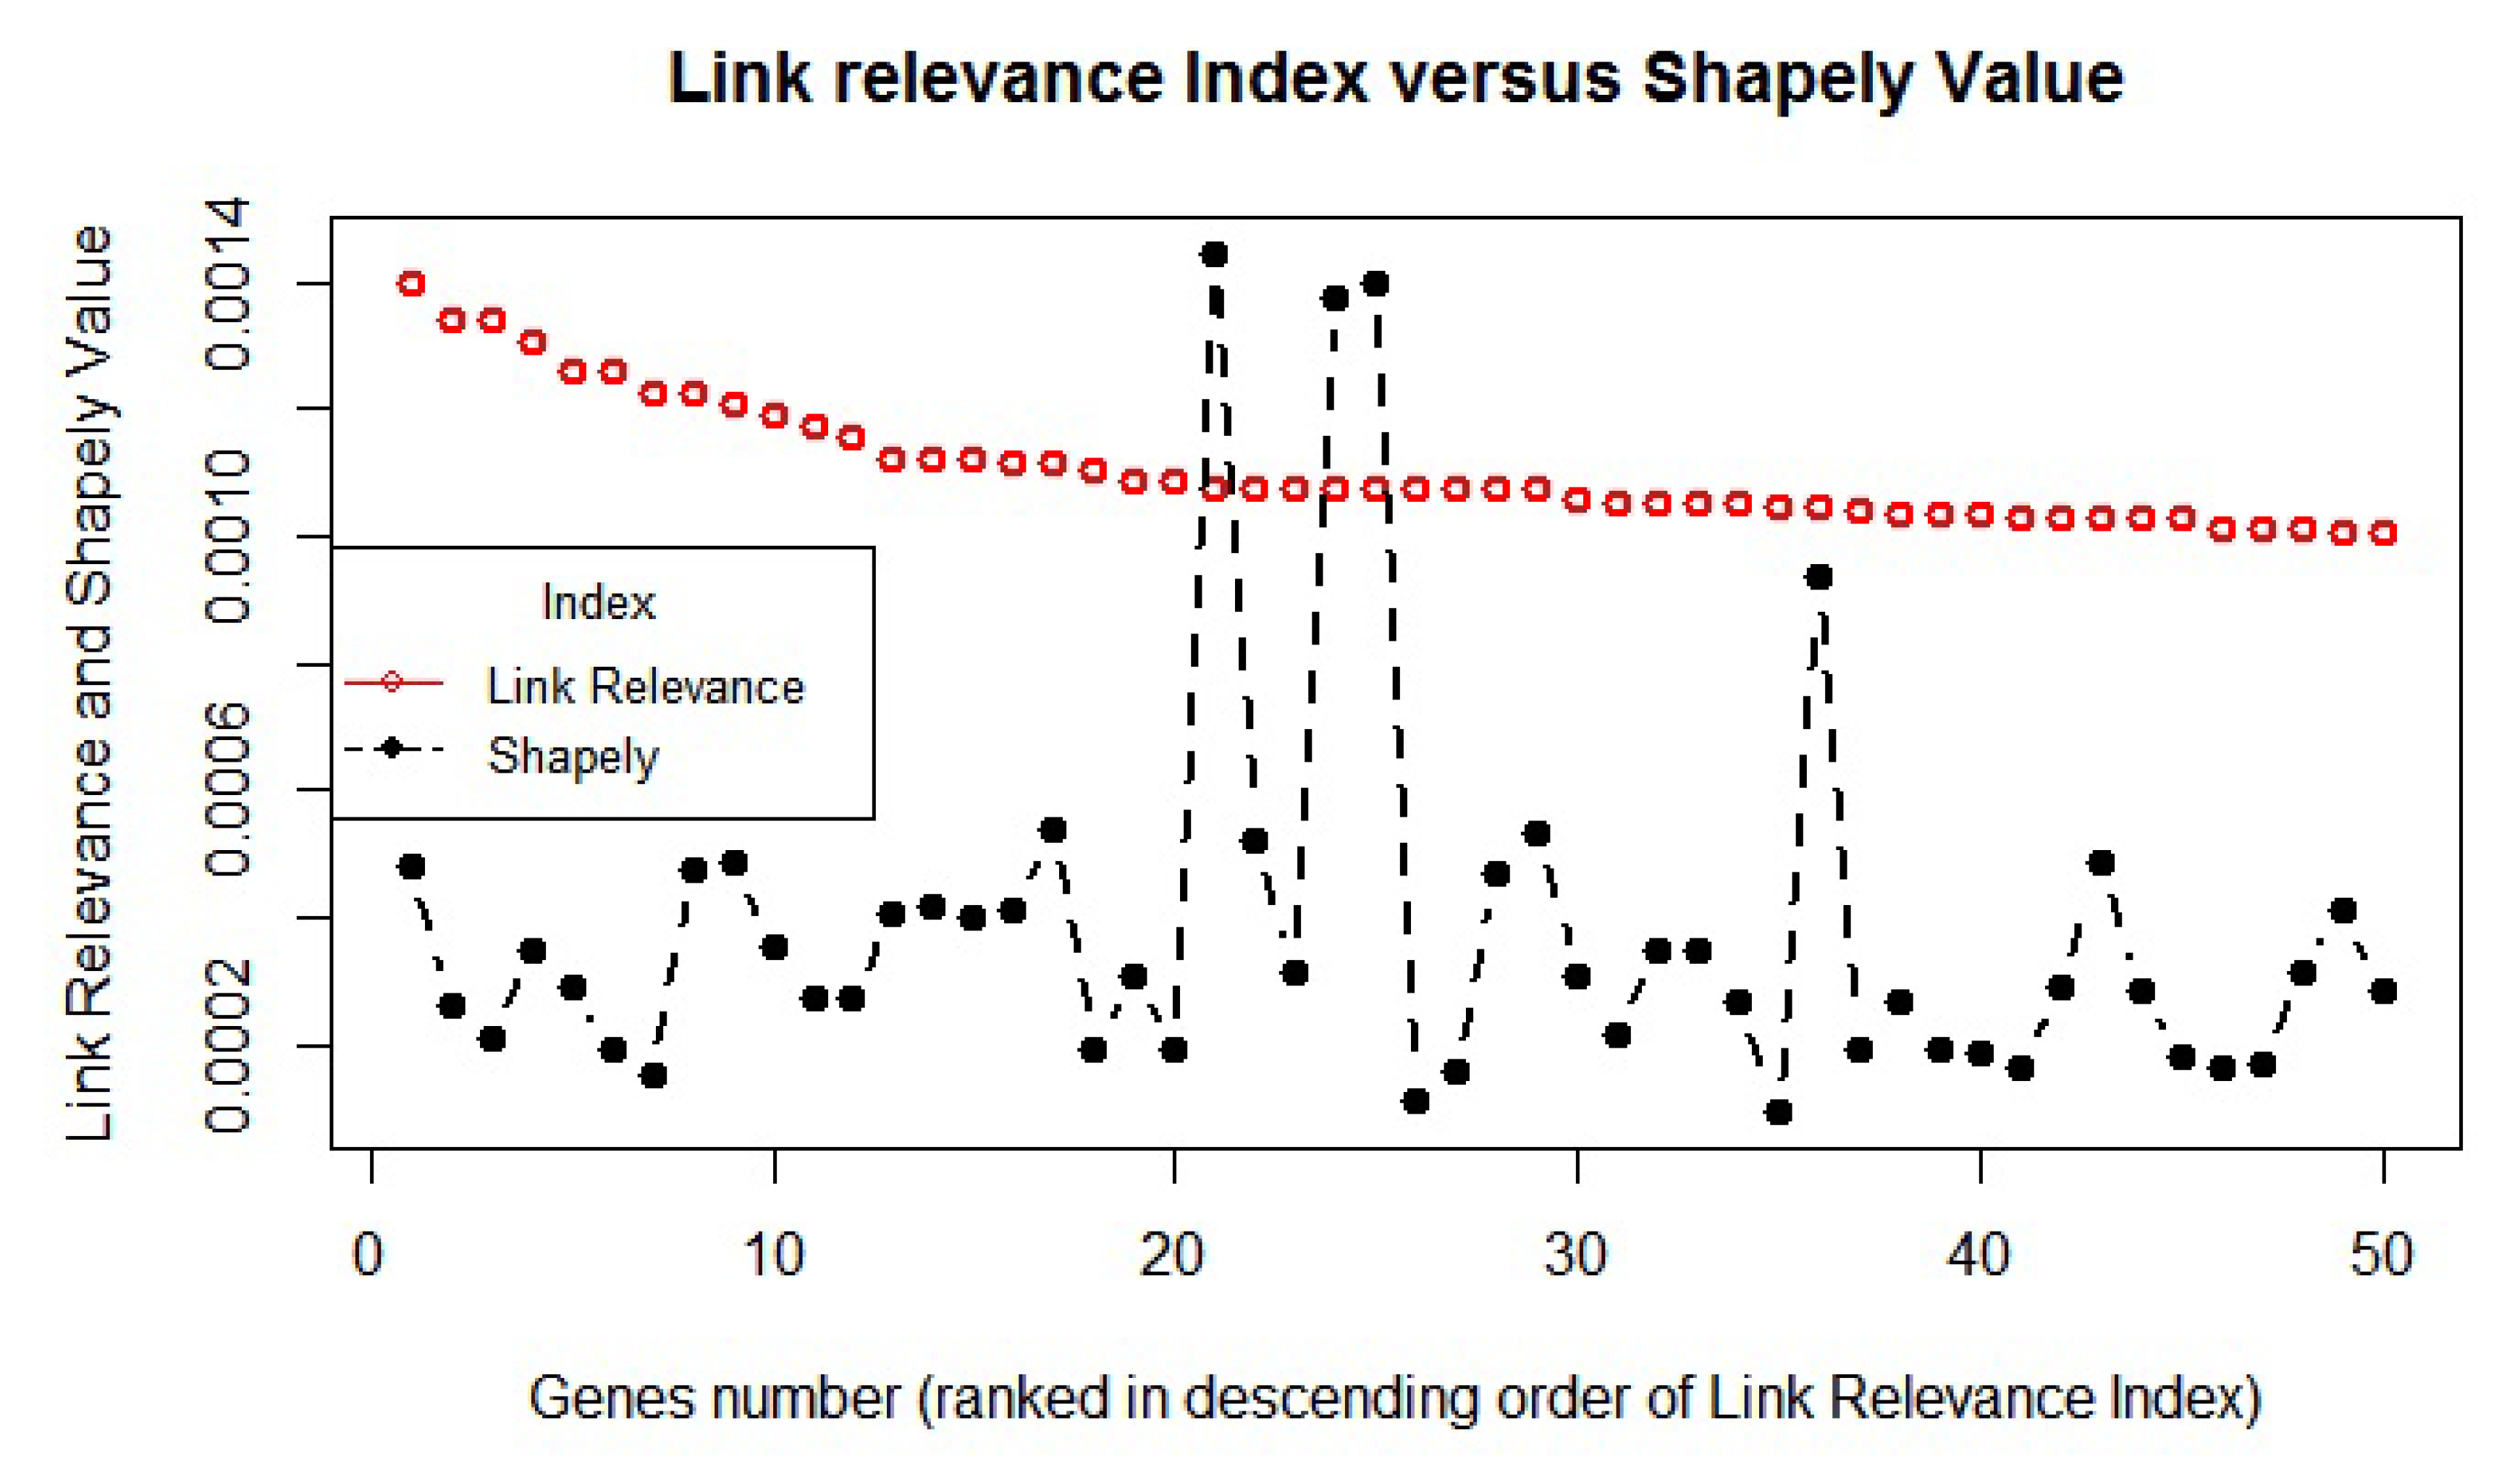
The LRI and the corresponding Shapely value of top 50 genes are plotted to analyze any link/similarity between them (
Figure 3). We found that the distribution of the LRI score of the top genes was not only different than the Shapely value, but also their distribution may follow a varied trend due to the likely difference in the background ranking method. Furthermore, Pearson’s correlation also suggests no significant correlation (
) between the LRI and Shapely value. The two methods were found to be separate in terms of their overall findings, and therefore, the LRI was considered to be a unique approach rather than a derived one.
We retrieved the list of all marker genes from the CellMarker database [
16,
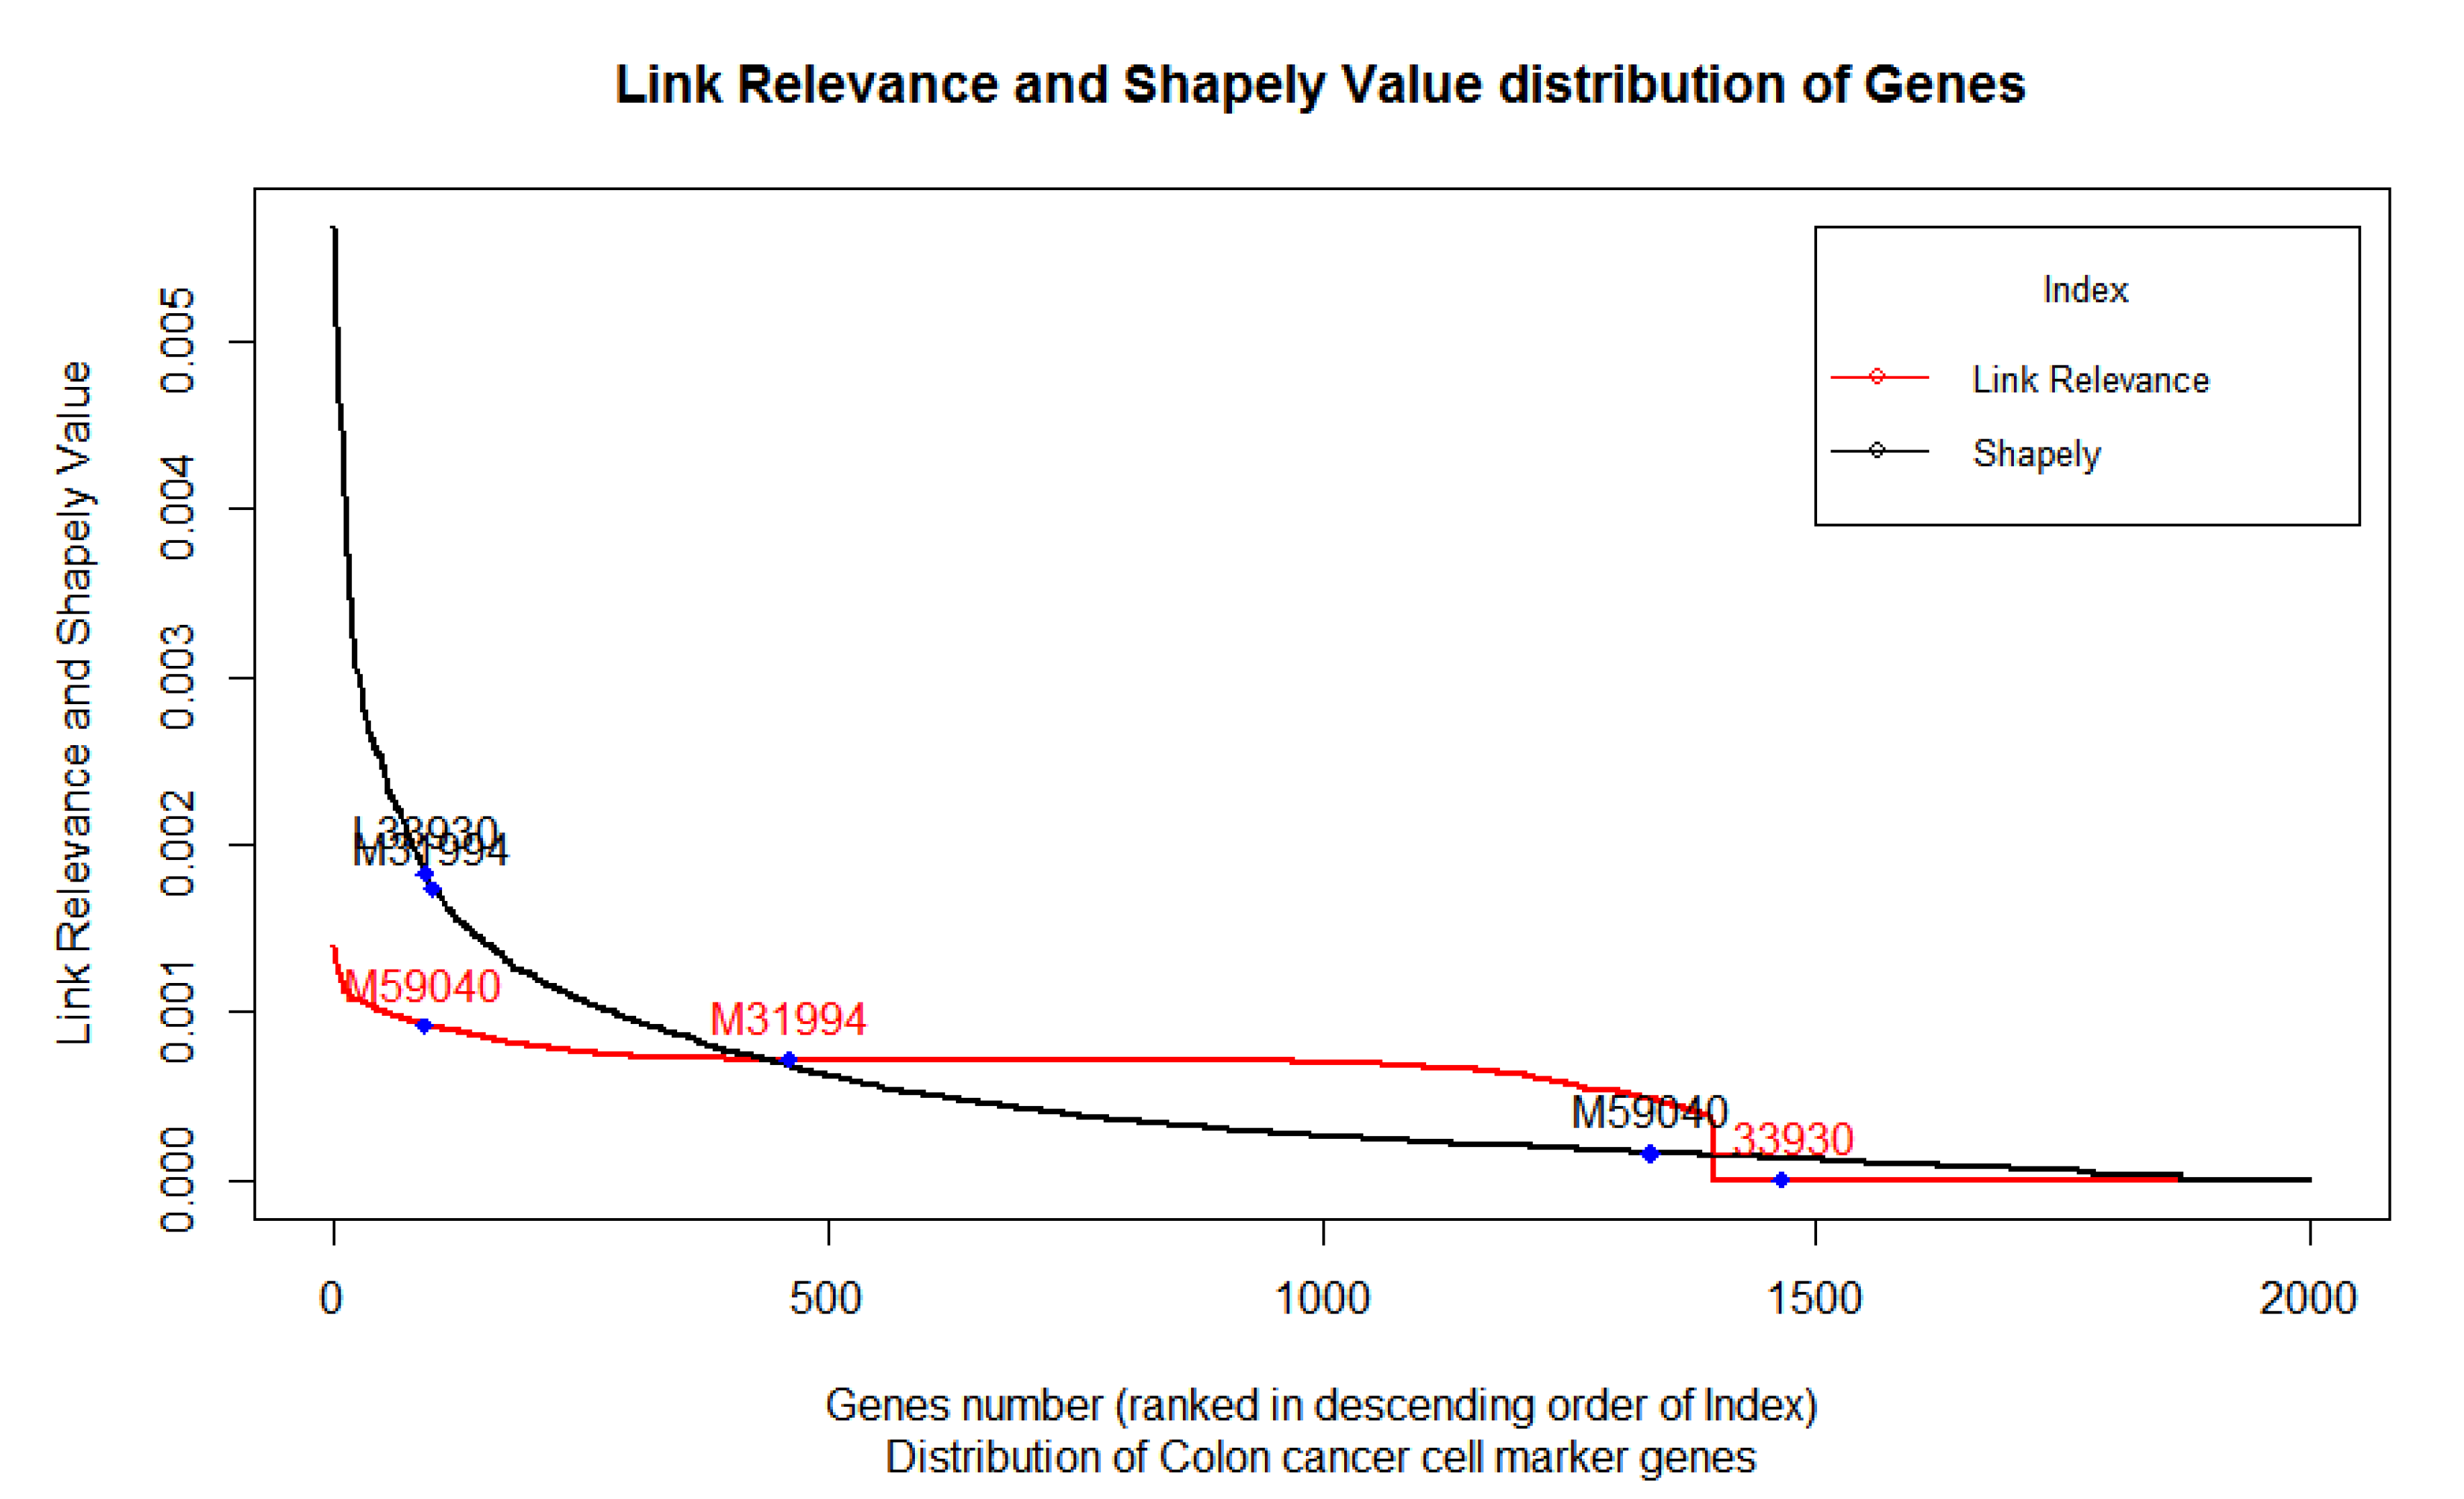
39] that were well characterized and validated through the experimental setup and not just through theoretical estimation. Thereafter, we mined these marker genes to corresponding gene names and mapped them against the probe in the microarray platform. Three IDs viz. “Hsa.1240”, “Hsa.654”, and “Hsa.663“ corresponding to genes ALDH1A1(M31994), CD24 (L33930), and CD44(M59040), respectively, were selected for further analysis, as can be seen in
Figure 4.
Figure 4 exhibits the distribution of the LRI of 2000 genes from highest to lowest in a rank-wise manner for each gene. We also plot the position of the three biomarkers, namely (CD44) M59040, (ALDH1A1) M31994, and (CD24) L33930, to show their relative position in this distribution. Shapely values of corresponding microarray games, arranged from highest to lowest, are also presented to compare the distribution pattern and relative position of the three biomarkers. LRI was able to correctly estimate the expected relative position of these colon cancer biomarkers. On the one hand, the Shapely value exhibited an exponential increase in the score, the LRI, which is based on the contribution of each gene in the co-expression network, exhibited a nonlinear curve in the distribution of the scores of 2000 genes.
Colon Cancer Stem Cells (CCSCs) not only have the potential of self-renewal and differentiation, but also exhibit “tumorigenicity” when transplanted into an animal host. CD44 (M59040) expressed on the surface of the CCSC is reported to have a major role in the progression, survivability, and “tumorigenicity” of such CCSCs, thereby making it a potent biomarker and target for diagnosis, biosensing, prognosis, and therapeutics in the case of colon cancer [
40,
41,
42,
43]. Du L et al. (2008) [
41] reported the relevance of CD44 as a superior marker and its functional significance in contributing to CCSCs for cancer initiation and progression.
We found the LRI was able to estimate the higher relevance of CD44 (M59040) by means of estimating its contribution in the co-expression network by assigning it higher index of relevance. On the other hand, the same gene scored poorly in the Shapely value, which undermines its relevance. This validates that the LRI is better able to estimate the relevance of the gene compared to the Shapely value (
Table 2,
Figure 4).
The gene M31994 encodes Aldehyde dehydrogenase 1A1 (ALDH1A1), which catalyzes aldehydes to their corresponding carboxylic acids through the oxidation process [
44]. It has also been enunciated that a considerable amount of ALDH1A1 enrichment occurs in colon cancer [
45,
46]. ALDH1A1 has been successfully used as a CCSC marker along with many other cancers, including breast cancer [
47,
48]. However, studies evaluating the association/relationship between ALDH1A1 expression with colon cancer initiation and progression for prognosis and therapeutics remain inconclusive [
49,
50,
51,
52,
53]. Scientists have argued about the significance of the role of ALDH1A1 in colorectal cancer. Furthermore, clinical evidence equivocally suggests ALDH1A1’s application as a prognostic or predictive biomarker in colon cancer [
50]. Moreover, most of the aforementioned research articles did mention the role of CD44 along with ALDH1A1 in cancer initiation, progression, and metastasis.
The gene M31994’s (ALDH1A1) relevance in the control case dataset of colon cancer was found to be moderate using the LRI. However, for the Shapely value, the same gene scored very high along with L33930 (CD24). The LRI method was better able to estimate its position relative to M59040 (CD44) compared to the Shapely value.
CD24 is the product of the L33930 gene and is anchored on the exterior side of the cell membrane. The positive expression and overabundant distribution of CD24 in colorectal cancer is under dispute [
52]. A few previous studies reported that CD24 was expressed higher in a fraction of the colorectal cancer population [
54,
55]. Furthermore, researchers asserted CD24 expression to be limited to only a small fraction of colon cancer cell lines [
56]. However, none of these previous reports refuted the significant role of CD44 in colon cancer cell lines. Instead, experimental evidence indicated that CD44 expression was highly significant in the considered colon cancer cell lines, thus highlighting its importance in colon cancer development and progression, but maintaining that only a fraction of these cells exhibited the expression of CD24 [
52,
54,
55,
56]; in the authors own words, at “a fair level of 5–10%” [
56]. They reported that HCT116 and SW480 colon cancer cells were CD44+ cells and that only a subpopulation of these CD44+ cells exhibited CD24 [
56]. Evidence based on clinical studies not only highlighted the marginal contribution of CD24 [
52,
56], but also stressed CD44 expression in CCSC in initiating cancer, thus making it a better biomarker for colon cancer [
41,
52].
While comparing the three biomarkers, LRI rightfully estimated the marginal contribution of L33930 (CD24) in colon cancer development and progression; however, the Shapely value scored it very high compared to M59040 (CD44). The Shapely values scored L33930 (CD24) highest among all three genes, despite the previous experimental evidences suggesting its relatively lower relevance. The LRI, however, was able to predict the relative relevance of this gene and positioned it after M59040 (and M31994). In fact, the LRI was able to predict that L33930’s (CD24) role is only incidental and that its expression has no or marginal contribution to colon cancer.
Compared to the Shapley value, the LRI was able to identify the relative contribution/position of the three colon cancer biomarkers. The relevance of same three biomarkers is also evident from experimental studies, including high-throughput single cell RNA seq, as mentioned in the PanglaoDB [
57].


 ,
, 


