Article

ZmCOP1 Regulates Maize Mesocotyl Length and Plant Height through the Phytohormone Pathways

1
College of Agronomy, Qingdao Agricultural University, Qingdao 266109, China
2
The Characteristic Laboratory of Crop Germplasm Innovation and Application, Provincial Department of Education, College of Agronomy, Qingdao Agricultural University, Qingdao 266109, China
3
State Key Laboratory of North China Crop Improvement and Regulation, Hebei Sub-Center for National Maize Improvement Center, College of Agronomy, Hebei Agricultural University, Baoding 071001, China
*
Authors to whom correspondence should be addressed.
These authors contributed equally to this work.
Life 2023, 13(7), 1522; https://doi.org/10.3390/life13071522
Submission received: 10 April 2023 / Revised: 27 June 2023 / Accepted: 30 June 2023 / Published: 7 July 2023

Abstract

:
The morphogenesis of crops is critical to their yield performance. COP1 (constitutively photomorphogenic1) is one of the core regulators in plant morphogenesis and has been deeply studied in Arabidopsis thaliana. However, the function of COP1 in maize is still unclear. Here, we found that the mesocotyl lengths of zmcop1 loss-of-function mutants were shorter than those of wild-type B73 in darkness, while the mesocotyl lengths of lines with ZmCOP1 overexpression were longer than those of wild-type B104. The plant height with zmcop1 was shorter than that of B73 in both short- and long-day photoperiods. Using transcriptome RNA sequencing technology, we identified 33 DEGs (differentially expressed genes) between B73′s etiolated seedlings and those featuring zmcop1, both in darkness. The DEGs were mainly enriched in the plant phytohormone pathways. Our results provide direct evidence that ZmCOP1 functions in the elongation of etiolated seedlings in darkness and affects plant height in light. Our data can be applied in the improvement of maize plant architecture.

1. Introduction

Plants exhibit different morphological characteristics when grown in darkness and in light; together, these phenomenon is called morphogenesis [1,2]. The elongation of the hypocotyl or mesocotyl is critical to seedling emergence [3,4,5]. In Arabidopsis thaliana, COP1 (constitutively photomorphogenic 1) plays a central role in morphogenesis [6,7,8]. In darkness, the Arabidopsis thaliana hypocotyl elongates, while weak cop1 mutants have shown a short hypocotyl length and open cotyledons [9].
In darkness, COP1 usually binds SPA1 (suppressor of phya 1) to form the COP1–SPA complex [10]. PIF1 (phytochrome interacting factor 1) interacts with the COP1–SPA complex to induce degradation of HY5 (elongated hypocotyl 5), resulting in hypocotyl elongation [11,12,13,14]. COP1 also participates in the degradation of WDL3 (wave-dampened 2-like 3) through the 26S proteasome-mediated pathway, leading to hypocotyl elongation [1,15].
In light, CRY (cryptochrome) inhibits the regulation activity of the COP1–SPA complex and stabilizes HY5 [16,17,18,19,20]. The Pfr (far-red light-absorbing form) of the photosensitive pigment induces phosphorylation of PIFs. Phosphorylated PIFs are recognized by COP1–SPA, then ubiquitinated and degraded by the 26S proteasome [14,21]. Thus, the stability of HY5 and the degradation of PIFs inhibit hypocotyl elongation. COP1 is also involved in the regulation of the circadian clock (Bhatnagar et al., 2020). A weak cop1 mutant showed a short circadian clock gene expression cycle and an early flowering phenotype under short daylight [9,15,22,23,24].
Hormones such as BR (brassinolide), JA (jasmonic acid) and ETH (ethylene) play important roles in the regulation of morphogenesis. In Arabidopsis, BR promotes skotomorphogenesis. BRI1 (BR-insensitive1) and BIN2 (BR-insensitive2) promote accumulation of BBX28 and BBX29. BBX28 and BBX29 interact with BEE1 (BR-enhanced expression1), BEE2 (BR-enhanced expression2) and BEE3 (BR-enhanced expression3) [25]. HY5 enhances the activity of GSK3-like kinase BIN2 (brassinosteroid-insensitive 2) to repress skotomorphogenesis [24]. Ethylene inhibits EBF1 (ethylene response factor1) and EBF2 (ethylene response factor2) to stabilize EIN3 (ethylene-insensitive 3) and EIL1 (EIN3-like 1), respectively, inhibiting the opening and expansion of Arabidopsis cotyledons and maintaining skotomorphogenesis [26,27].
COP1 homologs have been identified in various plants, including Arabidopsis thaliana, Sorghum bicolor, Zea mays and Oryza sativa (Huai et al., 2020). Although ZmCOP1 has been shown to restore the atcop1-4 phenotypes in Arabidopsis, the function of ZmCOP1 in maize has not been well studied. Here, we have phenotypically characterized zmcop1 mutants and overexpression lines and identified DEGs between zmcop1 mutants and wild types using RNA sequencing technology. We have shown that ZmCOP1 may inhibit the elongation of the mesocotyl through the BR signal transduction pathway. We have provided evidence that ZmCOP1 has a conserved function in Zea mays and Arabidopsis thaliana.

2. Materials and Methods

2.1. Plant Material and Growth Conditions

zmcop1-1 and zmcop1-2 mutants were collected from the maize EMS mutant library (www.elabcaas.cn, accessed on 14 September 2021). The wild type (B73 inbred line) from the same library was used as a control.
For the wild type (WT), zmcop1-1 and zmcop1-2, a mesocotyl elongation analysis and an RT-qPCR analysis were performed. In a chi-square test, the WT and zmcop1-1 were crossed to generate F1 hybrid lines; then, F1 hybrid seeds were self-fertilized to generate F2 lines. Around 140 seeds from one F2 ear were planted in soil in a greenhouse. The F2 seedlings were grown in the dark for 5–7 days. For plant height analysis, WT and zmcop1-1 were planted in Jiaozhou (36.26429, 120.03192) in the summer of 2021, in Ledong (36.26429, 120.03192) in the winter of 2021 and in Jiaozhou again in the summer of 2022. The mesocotyl length and the plant height of the 7 day old etiolated seedlings were measured according to the standard methods.
ZmCOP1 overexpression transgenic lines were generated by Beijing Bomei Xing’ao Technology Co., Ltd. In general, the ZmCOP1 coding sequence was amplified and inserted into the 521 plasmid, furthered by the ZmUBI promoter. The transformation was performed following the standard Agrobacteria-mediated transformation protocol for maize, using B104 immature embryos. Positive transformation events were selected based on kanamycin and bar herbicide resistance. Positive transgenic lines were confirmed with PCR.

2.2. DNA Extraction and Genotyping

The CTAB method was used to extract the total DNA from leaves grown for 7 days. Two pairs of primers were designed near two mutation sites using primer5.0. To perform PCR, 2x Taq PCR StarMix with Loading Dye (GenStar) was used. A 1% agarose gel electrophoresis experiment was used for the last step of genotype detection.

2.3. Measurement of SPAD Value

The SPAD values (relative content of chlorophyll) of the ear leaf and the first leaf between the WT and zmcop1 were measured with SPAD502 (Zhejiang Top Cloud-Agri Technology Co., Ltd., Hangzhou, China). The measuring position of the ear leaf was about 6 cm from the base of the first ear, and the measuring site of the first leaf was about 10 cm from the tip of the leaf. At least 15 groups of data were collected.

2.4. RNA Sequencing

2.4.1. RNA Extraction

The construction of a cDNA library and an RNA sequencing analysis was completed with Wuhan MetWare Biotechnology Co., Ltd. (Wuhan, China).
Seven-day-old etiolated seedlings were collected for RNA isolation. Four biological replicates were used. The RNA purity was checked using a NanoPhotometer® spectrophotometer (IMPLEN, Westlake Village, CA, USA). The RNA concentration was measured using a Qubit®2.0 Fluorometer (Thermo Fisher Scientific, Carlsbad, CA, USA). The RNA integrity was assessed using an RNA Nano 6000 Assay Kit of a Bioanalyzer 2100 system (Agilent Technologies, Santa Clara, CA, USA).

2.4.2. Library Preparation for Transcriptome Sequencing

A total of 1 μg of RNA was used for each sample library preparation. Sequencing libraries were generated using a NEBNext® UltraTM RNA Library Prep Kit for Illumina® (New England Biolabs, Ipswich, MA, USA), following the manufacturer’s recommendations. Briefly, mRNA was purified from the total RNA using poly-T oligo attached magnetic beads. Fragmentation was carried out using divalent cations and under elevated temperatures in NEBNext First Strand Synthesis Reaction Buffer (5X). The first-strand cDNA was synthesized using a random hexamer primer and M-MuLV Reverse Transcriptase (RNase H-). Second-strand cDNA synthesis was performed using DNA Polymerase I and RNase H. cDNA fragments (preferentially 250~300 bp in length) were purified with an AMPure XP system (Beckman Coulter, Indianapolis, IN, USA). The PCR products were purified (AMPure XP system), and the library quality was assessed with the Agilent Bioanalyzer 2100 system.

2.4.3. Clustering and Sequencing

Clustering of the index-coded samples was performed with a cBot Cluster Generation System using a TruSeq PE Cluster Kit v3-cBot-HS (Illumia, San Diego, CA, USA), according to the manufacturer’s instructions. After cluster generation, the library preparations were sequenced on an Illumina platform and 150 bp paired-end reads were generated.

2.4.4. Analysis of the RNA-Seq Data

The raw sequencing data were filtered using fastp v0.19.3 with adapters and then aligned to Zm-B73-REFERENCE-NAM-5.0. The aligned reads were calculated with FeatureCounts v1.6.2. HISAT v2.1.0 was used to construct the index and to compare the clean reads to the reference genome [28].
Afterward, StringTie v1.3.4d was used for the prediction of new genes [29]. featureCounts v1.6.2 and StringTie v1.3.4d were used to calculate the gene alignment and the FPKM. DESeq2 v1.22.1 and edgeR v3.24.3 were used to analyze the differentially expressed genes between the two groups [30,31,32], and the p-values were corrected using the Benjamini–Hochberg method. The corrected p-values and |log2foldchange| were used as the thresholds for significant difference expression. A hypergeometric distribution test was used for KEGG and GO term analyses [33,34,35].

2.5. RT-qPCR Analysis

A SteadyPure plant RNA extraction kit (AG) was used to extract the total RNA. MonScriptTM RTIII ALL-in-One Mix with dsDNase (Monad) was used for reverse transcription. SYBR Green Pro Taq (AG) was used with an ABI 7500 Real-Time PCR System for fluorescence quantification; the amplified product was diluted to 500 ng/μL. The relative gene expression was calculated with the ΔΔCt method. UBQ and AT1 were used as actins [36,37]. The primers used in this experiment are listed in Supplementary Table S1.

2.6. Statistical Analysis

Statistical analyses were performed using an ANOVA of Student’s t-test (p < 0.05; LSD and Duncan test) in GraphPad Prism8 software (version 8.0.2, GraphPad Software, San Diego, CA, USA). All experiments were repeated at least three times. p = 0.05 indicated significant values.

3. Results

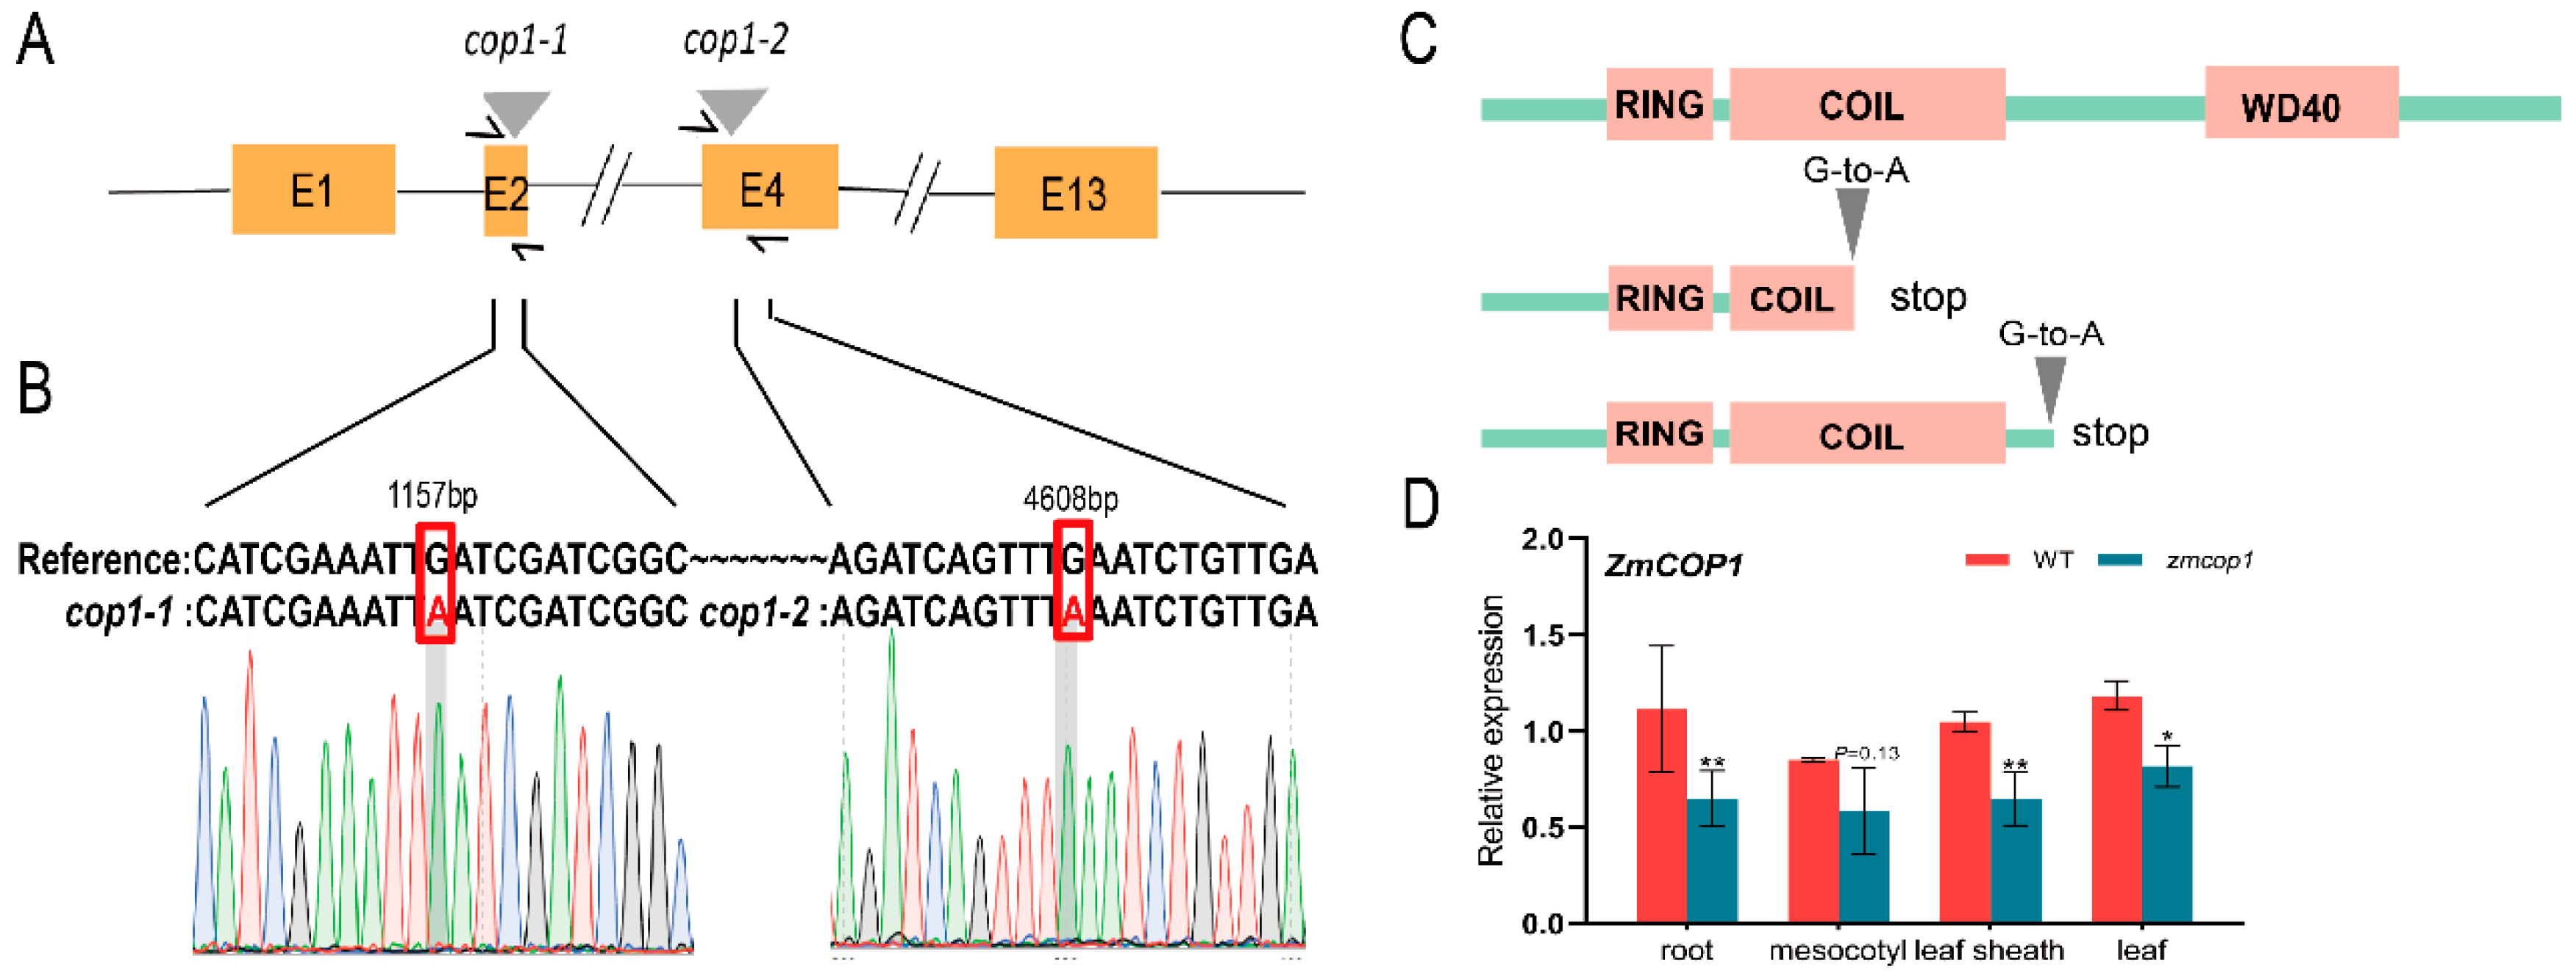
3.1. zmcop1-1 and zmcop1-2 Are Two Loss-of-Function Mutants

First, to understand the conservation of COP1 in different species, we downloaded and analyzed COP1 sequences. We found that ZmCOP1 is highly similar to AtCOP1 at the DNA sequence level (Figure S1). We then ordered two loss-of-function zmcop1 mutants from the EMS mutant library (www.elabcaas.cn/memd/ (accessed on 14 September 2021)), naming them zmcop1-1 and zmcop1-2, respectively. The two mutants were generated from B73 and self-fertilized for four generations. Through a Sanger sequencing analysis, we confirmed that both zmcop1-1 and zmcop1-2 were zmcop1 stop-gain mutants that changed from TGA to TAA at the 1157th nucleotide and the 4608th nucleotide (Figure 1A,B), respectively. The mutation in zmcop1-1 was located in the COIL helix domain; the base change led to the losses of the COIL and WD40 domains. The mutation in zmcop1-2 was located between the COIL domain and the WD40 domain (Figure 1C), affecting the latter. It has been reported that WD40 is important in seedling and flower development as well as in light signal transmission and perception [38]. Thus, we propose that zmcop1-1 and zmcop1-2 may affect plant growth and development.
To understand the expression pattern of ZmCOP1 in maize seedlings, we carried out an RT-qPCR analysis. We found that in 5-day-old etiolated seedlings in B73 and zmcop1-1, ZmCOP1 was expressed in almost all tissues, indicating its role. The expression of ZmCOP1 decreased significantly in zmcop1-1 compared to in B73 by 42%, 40%, 38% and 31% in the root, mesocotyl, leaf sheath and leaf, respectively (Figure 1D).

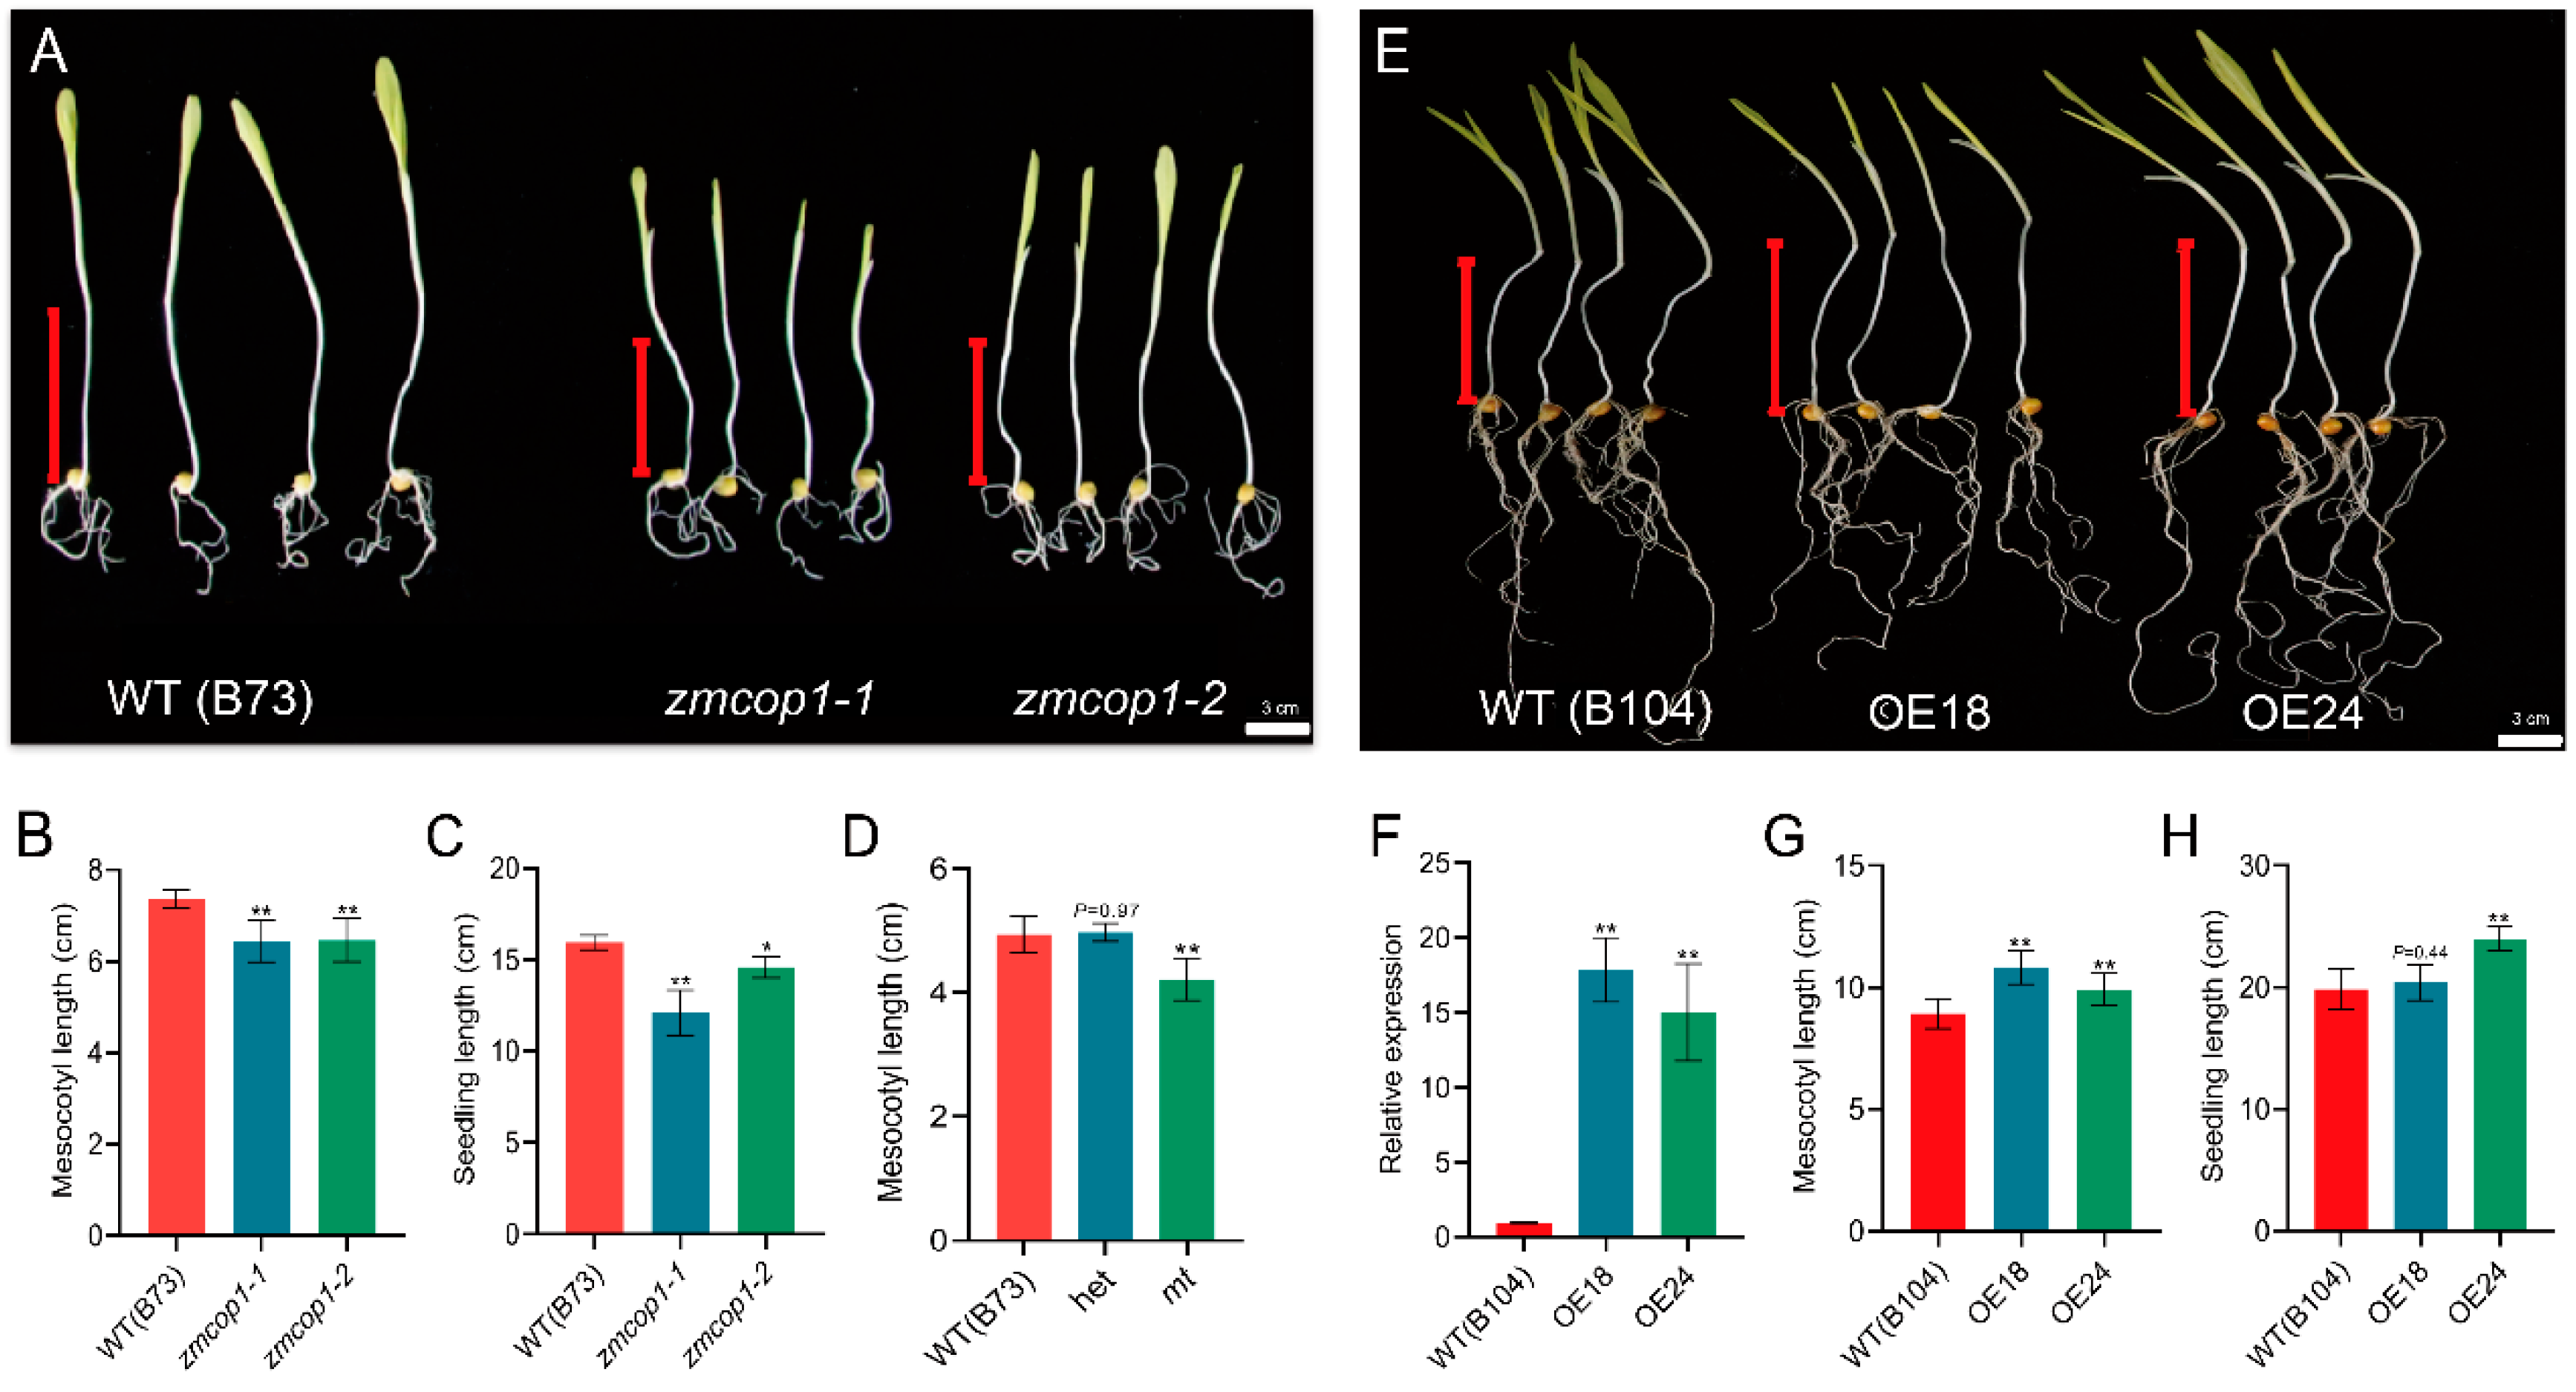
3.2. zmcop1-1 and zmcop1-2 Shortened Mesocotyl Elongation

In order to study the function of ZmCOP1 in mesocotyl elongation, we phenotypically analyzed the mesocotyl lengths of zmcop1-1 and zmcop1-2, using B73 as a control (Figure 2A). When grown in the dark, B73 had a mesocotyl length of about 7.4 cm, while zmcop1-1 and zmcop1-2 each had a mesocotyl length of about 6.5 cm (Figure 2B). The mesocotyl length of zmcop1-1 and zmcop1-2 was significantly shorter than that of B73, with about a 12% reduction. The seedling length was 16.0 cm in the wild type, 12.1 cm in zmcop1-1 and 14.6 cm in zmcop1-2. zmcop1-1 and zmcop1-2 showed significantly lower seedling lengths than the wild type (Figure 2C).
To understand whether the phenotype was caused by the zmcop1 mutation, we performed a chi-square test using zmcop1-1. We found that in 121 seedlings, 100 showed the wild-type phenotype while 21 showed the short mesocotyl phenotype, which is inconsistent with the 3:1 segregation ratio (χ2 = 3.160, df = 1). These data indicate that the short mesocotyl phenotype is caused by one gene.
We then genotyped the zmcop1-1 seedlings and found that the length was 4.9 cm for the wild-type genotype, 5.0 cm for the heterozygous genotype and 4.2 cm for the mutated homozygous genotype. A statistical analysis showed that there were no differences between the wild-type and the heterozygous genotype (Figure 2D), indicating that the mutation genotype is recessive. This result is consistent with the phenotype of cop1 in Arabidopsis thaliana grown in the dark, which has a short hypocotyl length and plant height [9].

3.3. ZmCOP1 Overexpression Lines Showed Longer Mesocotyl Lengths

To understand whether overexpression of ZmCOP1 promotes the length of etiolated seedling mesocotyls, we generated and planted transgenic lines while using B104 as a genetic background (Figure 2E). We gained more than 20 ZmCOP1 OE lines and verified with RT-qPCR that the ZmCOP1 in line 18 and line 24 was overexpressed more than tenfold compared with that in wild-type B104 (Figure 2F). We found that in darkness, the length of the etiolated seedling mesocotyl was about 10.8 cm in OE18, about 9.9 cm in OE24 and about 8.9 cm in wild-type B104 (Figure 2G). Thus, the mesocotyl lengths of the OEs were significantly longer than that of the wild type. We further measured the whole seedling length using these materials and found that the seedling length was 20.4 cm in OE18, 24.0 cm in OE24 and 19.8 cm in wild-type B104 (Figure 2H). The results showed that the high expression of ZmCOP1 promoted the seedling hypocotyl length.

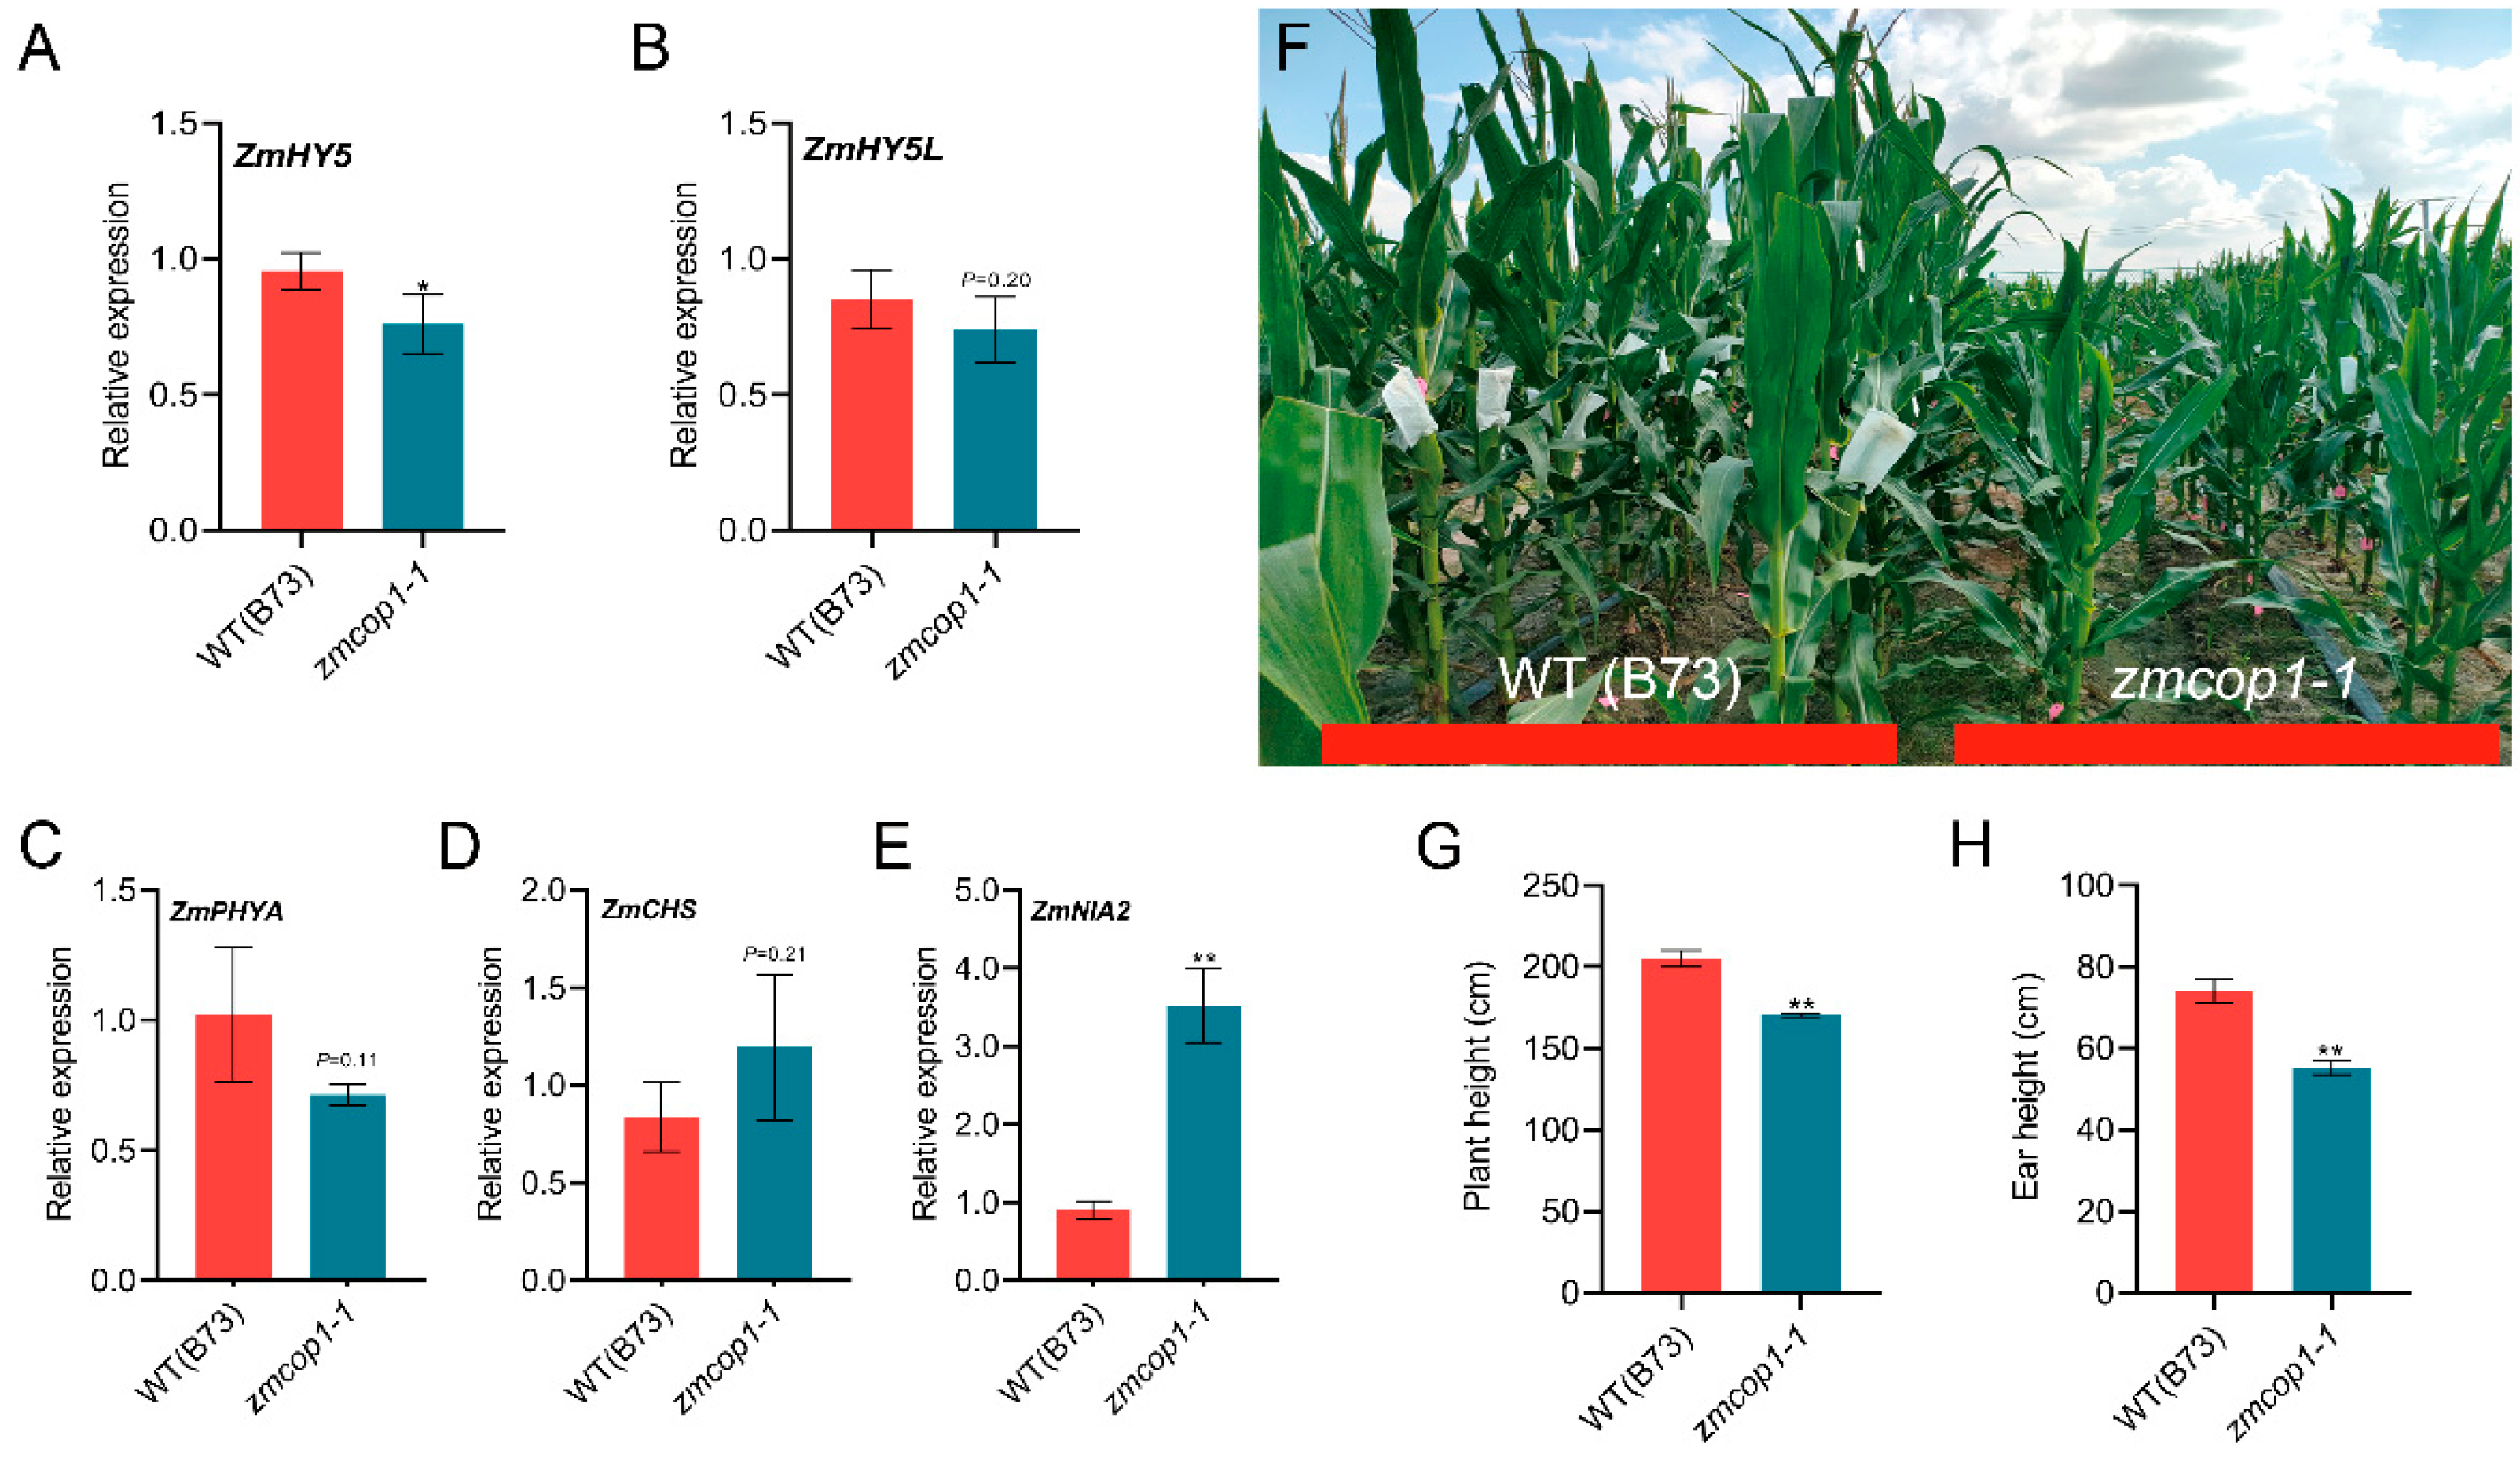
3.4. The Expressions of ZmHY5 and Other Light Genes Are Regulated by ZmCOP1

HY5 and HY5L have been reported to interact with COP1 to inhibit the morphogenesis of the hypocotyl elongation of Arabidopsis seedlings [9,22]. To understand whether ZmHY5 is regulated by ZmCOP1, we detected the expressions of ZmHY5 and ZmHY5L in the 5-day-old etiolated seedlings. We found that the ZmHY5 and ZmHY5L in zmcop1-1 decreased by 20% and 13%, respectively (Figure 3A,B), indicating that the ZmCOP1 led to expression changes for ZmHY5 and ZmHY5L in the etiolated maize seedlings. However, contrasting the fact that AtHY5 is degraded by AtCOP1 [39], it seems that ZmHY5 is stabilized by ZmCOP1. This needs to be studied further.
In order to understand whether ZmCOP1 is involved in the absorption and utilization of light in maize, we identified the the expressions of several key light-regulating genes, such as ZmPHYA, ZmCHS and ZmNIA2 [15]. We found that the expression of ZmPHYA in zmcop1 was slightly but not statistically significantly lower than that in the WT (Figure 3C). The expressions of ZmCHS and ZmNIA2 in zmcop1 were higher than those in the WT, increased by 30% and 74%, respectively (Figure 3D,E). The phenomenon of ZmCOP1 affecting the expression of photoregulatory factors indicated that the function of ZmCOP1 is conserved for AtCOP1.

3.5. ZmCOP1 Affects Plant Height

In order to explore whether ZmCOP1 affects plant development in the light, we carried out plant height phenotyping between WT B73 and zmcop1 at the silking stage (Figure 3F). We found that the plant height was 204.8 cm in wild-type B73 and 170.4 cm in zmcop1-1. The plant height was lower by 17% in zmcop1-1 than in the WT (Figure 3G). The ear height in the zmcop1-1 mutant was also lower than that in the WT, reduced by 27% (Figure 3H). However, there was no significant difference in either the plant height or the ear height between the zmcop1-2 mutant and wild-type B73; this needs to be studied further.
Chlorophyll is one of the most important photosynthetic pigments in plants, and its content directly affects the intensity of plant photosynthesis [40]. In order to clarify the effect of ZmCOP1 on light absorption during maize’s growth period, we determined the relative content of chlorophyll in its leaves. We found that there was little difference in the SPAD values of wild-type B73, zmcop1-1 and zmcop1-2 in the first and ear leaves (Figure S2).

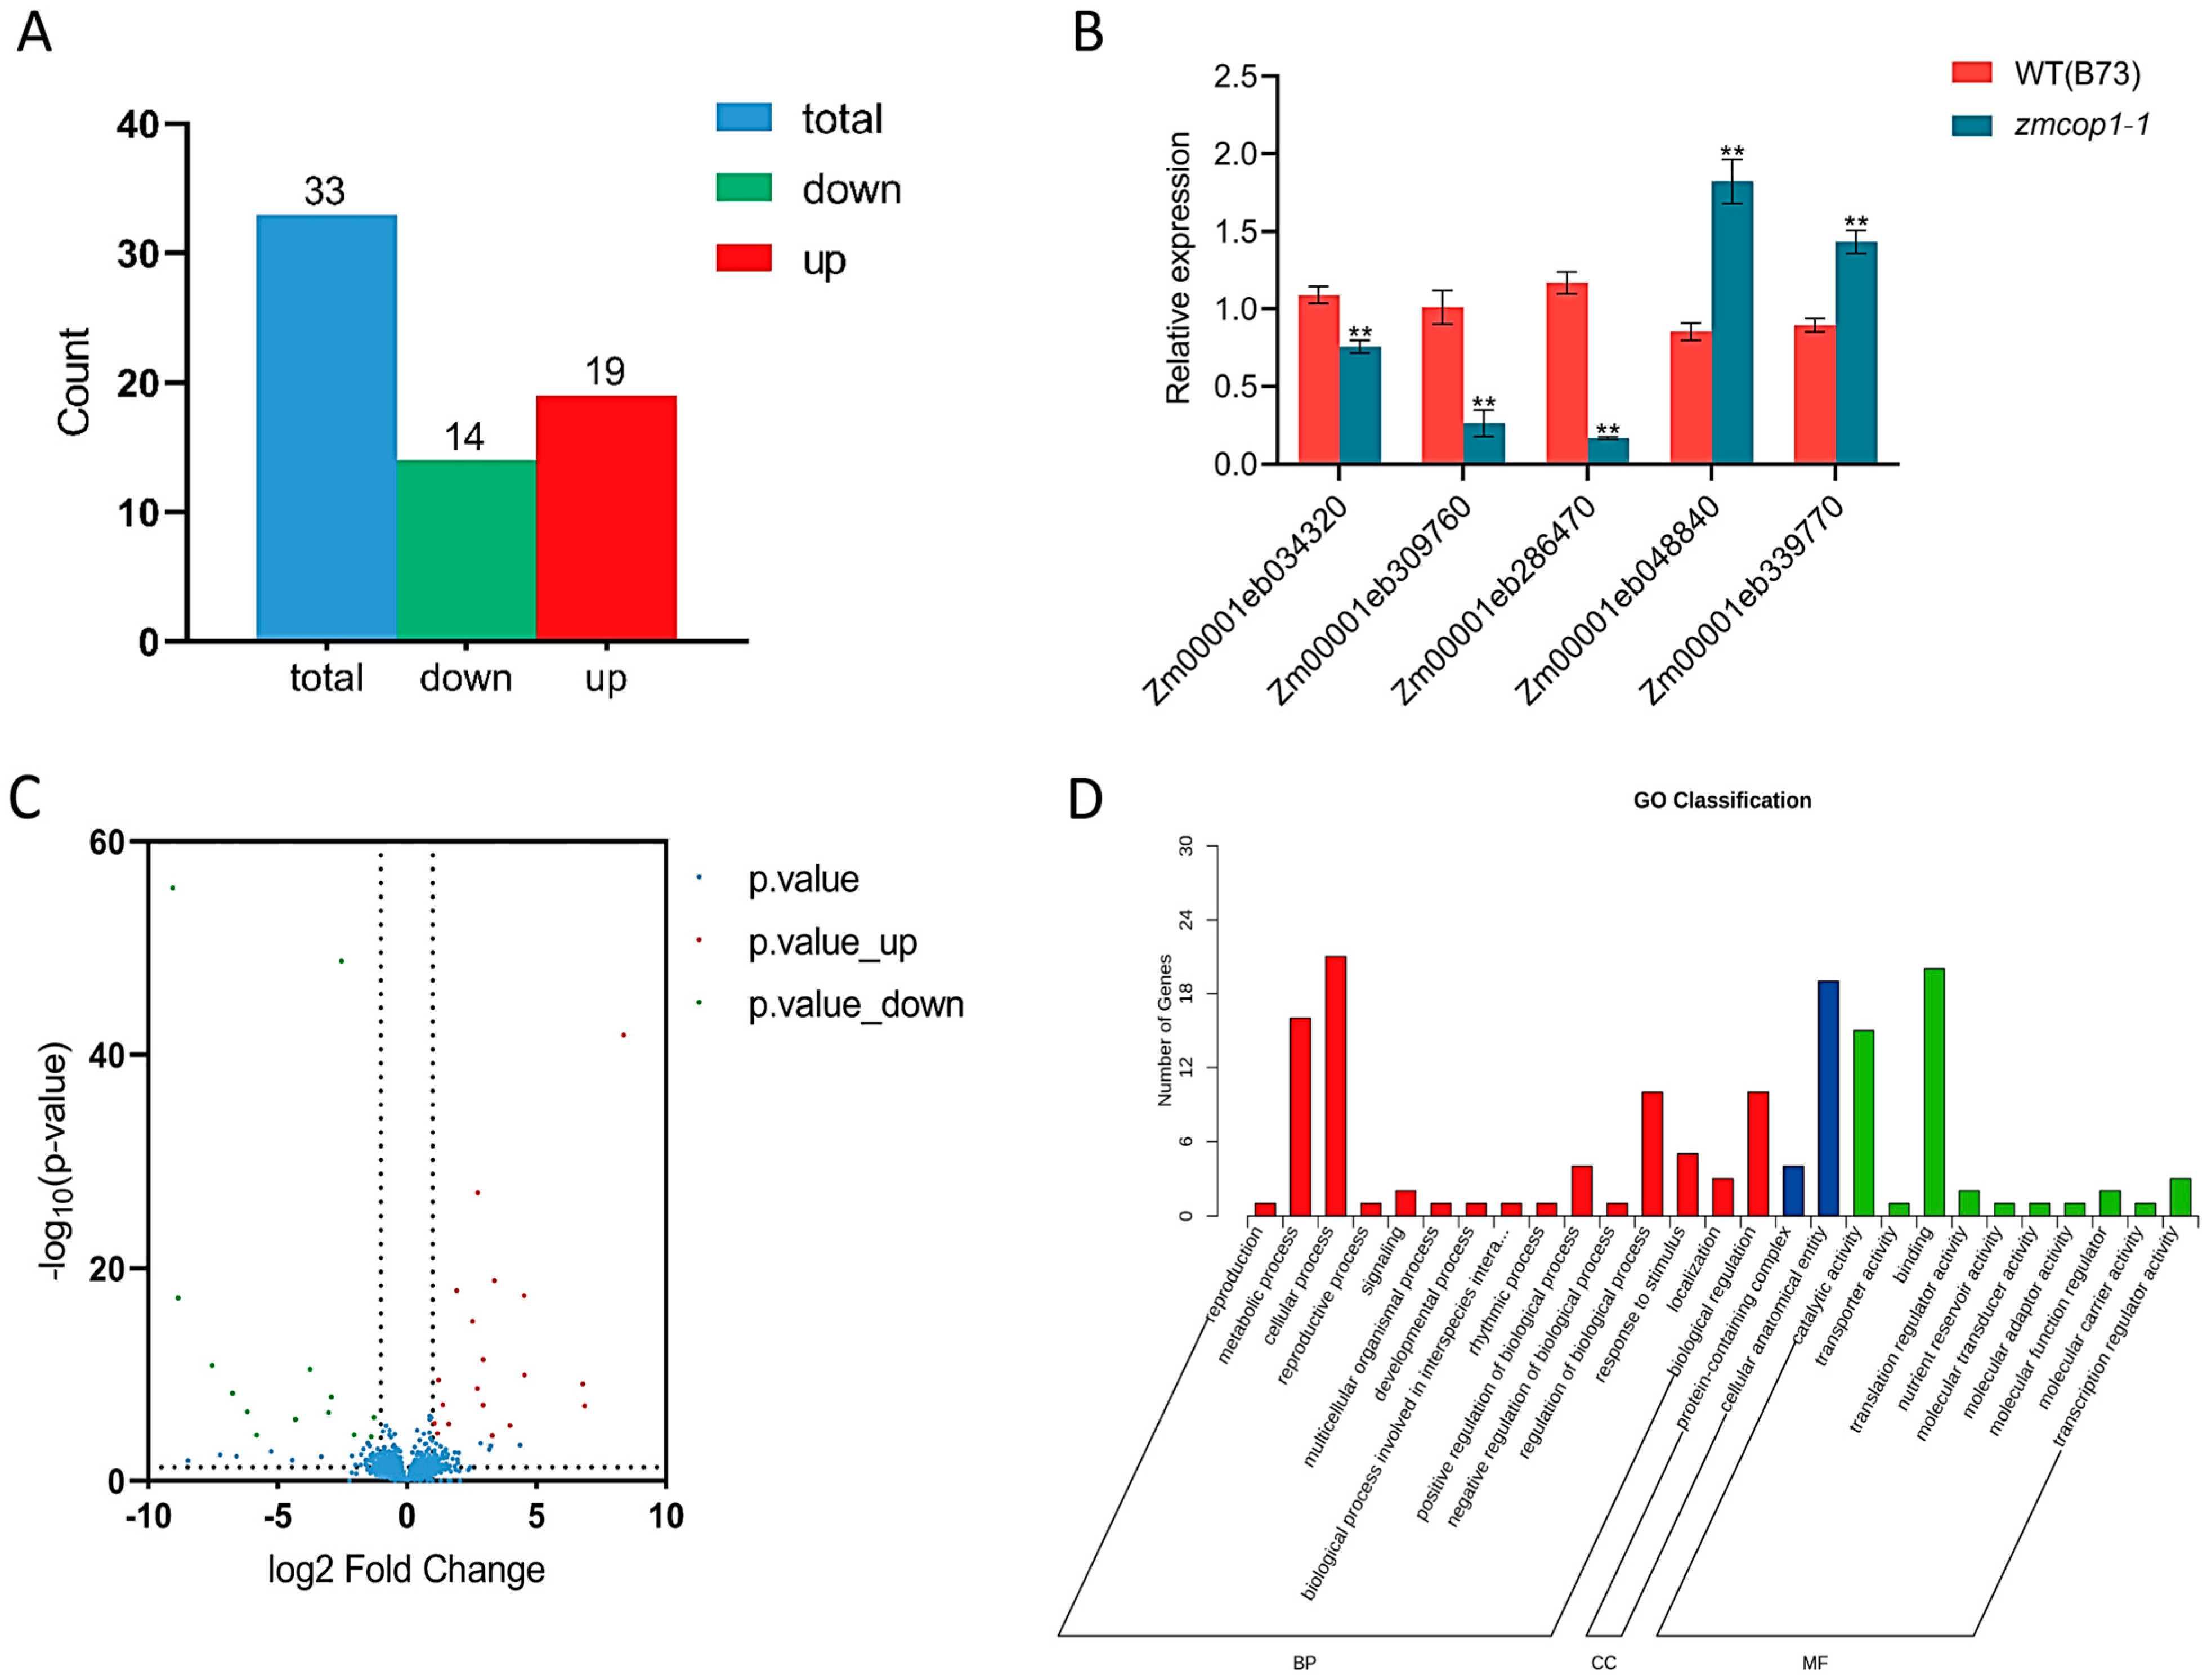
3.6. GO Analysis Showed That the DEGs Are Related to Hormone Signal Transduction

To further explore the functional mechanism of ZmCOP1, we performed a RNA sequencing analysis using zmcop1-1 and wild-type B73. We found 33 DEGs, of which 19 were up-regulated and 14 were down-regulated (Figure 4A). To verify the expression patterns of the DEGs, we performed RT-qPCR. We confirmed that the results thereof were consistent with those of the RNA-seq (Figure 4B). A volcano map was used to show the overall distributions of differential genes in the WT and zmcop1 (Figure 4C). Based on the expression patterns between the WT and zmcop1, we clustered the differentially expressed genes into groups (Figure S3). The genes that showed consistent expression patterns in all of the zmcop1 replicates were speculated to have similar functions.
To understand the biological information of the DEGs, a GO (gene ontology) analysis was performed. According to the threshold of p ≤ 0.05, the DEGs were divided into three main functional categories: BP (biological process), CC (cellular component) and MF (molecular function) (Figure 4D). The regulations of biological (10 DEGs), metabolic (16 DEGs) and cellular processes (21 DEGs) were enriched in the BP category. The cellular anatomical entity (19 DEGs) was enriched in the CC category. The catalytic activity (15 DEGs) and binding (20 DEGs) were enriched in the MF category. The GO analysis showed that the DEGs are related to plant hormone signal transduction and metabolite biosynthesis.

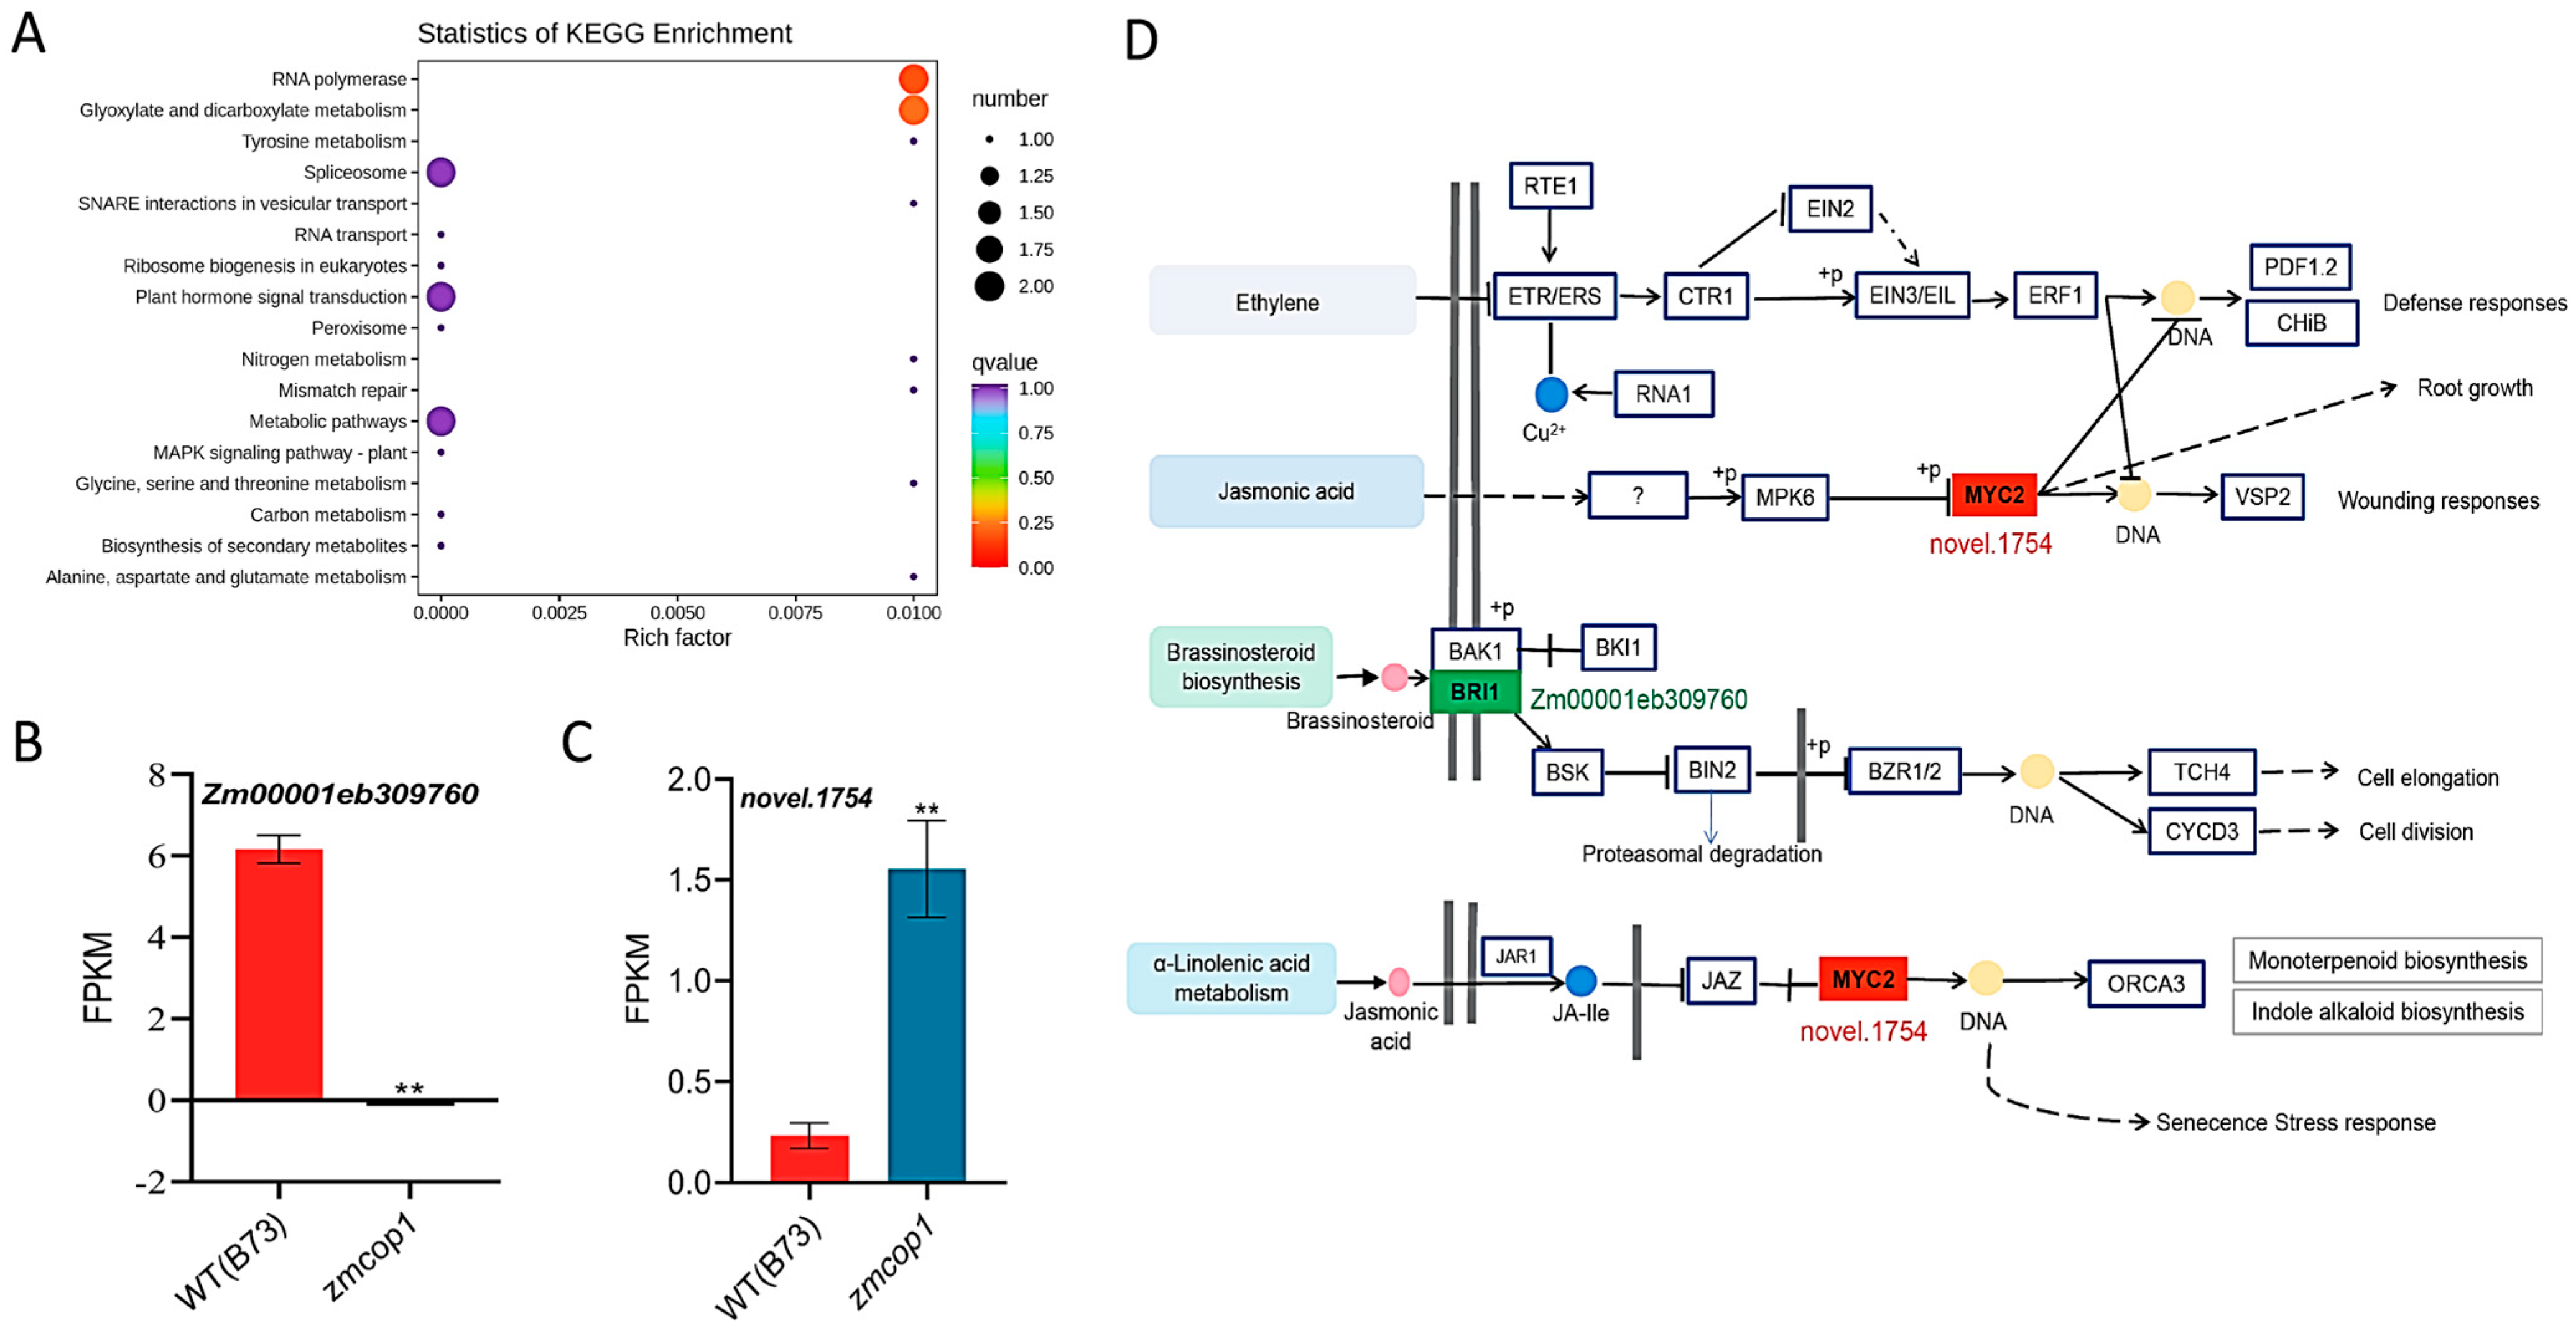
3.7. KEGG Showed That DEGs Are Related to Hormone Signal Transduction

To understand which biological processes DEGs participate in, KEGG (Kyoto Encyclopedia of Genes and Genomes) enrichment analyses were conducted (Figure 5A) [35]. We found that ZmCOP1 regulates a wide range of KEGG pathways, such as those for MAPK hormone signal transduction, ribosome formation, RNA transport, glyoxylic acid and dicarboxylic acid metabolism and biosynthesis of secondary metabolites. These pathways are closely related to plant hormone production, genetic material changes and metabolite biosynthesis.
It has been reported that ZmCOP1 regulates plant cell elongation and division by regulating the BR signal transduction pathway [41]. In Arabidopsis thaliana, both JA and BR play an important role in regulating cell and hypocotyl elongation [41,42,43]. We found that Zm00001eb309760 was rarely expressed in zmcop1 (Figure 5B). Zm00001eb309760 is annotated to encode a leucine-rich repeat receptor-like protein kinase family protein. Zm00001eb309760 may participate in the biosynthesis of BR. In addition, we found that a new gene, named novel.1754, was increased in the zmcop1 mutant (Figure 5C). The KEGG analysis showed that novel.1754 participates in the biosynthesis of jasmonic acid by regulating MYC2 and also regulates the α-linolenic acid metabolic pathway (Figure 5D). In summary, based on our KEGG results, we propose that ZmCOP1 participates in the ETH, BR and JA plant hormone pathways.

4. Discussion

A previous study showed that ZmCOP1 could restore the phenotype of an atcop1-4 mutant in Arabidopsis thaliana, including the gene expressions for hypocotyl length, cotyledon openings, chlorophyll levels and light response [9]. In our study, the mesocotyl of the zmcop1 mutants was significantly shorter than that of the WT in maize seedlings grown in the dark for 7 days (Figure 2B). By measuring the height of the seedlings, we found that the seedling height of the zmcop1 mutants was also shorter (Figure 2C). However, unlike with the atcop1 phenotype in Arabidopsis thaliana, we did not observe significant changes in the cotyledons at the maize seedling stage. We speculate that the function of COP1 in Arabidopsis thaliana and maize is conservative, but there are also some differences.
COP1-HY5 forms the core complex that controls plant photomorphogenesis [22,44]. COP1 and HY5 play antagonistic roles in response to light signals and in the regulation of seedling morphogenesis. HY5 is a key transcription factor involved in the inhibition of hypocotyl elongation. We found that the contents of ZmHY5 and ZmHY5L were both decreased in the zmcop1 mutants (Figure 3A,B). It has been reported that AtHY5 is degraded by AtCOP1 [39], and our results showed that ZmHY5 is stabilized by ZmCOP1 at the RNA level. Whether ZmHY5 is degraded by ZmCOP1 at the protein level needs to be studied further.
Low expression of AtCOP1 has been found to lead to differential expression of normal light-regulated genes in dark-treated materials. atcop1 mutation inhibits photomorphogenesis and the elongation of hypocotyl [45,46]. In our research, through RT-qPCR, we confirmed that the expression of the light-regulated gene ZmPHYA in the zmcop1 mutant seedlings treated in darkness for 7 days was slightly lower than that in the WT (Figure 3C). We speculate that some light-regulating genes in maize zmcop1 are also affected, and that mutation of zmcop1 affects plant morphogenesis.
It has been reported that nia1 and nia2 blossom and mature earlier than the WT in Arabidopsis thaliana, indicating that AtNIA1 and AtNIA1 are involved in the regulation of plant flowering [47]. We observed that the tasseling and flowering times of the zmcop1 mutants were 3−5 days later than those of B73. Additionally, the expression of ZmNIA2 was increased in the zmcop1 mutants compared to in B73 (Figure 3E). Therefore, we speculated that the late flowering phenotype was caused by the high expression of ZmNIA2 in the zmcop1 mutants.
Studies have shown that under low light intensity, HY5 in Arabidopsis is down-regulated by COP1-mediated ubiquitination and degradation. BIN2 is partially inactivated with repression of the transcriptional activity of HY5. In contrast, BZR1 is accumulated (Li et al., 2020). As a result, the hypocotyl length is promoted by the enhanced transcriptional activity of the related genes. With an increase in light intensity, the elongation of Arabidopsis hypocotyls would be inhibited. Our RNA-seq results showed down-regulation of BRI1 in zmcop1 mutants (Figure 5B). Considering the function of AtCOP1, we propose that zmcop1 mutation first affects the downstream BR synthesis pathway, inhibiting cell elongation and division, and affects plant height afterward (Figure 5D).

5. Conclusions

We experimentally demonstrated the roles of ZmCOP1 in maize morphogenesis. We found that ZmCOP1 affects the elongation of maize mesocotyl in darkness and affects plant height in the light. We confirmed that ZmCOP1 regulates the expressions of several key light factors in the same way as AtCOP1. Finally, we identified some DEGs and showed that ZmCOP1 may control maize morphogenesis by regulating genes involved in the plant phytohormone pathway. Our data can be applied in maize performance improvement.

Supplementary Materials

The following supporting information can be downloaded at: https://www.mdpi.com/article/10.3390/life13071522/s1, Figure S1: Phylogenetic analysis of ZmCOP1. (A) Homology analysis of COP1 proteins in maize, sorghum, rice, grape, Arabidopsis, soybean and poplar. (B) Phylogenetic tree analysis showed that ZmCOP1 and AtCOP1 proteins are highly similar; Figure S2: Measurement of relative content of chlorophyll. (A) The leaf site of relative content of chlorophyll. (B) SPAD of the ear leaves. (C) SPAD of the first leaves. Data are mean ± SD of at least 20 plants.; Figure S3: RNA-seq results showed that zmcop1 mutation led to changes in the expression of some genes. (A) Differential gene clustering heat map. Abscissa denotes sample name and hierarchical clustering result, ordinate indicates differential gene and hierarchical clustering result. Red indicates high expression and green indicates low expression. (B) Kmeans cluster diagram. The Abscissa represents the sample, and the ordinate represents the standardized expression.; Table S1: The primers used in this experiment.

Author Contributions

L.C. designed the experiments, performed the experiments and data analysis, wrote the original draft and wrote and revised the manuscript. Q.L. performed the experiments and data analysis. M.W. performed the experiments and data analysis and revised the manuscript. F.X. performed the experiments. K.L. performed the experiments. R.Y. performed the experiments. M.S. performed the experiments. H.Z. provided theoretical guidance. J.G. designed the experiments and performed the data analysis. J.C. designed the experiments, performed the data analysis and revised the manuscript. F.J. designed the experiment, performed the data analysis and wrote and revised the manuscript. All authors have read and agreed to the published version of the manuscript.

Funding

This work was supported by the Taishan Scholars Program of Shandong Province (tsqn201909134), the Maize Industry Technology System Genetic and Breeding Positions in Shandong (SDAIT-02–01), the Shandong Provincial Natural Science Foundation (ZR2021QC179 and ZR2022MC193), the National Key Research and Development Program of China (2021YFD1900903), Well-Breed Engineering of Shandong province (2021LZGC022), the science and technology commissioner of Tai’an (2021TPY007) and the Talent Introduction Special Funds of Qingdao Agricultural University (665/1119016 and 665/1120014).

Institutional Review Board Statement

Not applicable.

Informed Consent Statement

Not applicable.

Data Availability Statement

Data will be made available on request.

Acknowledgments

We thank the members of the Laboratory of Maize Molecular Genetics and Breeding for their assistance in this study. The mutant materials used in this study were provided by Chunyi Zhang from the Institute of Biotechnology, Chinese Academy of Agricultural Sciences and Xiaoduo Lu from Qilu Normal University.

Conflicts of Interest

The authors declare that they have no known competing financial interest or personal relationship that could have appeared to influence the work reported in this paper.

References

  1. Liu, X.; Qin, T.; Ma, Q.; Sun, J.; Liu, Z.; Yuan, M. Light-regulated hypocotyl elongation involves proteasome-dependent degradation of the microtubule regulatory protein WDL3 in Arabidopsis. Plant Cell 2013, 255, 1740–1755. [Google Scholar] [CrossRef] [PubMed] [Green Version]
  2. Brandizzi, F. Divide, expand, differentiate—New insights on plant organ growth through cytokinin signaling. Plant J. 2019, 97, 803–804. [Google Scholar] [CrossRef] [PubMed]
  3. Nakano, T. Hypocotyl Elongation: A Molecular Mechanism for the First Event in Plant Growth That Influences Its Physiology. Plant Cell Physiol. 2019, 60, 933–934. [Google Scholar] [CrossRef] [PubMed]
  4. Li, J.; Terzaghi, W.; Gong, Y.; Li, C.; Ling, J.J.; Fan, Y. Modulation of BIN2 kinase activity by HY5 controls hypocotyl elongation in the light. Nat. Commun. 2020, 111, 1592. [Google Scholar] [CrossRef] [Green Version]
  5. Liu, H.; Lin, R.; Deng, X.W. Photobiology: Light signal transduction and photomorphogenesis. J. Integr. Plant Biol. 2020, 62, 1267–1269. [Google Scholar] [CrossRef]
  6. Legris, M.; Ince, Y.C.; Fankhauser, C. Molecular mechanisms underlying phytochrome-controlled morphogenesis in plants. Nat. Commun. 2019, 10, 5219. [Google Scholar] [CrossRef] [Green Version]
  7. Jing, Y.; Lin, R. Transcriptional regulatory network of the light signaling pathways. New Phytol. 2020, 227, 683–697. [Google Scholar] [CrossRef] [Green Version]
  8. Roeber, V.M.; Bajaj, I.; Rohde, M.; Schmülling, T.; Cortleven, A. Light acts as a stressor and influences abiotic and biotic stress responses in plants. Plant Cell Environ. 2021, 44, 645–664. [Google Scholar] [CrossRef]
  9. Huai, J.; Jing, Y.; Lin, R. Functional analysis of ZmCOP1 and ZmHY5 reveals conserved light signaling mechanism in maize and Arabidopsis. Physiol. Plant. 2020, 169, 369–379. [Google Scholar] [CrossRef]
  10. Hoecker, U.; Quail, P.H. The Phytochrome A-specific Signaling Intermediate SPA1 Interacts Directly with COP1, a Constitutive Repressor of Light Signaling in Arabidopsis. J. Biol. Chem. 2001, 276, 38173–38178. [Google Scholar] [CrossRef]
  11. Jang, I.-C.; Henriques, R.; Seo, H.S.; Nagatani, A.; Chua, N.-H. Arabidopsis Phytochrome Interacting Factor Proteins Promote Phytochrome B Polyubiquitination by COP1 E3 Ligase in the Nucleus. Plant Cell 2010, 22, 2370–2383. [Google Scholar] [CrossRef] [Green Version]
  12. Xu, D.; Lin, F.; Jiang, Y.; Huang, X.; Li, J.; Ling, J. The RING-Finger E3 Ubiquitin Ligase COP1 SUPPRESSOR1 Negatively Regulates COP1 Abundance in Maintaining COP1 Homeostasis in Dark-Grown Arabidopsis Seedlings. Plant Cell 2014, 265, 1981–1991. [Google Scholar] [CrossRef] [Green Version]
  13. Pham, V.N.; Kathare, P.K.; Huq, E. Phytochromes and Phytochrome Interacting Factors. Plant Physiol. 2018, 176, 1025–1038. [Google Scholar] [CrossRef] [PubMed] [Green Version]
  14. Paik, I.; Chen, F.; Pham, V.N.; Zhu, L.; Kim, J.I.; Huq, E. A phyB-PIF1-SPA1 kinase regulatory complex promotes photomorphogenesis in Arabidopsis. Nat Commun. 2019, 101, 4216. [Google Scholar] [CrossRef] [PubMed] [Green Version]
  15. Deng, Y.; Wang, J.; Zhang, Z.; Wu, Y. Transactivation of Sus1 and Sus2 by Opaque2 is an essential supplement to sucrose synthase-mediated endosperm filling in maize. Plant Biotechnol. J. 2020, 18, 1897–1907. [Google Scholar] [CrossRef] [PubMed] [Green Version]
  16. Ohgishi, M.; Saji, K.; Okada, K.; Sakai, T. Functional analysis of each blue light receptor, cry1, cry2, phot1, and phot2, by using combinatorial multiple mutants in Arabidopsis. Proc. Natl. Acad. Sci. USA 2004, 101, 2223–2228. [Google Scholar] [CrossRef]
  17. Yu, X.; Liu, H.; Klejnot, J.; Lin, C. The Cryptochrome Blue Light Receptors. Arab. Book 2010, 8, e0135. [Google Scholar] [CrossRef] [Green Version]
  18. Ponnu, J.; Riedel, T.; Penner, E.; Schrader, A.; Hoecker, U. Cryptochrome 2 competes with COP1 substrates to repress COP1 ubiquitin ligase activity during Arabidopsis photomorphogenesis. Proc. Natl. Acad. Sci. USA 2019, 116, 27133–27141. [Google Scholar] [CrossRef]
  19. Wang, W.; Paik, I.; Kim, J.; Hou, X.; Sung, S.; Huq, E. Direct phosphorylation of HY5 by SPA kinases to regulate photomorphogenesis in Arabidopsis. New Phytol. 2021, 230, 2311–2326. [Google Scholar] [CrossRef]
  20. Carranco, R.; Prieto-Dapena, P.; Almoguera, C.; Jordano, J. A seed-specific transcription factor, HSFA9, anticipates UV-B light responses by mimicking the activation of the UV-B receptor in tobacco. Plant J. 2022, 1115, 1439–1452. [Google Scholar] [CrossRef]
  21. Zhu, L.; Bu, Q.; Xu, X.; Paik, I.; Huang, X.; Hoecker, U.; Deng, X.W.; Huq, E. CUL4 forms an E3 ligase with COP1 and SPA to promote light-induced degradation of PIF1. Nat. Commun. 2015, 6, 7245. [Google Scholar] [CrossRef] [Green Version]
  22. Bhatnagar, A.; Singh, S.; Khurana, J.P.; Burman, N. HY5-COP1: The central module of light signaling pathway. J. Plant Biochem. Biotechnol. 2020, 29, 590–610. [Google Scholar] [CrossRef]
  23. Lian, N.; Liu, X.; Wang, X.; Zhou, Y.; Li, H.; Li, J. COP1 mediates dark-specific degradation of microtubule-associated protein WDL3 in regulating Arabidopsis hypocotyl elongation. Proc. Natl. Acad. Sci. USA 2017, 11446, 12321–12326. [Google Scholar] [CrossRef] [Green Version]
  24. Zheng, Y.; Cui, X.; Su, L.; Fang, S.; Chu, J.; Gong, Q. Jasmonate inhibits COP1 activity to suppress hypocotyl elongation and promote cotyledon opening in etiolated Arabidopsis seedlings. Plant J. 2017, 906, 1144–1155. [Google Scholar] [CrossRef] [Green Version]
  25. Cao, J.; Liang, Y.; Yan, T.; Wang, X.; Zhou, H.; Chen, C. The photomorphogenic repressors BBX28 and BBX29 integrate light and brassinosteroid signaling to inhibit seedling development in Arabidopsis. Plant Cell 2022, 346, 2266–2285. [Google Scholar] [CrossRef]
  26. Chen, Y.-F.; Etheridge, N.; Schaller, G.E. Ethylene Signal Transduction. Ann. Bot. 2005, 95, 901–915. [Google Scholar] [CrossRef]
  27. Shi, H.; Liu, R.; Xue, C.; Shen, X.; Wei, N.; Deng, X.W. Seedlings Transduce the Depth and Mechanical Pressure of Covering Soil Using COP1 and Ethylene to Regulate EBF1/EBF2 for Soil Emergence. Curr Biol. 2016, 262, 139–149. [Google Scholar] [CrossRef] [Green Version]
  28. Kim, D.; Langmead, B.; Salzberg, S.L. HISAT: A fast spliced aligner with low memory requirements. Nat. Methods 2015, 12, 357–360. [Google Scholar] [CrossRef] [Green Version]
  29. Pertea, M.; Pertea, G.M.; Antonescu, C.M.; Chang, T.-C.; Mendell, J.T.; Salzberg, S.L. StringTie enables improved reconstruction of a transcriptome from RNA-seq reads. Nat. Biotechnol. 2015, 33, 290–295. [Google Scholar] [CrossRef] [Green Version]
  30. Robinson, M.D.; McCarthy, D.J.; Smyth, G.K. EdgeR: A Bioconductor package for differential expression analysis of digital gene expression data. Bioinformatics 2010, 26, 139–140. [Google Scholar] [CrossRef] [Green Version]
  31. Love, M.I.; Huber, W.; Anders, S. Moderated estimation of fold change and dispersion for RNA-seq data with DESeq2. Genome Biol. 2014, 1512, 550. [Google Scholar] [CrossRef] [Green Version]
  32. Varet, H.; Brillet-Gueguen, L.; Coppee, J.Y.; Dillies, M.A. SARTools: A DESeq2- and EdgeR-Based R Pipeline for Comprehensive Differential Analysis of RNA-Seq Data. PLoS ONE 2016, 116, e0157022. [Google Scholar] [CrossRef] [PubMed] [Green Version]
  33. Ashburner, M.; Ball, C.A.; Blake, J.A.; Botstein, D.; Butler, H.; Cherry, J.M.; Davis, A.P.; Dolinski, K.; Dwight, S.S.; Eppig, J.T.; et al. Gene ontology: Tool for the unification of biology. The Gene Ontology Consortium. Nat. Genet. 2000, 25, 25–29. [Google Scholar] [CrossRef] [Green Version]
  34. Subramanian, A.; Tamayo, P.; Mootha, V.K.; Mukherjee, S.; Ebert, B.L.; Gillette, M.A.; Mesirov, J.P. Gene set enrichment analysis: A knowledge-based approach for interpreting genome-wide expression profiles. Proc. Natl. Acad. Sci. USA 2005, 102, 15545–15550. [Google Scholar] [CrossRef] [PubMed]
  35. Kanehisa, M.; Araki, M.; Goto, S.; Hattori, M.; Hirakawa, M.; Itoh, M.; Katayama, T.; Kawashima, S.; Okuda, S.; Tokimatsu, T.; et al. KEGG for linking genomes to life and the environment. Nucleic Acids Res. 2008, 36, D480–D484. [Google Scholar] [CrossRef]
  36. Deng, X.W.; Caspar, T.; Quail, P.H. copl: A regulatory locus involved in light-controlled development and gene expression in Arabidopsis. Genes Dev. 1991, 5, 1172–1182. [Google Scholar] [CrossRef] [PubMed] [Green Version]
  37. Wang, F.; Yu, Z.; Zhang, M.; Wang, M.; Lu, X.; Liu, X. ZmTE1 promotes plant height by regulating intercalary meristem formation and internode cell elongation in maize. Plant Biotechnol. J. 2022, 203, 526–537. [Google Scholar] [CrossRef] [PubMed]
  38. Mishra, A.K.; Puranik, S.; Prasad, M. Structure and regulatory networks of WD40 protein in plants. J. Plant Biochem. Biotechnol. 2012, 21, 32–39. [Google Scholar] [CrossRef]
  39. Burko, Y.; Seluzicki, A.; Zander, M.; Pedmale, U.V.; Ecker, J.R.; Chory, J. Chimeric Activators and Repressors Define HY5 Activity and Reveal a Light-Regulated Feedback Mechanism. Plant Cell 2020, 324, 967–983. [Google Scholar] [CrossRef] [Green Version]
  40. Zhou, J.; Su, X.; Zheng, S.; Wu, C.; Su, Y.; Jiang, Z.; Li, L.; Chen, S.; He, X. The Arabidopsis NuA4 histone acetyltransferase complex is required for chlorophyll biosynthesis and photosynthesis. J. Integr. Plant Biol. 2022, 64, 901–914. [Google Scholar] [CrossRef]
  41. Nieto, C.; Luengo, L.M.; Prat, S. Regulation of COP1 Function by Brassinosteroid Signaling. Front. Plant Sci. 2020, 11, 1151. [Google Scholar] [CrossRef] [PubMed]
  42. Tian, H.; Lv, B.; Ding, T.; Bai, M.; Ding, Z. Auxin-BR Interaction Regulates Plant Growth and Development. Front. Plant Sci. 2017, 8, 2256. [Google Scholar] [CrossRef] [PubMed] [Green Version]
  43. Yi, R.; Yan, J.; Xie, D. Light promotes jasmonate biosynthesis to regulate photomorphogenesis in Arabidopsis. Sci. China Life Sci. 2020, 63, 943–952. [Google Scholar] [CrossRef] [PubMed] [Green Version]
  44. Yamamoto, Y.Y.; Matsui, M.; Ang, L.H.; Deng, X.W. Role of a COP1 Interactive Protein in Mediating Light Regulated Gene Expression in Arabidopsis. Plant Physiol. 1998, 10, 1083–1094. [Google Scholar]
  45. Lian, H.L.; He, S.B.; Zhang, Y.C.; Zhu, D.M.; Zhang, J.Y.; Jia, K.P. Blue-light-dependent interaction of crypto-chrome 1 with SPA1 defines a dynamic signaling mechanism. Genes Dev. 2011, 2510, 1023–1028. [Google Scholar] [CrossRef] [PubMed] [Green Version]
  46. Sheerin, D.J.; Menon, C.; Oven-Krockhaus, S.z.; Enderle, B.; Zhu, L.; Johnen, P. Light-activated phytochrome A and B interact with members of the SPA family to promote photomorphogenesis in Arabidopsis by reorganizing the COP1/SPA complex. Plant Cell 2015, 271, 189–201. [Google Scholar] [CrossRef] [Green Version]
  47. Seligman, K.; Saviani, E.E.; Oliveira, H.C.; Pinto-Maglio, C.A.F.; Salgado, I. Floral Transition and Nitric Oxide Emission during Flower Development in Arabidopsis thaliana is Affected in Nitrate Reductase-Deficient Plants. Plant Cell Physiol. 2008, 49, 1112–1121. [Google Scholar] [CrossRef]
Figure 1. Genotyping expression patterns of ZmCOP1. (A) Illustration of the mutation sites in zmcop1-1 and zmcop1-2. (B) Genotyping of zmcop1-1 and zmcop1-2. B73 was used as a reference. As shown in the figure, G was mutated to A at the 1157th nucleotide in zmcop1-1 and G was mutated to A at the 4608th nucleotide in zmcop1-2. (C) A model of the affected protein domains in zmcop1-1 and zmcop1-2. (D) Expression patterns of ZmCOP1 in different tissues (root, mesocotyl, leaf and leaf sheath). The maize seedlings were grown in darkness and at room temperature for 5 days. Data are means ± SD of at least three biological replicates; * p < 0.05, ** p < 0.01.
Life 13 01522 g001
Figure 2. Phenotypic analyses of zmcop1 mutants and overexpression transgenic lines. (A) Seedling phenotypes of wild-type B73, zmcop1-1 and zmcop1-2 grown in darkness for 7 days. Bars: 3 cm. (B) Quantification of mesocotyl length. (C) Quantification of seedling length. (D) Mesocotyl length segregation from a zmcop1-1 heterozygous ear. (E) Seedling phenotypes of wild-type B104 and ZmCOP1 overexpression lines (OE18, OE24, respectively) in darkness for 7 days. Bars: 3 cm. (F) Expressions of ZmCOP1 in WT B104 (OE18, OE24), which was grown in darkness for 7 days. (G) Quantification of mesocotyl length. (H) Quantification of seedling length. Data are means ± SD of at least 10 biological replicates. Asterisks indicate significant differences in a two-way ANOVA (* p < 0.05, ** p < 0.01).
Life 13 01522 g002
Figure 3. Gene expressions in and plant architecture of zmcop1-1. (A,B) Expressions of ZmHY5 and ZmHY5L in wild-type B73 and zmcop1 seedlings that were grown in darkness for 5 days. (CE) Differential expressions of several light-regulating genes in wild-type B73 and zmcop1 seedlings grown in darkness for 7 days. (C) Expressions of ZmPHYA in wild-type B73 and the zmcop1-1 mutant. (D) Expressions of ZmCHS in wild-type B73 and the zmcop1-1 mutant. (E) Expressions of ZmNIA2 in wild-type B73 and the zmcop1-1 mutant. (F) Plant architecture of zmcop1-1 at silking time. (G) Quantification of plant height during the silking stage. (H) Quantification of ear height during the silking stage. Asterisks indicate significant differences between WT B73 and zmcop1 using a Student’s t-test and a two-way ANOVA (* p < 0.05, ** p < 0.01).
Life 13 01522 g003
Figure 4. RNA-seq results showed that zmcop1-1 mutation led to expression changes in some genes. (A) Differentially expressed genes between wild-type B73 and the zmcop1-1 mutant. (B) Verification of the DEGs with RT-qPCR. Asterisks indicate significant differences between WT B73 and zmcop1 using a Student’s t-test and a two-way ANOVA (** p < 0.01). (C) DEG volcano map. Red dots represent up-regulated differential genes in zmcop1-1, green dots represent down-regulated differential genes and blue dots represent non-differentially expressed genes. (D) GO bar chart. The abscissa denotes secondary GO entries, and the ordinate indicates the number of differential genes in the GO entries.
Life 13 01522 g004
Figure 5. KEGG analysis of DEGs. (A) KEGG enrichment analysis scatter plot. The ordinate represents the KEGG path. The abscissa represents the rich factor. The larger the rich factor, the greater the degree of enrichment. The larger the point, the larger the number of differential genes enriched in the pathway. The redder the color of the dot, the more significant the enrichment. (B) Expression of Zm00001eb309760 in RNA-seq. Asterisks indicate significant differences between wild-type B73 and the mutant material using a Student’s t-test (** p < 0.01). (C) Expression of novle.1754 in RNA-seq. Asterisks indicate significant differences between wild-type B73 and the mutant material using a Student’s t-test (** p < 0.01). (D) KEGG pathway maps. The substances marked in red boxes represent up-regulated genes, while those marked in green boxes represent down-regulated genes.
Life 13 01522 g005
Disclaimer/Publisher’s Note: The statements, opinions and data contained in all publications are solely those of the individual author(s) and contributor(s) and not of MDPI and/or the editor(s). MDPI and/or the editor(s) disclaim responsibility for any injury to people or property resulting from any ideas, methods, instructions or products referred to in the content.

