
Extended Opioid Exposure Modulates the Molecular Metabolism of Clear Cell Renal Cell Carcinoma
 , and
, and 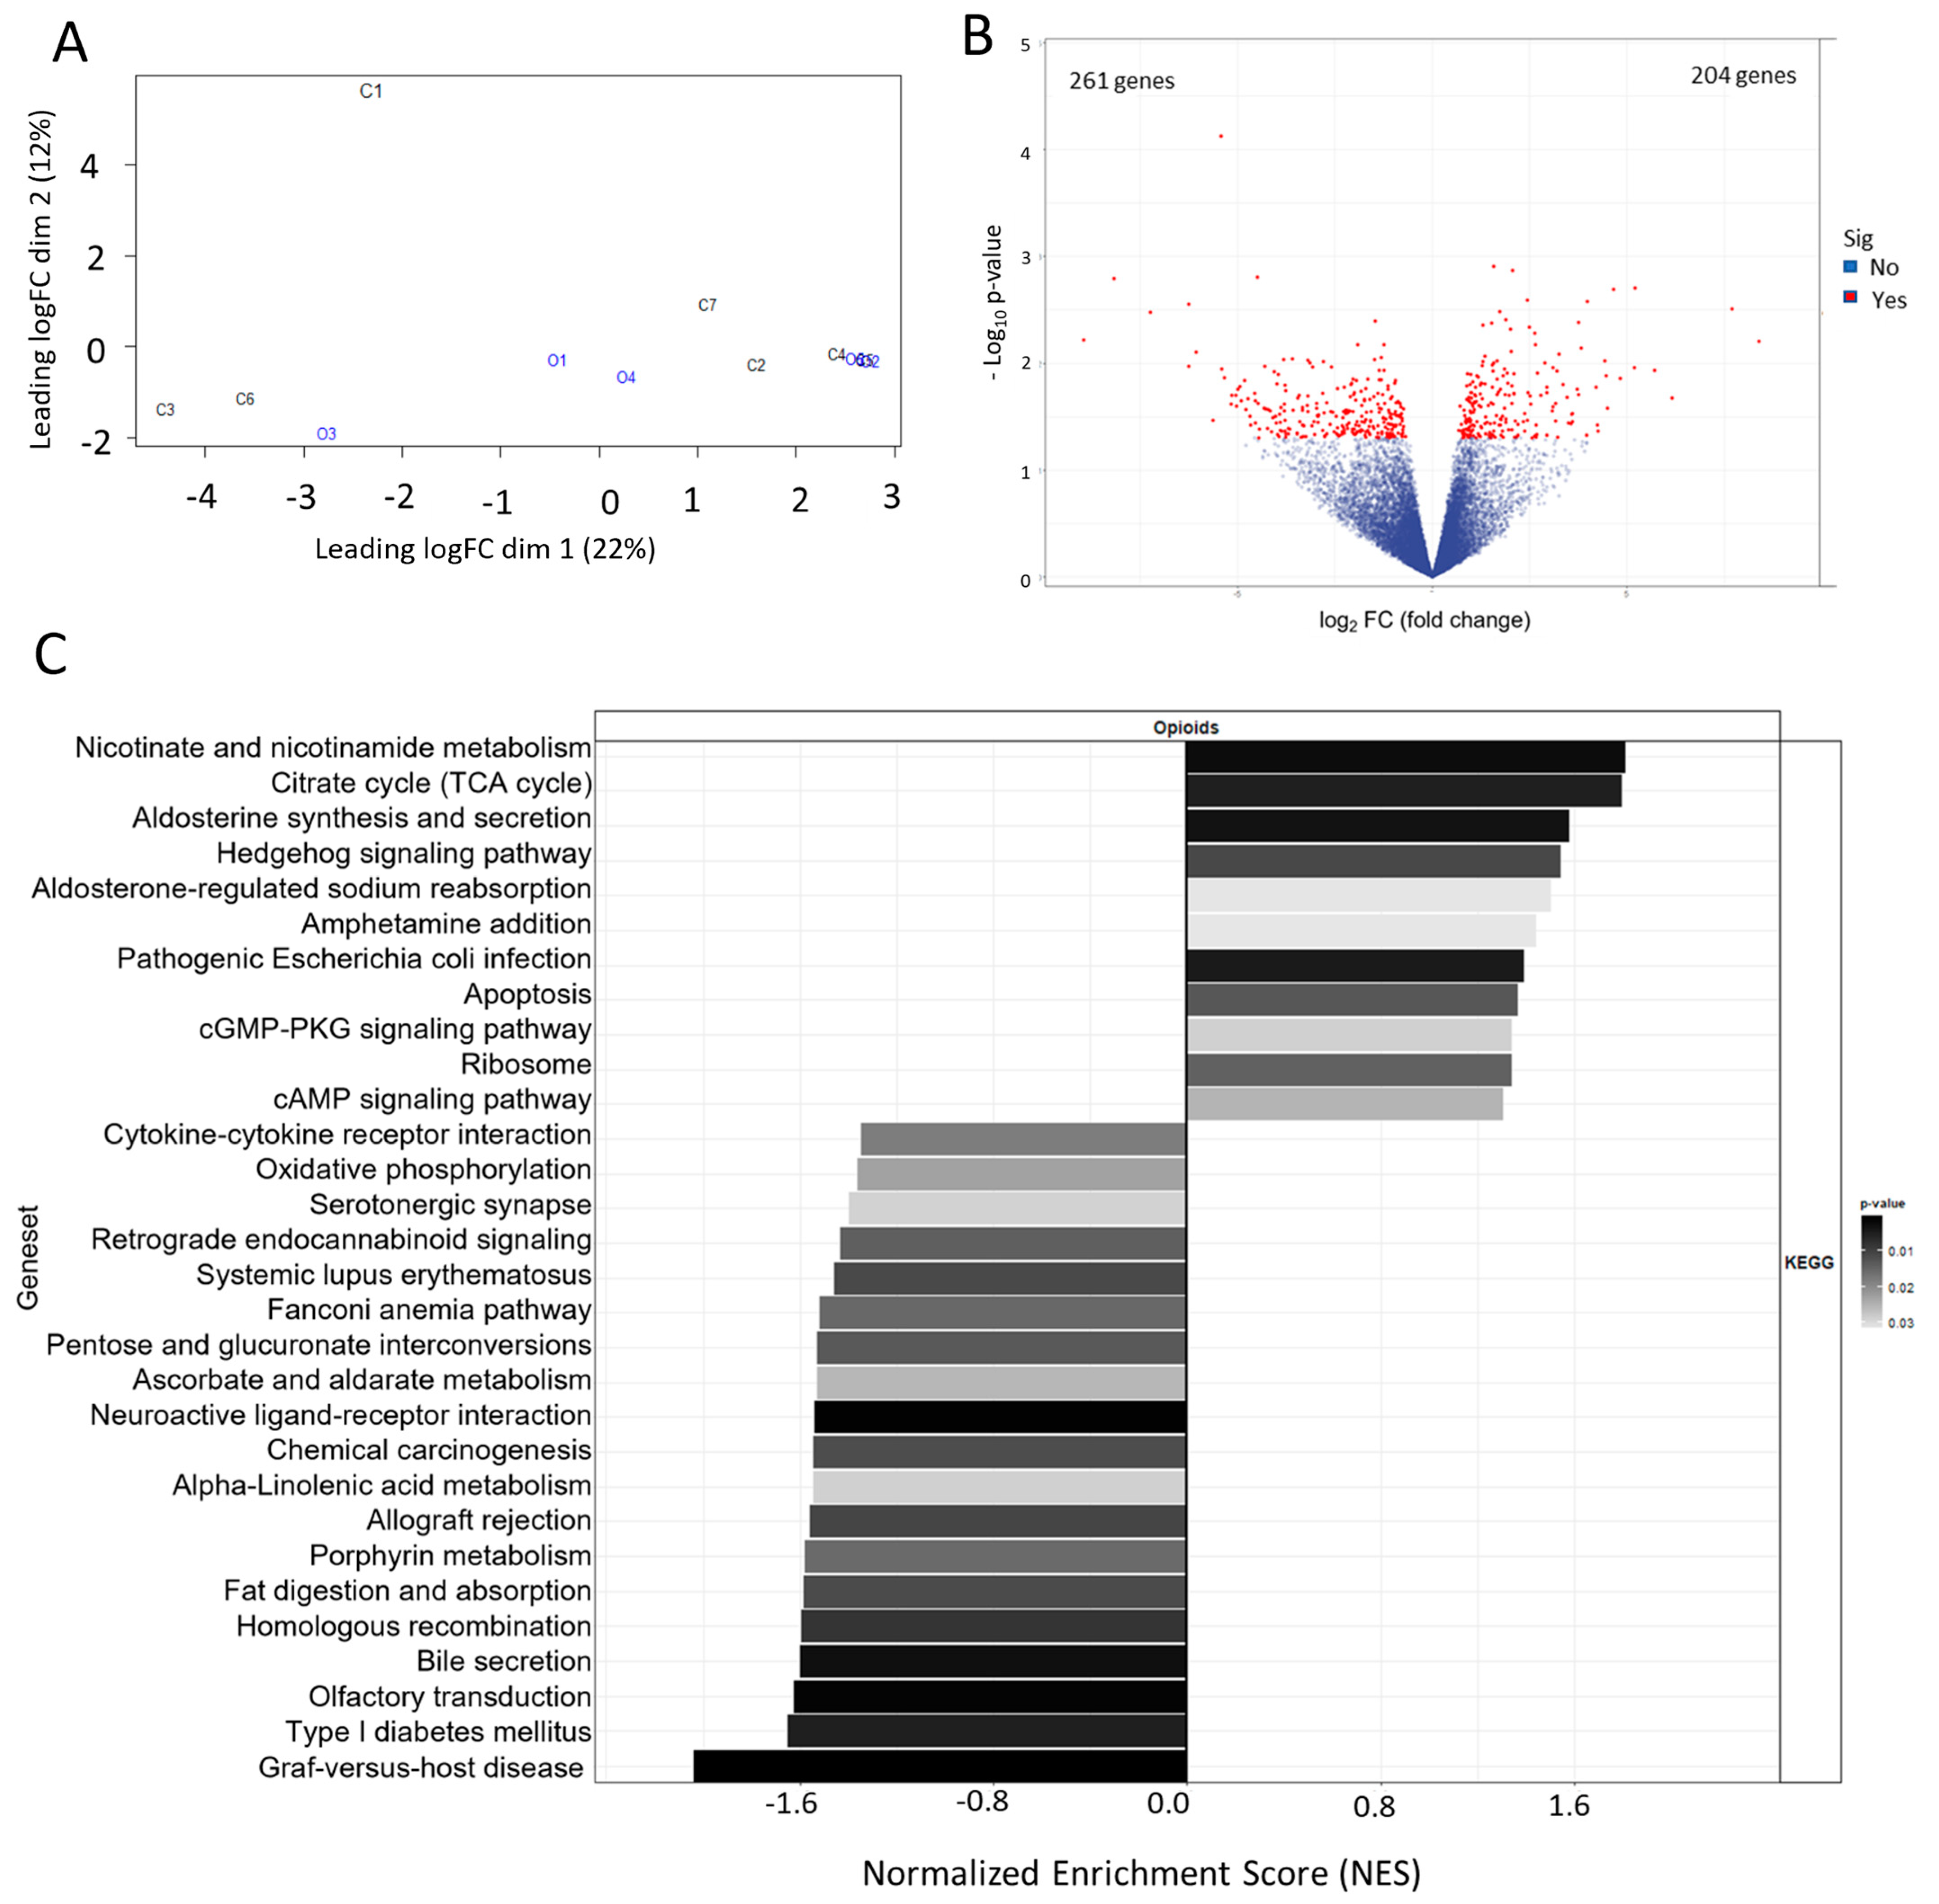
Abstract
:1. Introduction
2. Materials and Methods
2.1. Criteria to Select Patients’ Specimens
2.2. RNA Sequencing
3. Results
3.1. Selection and Preparation of Archived ccRCC Specimens for RNA Sequencing
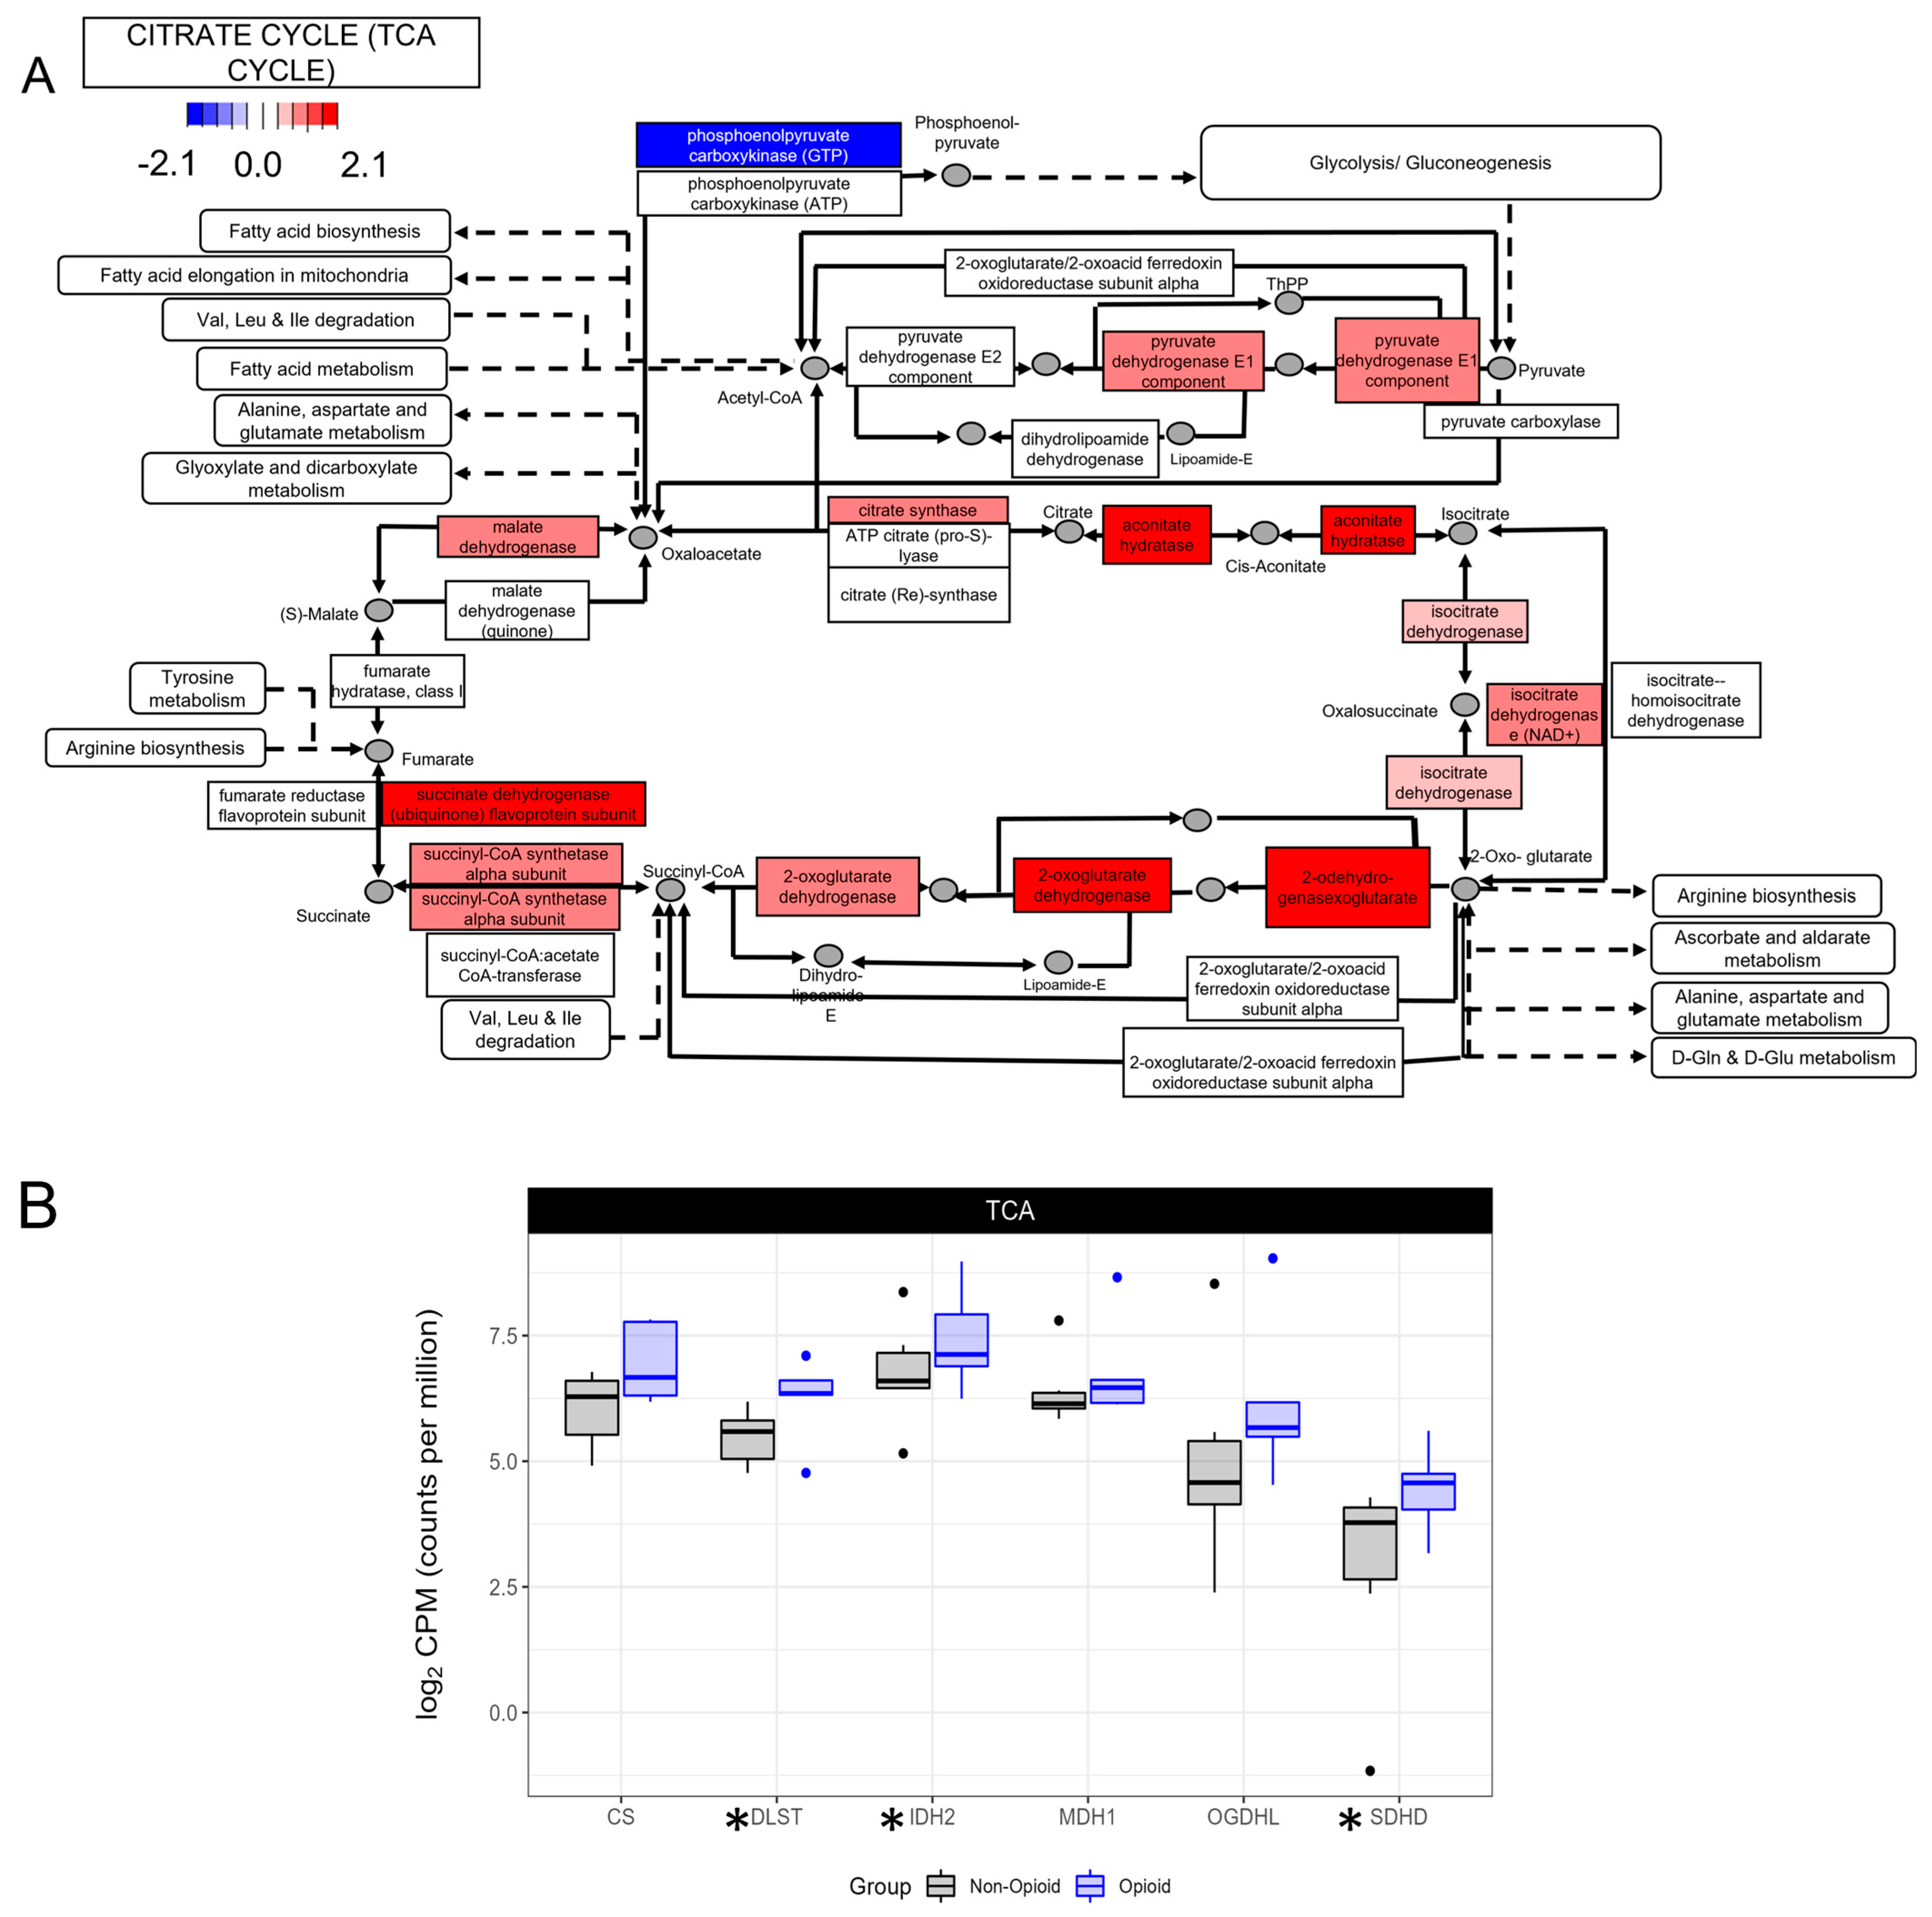
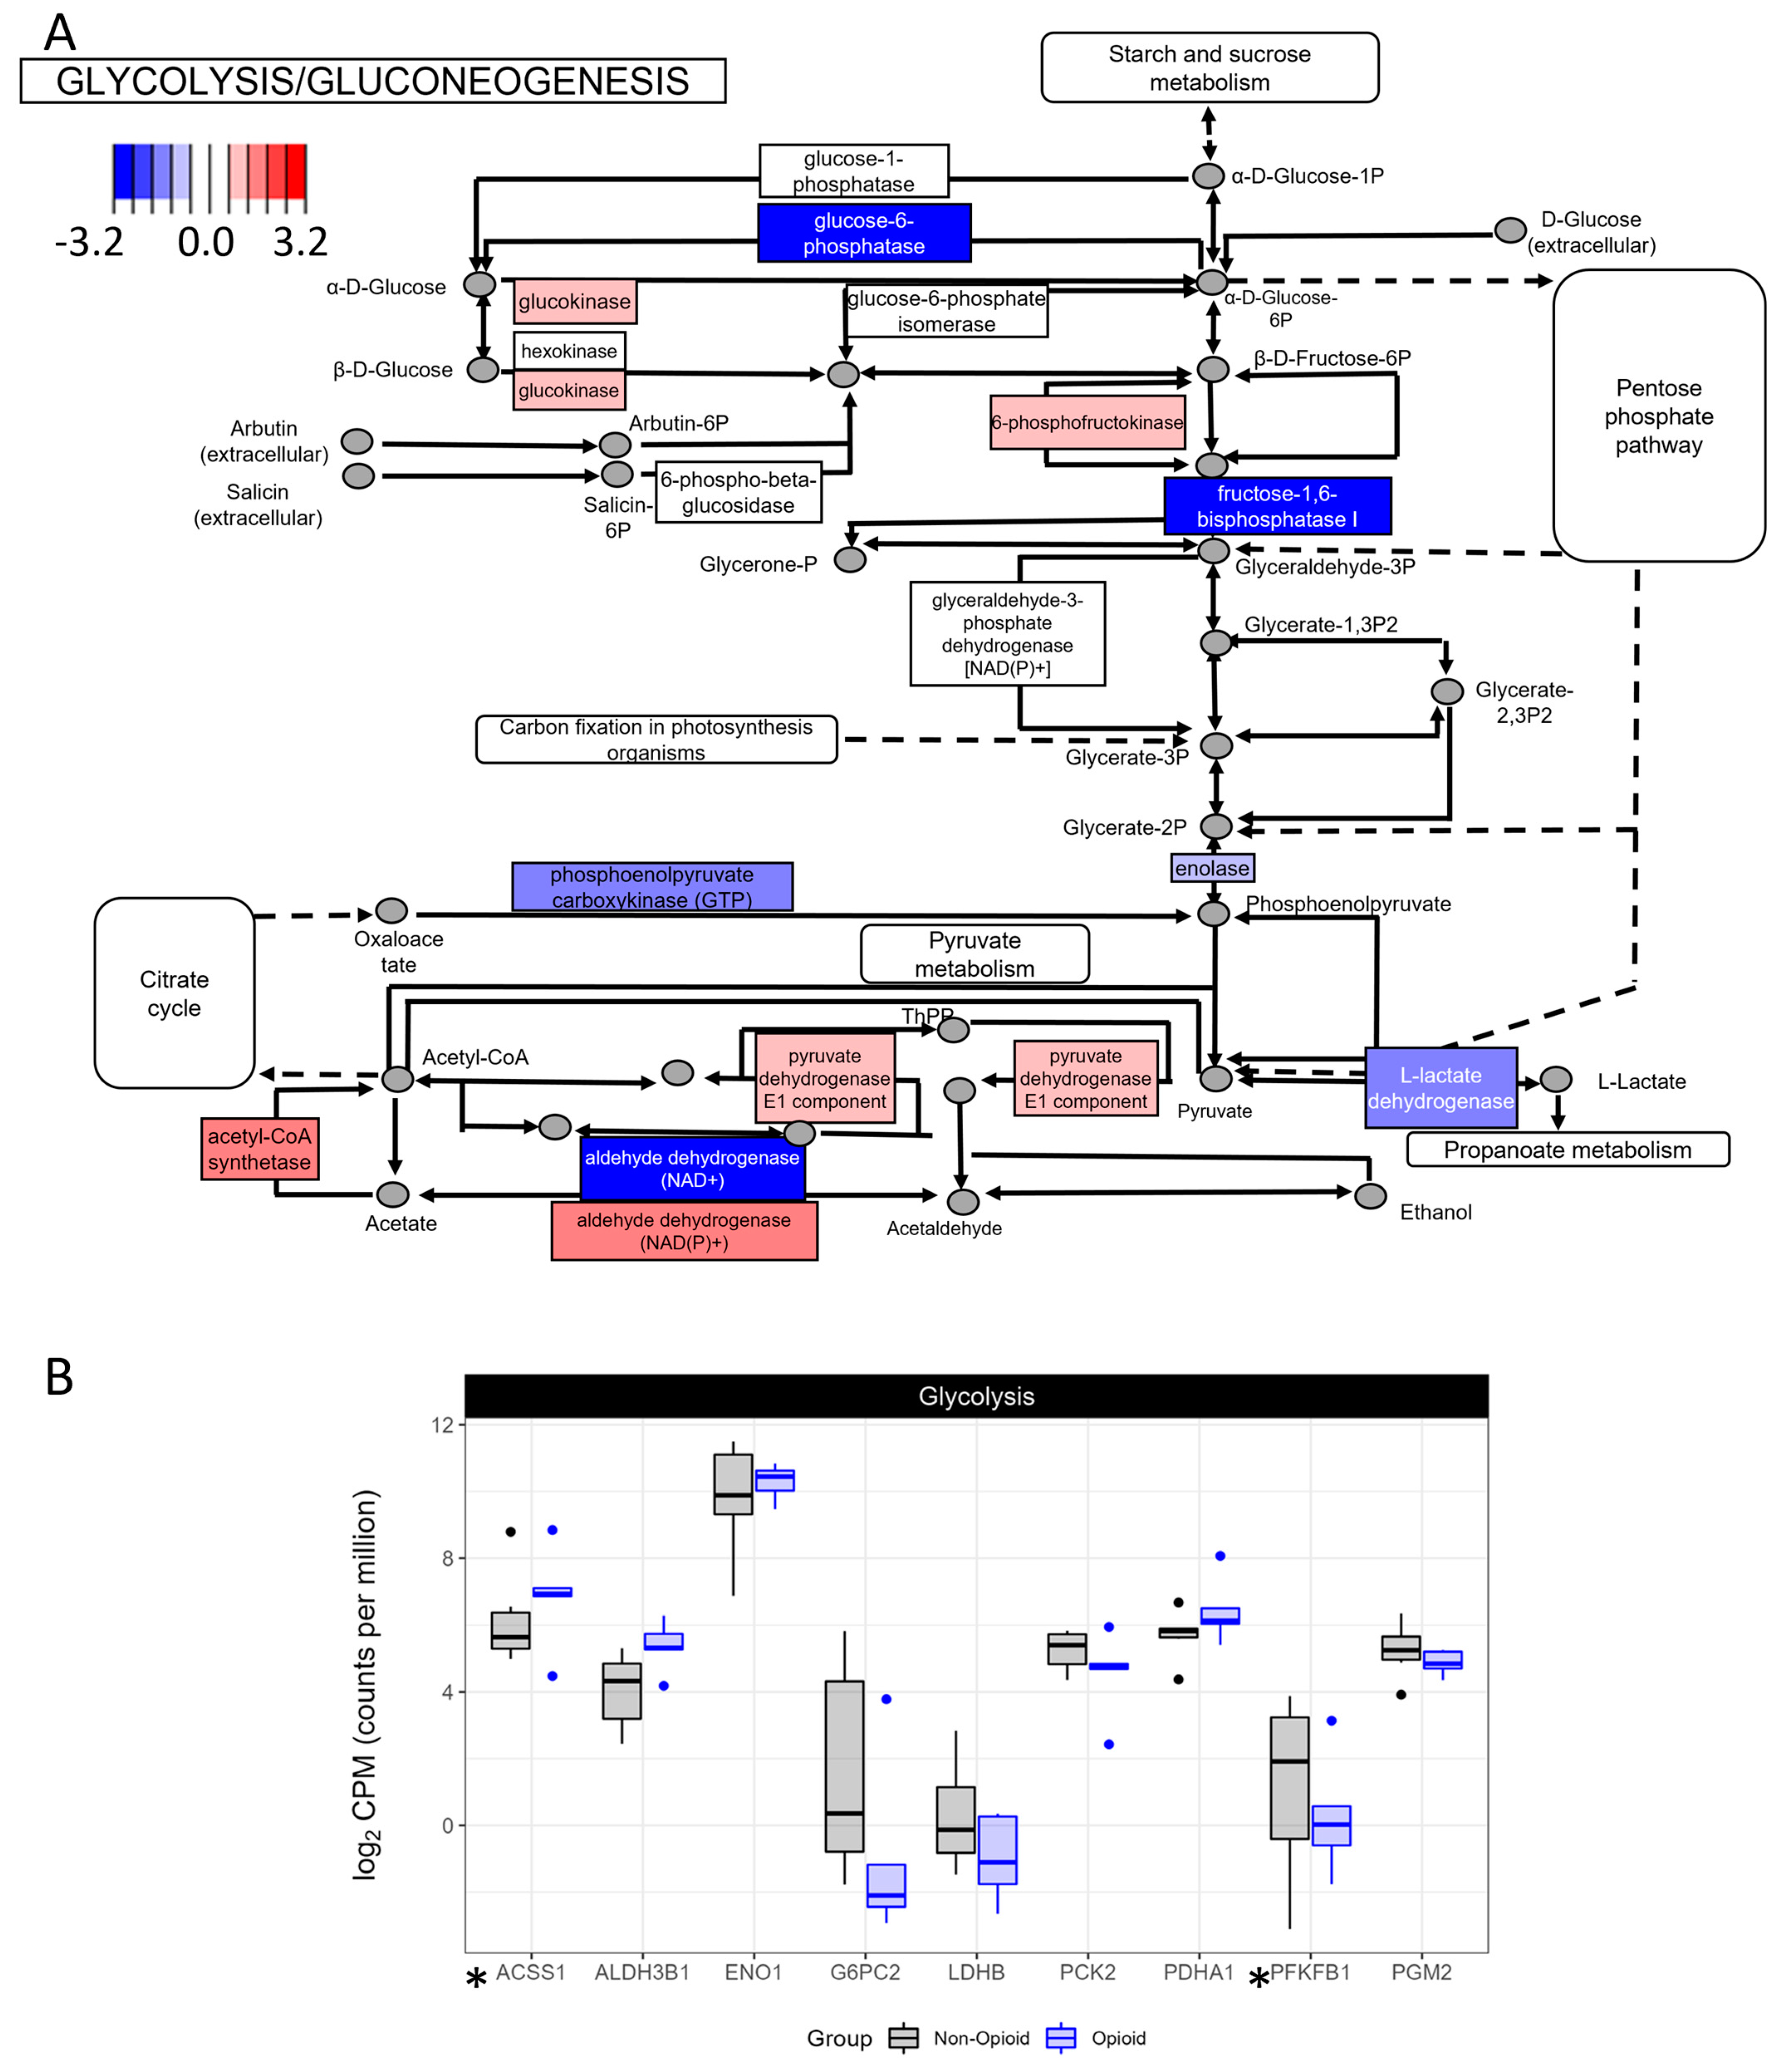
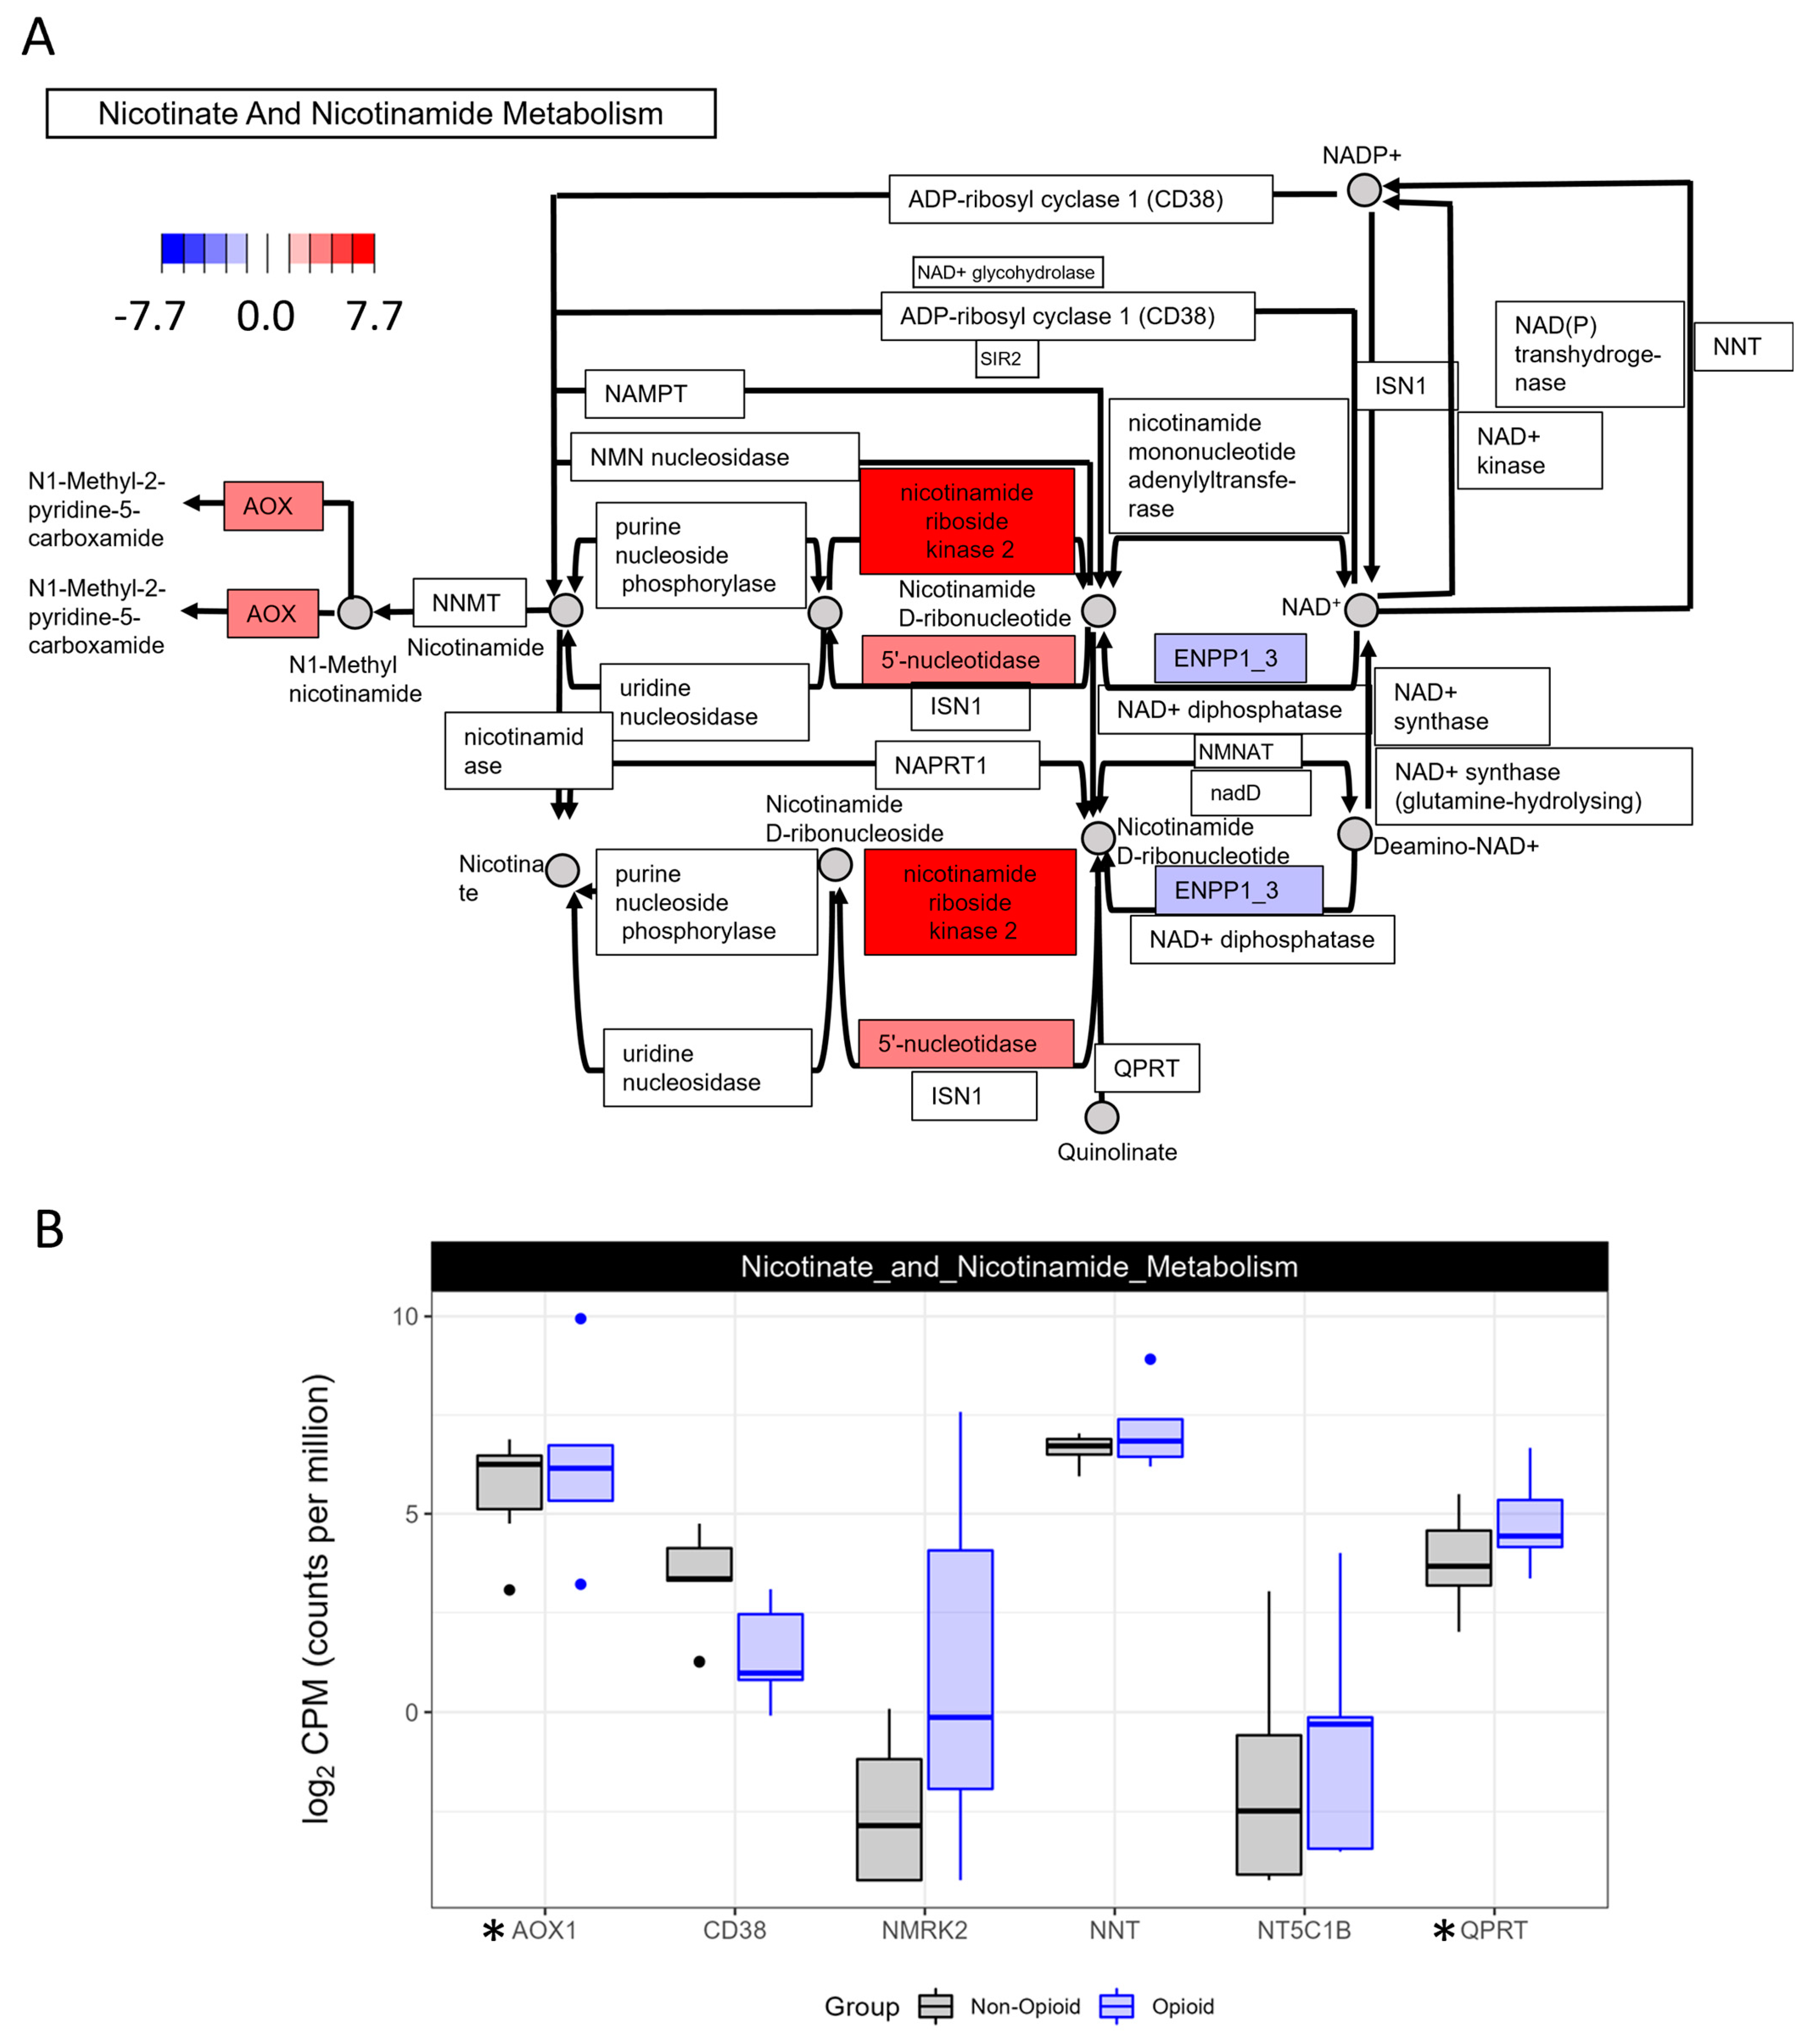
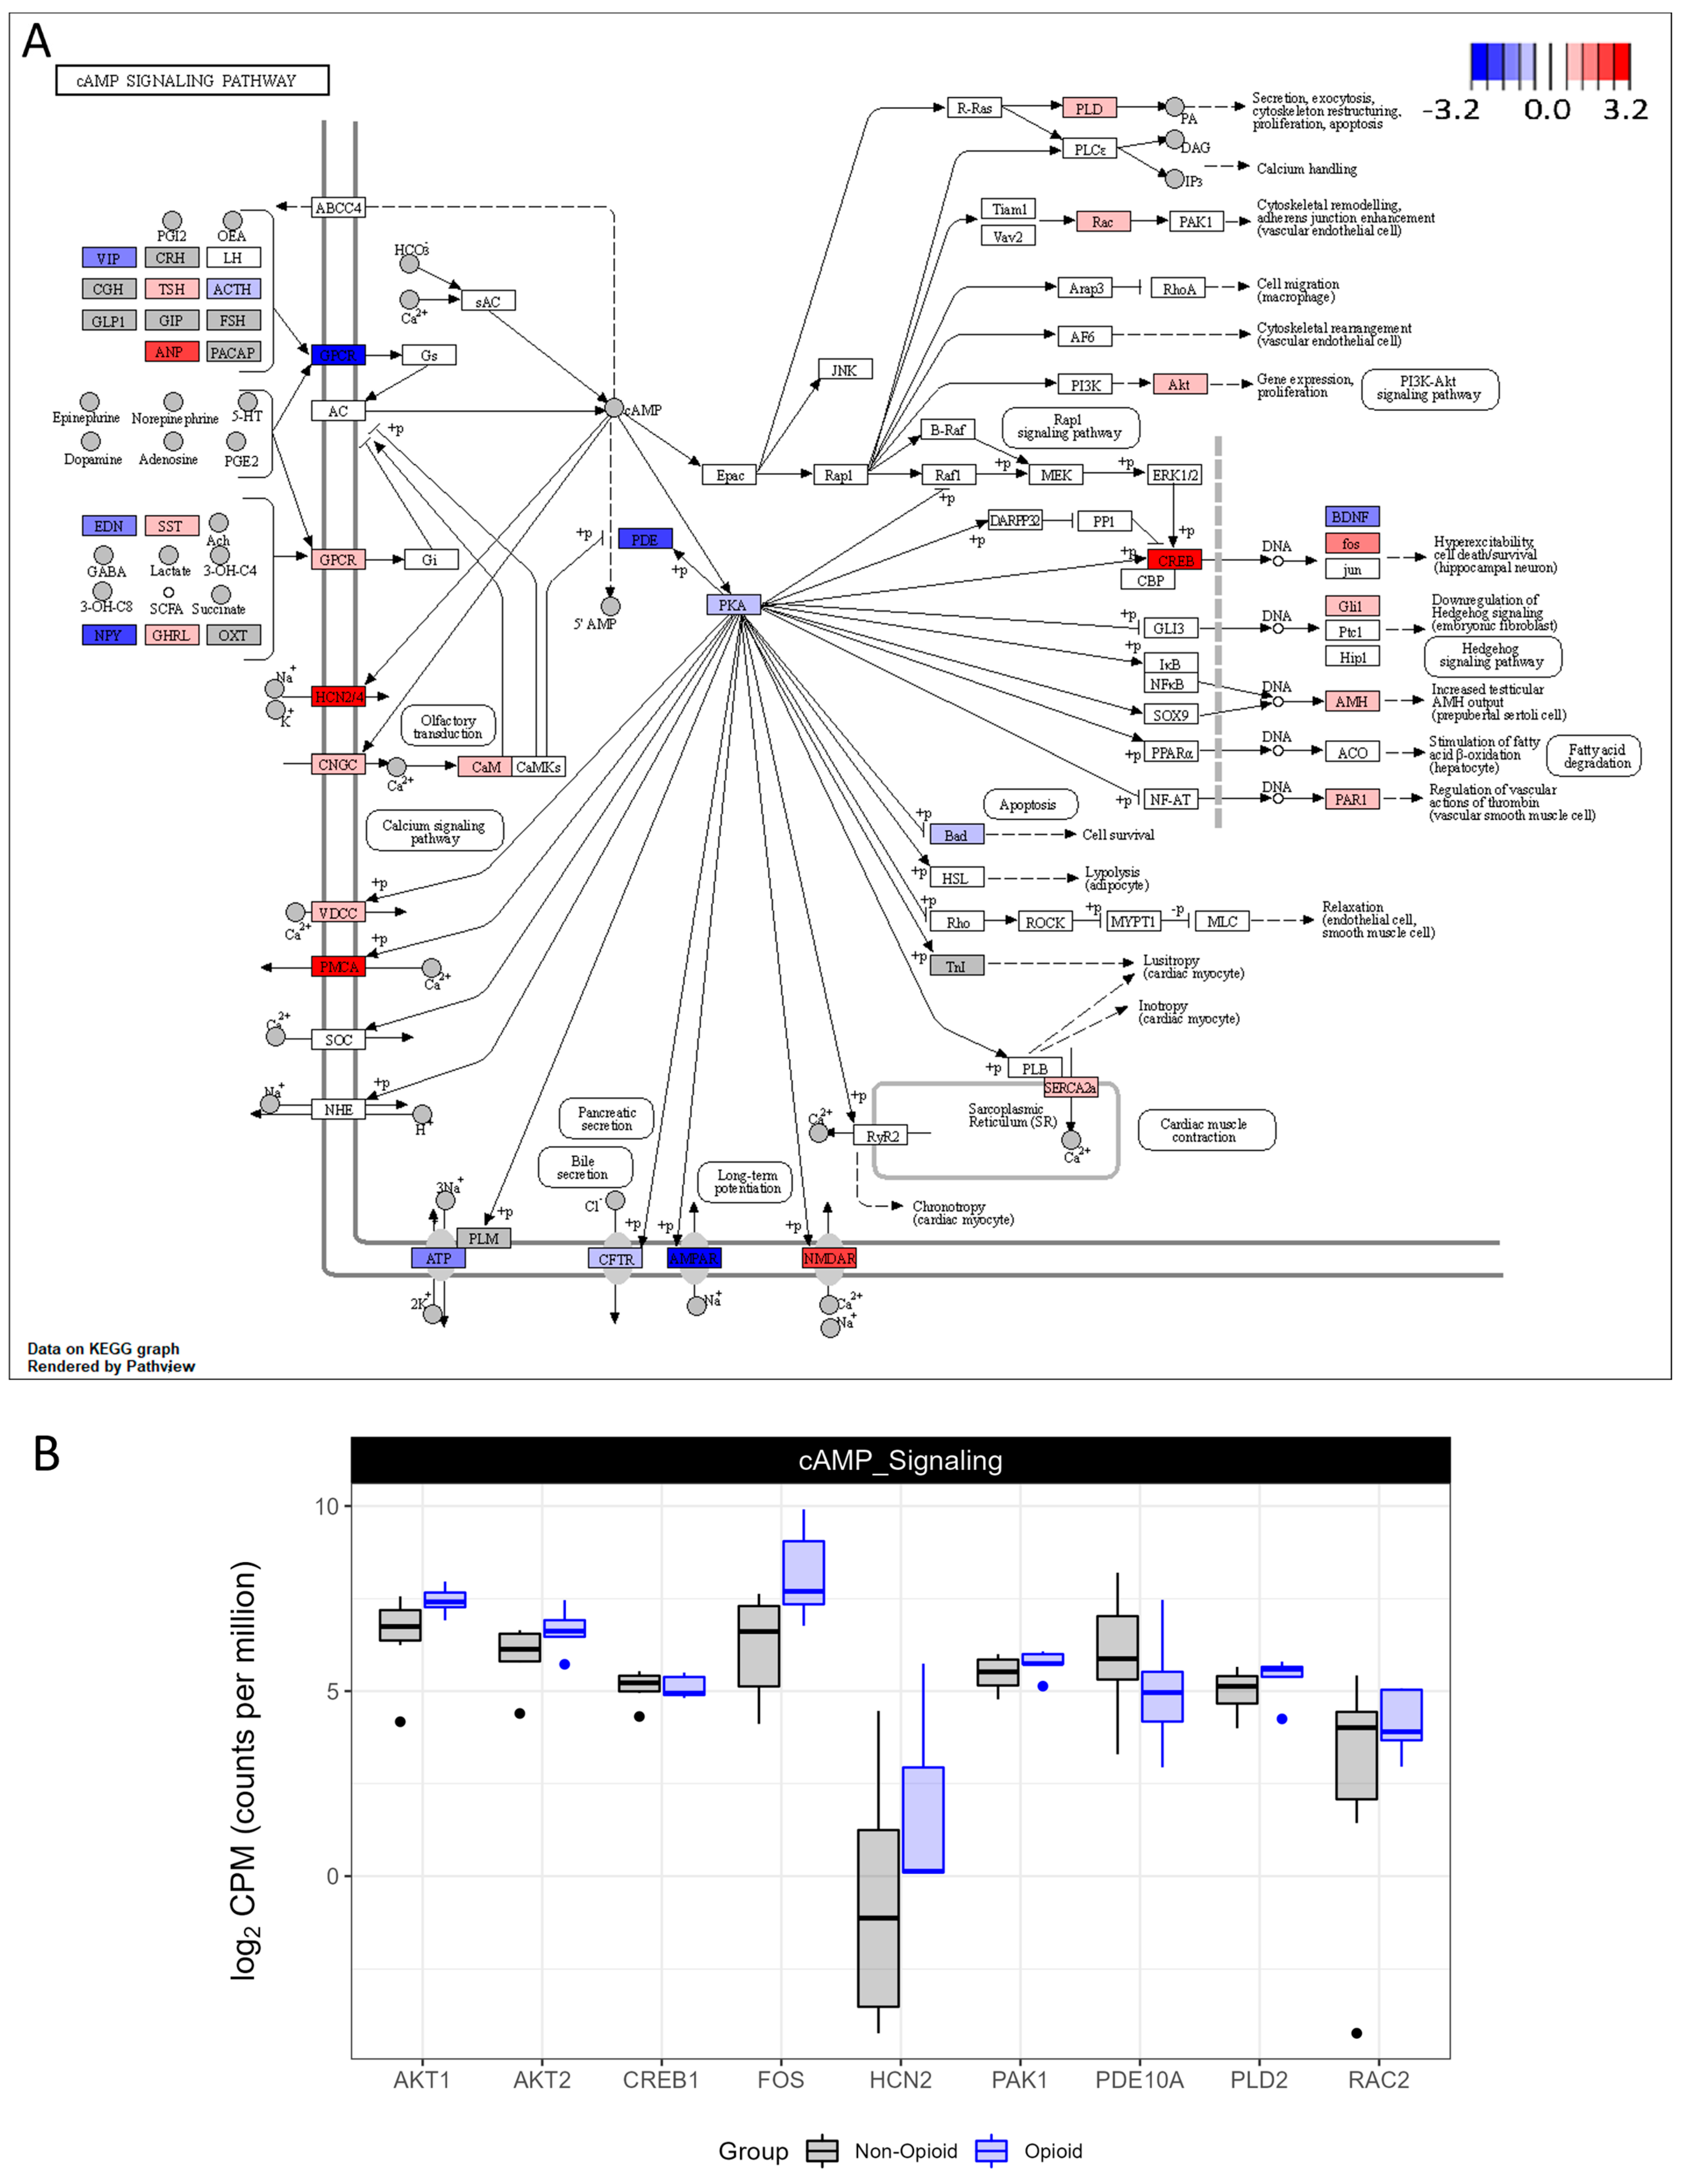
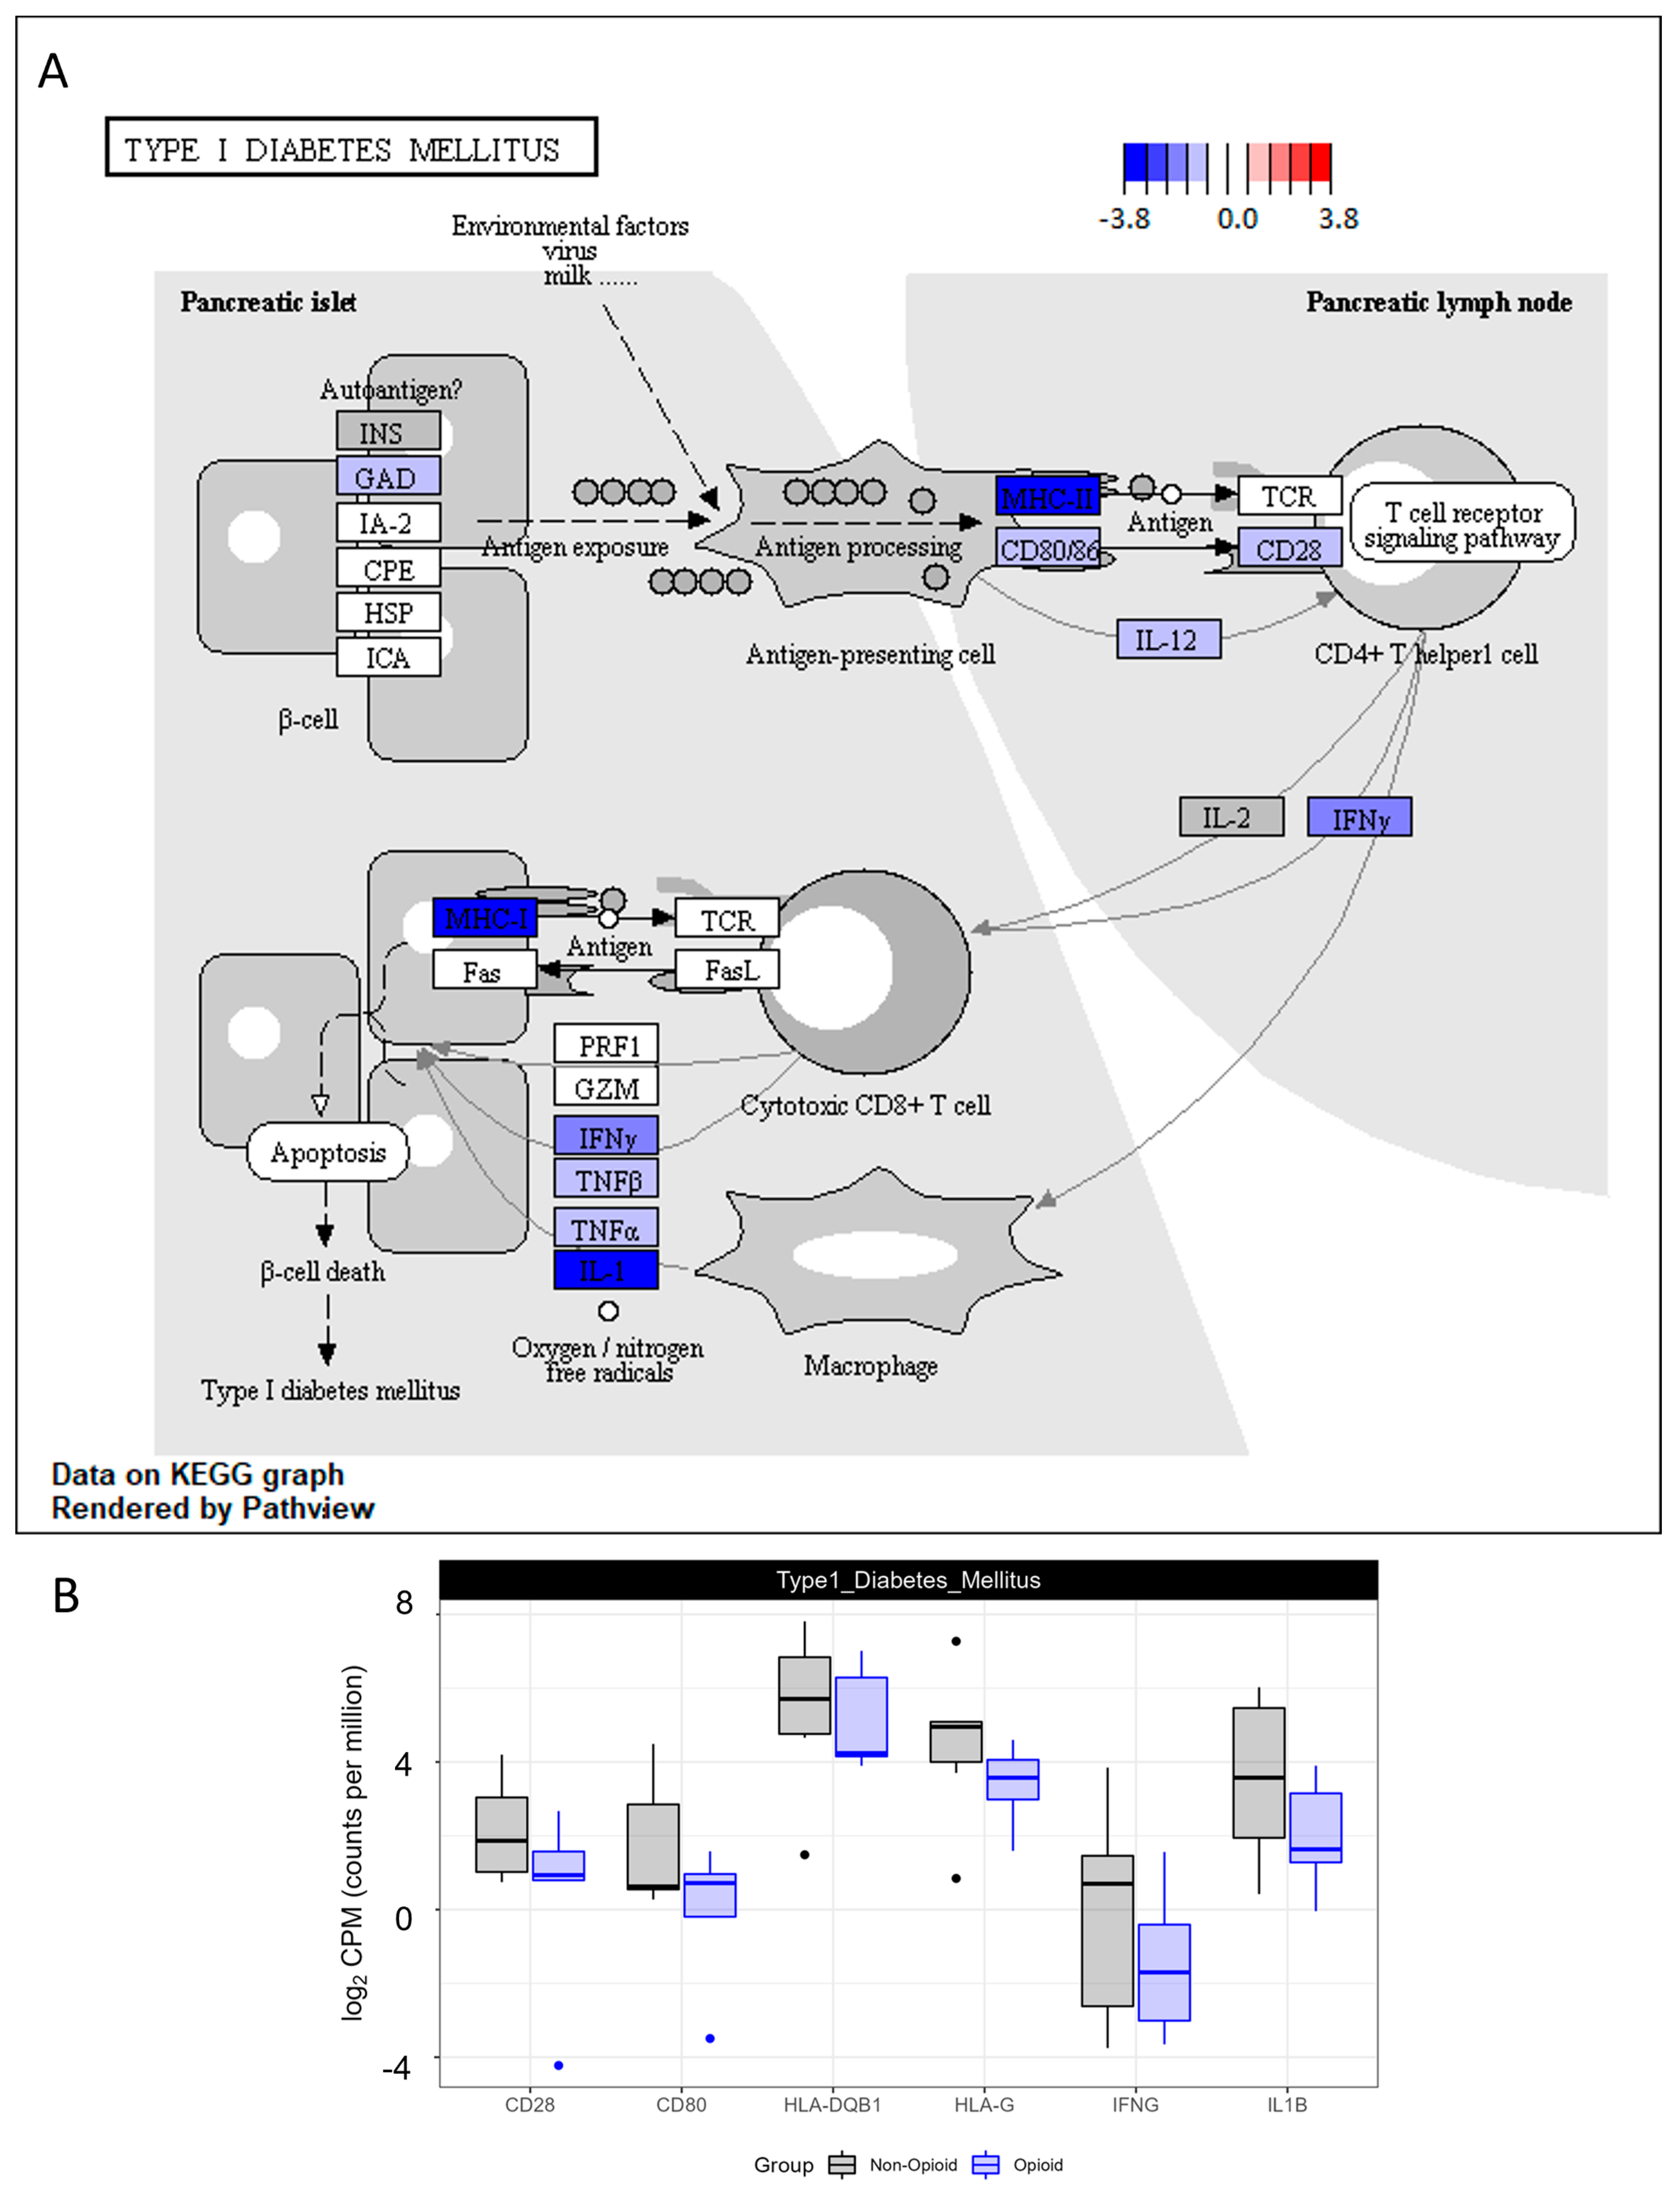
3.2. Metabolic Effects of Extended Opioid Exposure on ccRCC Specimens by RNA Sequencing
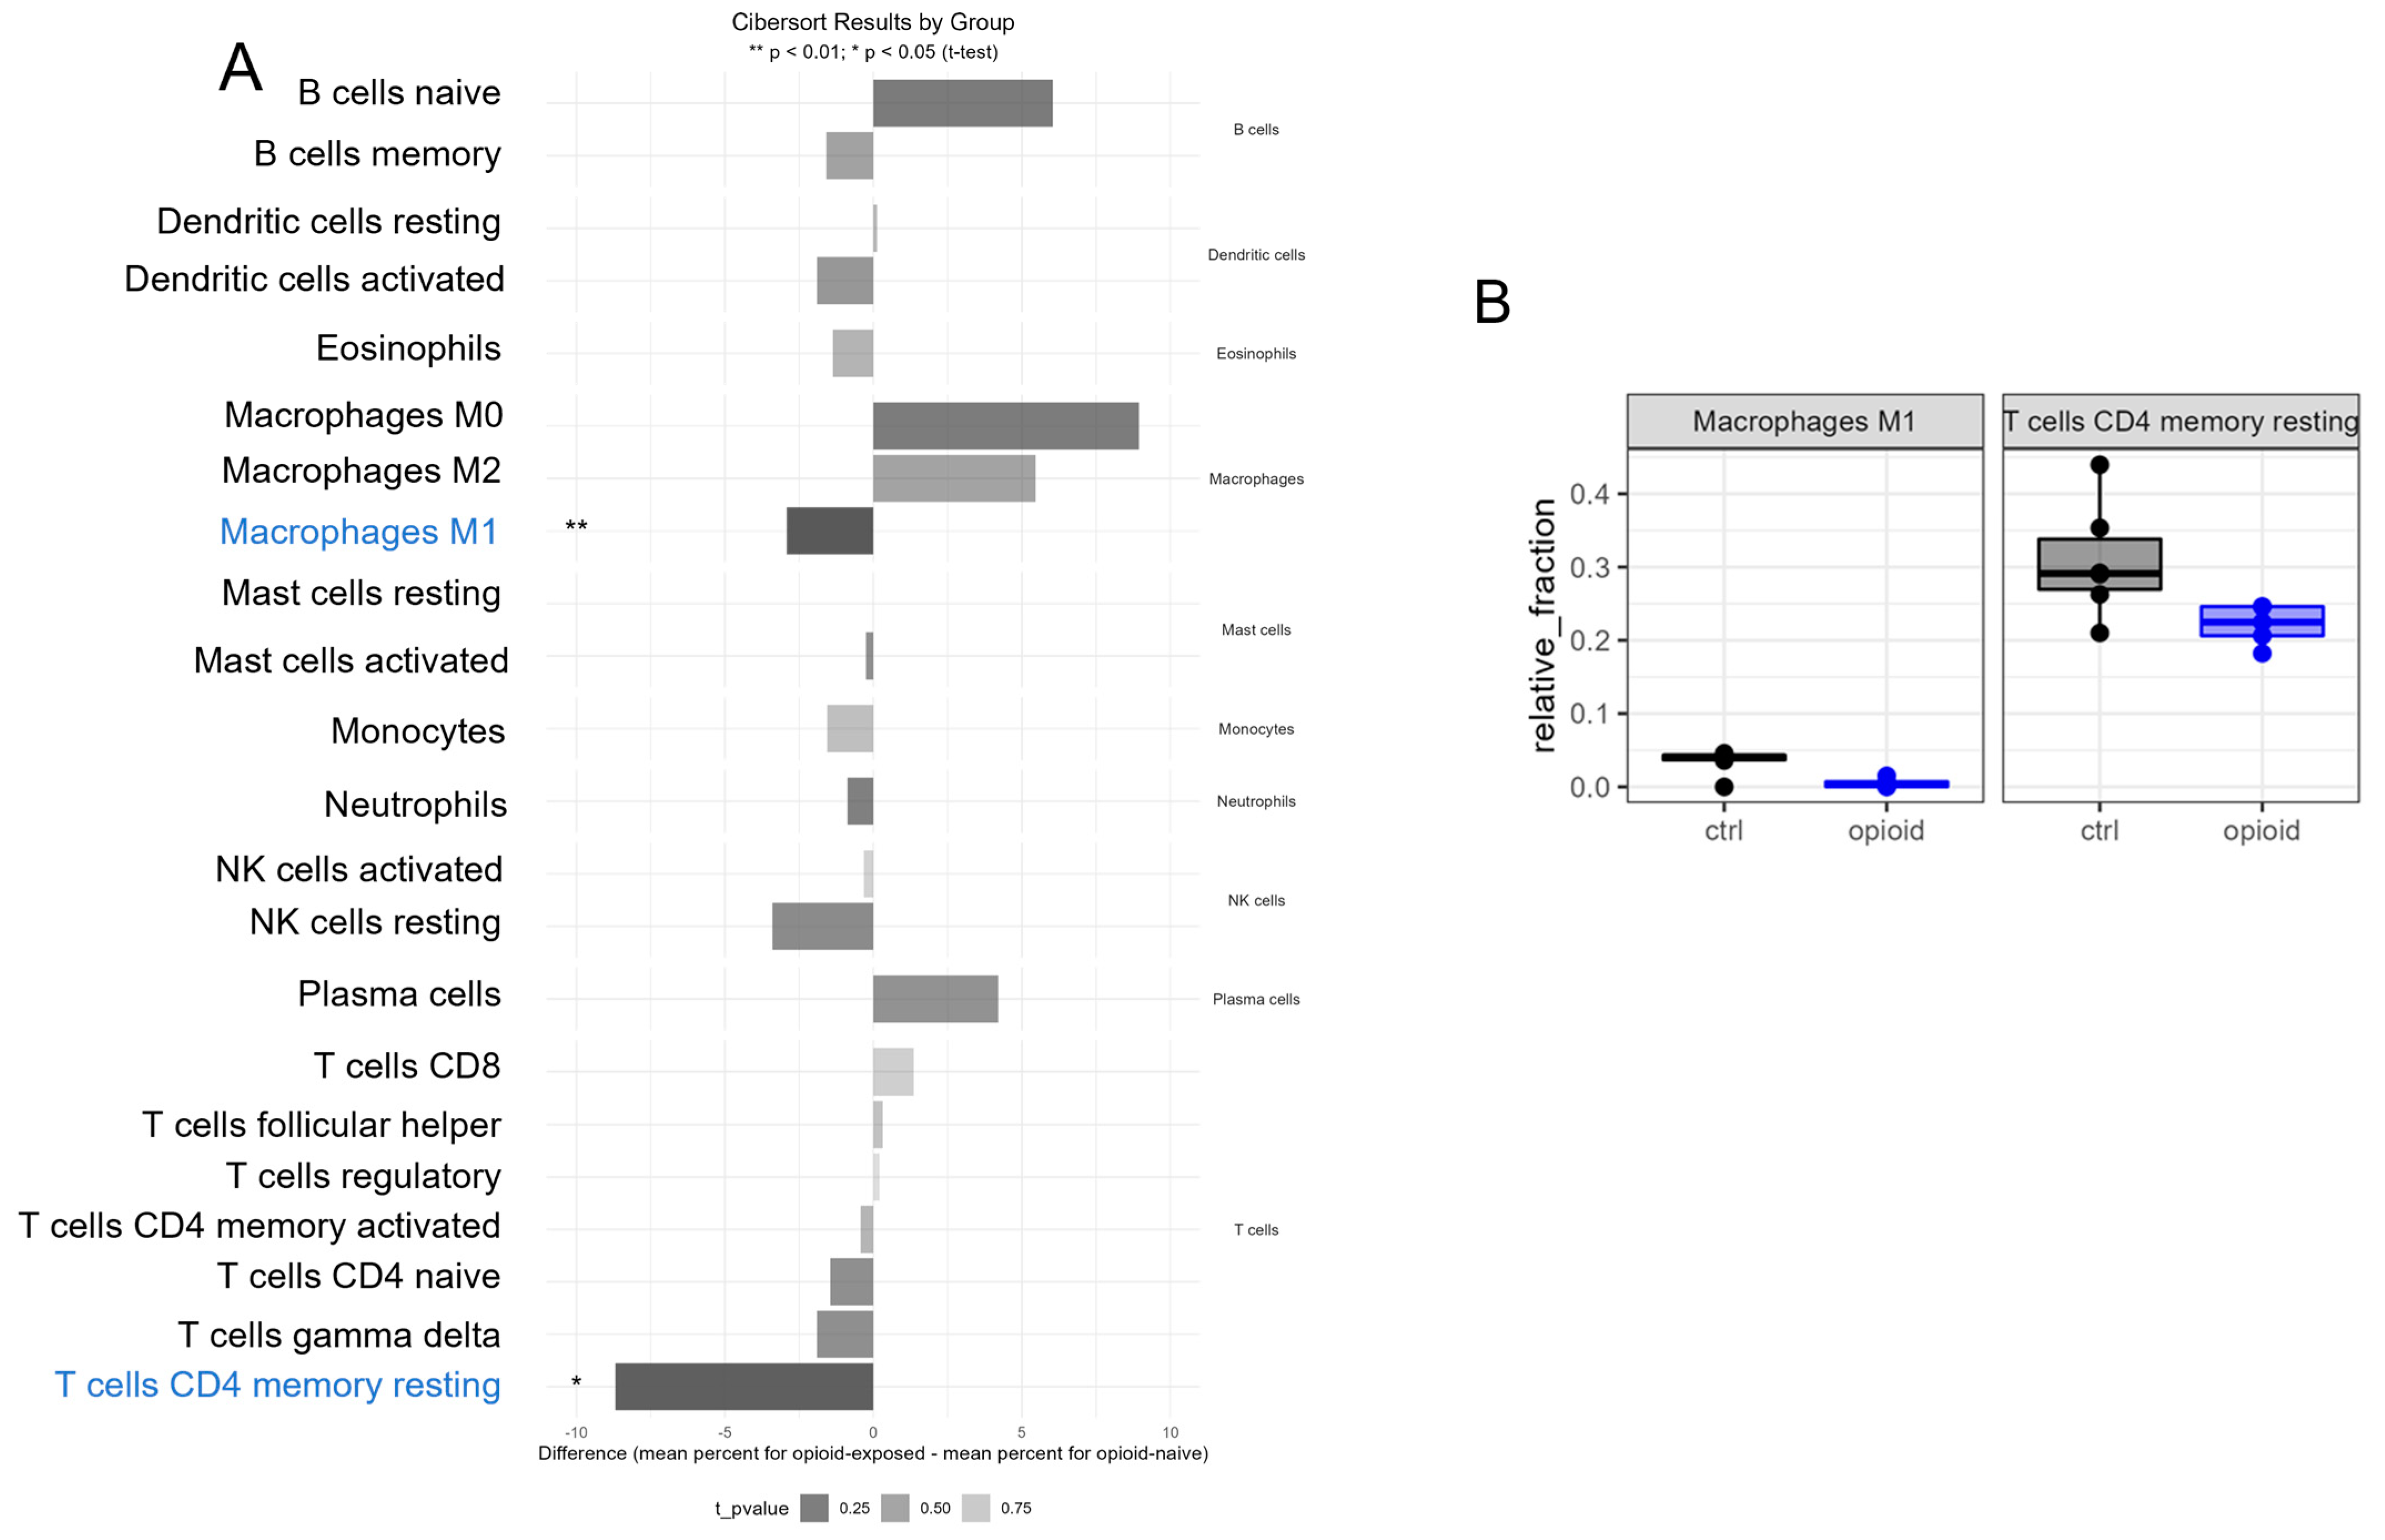
3.3. Immune Effects of Extended Opioid Exposure on ccRCC Specimens
4. Discussion
5. Conclusions
Supplementary Materials
Author Contributions
Funding
Institutional Review Board Statement
Informed Consent Statement
Data Availability Statement
Acknowledgments
Conflicts of Interest
Abbreviations
| CREB | cAMP-responsive element-binding protein |
| ccRCC | clear cell renal cell carcinoma |
| Erk | extracellular signal-regulated kinases |
| FFPE | formalin-fixed paraffin-embedded |
| Glut1 | glucose transporter 1 |
| HIF | hypoxia inducible factor |
| IL-1 | interleukin 1 |
| IFNγ | interferon gamma |
| MAPK | mitogen-activated protein kinase |
| MDS | multidimensional scaling |
| OGF | opioid growth factor |
| TCA | tricarboxylic acid cycle |
| TNF | tumor necrosis factor alpha/beta |
| VEFG | vascular endothelial growth factor |
| VHL | von Hippel Lindau |
References
- Escudier, B.; Porta, C.; Schmidinger, M.; Rioux-Leclercq, N.; Bex, A.; Khoo, V.; Grünwald, V.; Gillessen, S.; Horwich, A. Renal cell carcinoma: ESMO Clinical Practice Guidelines for diagnosis, treatment and follow-up. Ann. Oncol. 2019, 30, 706–720. [Google Scholar] [CrossRef] [PubMed]
- Maxwell, P.H.; Wiesener, M.S.; Chang, G.W.; Clifford, S.C.; Vaux, E.C.; Cockman, M.E.; Wykoff, C.C.; Pugh, C.W.; Maher, E.R.; Ratcliffe, P.J. The tumour suppressor protein VHL targets hypoxia-inducible factors for oxygen-dependent proteolysis. Nature 1999, 399, 271–275. [Google Scholar] [CrossRef] [PubMed]
- Creighton, C.J.; Morgan, M.; Gunaratne, P.H.; Wheeler, D.A.; Gibbs, R.A.; Gordon Robertson, A.; Chu, A.; Beroukhim, R.; Cibulskis, K.; Signoretti, S.; et al. Comprehensive molecular characterization of clear cell renal cell carcinoma. Nature 2013, 499, 43–49. [Google Scholar] [CrossRef]
- Garje, R.; An, J.; Greco, A.; Vaddepally, R.K.; Zakharia, Y. The Future of Immunotherapy-Based Combination Therapy in Metastatic Renal Cell Carcinoma. Cancers 2020, 12, 143. [Google Scholar] [CrossRef] [PubMed]
- Kalra, S.; Atkinson, B.J.; Matrana, M.R.; Matin, S.F.; Wood, C.G.; Karam, J.A.; Tamboli, P.; Sircar, K.; Rao, P.; Corn, P.G.; et al. Prognosis of patients with metastatic renal cell carcinoma and pancreatic metastases. BJU Int. 2016, 117, 761–765. [Google Scholar] [CrossRef]
- Trescot, A.M.; Datta, S.; Lee, M.; Hansen, H. Opioid pharmacology. Pain Physician 2008, 11, S133–S153. [Google Scholar] [CrossRef]
- Plein, L.M.; Rittner, H.L. Opioids and the immune system—Friend or foe. Br. J. Pharmacol. 2018, 175, 2717–2725. [Google Scholar] [CrossRef]
- Roy, S.; Ninkovic, J.; Banerjee, S.; Charboneau, R.G.; Das, S.; Dutta, R.; Kirchner, V.A.; Koodie, L.; Ma, J.; Meng, J.; et al. Opioid drug abuse and modulation of immune function: Consequences in the susceptibility to opportunistic infections. J. Neuroimmune Pharmacol. 2011, 6, 442–465. [Google Scholar] [CrossRef]
- Roy, S.; Loh, H.H. Effects of opioids on the immune system. Neurochem. Res. 1996, 21, 1375–1386. [Google Scholar] [CrossRef]
- Eisenstein, T.K. Opioids and the immune system: What is their mechanism of action? Br. J. Pharmacol. 2011, 164, 1826–1828. [Google Scholar] [CrossRef]
- Ondrovics, M.; Hoelbl-Kovacic, A.; Fux, D.A. Opioids: Modulators of angiogenesis in wound healing and cancer. Oncotarget 2017, 8, 25783. [Google Scholar] [CrossRef] [PubMed]
- Stein, C.; Küchler, S. Targeting inflammation and wound healing by opioids. Trends Pharmacol. Sci. 2013, 34, 303–312. [Google Scholar] [CrossRef] [PubMed]
- Tuerxun, H.; Cui, J. The dual effect of morphine on tumor development. Clin. Transl. Oncol. 2019, 21, 695–701. [Google Scholar] [CrossRef] [PubMed]
- Ma, Y.; Ren, Z.; Ma, S.; Yan, W.; He, M.; Wang, D.; Ding, P. Morphine enhances renal cell carcinoma aggressiveness through promotes survivin level. Ren. Fail. 2017, 39, 258–264. [Google Scholar] [CrossRef]
- Scarpa, J.R.; DiNatale, R.G.; Mano, R.; Silagy, A.W.; Kuo, F.; Irie, T.; McCormick, P.J.; Fischer, G.W.; Hakimi, A.A.; Mincer, J.S. Identifying Clear Cell Renal Cell Carcinoma Coexpression Networks Associated with Opioid Signaling and Survival. Cancer Res. 2021, 81, 1101–1110. [Google Scholar] [CrossRef] [PubMed]
- Bisignani, G.J.; McLaughlin, P.J.; Ordille, S.D.; Beltz, M.S.; Jarowenko, M.V.; Zagon, I.S. Human renal cell cancer proliferation in tissue culture is tonically inhibited by opioid growth factor. J. Urol. 1999, 162, 2186–2191. [Google Scholar] [CrossRef]
- Garige, M.; Ghosh, S.; Norris, A.; Li, G.; Poncet, S.; Chou, C.-K.; Wu, W.W.; Shen, R.-F.; Sourbier, C. PD-L1 Mediates IFNγ-Regulation of Glucose but Not of Tryptophan Metabolism in Clear Cell Renal Cell Carcinoma. Front. Oncol. 2022, 12, 858379. [Google Scholar] [CrossRef]
- Chen, B.; Khodadoust, M.S.; Liu, C.L.; Newman, A.M.; Alizadeh, A.A. Profiling Tumor Infiltrating Immune Cells with CIBERSORT. Methods Mol. Biol. 2018, 1711, 243–259. [Google Scholar] [CrossRef]
- Newman, A.M.; Liu, C.L.; Green, M.R.; Gentles, A.J.; Feng, W.; Xu, Y.; Hoang, C.D.; Diehn, M.; Alizadeh, A.A. Robust enumeration of cell subsets from tissue expression profiles. Nat. Methods 2015, 12, 453–457. [Google Scholar] [CrossRef]
- Hanahan, D.; Coussens, L.M. Accessories to the crime: Functions of cells recruited to the tumor microenvironment. Cancer Cell 2012, 21, 309–322. [Google Scholar] [CrossRef]
- Ould Amer, Y.; Hebert-Chatelain, E. Mitochondrial cAMP-PKA signaling: What do we really know? Biochim. Biophys. Acta (BBA)-Bioenerg. 2018, 1859, 868–877. [Google Scholar] [CrossRef] [PubMed]
- Srivastava, S. Emerging therapeutic roles for NAD(+) metabolism in mitochondrial and age-related disorders. Clin. Transl. Med. 2016, 5, 25. [Google Scholar] [CrossRef] [PubMed]
- Berger, S.L.; Sassone-Corsi, P. Metabolic Signaling to Chromatin. Cold Spring Harb. Perspect. Biol. 2016, 8, 019463. [Google Scholar] [CrossRef] [PubMed]
- Gerhart-Hines, Z.; Dominy, J.E., Jr.; Blättler, S.M.; Jedrychowski, M.P.; Banks, A.S.; Lim, J.H.; Chim, H.; Gygi, S.P.; Puigserver, P. The cAMP/PKA pathway rapidly activates SIRT1 to promote fatty acid oxidation independently of changes in NAD(+). Mol. Cell 2011, 44, 851–863. [Google Scholar] [CrossRef] [PubMed]
- Haeusler, R.A.; McGraw, T.E.; Accili, D. Biochemical and cellular properties of insulin receptor signalling. Nat. Rev. Mol. Cell Biol. 2018, 19, 31–44. [Google Scholar] [CrossRef]
- Schmidt, A.M. Highlighting Diabetes Mellitus: The Epidemic Continues. Arterioscler. Thromb. Vasc. Biol. 2018, 38, e1–e8. [Google Scholar] [CrossRef]
- Hanahan, D.; Weinberg, R.A. Hallmarks of Cancer: The Next Generation. Cell 2011, 144, 646–674. [Google Scholar] [CrossRef]
- Hanahan, D. Hallmarks of Cancer: New Dimensions. Cancer Discov. 2022, 12, 31–46. [Google Scholar] [CrossRef]
- Lyssiotis, C.A.; Kimmelman, A.C. Metabolic Interactions in the Tumor Microenvironment. Trends Cell Biol. 2017, 27, 863–875. [Google Scholar] [CrossRef]
- Linehan, W.M.; Schmidt, L.S.; Crooks, D.R.; Wei, D.; Srinivasan, R.; Lang, M.; Ricketts, C.J. The Metabolic Basis of Kidney Cancer. Cancer Discov. 2019, 9, 1006–1021. [Google Scholar] [CrossRef]
- Ricketts, C.J.; Crooks, D.R.; Sourbier, C.; Schmidt, L.S.; Srinivasan, R.; Linehan, W.M. SnapShot: Renal Cell Carcinoma. Cancer Cell 2016, 29, 610–610.e1. [Google Scholar] [CrossRef] [PubMed]
- Díaz-Montero, C.M.; Rini, B.I.; Finke, J.H. The immunology of renal cell carcinoma. Nat. Rev. Nephrol. 2020, 16, 721–735. [Google Scholar] [CrossRef] [PubMed]
- Qian, C.N.; Huang, D.; Wondergem, B.; Teh, B.T. Complexity of tumor vasculature in clear cell renal cell carcinoma. Cancer 2009, 115, 2282–2289. [Google Scholar] [CrossRef] [PubMed]
- Dutcher, J.P.; Flippot, R.; Fallah, J.; Escudier, B. On the Shoulders of Giants: The Evolution of Renal Cell Carcinoma Treatment-Cytokines, Targeted Therapy, and Immunotherapy. Am. Soc. Clin. Oncol. Educ. Book 2020, 40, 418–435. [Google Scholar] [CrossRef]
- Zhang, H.; Kong, Q.; Wang, J.; Jiang, Y.; Hua, H. Complex roles of cAMP–PKA–CREB signaling in cancer. Exp. Hematol. Oncol. 2020, 9, 32. [Google Scholar] [CrossRef]
- Santoni, A.; Santoni, M.; Arcuri, E. Chronic Cancer Pain: Opioids within Tumor Microenvironment Affect Neuroinflammation, Tumor and Pain Evolution. Cancers 2022, 14, 2253. [Google Scholar] [CrossRef]
- Cata, J.P.; Uhelski, M.L.; Gorur, A.; Bhoir, S.; Ilsin, N.; Dougherty, P.M. The µ-Opioid Receptor in Cancer and Its Role in Perineural Invasion: A Short Review and New Evidence. Adv. Biol. 2022, 6, e2200020. [Google Scholar] [CrossRef]
- Mosser, D.M.; Edwards, J.P. Exploring the full spectrum of macrophage activation. Nat. Rev. Immunol. 2008, 8, 958–969. [Google Scholar] [CrossRef]
- Hadrup, S.; Donia, M.; Thor Straten, P. Effector CD4 and CD8 T cells and their role in the tumor microenvironment. Cancer Microenviron. 2013, 6, 123–133. [Google Scholar] [CrossRef]
- Boutilier, A.J.; Elsawa, S.F. Macrophage Polarization States in the Tumor Microenvironment. Int. J. Mol. Sci. 2021, 22, 6995. [Google Scholar] [CrossRef]
- Kovaleva, O.V.; Samoilova, D.V.; Shitova, M.S.; Gratchev, A. Tumor Associated Macrophages in Kidney Cancer. Anal. Cell Pathol. 2016, 2016, 9307549. [Google Scholar] [CrossRef] [PubMed]
- Zhang, S.; Zhang, E.; Long, J.; Hu, Z.; Peng, J.; Liu, L.; Tang, F.; Li, L.; Ouyang, Y.; Zeng, Z. Immune infiltration in renal cell carcinoma. Cancer Sci. 2019, 110, 1564–1572. [Google Scholar] [CrossRef] [PubMed]
- Kim, I.H.; Lee, H.J. The Frontline Immunotherapy-Based Treatment of Advanced Clear Cell Renal Cell Carcinoma: Current Evidence and Clinical Perspective. Biomedicines 2022, 10, 251. [Google Scholar] [CrossRef] [PubMed]


Disclaimer/Publisher’s Note: The statements, opinions and data contained in all publications are solely those of the individual author(s) and contributor(s) and not of MDPI and/or the editor(s). MDPI and/or the editor(s) disclaim responsibility for any injury to people or property resulting from any ideas, methods, instructions or products referred to in the content. |
© 2023 by the authors. Licensee MDPI, Basel, Switzerland. This article is an open access article distributed under the terms and conditions of the Creative Commons Attribution (CC BY) license (https://creativecommons.org/licenses/by/4.0/).
Share and Cite
Garige, M.; Poncet, S.; Norris, A.; Chou, C.-K.; Wu, W.W.; Shen, R.-F.; Greenberg, J.W.; Krane, L.S.; Sourbier, C. Extended Opioid Exposure Modulates the Molecular Metabolism of Clear Cell Renal Cell Carcinoma. Life 2023, 13, 1196. https://doi.org/10.3390/life13051196
Garige M, Poncet S, Norris A, Chou C-K, Wu WW, Shen R-F, Greenberg JW, Krane LS, Sourbier C. Extended Opioid Exposure Modulates the Molecular Metabolism of Clear Cell Renal Cell Carcinoma. Life. 2023; 13(5):1196. https://doi.org/10.3390/life13051196
Chicago/Turabian StyleGarige, Mamatha, Sarah Poncet, Alexis Norris, Chao-Kai Chou, Wells W. Wu, Rong-Fong Shen, Jacob W. Greenberg, Louis Spencer Krane, and Carole Sourbier. 2023. "Extended Opioid Exposure Modulates the Molecular Metabolism of Clear Cell Renal Cell Carcinoma" Life 13, no. 5: 1196. https://doi.org/10.3390/life13051196