Article

Identifying mRNAs Residing in Myelinating Oligodendrocyte Processes as a Basis for Understanding Internode Autonomy

1
Whitman Research Center, Marine Biology Laboratory, Woods Hole, MA 02543, USA
2
Departments of Anatomy and Cell Biology, University of Illinois at Chicago, Chicago, IL 60612, USA
*
Author to whom correspondence should be addressed.
Life 2023, 13(4), 945; https://doi.org/10.3390/life13040945
Submission received: 22 February 2023 / Revised: 28 March 2023 / Accepted: 31 March 2023 / Published: 4 April 2023
(This article belongs to the Special Issue Myelin and Oligodendrocyte-Neuron Interactions)

Abstract

:
In elaborating and maintaining myelin sheaths on multiple axons/segments, oligodendrocytes distribute translation of some proteins, including myelin basic protein (MBP), to sites of myelin sheath assembly, or MSAS. As mRNAs located at these sites are selectively trapped in myelin vesicles during tissue homogenization, we performed a screen to identify some of these mRNAs. To confirm locations, we used real-time quantitative polymerase chain reaction (RT-qPCR), to measure mRNA levels in myelin (M) and ‘non-myelin’ pellet (P) fractions, and found that five (LPAR1, TRP53INP2, TRAK2, TPPP, and SH3GL3) of thirteen mRNAs were highly enriched in myelin (M/P), suggesting residences in MSAS. Because expression by other cell-types will increase p-values, some MSAS mRNAs might be missed. To identify non-oligodendrocyte expression, we turned to several on-line resources. Although neurons express TRP53INP2, TRAK2 and TPPP mRNAs, these expressions did not invalidate recognitions as MSAS mRNAs. However, neuronal expression likely prevented recognition of KIF1A and MAPK8IP1 mRNAs as MSAS residents and ependymal cell expression likely prevented APOD mRNA assignment to MSAS. Complementary in situ hybridization (ISH) is recommended to confirm residences of mRNAs in MSAS. As both proteins and lipids are synthesized in MSAS, understanding myelination should not only include efforts to identify proteins synthesized in MSAS, but also the lipids.

1. Introduction

One strategy used to expedite the formation and maintenance of specialized structures in polarized cells is to locate protein (and lipid) syntheses near to where the structures form and are maintained [1]. This strategy requires the transport of specific mRNAs along with translation machinery (and lipid enzymes) to these sites [2,3,4]. Myelinating oligodendrocytes (MOs) synthesize a major compact myelin constituent, MBP, in processes overlying sites of compact myelin formation or MSAS, demonstrating availability of translational machinery.
Because of its prominent role in myelin compaction, MBP mRNA transport and local translation in oligodendrocyte processes have been the focus of numerous studies [5,6,7,8,9,10,11] and represent the gold standard for mRNAs enriched at the MSAS. However, little effort has been placed in identifying and characterizing other mRNAs transported to and translated in MSAS. To understand roles that locally synthesized proteins play in myelination, one must identify many of the mRNAs located and translated in MSAS. Complementing screening protocols, ISH could confirm mRNAs that co-localize with MBP mRNA in MSAS. Published studies have used ISH to show that alternatively-spliced isoforms of myelin-associated oligodendrocytic basic protein (MOBP) [12], highly basic proteins that co-reside with MBP in the mammalian CNS myelin major dense line [13], alternatively-spliced isoforms of microtubule associated protein tau (MAPT) [14], carbonic anhydrase 2 (CAR2) [15], αB-crystallin (CRYAB) [16], and kinesin family member 1A (KIF1A) [17].
Based on screens and follow-up Northern blot analyses [18], we identified mRNAs encoding: dynein light intermediate chain 2 (DLIC2), peptidylarginine deiminase 2 (PADI2), SH3 domain containing GRB2 like 3/endophilin-A3 (SH3GL3), trafficking kinesin protein 2 (TRAK2, 63NA65*), tumor-promoter p53-inducible nuclear protein-2 (TRP53INP2, SH3-227*) and high molecular weight isoforms of ferritin heavy chain (FTH1). Based on co-purification with MBP mRNA in myelin vesicles, many other mRNAs are likely to be located in the MSAS as well [19,20]. However, protocols are needed to distinguish mRNAs that reside in MSAS from contaminants, residing in other intracellular locations.
To address this challenge, we used RT-qPCR (real-time-quantitative polymerase chain reaction) to determine enrichment levels of putative MSAS mRNAs identified in our screens (Table 1). LPAR1, TRP53INP2, TRAK2, TPPP and SH3GL3 mRNAs were enriched in myelin at levels approaching levels of MBP mRNA. In contrast, levels of GSN, APOD, MAPK8IP1 and KIF1A mRNA are enriched at lower levels that were similar to mRNAs located in oligodendrocyte somata. Levels of ENPP2 and NDRG1 mRNAs were not enriched in myelin and levels of PADI2 and DYNC1LI2 mRNAs were too low to determine enrichment. For those mRNAs expressed by other neural cells, enrichments will be lowered, hampering their recognition as MSAS residents. We examined several resources to determine which neural cell types express putative MSAS mRNAs, including a widely-cited mouse brain transcriptome, RNA seq database (MBRS, http://www.brainrnaseq.org, accessed on 30 March 2023), Allen Mouse Brain, AMBA (https://mouse.brain-map.org, accessed on 30 March 2023) and Mouse Spinal Cord, AMSCA (http://mousespinal.brain-map.org, accessed on 30 March 2023) Atlases, as well as non-quantitative single oligodendrocyte transcriptome, soRS (http://linnarssonlab.org/oligodendrocytes/, accessed on 30 March 2023) and single cell mouse cortex transcriptome, scRS (http://linnarssonlab.org/cortex/, accessed on 30 March 2023) databases.
In summary, these studies validate the use of myelin subfractions as starting material to identify mRNAs residing at locations where translation products surely will play important and unappreciated roles in CNS myelination. We discuss ways in which this approach could be improved and expanded (see Section 4), providing a template for future studies aimed at determining how local protein synthesis in MSAS participates in internodal myelination. We suggest that efforts to understand internodal myelination will benefit from efforts to characterize lipid synthesis occurring in MSAS.

2. Materials and Methods

2.1. Animals

CD rats 2-months old, both sexes (Charles River Breeding Laboratory, Wilmington, MA, USA), were used for all studies. Handling and killing of the rats followed protocols that received prior approval from the University of Illinois at Chicago’s Institute’s Animal Welfare Committee. Briefly, the animals were placed in containers containing dry ice and asphyxiated with CO2 vapors.

2.2. Subcellular Fractionation

The subcellular fractionation method was carried out as described in a previous publication [18]. Briefly, freshly dissected cerebral hemispheres were homogenized in 12.5 mL of ice-cold 0.85 M buffered (10 mm HEPES, pH 7.4 and 3 mM dithiothreitol) sucrose in a 15-mL Dounce Homogenizer. RNase inhibitor (30 u, Five Prime Three Prime, Boulder, CO, USA) was included to prevent RNase degradation. Following homogenization, the samples were centrifuged at 1000 rpm for 10 min to pellet nuclei and cell debris. The low-speed supernatants were removed and added to two 12 mL ultracentrifuge tubes. They were overlayered with a cushion of 6 mL of 0.32 M buffered sucrose and centrifuged in an SW28 swinging bucket rotor at 100,000× g for 3.5 h at 4 °C. Myelin vesicles accumulated at the 0.32 M/0.85 M sucrose were collected, dispersed in an equal volume of 10 mM MgCl2 and pelleted (12,500 rpm for 20 min. The pellets were also dispersed in 10 mM MgCl2. Suspended myelin (M) and pellet (P) fractions were used to prepare total RNA with TRI reagent (Molecular Research Center, Cincinnati, OH, USA) according to protocol from the manufacturer. The purity of the RNA was demonstrated by showing discreet 18S and 28S ribosomal RNA bands following gel electrophoresis.

2.3. RT-qPCR Analysis

Total RNAs (0.5 to 1 μg) from myelin and pellet subcellular fractions were used as template to prepare cDNAs. Reactions were performed with SuperScript III (Gibco BRL, Rockville, MD, USA) and oligo dT according to the manufacturer’s protocol. Semi-quantitative polymerase chain reaction q(PCR) was carried out in an iCycler Detection System (Bio-Rad) according to manufacturer’s instruction manual. Ninety-six well plates were used with a SuperMix PCR kit (Bio-Rad, Hercules, CA, USA). Routinely eight primer pairs, always including a GAPDH (300 nM forward and reverse primers, Table S1) control, and four samples (cell culture or subcellular fractionation RNA, run in triplicate) were used for each experiment. Amplification conditions were 95 °C for 5 min followed by 40 cycles at 94 °C, 60 °C and 72 °C each for 20 s, and a final extension at 72 °C for 7 min. Fluorescence emission was monitored and the threshold (CT) values recorded and averaged. At least three different samples were prepared from subcellular fraction and cell culture experiments.

2.4. Analysis of MBRS Data

Data were obtained online from an Excel spread (Tables S3 and S4) for each mRNA listed. We selected mRNAs that were specific for myelinating oligodendrocytes (MOs), newly formed oligodendrocytes (NFOs), oligodendrocyte progenitor cells (OPCs), neurons, astrocytes, microglia and ependymal cells, and then calculated percentages of total expressions by each neural cell type and some combinations as listed as well as NFO/OPC and MO/NFO ratios.

2.5. Analyses of Expression Patterns for mRNAs in AMBA and AMSCA Images

AMBA and AMSCA archive ISH images for the majority of genes/mRNAs in the mouse genome. Here, we use these databases to determine and compare expression patterns among MSAS mRNAs (Section 3.4). In order to make these comparisons, we used mRNAs that were specific for each neural cell type as identified using MBRS data (Tables S3 and S4), examining expression patterns in similar regions of sagittal sections from P56 mouse hippocampus, cerebellum and spinal cord and from P4 mouse spinal cord for each mRNA (Section 3.3). Anatomical regions are labeled in the uppermost rows for each tissue (ISH images). Images of representative mRNAs for each cell type were used to identify similarities and differences in cell-type specific expression patterns (Section 3.3). Positive expressions by myelinating oligodendrocytes (O+), newly-formed oligodendrocytes (O+), oligodendrocyte progenitor cells (O+), neurons (N+), astrocytes (A+), microglia (M+), ependymal cells (E+) and spinal cord meninges (M+) were labeled over regions showing mRNA expression. Regions lacking cell-type specific expression were similarly labeled (O−, O−, O−, N−, A−, M−, E− and M−) as were regions in which we could not decide whether expression did or did not occur (O±, O±, O±, N±, A±, M±, E± and M±). We included summaries showing the cell types that expressed the mRNAs in leftmost panels, with the top row recording expected cell expression and lower rows showing expression by additional cell types. These summary panels were boxed in colors identifying the cell types that expressed the mRNAs.
Although difficult to detect mRNA expression in MSAS, i.e., in white and gray matter areas around oligodendrocyte somata with the exception of highly-expressed MBP mRNA (Section 3.3), we felt it was worth examining expression more closely in high-magnification ISH images (Section 3.5). We contrasted MBP mRNA (MSAS) expression with CNP mRNA (somata) and with MOBP mRNA (some isoforms reside in MSAS) and then looked for MSAS expression of the MSAS mRNAs which we had showed located to MSAS (Section 3.1). Clearly, whereas MBP mRNA expression is easy to see in P56 mouse corpus callosum and fornix, cerebellar white matter and spinal cord, it is not possible to identify expression of any MSAS mRNAs in high-magnification images.

2.6. Statistical Analysis

Statistically significant enrichment of mRNAs in myelin vesicles (Section 3.1) was evaluated using a one sample t and Wilcoxon test in GraphPad Prism 9 for MacOS.

3. Results

The overall goal of this study is to identify and characterize mRNAs which, based on co-fractionation with MBP and MOBP mRNAs in myelin vesicles, reside in MSAS. Locating mRNAs to MSAS enables translations at sites where internodal myelin sheaths form and function, and where axon-oligodendrocyte signaling can influence translation.
Previously, we identified putative MSAS mRNAs using suppression subtractive hybridization (SSH) on mRNAs prepared from starting homogenates and from myelin isolated by subcellular fractionation of 2–3-month rat cerebral hemispheres. In these studies, we used Northern blot to show that PADI2, SH3GL3, TRAK2, TRP53INP2, KIF1A, DYNC1LI2 and high molecular weight isoforms of FTH1 mRNA reside in MSAS, based on enrichments in myelin fractions over starting material [17,18]. Here, we extend these findings using RT-qPCR to determine enrichments in myelin over a ‘non-myelin’ pellet subfraction.
Whereas known MSAS (MBP and MOBP) mRNAs are selectively expressed by differentiated oligodendrocytes (DOs) [42,43], other putative MSAS mRNAs may be expressed by other neural cell types. If so, methods which we use to identify MSAS mRNAs might be compromised. To find out which putative MSAS mRNAs are expressed by non-oligodendrocyte lineage cell-types, we determined cell-types expressing these mRNAs using a mouse brain transcriptome, RNA seq (MBRS) database (Section 3.2), and in Allen Mouse Brain Atlas (AMBA) and Mouse Spinal Cord Atlas (AMSCA) databases (Section 3.4). We also examined expressions using non-quantitative single cell transcriptome RNA seq (scRS) and single oligodendrocyte cell transcriptome RNA seq (soRS) databases.

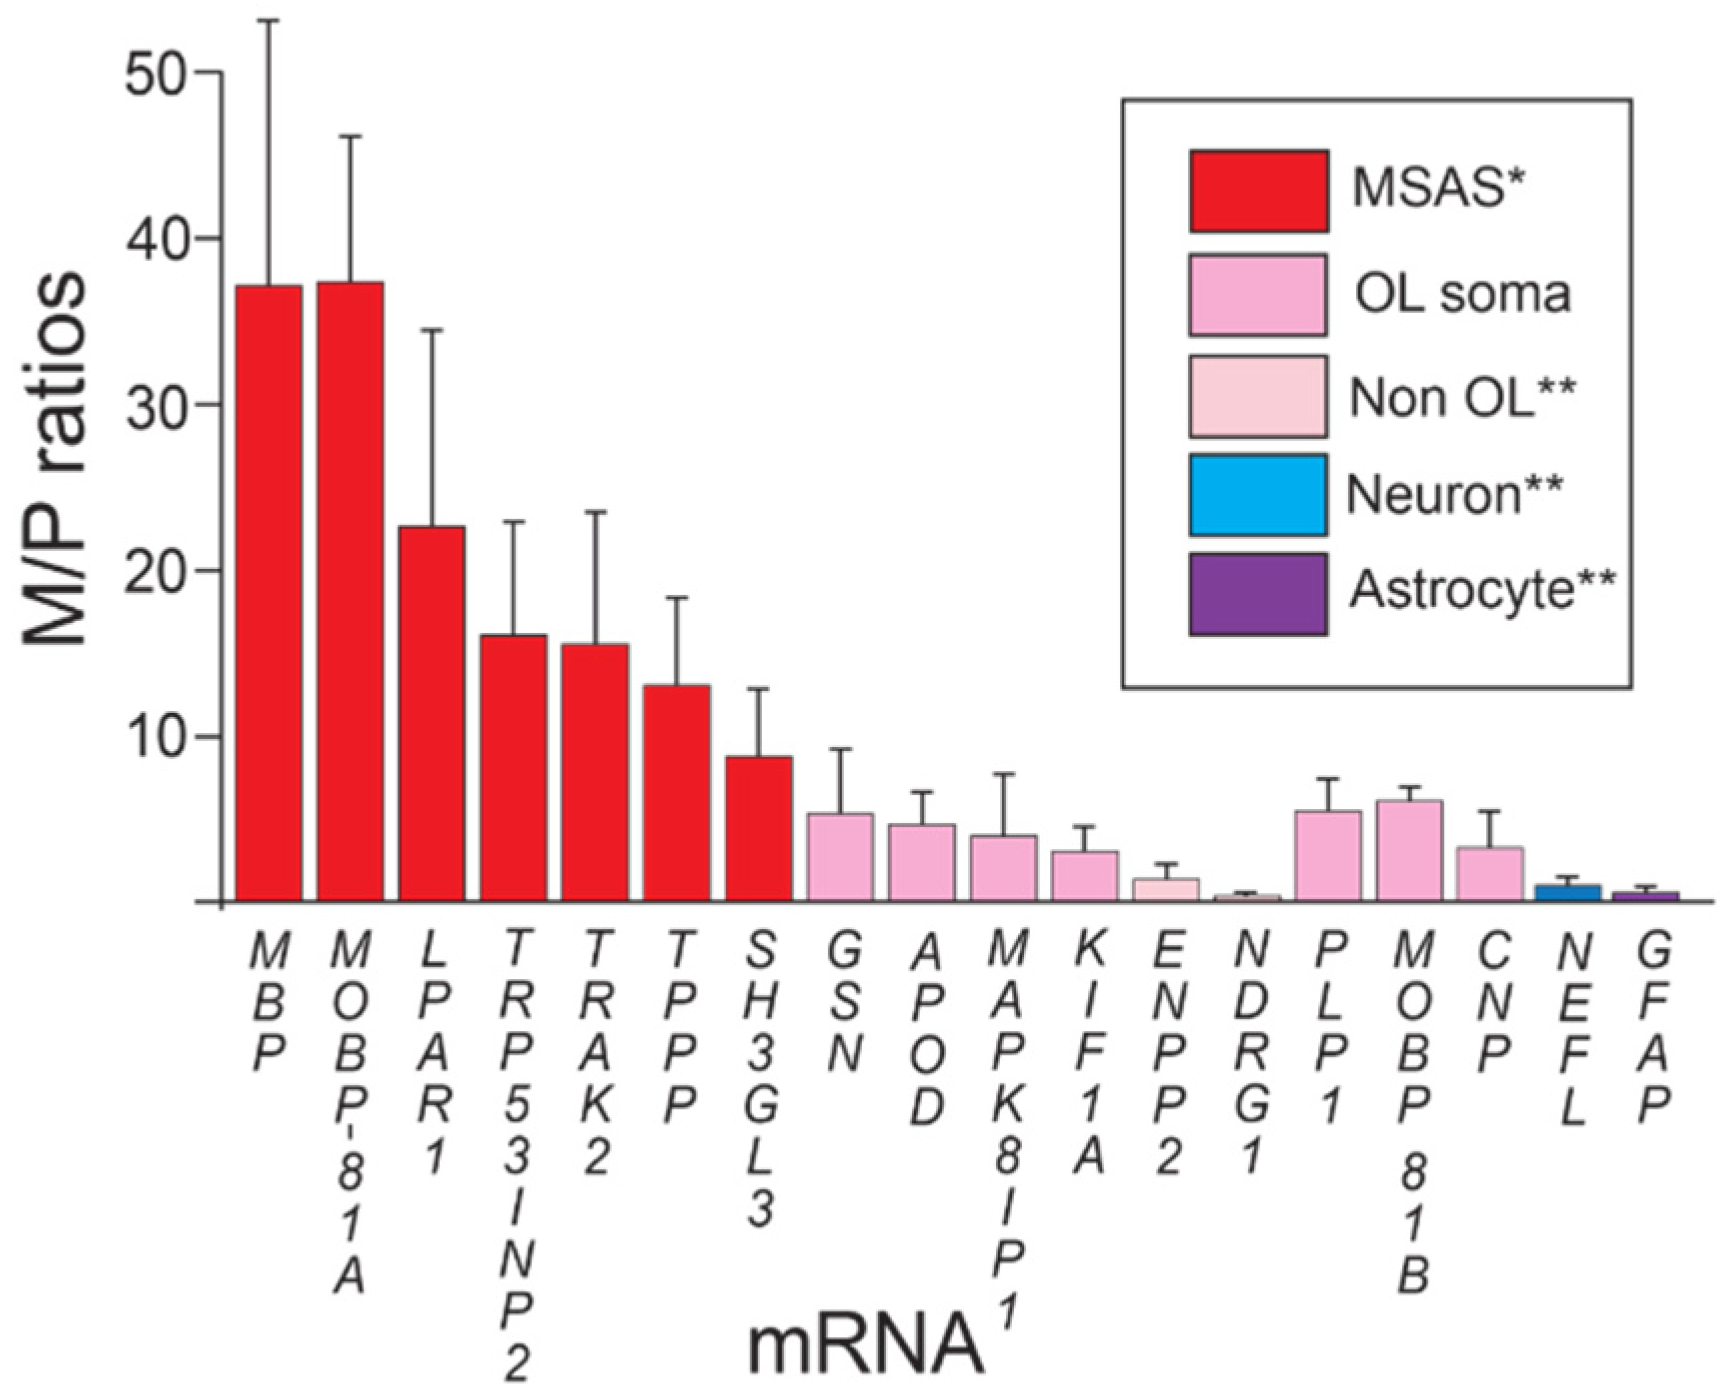
3.1. Enrichments of MSAS mRNAs in Rat Brain Myelin Based on RT-qPCR

As in previous studies [18,44], we used cerebral hemispheres from 2–3-month-old rats (both sexes) as starting material, and myelin and pellet subfractions from tissues homogenized in hypertonic (0.85 M) sucrose. We used this condition because enrichments of MBP and MOBP mRNAs in myelin over starting homogenate were slightly better than subfractions prepared from tissues homogenized in isosmotic sucrose [44,45]. Using mRNA specific primers (Table S1) for RT-qPCR, we measured abundances of mRNAs resident in MSAS, oligodendrocyte somata, neurons and astrocytes and compared our results with ones obtained in a study that used transcriptome, RNA seq to measure levels of mRNAs in P72 mouse brain myelin (Table 2).
We compare results from our SSH study with results from an mmRS study that identified mRNAs present in P72 mouse brain myelin [20]. Differences may arise from: (1) tissues, rat cerebral hemispheres (SSH) versus mouse brains (mmRS); (2) homogenization solutions (hypertonic (SSH) versus isosmotic (mmRS)); (3) analyses (SSH versus mmRS); and (4) post-myelin purification, where hypo-osmotic shock was used in the mmRS study. As results are in different units, µg/µL (SSH) and normalized read count (mmRS), data sets were normalized to MBP mRNA (%MBP, Table 2). To aid dataset comparisons we include SSH/mmRS ratios of %MBP mRNA.
In both studies, MBP mRNA was by far the most abundant mRNA in isolated myelin. MOBP and PLP1 mRNAs were more abundant, ~2.5% (SSH) and ~7% (mmRS) the levels of MBP mRNA, respectively, than other mRNAs. Although selectively expressed in oligodendrocyte somata [12,46], levels of CNP and MOBP-81B (SSH) mRNAs in myelin were not much greater than levels of neuronal (NEFL) and astrocyte (GFAP) mRNAs (>0.1% the level of MBP mRNA in myelin fractions of both SSH and mmRS), suggesting that mRNAs abundant in neurons, astrocytes and their processes in the vicinity of compact myelin are trapped in myelin during homogenization. In both studies, LPAR1 and NDRG1 mRNAs were more abundant (0.2–0.7% the level of MBP mRNA) than other MSAS mRNAs. These results indicate that differences in tissues and in protocols in the two studies have limited influence on the populations of mRNAs trapped in the myelin vesicles and purified by floatation on 0.85 M sucrose.
In previous studies, we used semi-quantitative Northern blots to show that some of the mRNAs identified in our screen were enriched in myelin (Table 1). Unfortunately, the mmRS study relied solely on abundance data and failed to include normalization. Here, we use RT-qPCR, normalizing myelin (M) RNA values to ‘non-myelin’ pellet (P) RNA values obtained in the same fractionations (M/P ratios, Figure 1). Unlike MBP and MOBP mRNAs, which are specifically expressed by differentiated oligodendrocytes, some mRNAs identified in our screens are expressed by other neural cells, i.e., neurons, astrocytes, microglia and/or ependymal cells. Consequently, mRNAs located in these cells will add to P (pellet)-values and, consequently, reduce enrichments (M/P).
Unlike abundance data (Table 2), M/P ratios distinguish MSAS-residing MBP and MOBP-81A mRNAs (37-fold enriched) from oligodendrocyte somata mRNAs (PLP1, MOBP-81B and CNP mRNAs, 5-fold enriched), and from neuron (NEFL, not enriched) and astrocyte (GFAP, not enriched) mRNAs (Figure 1).
Figure 1. Enrichments of mRNAs in myelin vesicles. * Statistically > oligodendrocyte somata mRNA (p > 0.01). ** Statistically <oligodendrocyte somata mRNA (p < 0.01). Enrichments (M/P ratios ± standard deviations) of mRNAs in myelin vesicles prepared by subcellular fractionation (Methods). Plots show mRNAs grouped according to enrichments: MSAS, oligodendrocyte somata, non-oligodendrocyte, neuron and astrocyte mRNAs.
Life 13 00945 g001
Using 5-fold enrichment levels of oligodendrocyte somata mRNA as baseline, we find that, like MBP and MOBP-81A mRNAs, LPAR1, TRP53INP2, TRAK2, TPPP and SH3GL3 mRNAs are significantly enriched in myelin over oligodendrocyte somata mRNAs, supporting their residences in MSAS (Figure 1). One reason why enrichments of these MSAS mRNAs are lower than MBP and MOBP-81A mRNAs might be because lower portions reside in MSAS, i.e., higher portions are retained in oligodendrocyte somata. Actually, as seen below, enrichments of TRP53INP2, TRAK2 and TPPP mRNAs are likely higher as they are not only expressed by oligodendrocytes, but also by neurons (Section 3.2 and Section 3.4). Expression by neurons [47,48], also Section 3.2 and Section 3.4, likely brings the enrichment value of KIF1A mRNA below the level demonstrating residence in MSAS (Figure 1). Similarly, because APOD mRNA is expressed by ependymal cells (Section 3.2 and Section 3.4), its enrichment may be lowered to levels below those needed to demonstrate residence in MSAS. Using ISH, we proved that KIF1A mRNA resides in MSAS [17].
Although myelinating oligodendrocytes express NDRG1 and ENPP2 mRNAs [23,29], and both mRNAs are trapped in myelin during tissue homogenization (Table 2), neither mRNA was enriched in myelin, not even to levels of oligodendrocyte somata mRNAs (Figure 1). As other neural cell-types do not express these mRNAs (Section 3.2 and Section 3.4), the only explanation we have for their lack of enrichment is that the hypertonicity of the homogenization solution used in this study selectively blocks entrapments of NDRG1 and ENPP2 mRNAs in myelin. Although we don’t have the data, we believe that these mRNAs were identified in screens of tissues homogenized in isosmotic sucrose.

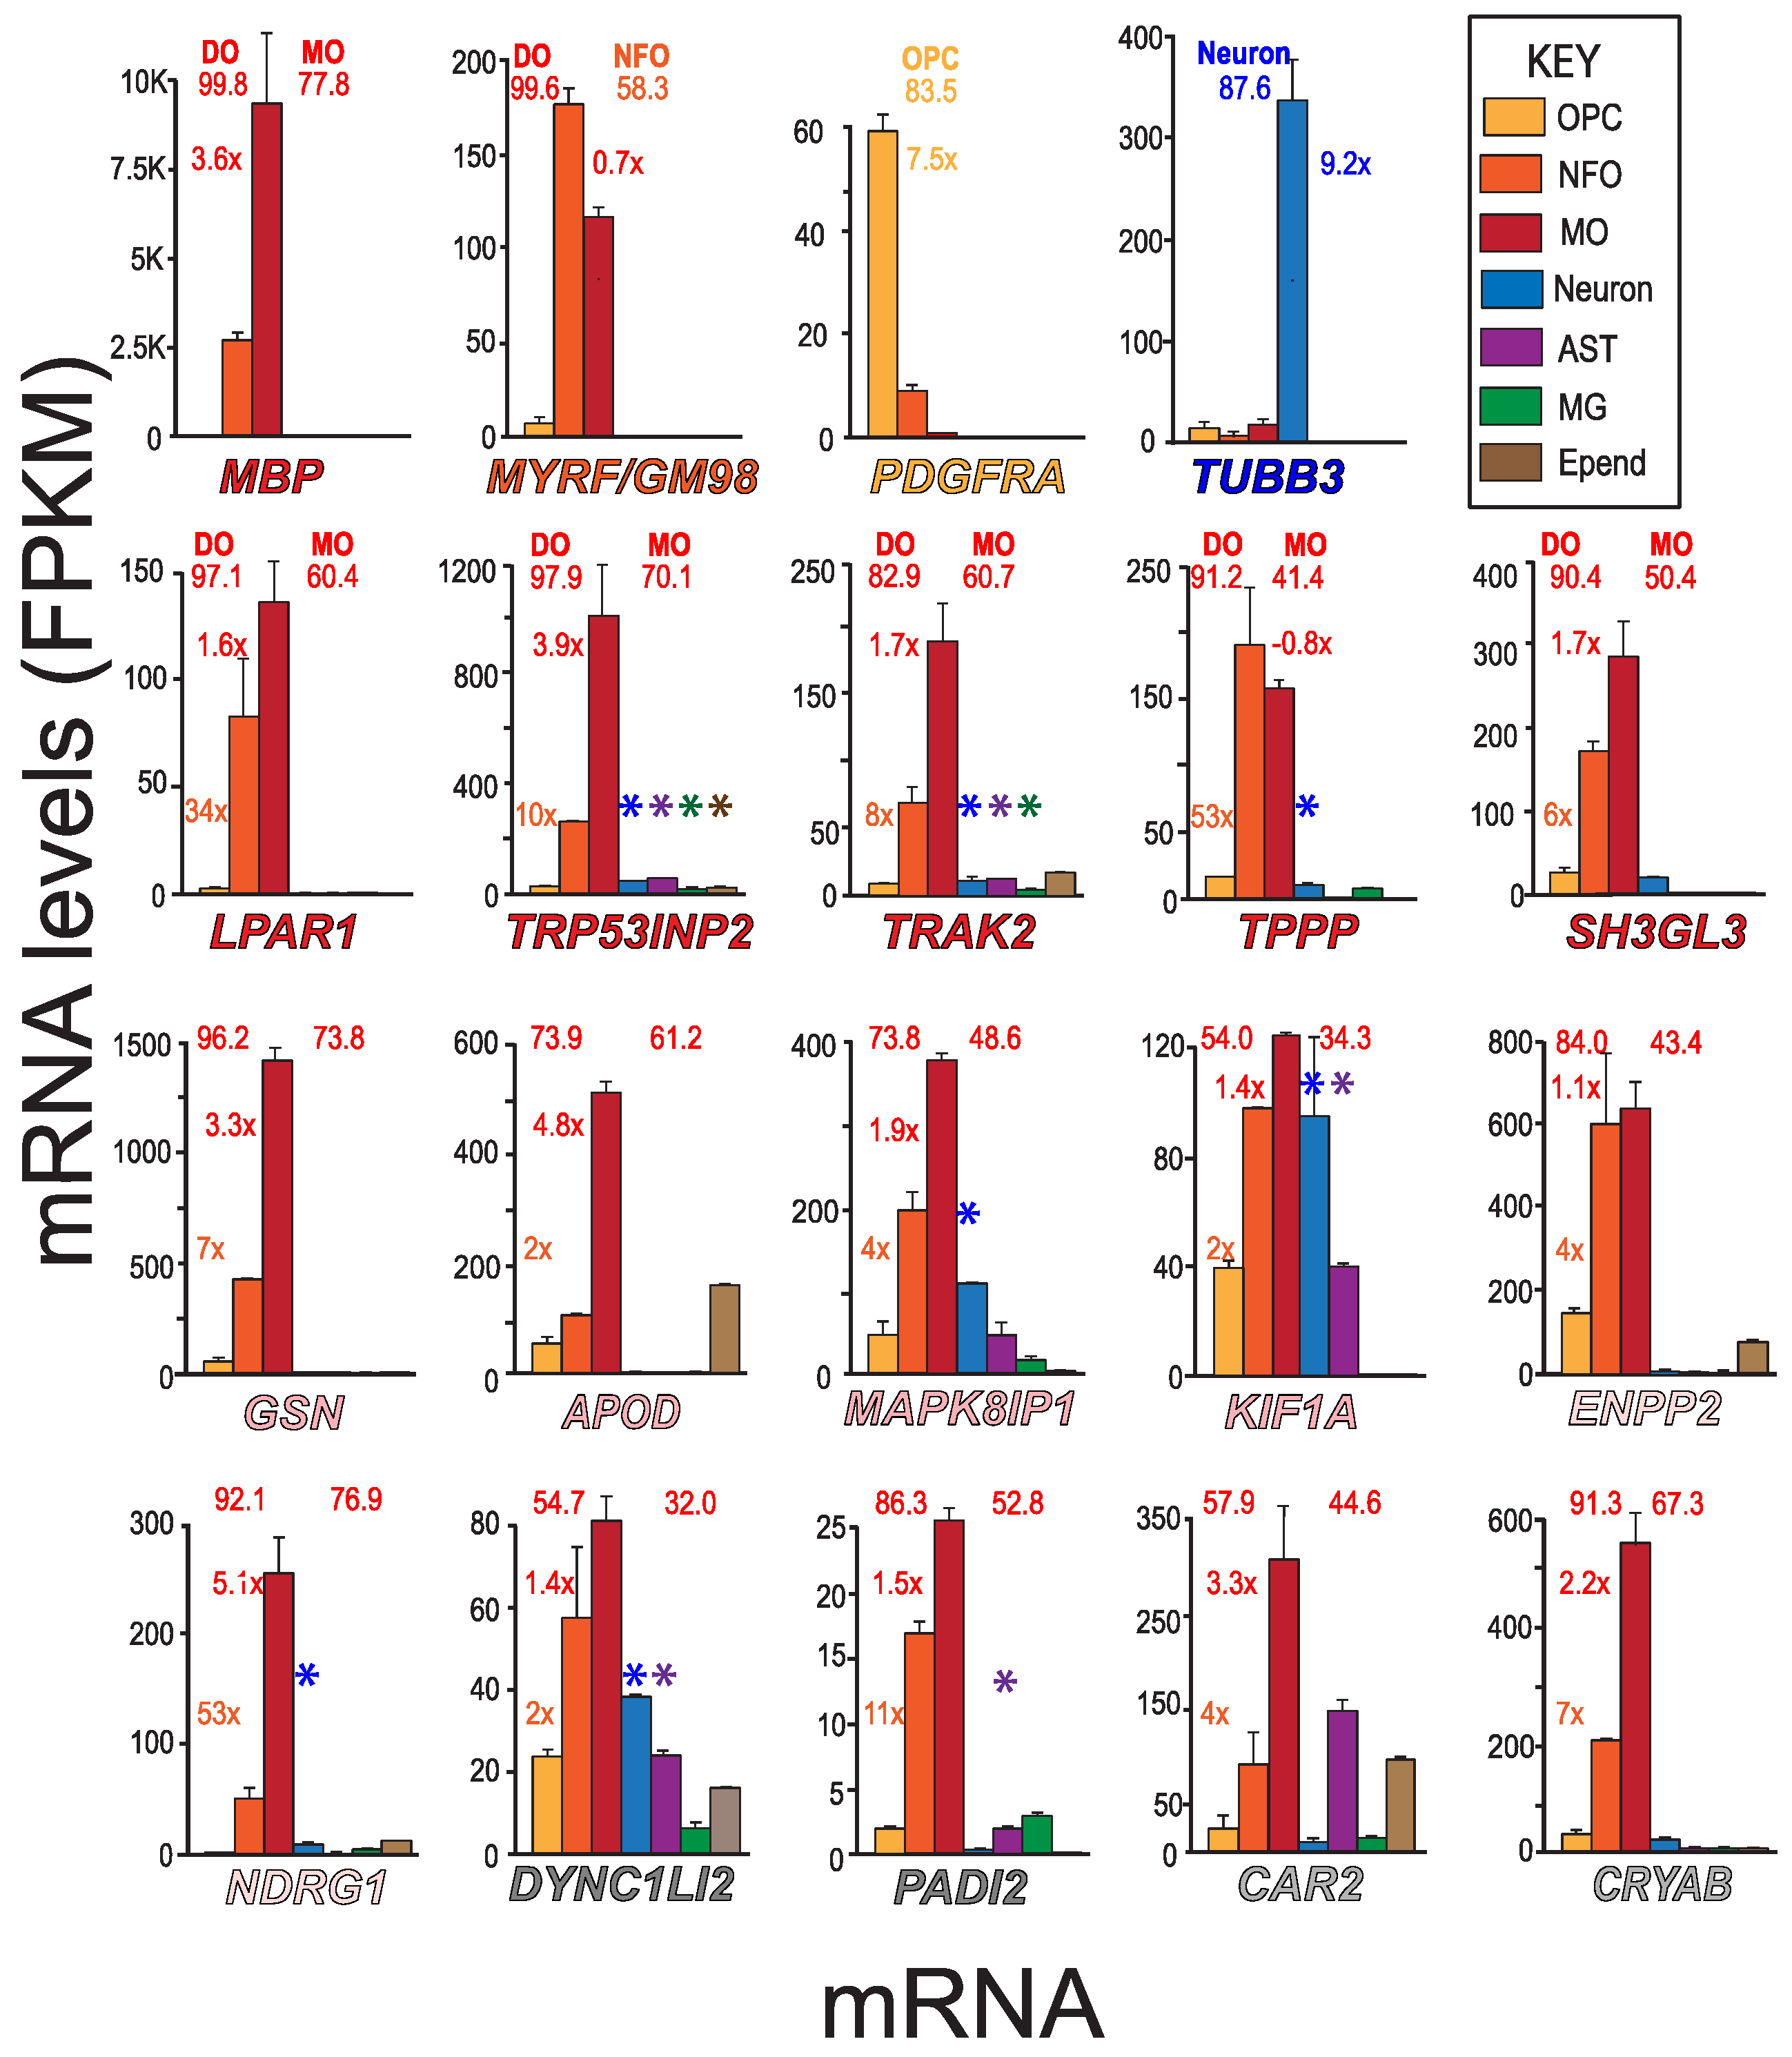
3.2. Identifying Neural Cell-Types Expressing MSAS mRNAs Using MBRS Data

To determine the cell-types that express putative MSAS mRNAs (Table 1), we used MBRS data [49], as this resource contains quantitative expression data for mRNAs of seven neural cell-types acutely isolated from developing mouse brain (Figure 2). We include mRNAs expressed by MOs (MBP), NFOs (MYRF/GM98), OPCs (PDGFRA) and neurons (TUBB3) mRNAs for comparison (Figure 2), mRNAs also used in assessing expression patterns in AMBA and AMSCA images (Figure 3). MBRS data verify expressions as revealed through differences in MO/NFO ratios for MBP mRNA (3.6×) and MYRF mRNA (0.7×), through OPC/NFO ratios for PDGFRA mRNA (7.5×) and through neuron/(OPC + NFO + MO) ratios for TUBB3 mRNA (9.2×), results verified with scRS data [50].
We comment that expression levels of MBP mRNA and other MSAS mRNAs obtained in MBRS data are from acutely isolated oligodendrocyte somata lacking the processes where MBP mRNA and other MSAS mRNAs reside, i.e., values are likely underestimates. Nevertheless, NFOs and MOs highly and somewhat selectively express MBP and MSAS mRNAs (Figure 2). Expression levels in MOs vary more than 60-fold, from GSN mRNA at ~1500 Fragments per Kilobase of transcript per Million mapped reads (FPKM) to PADI2 mRNA at 25 FPKM. The MSAS mRNAs with lowest expressions, DYNC1LI2 and PADI2 mRNAs, are the ones present at too low abundances to quantify by RT-qPCR (Section 3.1).
From MBRS data, differentiated oligodendrocytes selectively express mRNAs (LPAR1, TRP53INP2, TRAK2, TPPP and SH3GL3 mRNAs, >82% of total, Figure 2) present in MSAS (Figure 1) and others (GSN, ENPP2, NDRG1, PADI2 and CRYAB mRNAs, >84% of total, Figure 2). Neurons express MAPK8IP1, KIF1A and DYNC1LI2 mRNAs, astrocytes express KIF1A, DYNC1LI2 and CAR2 mRNAs and ependymal cells express APOD mRNA. ScRS data confirm neuronal expressions of MAPK8IP1, KIF1A, and DYNC1LI2 mRNAs as well as TRP53INP2, TRAK2, TPPP and NDRG1 mRNAs (*, Figure 2), findings indicating enrichments of these mRNAs are lowered by neuron contributions. Neuronal expressions were confirmed in AMBA and AMSCA images (Section 3.4). ScRS data also identified expression of PADI2 mRNA by astrocytes, though not expressions of KIF1A, DYNC1LI2 and CAR2 mRNAs by astrocytes, nor expression of APOD mRNA by ependymal cells, indicating it is best to examine as many resources as possible.
As illustrated from MO/NFO ratios, expressions of TPPP, ENPP2, KIF1A, DYNC1LI2, PADI2, LPAR1, TRAK2 and SH3GL3 mRNAs (0.8–1.7) occur earlier than expressions of TRP53INP2, GSN, APOD, CAR2, CRYAB and NDRG1 mRNAs (1.9–4.8). These differences indicate that the different mRNAs participate in different stages of myelination and support a need to identify MSAS mRNAs from tissues at relatively early stages of myelination (Section 4.1).
Expression levels in NFO and MO somata from P7–P12 mouse brain used for MBRS may differ from levels in the myelinating oligodendrocyte processes from older (60–90-day) rat cerebral hemispheres used for the SSH screens and P18 and P72 mouse brains used for the mmRS study. As AMBA and AMSCA images are from P56 animals, they may better reflect expression from tissues used for SSH screens.
To correctly identify cells that express different MSAS mRNAs, we examined and compared expression patterns of mRNAs selectively expressed by different neural cell-types identified using AMBA and AMSCA data (next section).

3.3. Recognizing Similarities and Differences among Neural Cell-Type Specific mRNA Expression Patterns in AMBA and AMSCA Images

To understand cell types expressing MSAS mRNAs using AMBA and AMSCA images we examined expression patterns of several MO-, NFO-, OPC-, neuron-, astrocyte-, microglia- and ependymal cell-mRNAs (Table S2). The MO mRNAs selected (MBP, MOBP and MAL) were expressed at higher levels than mRNAs specific to other cell-types. They were expressed at 67–78% of total by MOs and >99% of total by oligodendrocyte lineage (OL) cells. NFO mRNAs selected (GPR17 and MYRF), were expressed at 58–64% of total by NFOs and >99% of total by OLs. OPC mRNAs (PDGFRA and CSPG4) were expressed at 76–83% of total by OPCs and >91% of total by OLs. Neuronal mRNAs (TUBB3 and STMN2) were expressed at 87–92% of total by neurons. Astrocyte mRNAs (AQP4 and ALDH1L1) were expressed at 86–92% of total by astrocytes. Microglia (C1QA) and ependymal cell (CLDN5) mRNAs were expressed at 96% of total by these cells.
Here, we examine ISH and corresponding experimental analysis (EA) images in sagittal sections of P56 mouse hippocampus and cerebellum (AMBA) and P56 and P4 spinal cord hemisections (AMSCA). Links to datasets are given in Table S3. In these tables, we show assignments of regions that express the mRNAs provided in AMSCA datasets.

3.3.1. Regions Occupied by Oligodendrocyte Lineage Cells—AMBA and AMSCA Data

We examined AMBA and AMSCA images as complements to MBRS data, as they provide expressions by cells in situ. We believe these resources are underutilized and by careful examination of expression patterns of mRNAs with known cell-type specificity (Figure 3), they provide a framework for identifying all the cell-types that express putative MSAS mRNAs (Section 3.4).
Figure 3. Expression patterns of mRNAs representing each neural cell-type—AMBA and AMSCA images. ISH and EA images of mRNAs representing each cell-type in sections of P56 mouse hippocampus and surrounding tissue, cerebellum and spinal cord and of P4 spinal cord. Regional assignments (AMSCA, Tables S3 and S4) are listed as superscripts following the gene name. Summaries show cell-types expression of mRNAs in leftmost panels, arranged from left-to-right (hippocampus, cerebellum, P56 and P4 spinal cord). Expected expression is in the uppermost row and additional cells expressing the mRNA are shown in the middle and lower rows. Leftmost figures are boxed with colors which identify the prominent cell-types that express the mRNA. Where astrocyte and ependymal cell mRNA expressions are clearest, cells in leftmost panels are boxed. In EA images throughout, expressions are marked as indicated in Materials and Methods (Section 2.4). Abbreviations: in ISH images of MBP mRNA: hippocampus—and surrounding corpus callosum (CC), fornix (FX), cortex (CTX), lateral geniculate complex (LGC), subiculum (SUB), stratum lacunosum moleculare (SLM), CA1, CA2, CA3, dentate gyrus (DG), lateral ventricle (LV); cerebellum—molecular layer (ML), Purkinje cell layer (PL), granule cell layer (GL), cerebellar white matter (CWM); P56 spinal cord—white (WM), gray (GM) matter; P4 spinal cord—dorsal column (DC), lateral (LF) and ventral (VF) funiculi, dorsal (DH), ventral (VH) horns. Scale bars listed for MBP mRNA are 200 μm.
Life 13 00945 g003
As OPCs, NFOs and MOs are three different stages of oligodendrocyte development, and we are using AMBA and AMSCA images to both link MSAS mRNAs to oligodendrocyte lineage cells and to other neural cells, understanding where the cells expressing cell-specific mRNAs locate in tissue greatly enhances our understanding of how the distributions of cells expressing MSAS mRNAs will influence enrichments. With AMSCA data from P4 spinal cord, they will also provide information as to when in development, they participate in myelination.
We examined distribution patterns of MBP, MOBP and MAL mRNAs to determine where MO mRNAs reside in and around the hippocampus, in the cerebellum and in spinal cord of P56 mouse and in spinal cord of P4 mouse. Protein products of all three mRNAs reside in compact myelin [51]. Based on MBRS data, all are specifically expressed by MOs (77.8%, 67.5% and 76.4%, respectively, of total and >99% of total as OL mRNAs, Table S2). All locate to white matter in AMSCA images (Figure 3, Table S3). All are widely expressed throughout mouse brain and spinal cord (Figure 3). Compared with relatively low expressions in the hippocampus per se, these mRNAs are highly expressed by MOs concentrated in the corpus callosum and fornix (O+, Figure 3) and spread throughout the cortex and lateral geniculate complex. Expression by a few oligodendrocytes in the hippocampus is readily distinguishable from expressions of TUBB3 and MAP2 mRNAs by neurons located in CA1–3 and dentate gyrus (N+, Figure 3). In cerebellum, MBP, MOBP and MAL mRNA-expressing MOs concentrate in white matter (O+, Figure 3) and spread into the granule cell layer. Neurons in molecular, granule and Purkinje cell layers do not express these mRNAs (N−, Figure 3). In P56 spinal cord, MO mRNA-expressing cells disperse throughout white and gray matter (O+, Figure 3). Only MBP mRNA shows higher white matter expression, which likely relates to expression in MSAS (see below). Neurons, in gray matter, including large-profile motoneurons in the ventral horn, do not express these mRNAs (N−, Figure 3). Summaries (leftmost panels) shows that MO mRNA-expressing cells reside in P56 corpus callosum and fornix, and in cerebellar white matter and spinal cord white and gray matter (Life 13 00945 i001
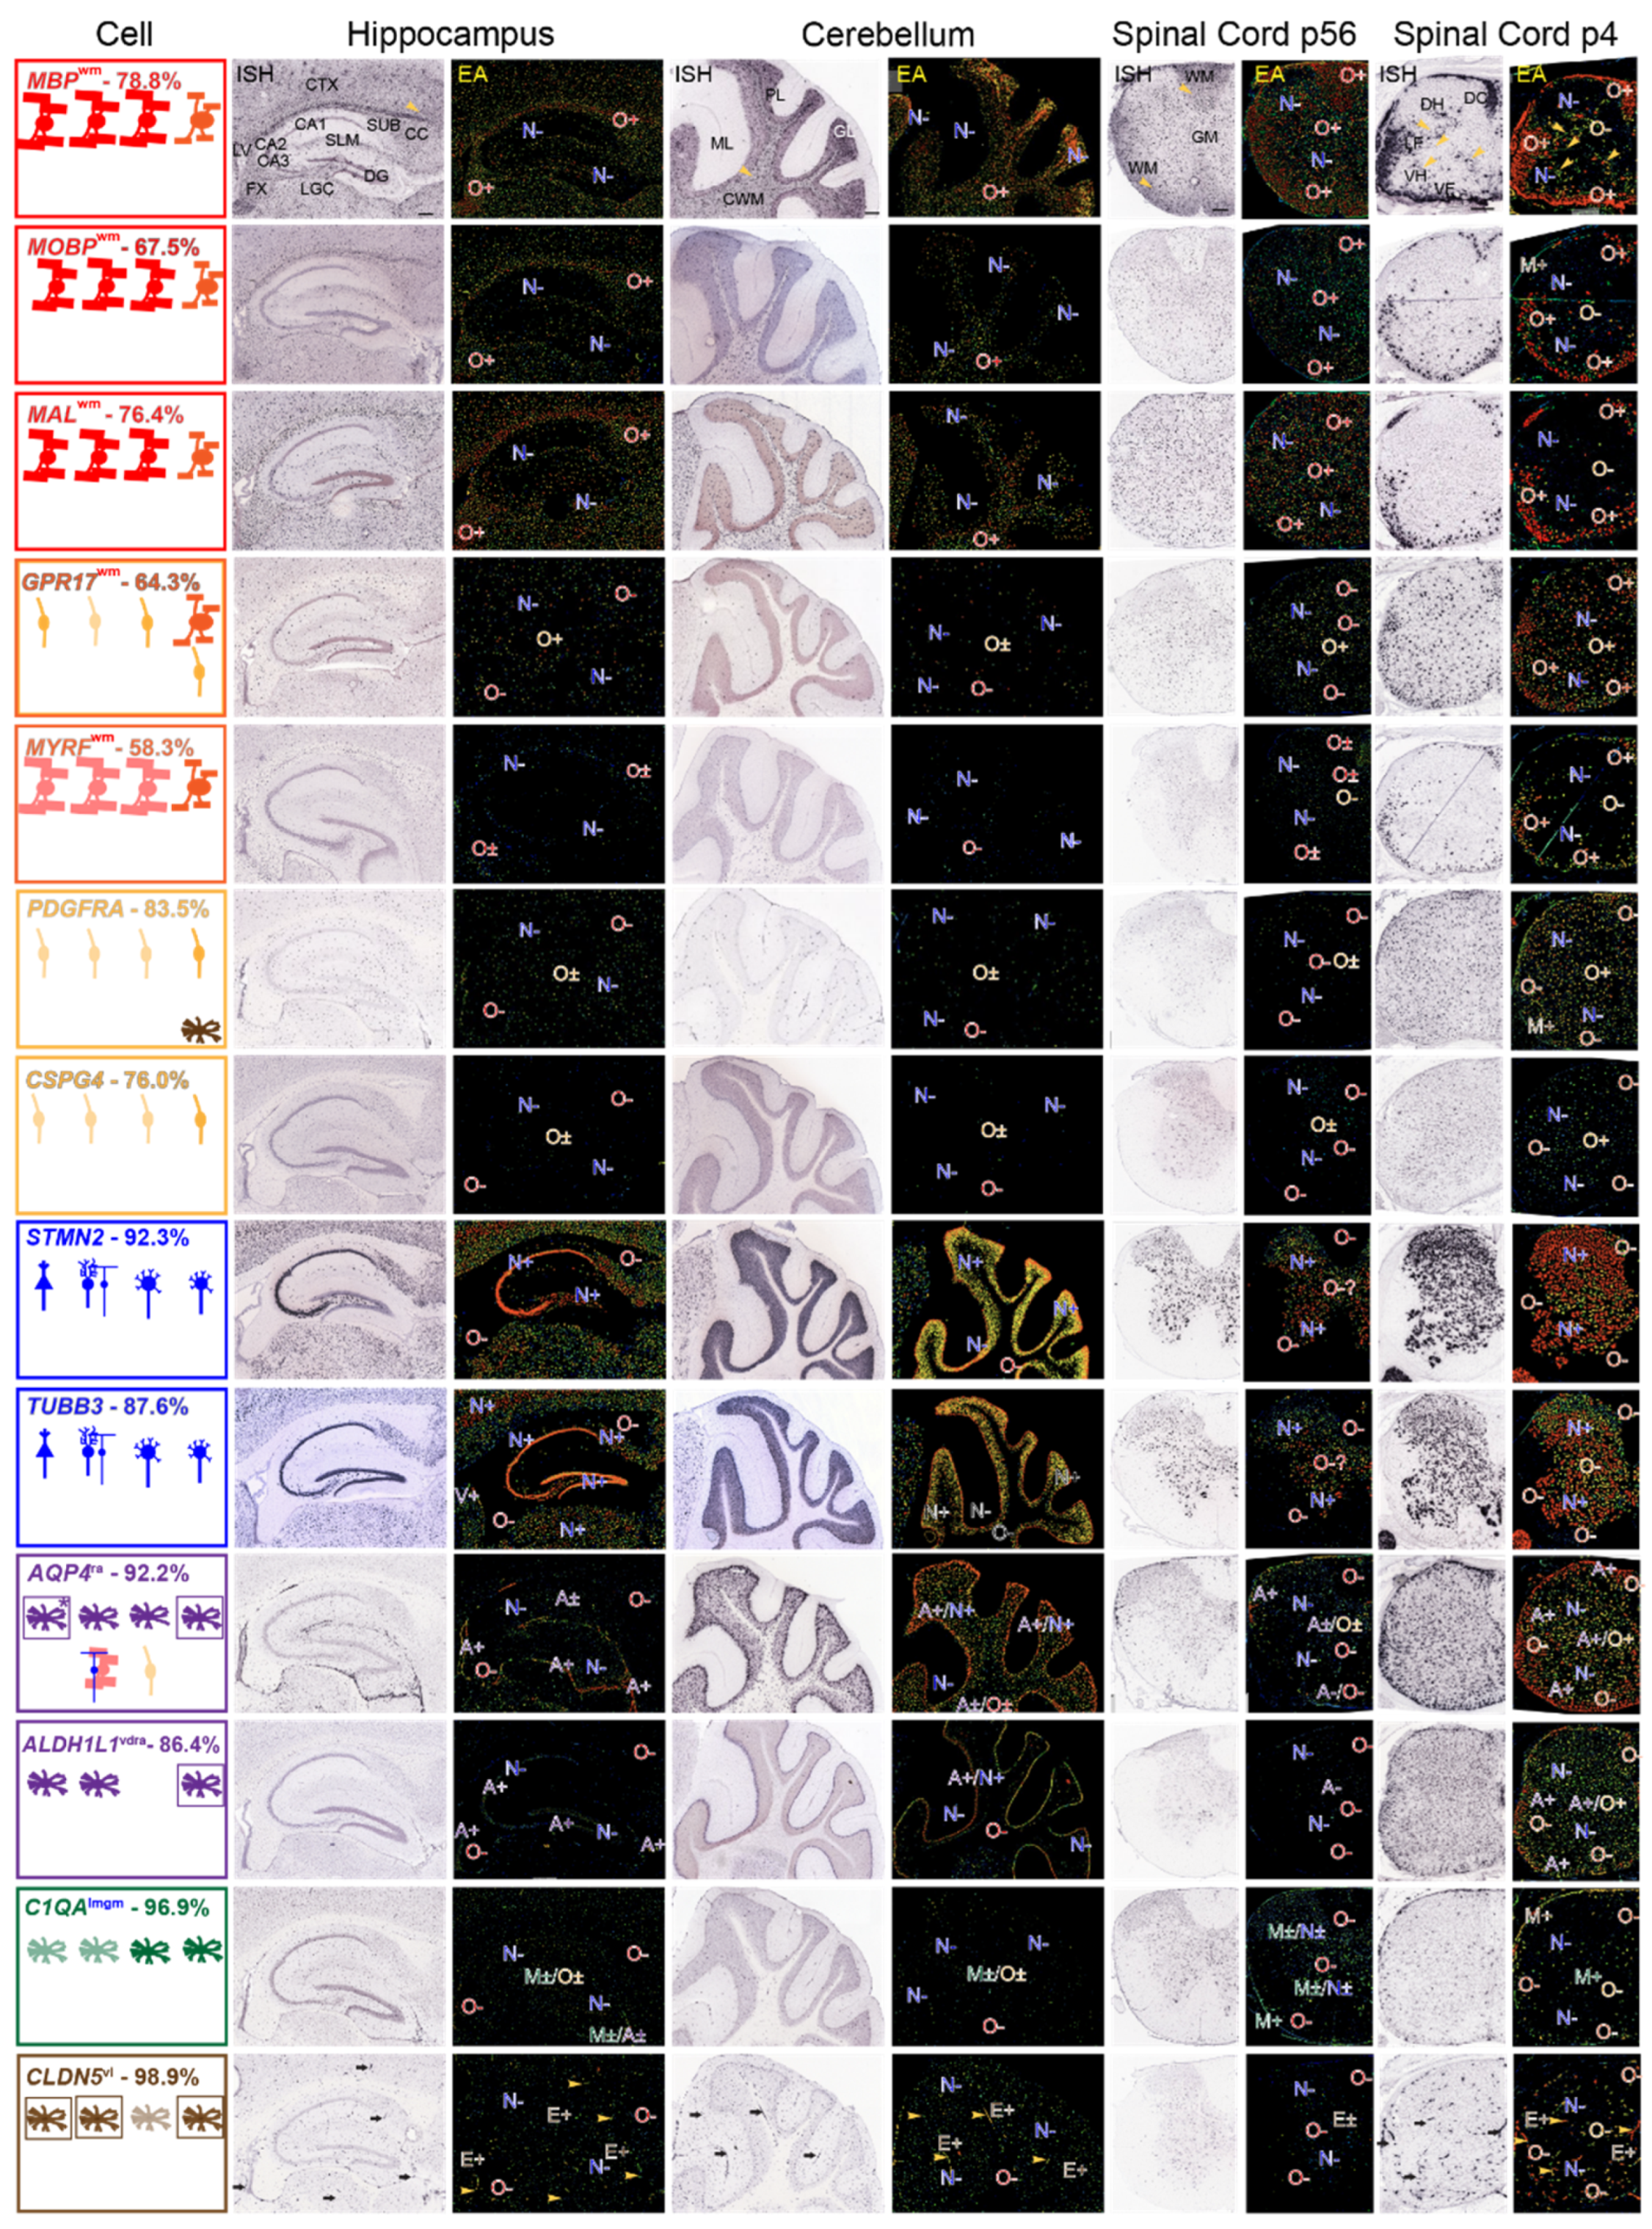
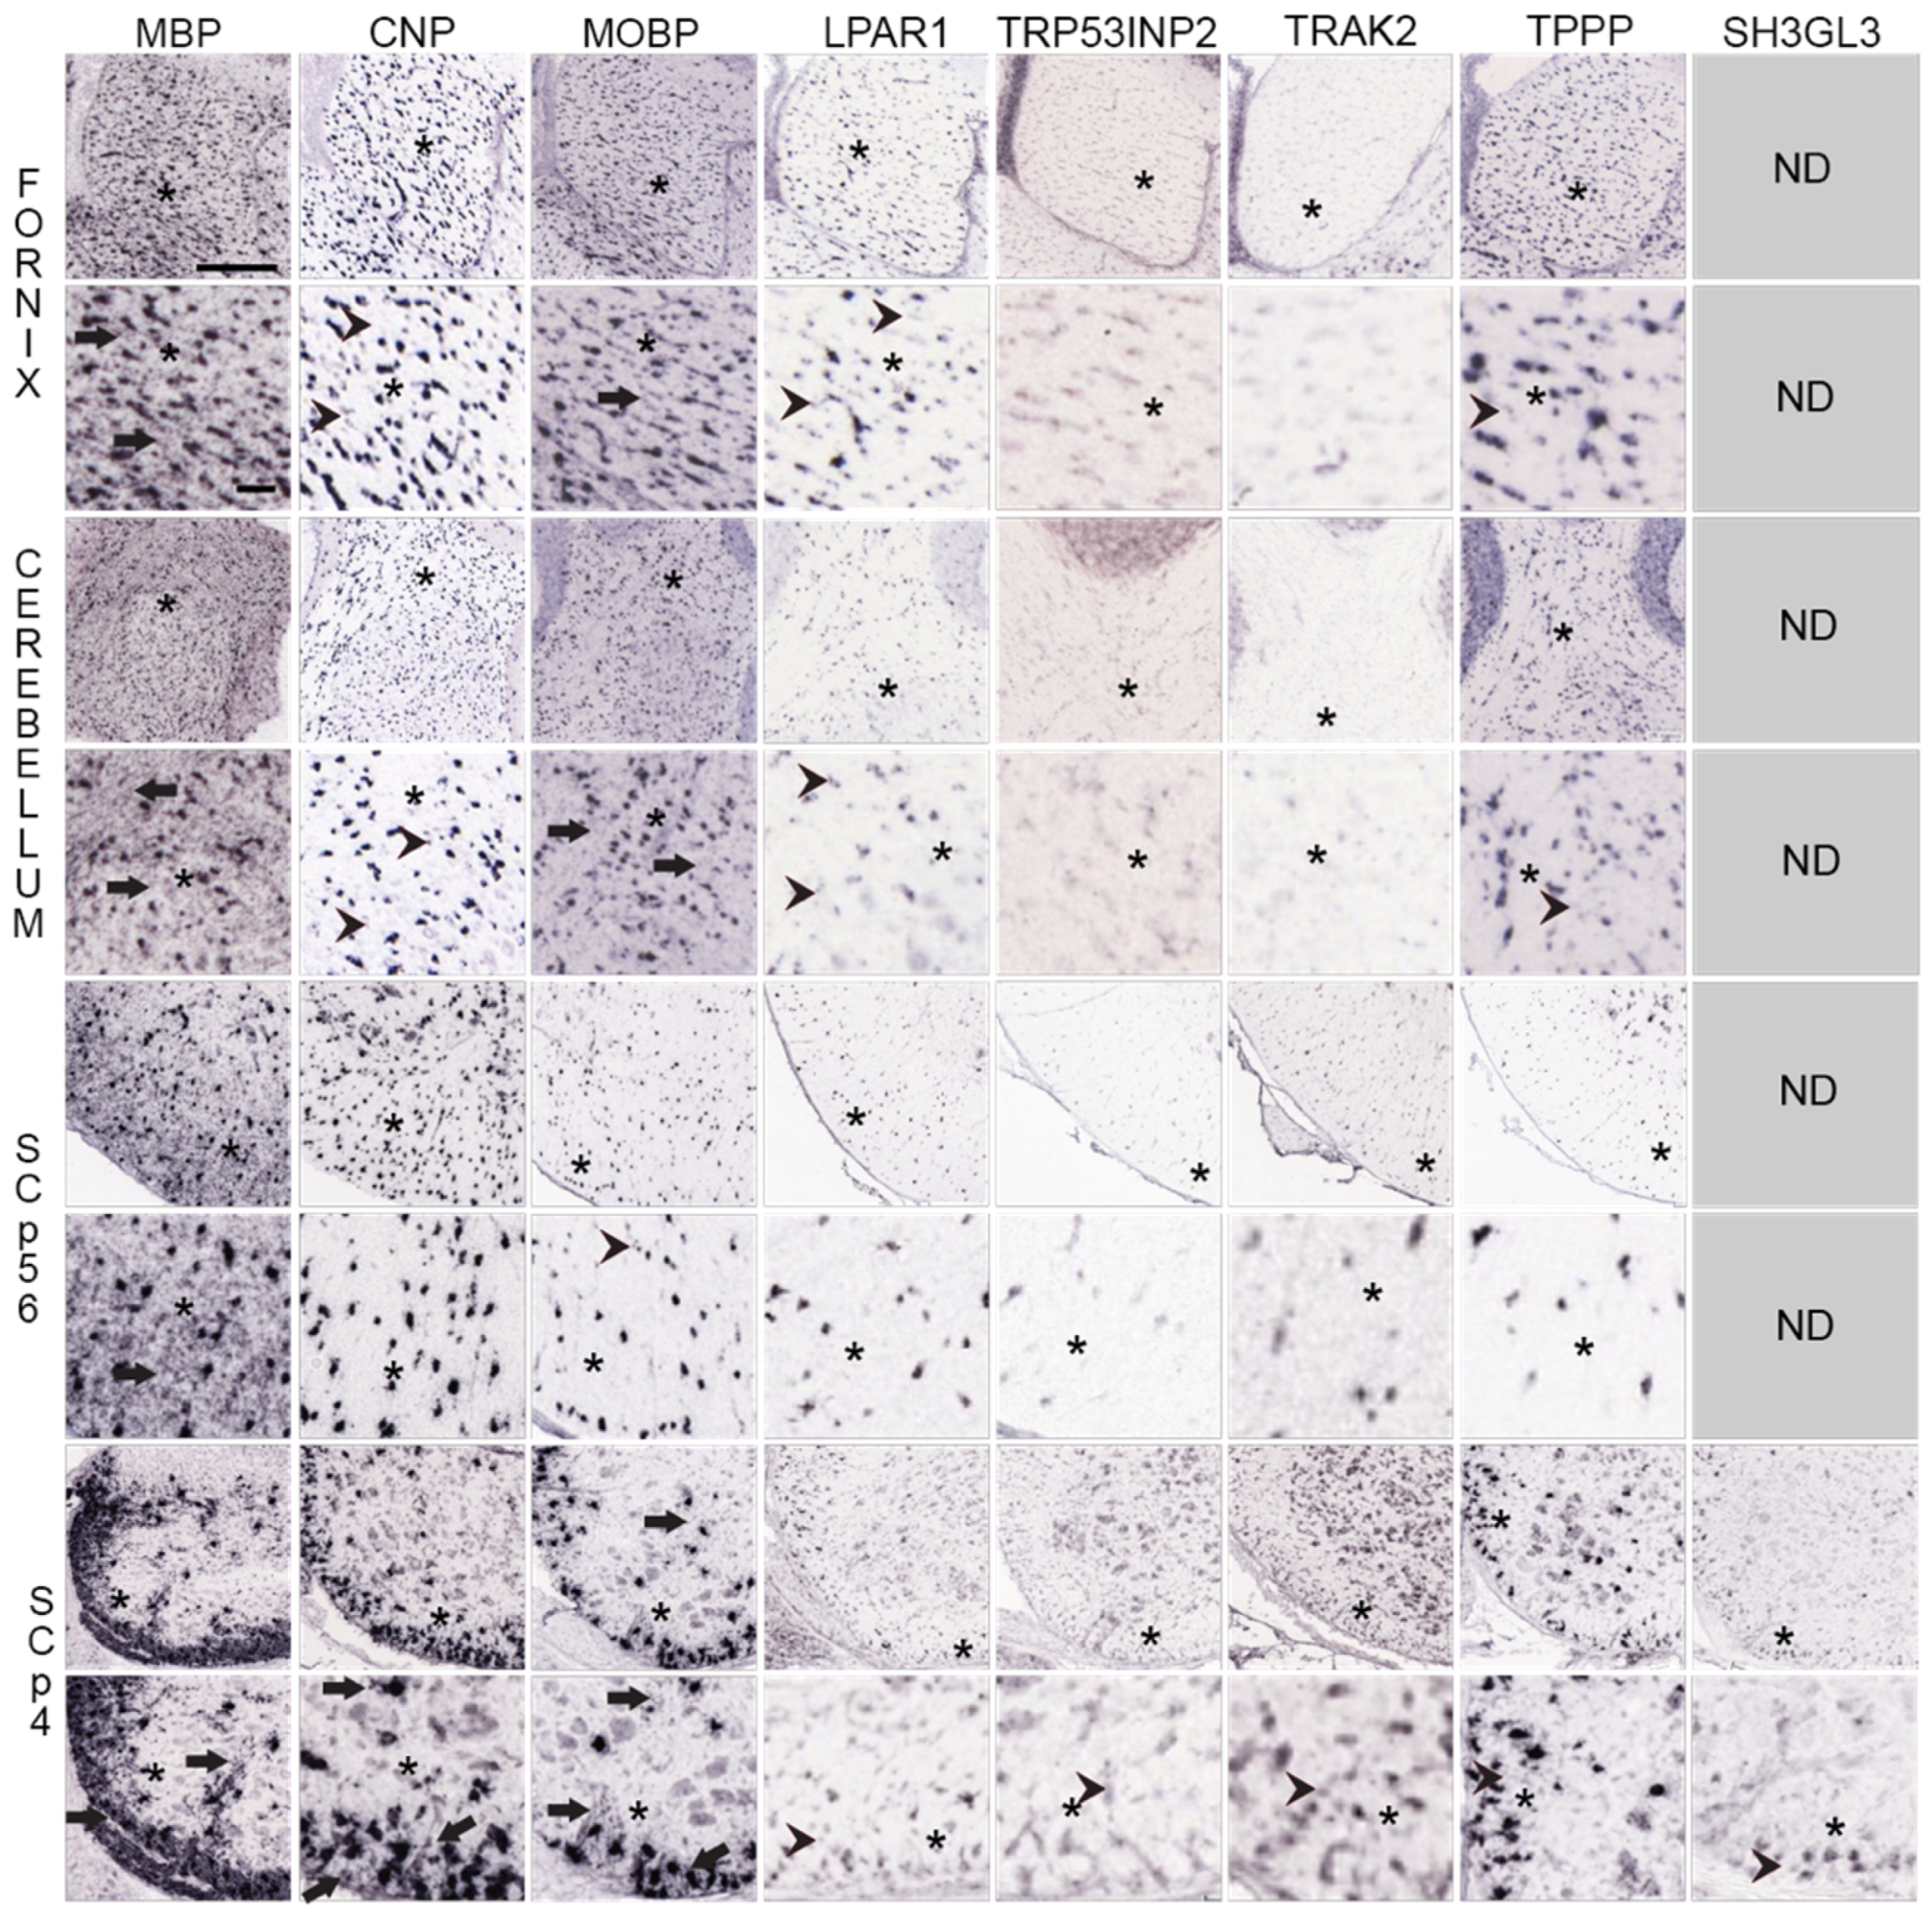
, Figure 3). In P4 spinal cord, MO mRNA-expressing NFOs are largely restricted to white-matter-rich ventral and lateral funiculi and dorsal columns (O+, Figure 3), as depicted in the leftmost panels (Life 13 00945 i002, Figure 3). Neither OPCs nor neurons in P4 spinal cord gray matter express these mRNAs, (N−, O−, Figure 3), as evidenced by comparisons with expression patterns of OPC and neuronal mRNAs (see below). For MBP, though not for MOBP or MAL, mRNAs, surrounding the few gray matter MO somata (red spots depicting high expression in the cells, EA images, Figure 3) are oligodendrocyte-processes/MSAS expressing MBP mRNA (green and yellow strands, EA images, arrowheads, Figure 3).
We chose GPR17 and MYRF mRNAs, both selectively expressed by NFOs (64.3% and 58.3% of total, respectively and showing MO/NFO ratios < 0.7), to determine regions where NFOs reside. Considering early GPR17 mRNA expression by OPCs (30.5% of total, Table S2) and persistent MYRF mRNA expression by MOs (38.7% of total, Table S2) allows one to see overlaps with OPCs and MOs. Both show the same white matter specificity in AMSCA (Figure 3, Table S3), i.e., NFOs in P4 white matter (ventral and lateral funiculi and dorsal columns) express high levels of both GPR17 and MYRF mRNAs (O+, Figure 3) as depicted in leftmost panel (Life 13 00945 i002). OPCs spread throughout P4 spinal cord gray matter express GPR17 mRNA (O−, Figure 3), whereas MOs in corpus callosum and fornix express MYRF mRNA (O+, Figure 3). Brain and spinal cord neurons express neither GPR17 nor MYRF mRNAs (N−, Figure 3).
We chose PDGFRA and CSPG4 mRNAs, well-established OPC markers [52,53], to determine where cells expressing OPC mRNA reside. Both are selectively expressed by OPCs in the MBRS database (83.5% and 76.0% of total, respectively, Table S2). Both PDGFRA and CSPG4 mRNAs are selectively expressed by OPCs spread throughout P4 spinal cord white and gray matter (O+, Figure 3, depicted in leftmost panels, Life 13 00945 i003) and by adult OPCs distributed at low density [54,55] throughout P56 brain and spinal cord (O±, Figure 3, in leftmost panels, Life 13 00945 i004). Neither MOs (O−, Figure 3), NFOs (O−, Figure 3) nor neurons (N−, Figure 3) express PDGFRA nor CSPG4 mRNAs.

3.3.2. Regions Occupied by Non-Oligodendrocyte Lineage Cells—AMBA and AMSCA Data

We chose STMN2 and TUBB3 mRNA to identify neuronal mRNA distributions. Both, well-characterized neuronal markers [56,57,58,59], are selectively expressed by neurons (91.9% and 86.4% of total expression, respectively, Table S2). AMBA and AMSCA images support selective neuronal expressions throughout brain and spinal cord (N+, Figure 3). In hippocampus, both mRNAs locate to neurons concentrated in CA1–3 and in the dentate gyrus (N+, Figure 3), denoted as pyramidal cells in leftmost panels (Life 13 00945 i005, Figure 3) and to neurons spread throughout the cortex, lateral geniculate complex and subiculum. In cerebellum, Purkinje (Life 13 00945 i006) and granule cell (Life 13 00945 i007) neurons express both STMN2 and TUBB3 mRNAs (N+, Figure 3), though neurons in the molecular layer do not (N−, Figure 3). In P56 and P4 spinal cord, neurons expressing STMN2 and TUBB3 mRNAs (N+, Figure 3) are distributed throughout gray matter, including in large profile ventral horn motoneurons (Life 13 00945 i008, Figure 3, leftmost panel). Importantly, neither STMN2 or TUBB3 mRNAs are expressed in P56 mouse brain and spinal cord white matter where MOs reside (O−, Figure 3), nor in P4 spinal cord white matter (O−, Figure 3) where NFOs reside, allowing clear distinctions between mRNAs expressed by MOs and NFOs, from mRNAs expressed by neurons.
To determine whether astrocytes, microglia and ependymal cells overlap oligodendrocytes and neurons, we examined distributions of well-characterized marker mRNAs. AQP4 [60] and ALDH1L1 [49] mRNAs were used to identify regions where astrocytes reside, while C1QA [61] and CLDN5 [62] mRNAs were used to identify regions where microglia and ependymal cells reside. AQP4 and ALDH1L1 mRNAs are selectively expressed by acutely isolated astrocytes (91.9 and 86.4% of total expression, respectively, Table S2). Both were assigned to a category “ra”, representing white matter and radially arrayed white matter (Figure 3, Table S3). Expression patterns of AQP4 and ALDH1L1 mRNAs are different from expression patterns of MO-, NFO-, OPC- and neuronal mRNAs (Figure 3). They were not expressed in MO-rich white (O−, Figure 3) nor in neuron-rich gray (N−, Figure 3) matter. Expression patterns are different for these astrocyte mRNAs, making it difficult to identify astrocyte-specific regions.
The most astrocyte-specific expression occurs in meninges surrounding the fornix, and in the meninges and outer portions of ventral and lateral funiculi in P4 spinal cord (A+, Figure 3). Both AQP4 and ALDH1L1 mRNAs are expressed by Bergmann glia in the Purkinje cell layer [63] (A+/N+, Figure 3).
CIQA mRNA, a well-characterized microglia marker [61,64] is selectively expressed by microglia in MBRS (96.9% of total expression, Table S3). Unlike other cell type-specific mRNAs, CIQA mRNA is poorly expressed in mouse brain and spinal cord (M-, Figure 3), and consequently expression by microglia is not expected to influence expressions by other cell-type-specific mRNAs. Additionally, it will be difficult to use AMBA and AMSCA images to assign expression to microglia.
CLDN5 mRNA, a well characterized ependymal cell marker [62,65], is selectively expressed by ependymal cells (98.9% of total, Table S3) and in regions assigned to vasculature (vl, Table S3). CLDN5 mRNA is characterized by distinct expression patterns in brain and spinal cord (E+, Figure 3). Fortunately, CLDN5 mRNA-expressing cells do not overlap with MOs (O−, Figure 3), NFOs (O−, Figure 3), OPCs (O−, Figure 3) or neurons (N−, Figure 3). CLDN5 mRNA-expressing ependymal cells form distinct cell clusters (arrowheads, Figure 3) that run along the vasculature and are more abundant in and around the hippocampus, in the cerebellar molecular layer, especially in P4 white and gray matter.

3.4. Regions in AMBA and AMSCA Images Where MSAS mRNAs Are Expressed

MOs and/or NFOs express all putative MSAS mRNAs (Figure 4). MOs in brain and spinal cord robustly express GSN, APOD, ENPP2, NDRG1, CAR2 and CRYAB mRNAs (O+, Figure 4) in accordance with ratings given in AMSCA (Figure 4, Table S4), and at lower intensity LPAR1, TPPP, MAPK8IP1, KIF1A and PADI2 mRNAs (O±, Figure 4). MOs do not express TRP53INP2, TRAK2, SH3GL3 or DYNC1LI2 mRNAs (O−, Figure 4) at detectable levels, suggesting they associate with active myelination. NFOs in P4 spinal cord robustly express TRAK2, TPPP, GSN, MAPK18P1, KIF1A and DYNC1LI2 mRNAs (O+, Figure 4) and less intensely, LPAR1, TRP53INP2, SH3GL3, APOD and CAR2 mRNAs (O±, Figure 4). NFOs do not express NDRG1 and CRYAB mRNAs (O−, Figure 4), suggesting expressions associate with oligodendrocyte maturation. These temporal patterns are generally similar to expression patterns found with MBRS data (Figure 2). In particular, both datasets show that TPPP, SH3GL3 and DYNC1LI2 mRNAs are expressed early and that NDRG1 and CRYAB mRNAs are expressed late.
AMBA and AMSCA images highlight high neuronal expressions of TRP53INP2, TRAK2, TPPP, MAPK8IP1, KIF1A and DYNC1LI2 mRNAs. It seems reasonable that prominent neuronal expressions of these mRNAs reduce the likelihood of identifying them as residing in MSAS. Nevertheless, TRP53INP2, TRAK2 and TPPP mRNAs locate to MSAS by enrichments (Figure 1), indicating levels in MSAS are even higher than indicated by enrichments.
MOs and NFOs selectively express LPAR1 and SH3GL3 mRNAs, with the latter in P4 spinal cord only (O+, O+, Figure 4). Among other MSAS mRNAs, ependymal cells express APOD mRNA (Figure 4, E+), and astrocytes express CAR2 and CRYAB mRNAs (A+, Figure 4). High ependymal cell expression of APOD mRNA may have masked its residence in MSAS.
In summary, AMBA and AMSCA images complement and extend MBRS, scRS and soRS transcriptome data in providing temporal information as to when MSAS mRNAs are expressed, as well as identifying ones expressed by neurons, astrocytes and/or ependymal cells.

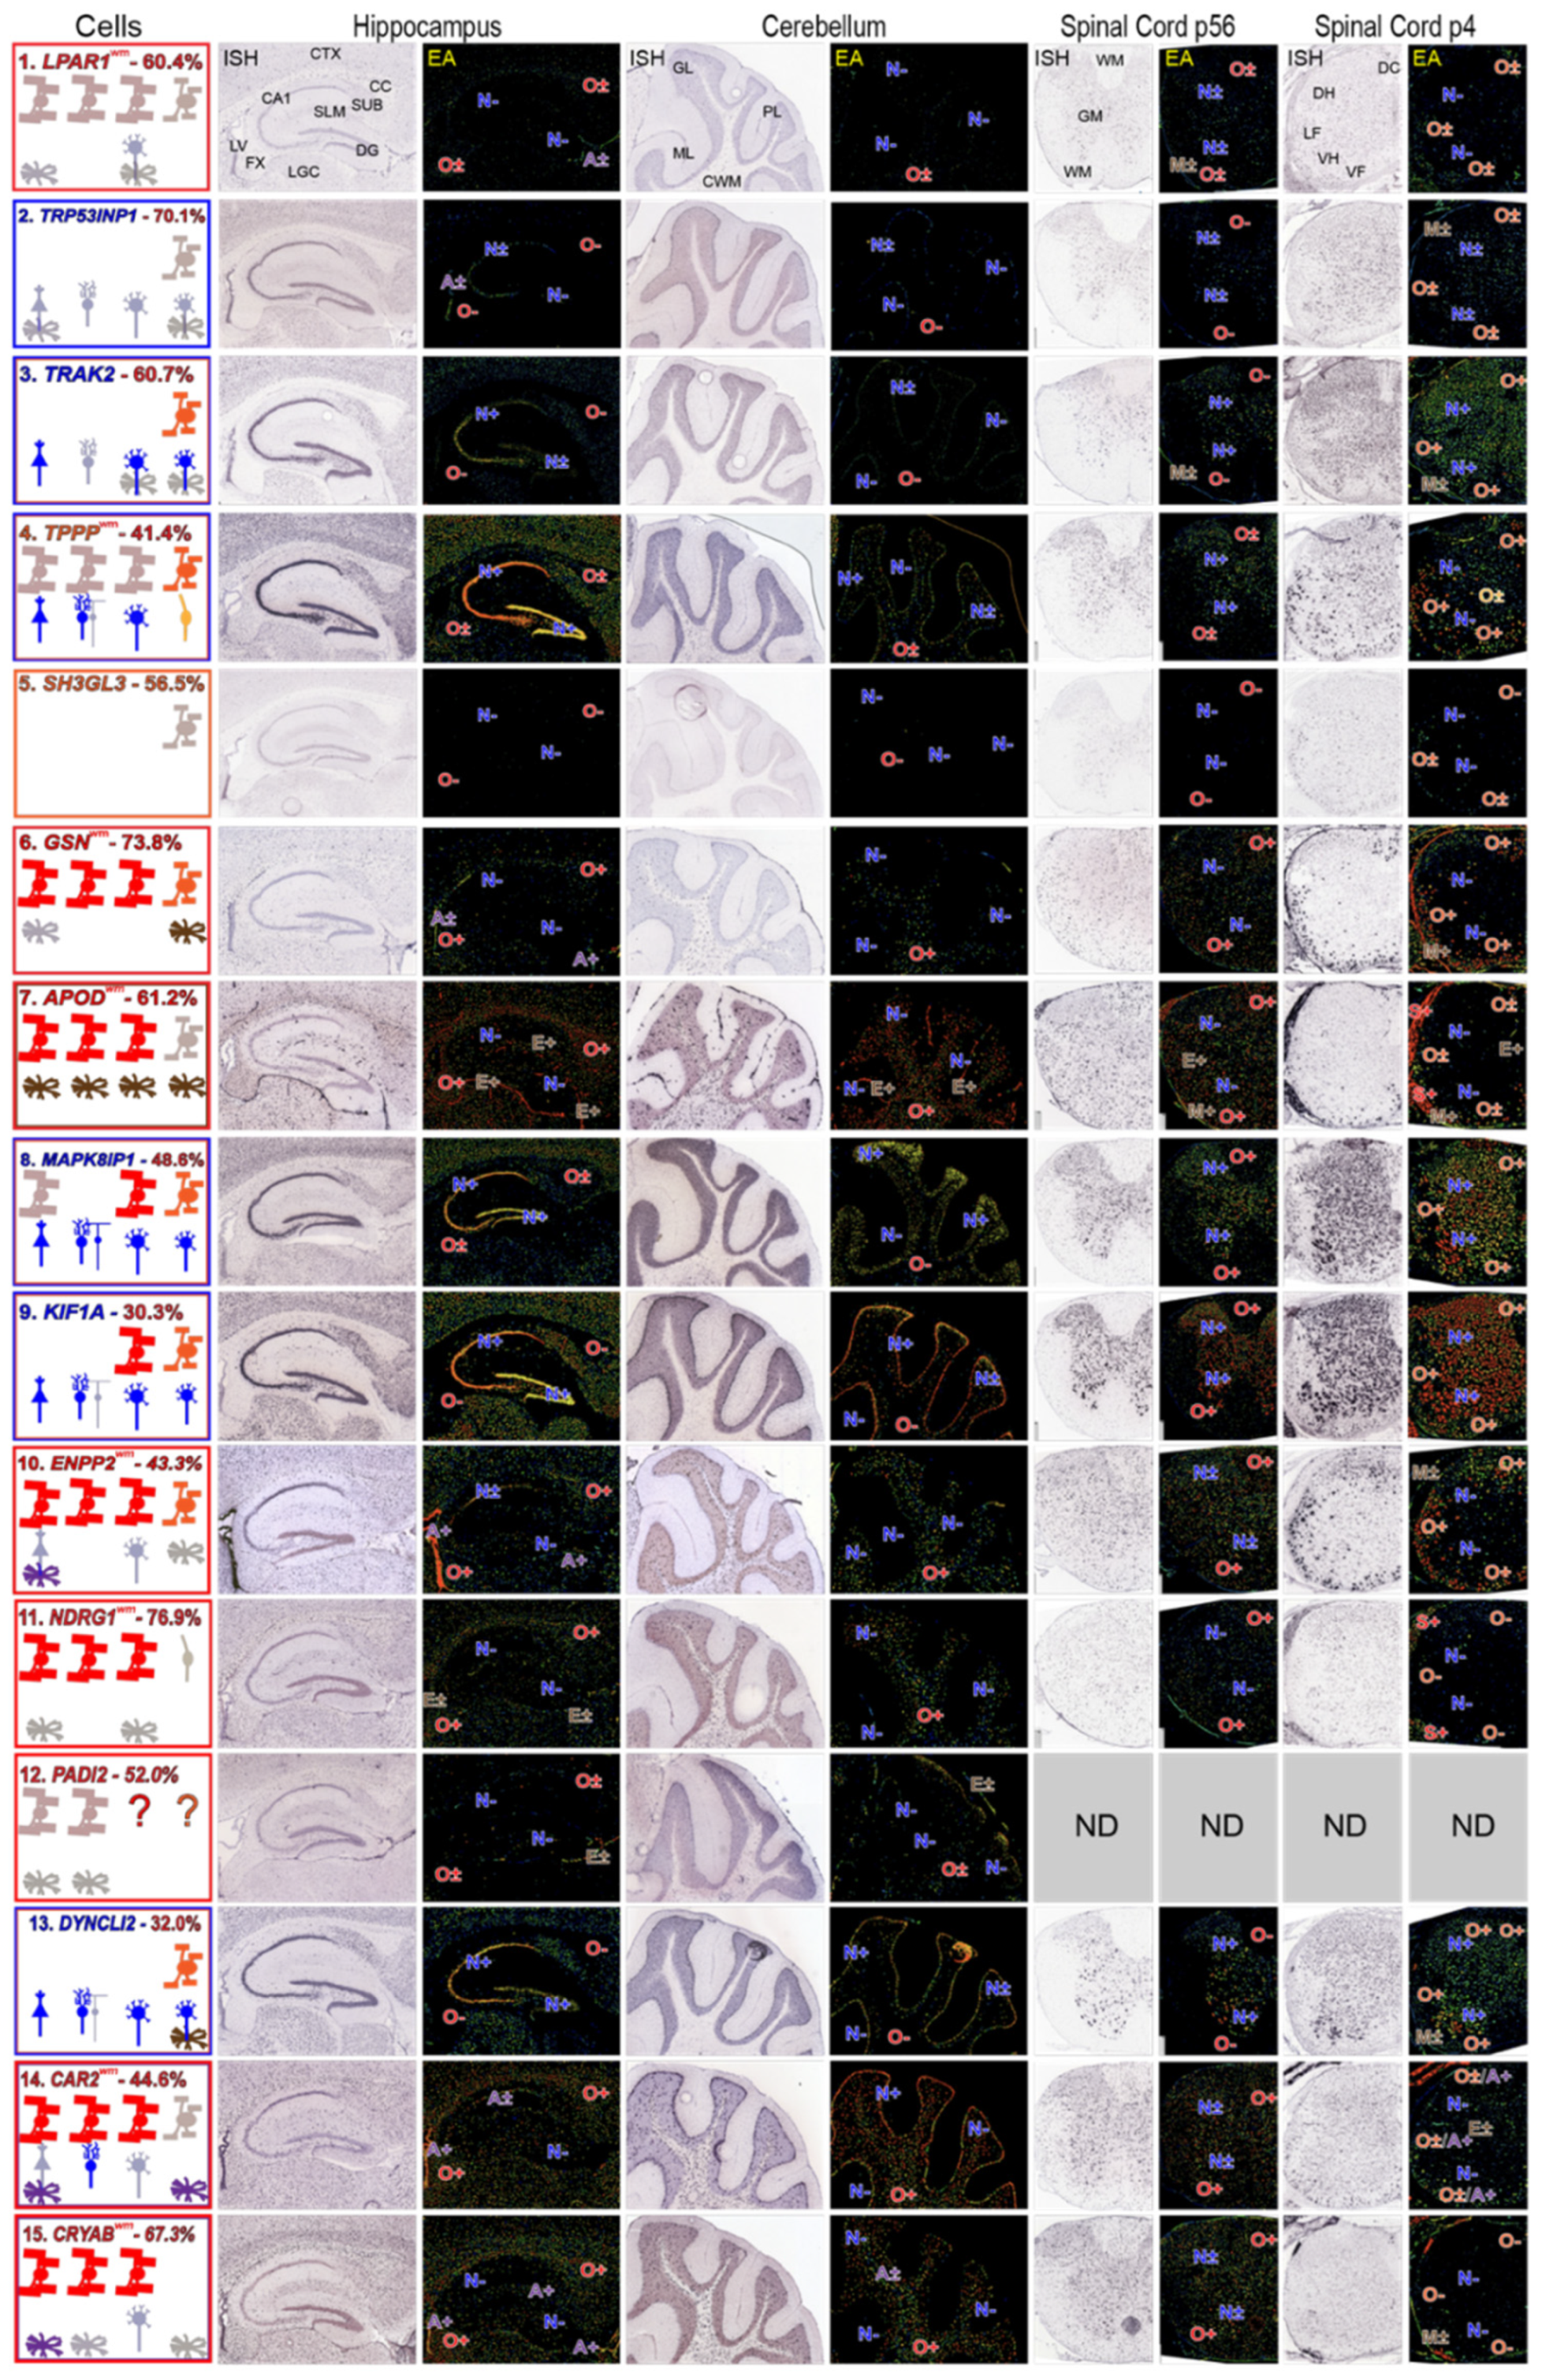
3.5. Using AMBA and AMSCA Images as an Attempt to Identify MSAS mRNAs

Differences in distribution of MSAS-associated MBP mRNA and non-MSAS-associated CNP mRNA in P56 mouse brain caudate putamen have been recorded using high-magnification ISH images [66]. Additionally, similar high-magnification images identify dendritic residences of calcium/calmodulin dependent protein kinase 2 (CAMK2), dead end protein homolog 1 (DND1), microtubule associated protein 1A (MAP1A), microtubule associated protein 2 (MAP2), inositol 1,4,5-triphosphate receptor type 1 (ITPR1) and SH3 domain binding kinase 1 (SBK1) mRNAs [66]. The success in visualizing these process-associated expressions led us to see if we could visualize MSAS mRNAs in myelinating oligodendrocyte processes.
We examined high-magnification images of MBP mRNA distribution in the fornix, cerebellar white matter, and in P56 and P4 spinal cord white matter and compared them with images of MOBP, CNP mRNAs, LPAR1, TRP53INP2, TRAK2, TPPP and SH3GL3 mRNAs (Figure 5).
At low-magnification, MBP mRNA in fornix is concentrated over many labeled cells (black spots) spread throughout the tissue. At high magnification, surrounding the labeled soma are gray areas that likely represent expression in MSAS (arrows in first column, second picture from the top, Figure 5). Similar distribution patterns are seen in high-magnification images of MBP mRNA in cerebellar, P56 and P4 spinal cord white matter (arrows in first column images, Figure 5). In P4 spinal cord, MBP mRNA expression in gray matter includes thin process around a few somata (arrow, Figure 5, also Figure 3).
This notion that the gray areas surrounding highly expressing somata represent expression in MSAS is strengthened by comparing distribution patterns of MBP mRNA with those of CNP mRNA, an mRNA largely limited to oligodendrocyte somata [46,67]. Both low and high magnification images of fornix, cerebellar white matter and spinal cord (P56 and P4) white matter show prominent expression in punctate oligodendrocyte somata, and little expression in white matter surrounding the somata. Arrowheads in images of fornix and cerebellum show that, compared with MBP mRNA expression, the label is not clear in regions surrounding labeled soma (Figure 5). Similar distribution patterns were seen in high-magnifications images of PLP1 and CLDN11 mRNAs. It is difficult to tell whether or not faint gray areas of CNP mRNA expression around somata are due to presence in MSAS (arrows, Figure 5). Examining similar images of PLP1, MAG and MAL mRNAs in P4 spinal cord, it was impossible to decide whether small amounts of expressed mRNAs located to MSAS or not. Preparing and examining our own high-resolution images (Section 4.4.1) should provide clear understanding as to whether some of these mRNAs reside in MSAS.
Although a majority of MOBP mRNA isoforms are located in MSAS in rat tissues [12,45], the portions of MOBP mRNA isoforms residing in mouse MSAS has not been studied. We mention this because portions of MOBP mRNA residing in MSAS in AMBA and AMSCA images of mouse brain and spinal cord appear far lower than portions of MBP mRNA in MSAS (Figure 5). Nevertheless, in P56 fornix and cerebellar white matter, though not in P56 spinal cord white matter, some MOBP mRNA expression appears in white matter surrounding labeled somata (arrowheads, Figure 5). In P4 spinal cord, more pronounced MOBP mRNA expression appears in both white and gray matter (arrows, Figure 5), though further studies will be needed (Section 4.4.1) to know with certainty.
Expressions of LPAR1, TRP53INP2, TRAK2, TPPP and SH3GL3 mRNAs in fornix, cerebellar and P56 and P4 spinal cord appear to be restricted to oligodendrocyte somata (Figure 5). However, in all instances, overall expression levels are far lower than expression levels of MBP, CNP and MOBP mRNAs, indicating that MSAS-associated expression might have been identified if exposure times were increased. In a few cases, small clusters of expression are seen (arrowheads, Figure 5), though these expressions are no different than ones encountered with CNP mRNA. Unfortunately, unlike mRNAs located in neuronal dendrites which are readily detected in high-magnification ISH images, we have not been able to show that MSAS mRNAs, other than MBP mRNA, reside in MSAS.

4. Discussion

We wrote this paper to highlight our concern that studies of myelin-forming oligodendrocytes focus far more on what the cells are doing and far less on where they are doing them. Although we are gaining knowledge of events occurring in myelinating oligodendrocytes per se, we need to put more effort to identify events that locate to myelinating internodes and to characterize the timing of those events during myelin formation and maturation.
Myelin-forming oligodendrocytes extend processes that wrap from one to sixty segments of large caliber axons with myelin sheaths of dimensions sensitive to axons’ calibers and lengths [68,69]. Morphologically, internodes are tethered to the soma by processes structured with a rim of cytoplasm surrounding compact myelin (named MSAS throughout this paper). Each cytoplasmic rim consists of an interconnected outer tongue process, two paranodal loops and an inner tongue process. While many proteins and lipids used to elaborate, maintain and modify compact myelin and surrounding specializations are synthesized in the oligodendrocyte somata, packaged into vesicles and membrane-less particles and transported out to internodes, distinct populations of proteins and lipids are synthesized in each MSAS using mRNAs, proteins and RNAs available to carry out translation (proteins) and metabolic enzymes (lipids). Synthetic activities in each MSAS, mostly along outer tongue processes, furnish proteins that are incorporated into myelin sheaths and responsible for growing and maintaining the internode. To identify the proteins synthesized and functioning in MSAS, one has available a plethora of techniques developed and used to identify and characterize proteins synthesized in neuronal dendrites, axons and in processes of many other cell types [1,70]. A reasonable starting point for these efforts is to compare various screening approaches to identify MSAS mRNAs.
With this goal in mind, we developed a screen based on the finding that MBP and MOBP mRNAs located in MSAS are more efficiently trapped in lipid-rich myelin vesicles than oligodendrocyte somata-residing PLP1 mRNA [45,71]. Trapped mRNAs separate from others, excepting some which reside in processes of other cells which are close to compact myelin, during ultracentrifugation. Finding that two putative MSAS mRNAs, ENPP2 and NDRG1, were not trapped in myelin prepared from tissue used in this study (Figure 1), we considered the possibility that different populations of MSAS mRNAs might be trapped during homogenization in solutions of different tonicities. Clearly, using myelin prepared from tissues homogenized in solutions varying tonicity for screens will likely augment the numbers of different MSAS mRNAs compared to screens using myelin prepared from tissues homogenized in solutions of single tonicity (next section).

4.1. Effectiveness of the Subcellular Fractionation Approach in Identifying MSAS mRNAs

For our initial studies, we used Northern blots to show that MSAS mRNAs identified in our screens (Table 1) were enriched in myelin relative to low-speed supernatants used for the fractionations [17,18]. We noted that some MSAS mRNAs, e.g., FHC1 mRNA [18], were larger and/or had larger isoforms than mRNAs in low-speed supernatants, indicating high molecular weight splice variants, as noted for transported mRNAs in other cells [72], may contain sequences used to target, stabilize and/or encode alternatively-spliced variants. Whereas RT-qPCR measures enrichments more precisely than Northern blots, it does not detect high molecular weight splice variants. Future studies should include approaches that identify full-length sequences of MSAS mRNAs (Section 4.4.2).
RT-qPCR experiments clearly show that MSAS (MBP and MOBP-81A) mRNAs are more highly enriched (~five-fold and ~twenty-five-fold, respectively) in myelin over oligodendrocyte somata mRNAs (PLP1, CNP and MOBP-81B), and in neuronal (NEFL) and astrocyte (GFAP) mRNAs (Figure 1). Thus, except for cases in which the mRNAs are expressed at high levels by neurons, astrocytes, microglia and/or ependymal cells, M/P ratio measurements obtained with RT-qPCR will provide a simple and straightforward way to find out if mRNAs of interest reside in MSAS. For example, knowing that LPAR1 mRNA is enriched in myelin, one could readily design primers and use RT-qPCR to find out if other LPAR mRNAs are enriched in myelin as well.
Of thirteen putative MSAS mRNAs examined, we showed, based on M/P ratios, that five (LPAR1, TRP53INP2, TRAK2, TPPP and SH3GL3) reside in MSAS (Figure 1). For TRP53INP2, TRAK2, and TPPP mRNAs, expression by neurons at high levels (Figure 2 and Figure 4) likely yields underestimates of actual levels of these mRNAs in MSAS. Reasons why mRNAs identified in our screens may reside in MSAS despite low enrichment values include: (1) high expression by neurons (KIF1A, MAPK8IP1 and DYNC1LI2 mRNAs) or ependymal cells (APOD mRNA); (2) expression levels which are too low to determine with the RT-qPCR protocol used (DYNC1LI2 and PADI2 mRNAs); or (3) exclusion from myelin (ENPP2 and NDRG1 mRNAs) resulting from the use of hypertonic sucrose for homogenization. As ISH studies clearly show that CAR2 [15], CRYAB [16], MATP [73] and KIF1A [17] mRNAs reside in MSAS, either in cultured oligodendrocytes and/or tissues, ISH studies could be used to find out whether or not mRNAs of interest reside in MSAS (Section 4.4.1).
Knowing that presence in neurons lowers enrichments of some MSAS mRNAs, using ‘neuron-poor’ white matter—e.g., optic nerve, corpus callosum or spinal cord white matter—as starting material may help reduce influences of neuronal mRNAs, and, consequently, improve identification of MSAS mRNAs expressed by neurons. However, based on our experience of using spinal cord white matter in some studies (unpublished observations), we are concerned that using by white matter-rich starting material, the large amounts of myelin accumulating at the 0.32 M/0.85M sucrose interface will trap high levels of ‘non-MSAS’ mRNAs than starting tissues with lower myelin content. Increasing dilutions and/or including hypo-osmotic shock may help reduce levels of ‘non-MSAS’ mRNAs.
Because we found that MBP and MOBP-81A mRNAs were trapped at nearly equal levels in myelin prepared from tissues homogenized hypertonic and isosmotic sucrose [44], we conducted these studies using only myelin prepared from tissues homogenized in hypertonic sucrose. We felt the hypertonicity might increase the rate of myelin vesiculation. Finding that NDRG1 and ENPP2 mRNAs were not trapped in myelin prepared from hypertonic sucrose, we recommend using both hypertonic and isosmotic sucrose in future studies.
Because all screens were conducted with tissues from rodents at stages past peak (~10 days [74]), myelination as starting material [18,20,44], and because we find that some MSAS mRNAs are expressed better by NFOs and other MSAS mRNAs are expressed better by MOs (Figure 2), we recommend using tissues from younger, less-myelinated rats in future screens. Furthermore, as myelin from members of all gnathostome classes floats on 0.85 M sucrose [75], we recommend including ‘non-mammalian’ species in future studies. Information on MSAS mRNAs from species representing different gnathostome classes will provide an evolutionary perspective as to when mRNAs were recruited for transport to and translation in MSAS. To this end, in looking for MSAS mRNAs in spiny dogfish, Squalus acanthias, we found that neither MBP nor MOBP mRNAs were enriched in myelin [76], with results suggesting that neither resided in elasmobranch MSAS, a result suggesting myelination does not require MBP synthesis in MSAS. We also learned that the reason why MOBP mRNAs were not purified in elasmobranch myelin was because the MOBP gene family only exists in mammals [76].
In summary, animal species, tissues, development and homogenization conditions are variables worth including when investigators decide to initiate screens to identify MSAS mRNAs.

4.2. An Independent Approach to Identify MSAS mRNAs

Autoradiographic studies which we used to locate sites of phospholipid and protein synthesis in myelinating Schwann cells show a clear spatial separation of perinuclear and process-associated sites [77,78,79,80]. Similar spatial separation is visible for MBP mRNA in ISH images from AMBA and AMSCA (Figure 3 and Figure 5). Based on these images, we realized that by using cryostat sections of fresh tissues stained with DAPI or Hoechst, one could distinguish oligodendrocyte somata nuclei and surrounding perinuclear regions from distant perinuclei-free white matter. Although the peri-nuclei-free white matter likely contains cells and their processes, it is hopefully enriched in MSAS mRNAs. If so, separately harvesting nuclei-rich and nuclei-poor regions of cryostat sections with laser capture microdissection [81,82], extracting RNA from pooled samples, preparing cDNA conducting RT-qPCR, should be used to find out if nuclei-free regions are enriched, and by how much, in MBP mRNA over PLP1 mRNA. Enrichments on the order found in subcellular fractions would show that the material could be used for screening. One could increase enrichment further by preparing myelin vesicles from nuclei-free preparations as well. This approach, different from subcellular fractionation (Section 4.1) could be used as an alternative to identify MSAS mRNAs. Like subcellular fractionation screens, experiments using tissue samples prepared by laser capture could be applied to different CNS regions, different stages of myelination and to tissues from different species.

4.3. Roles Which Identified MSAS mRNAs and Encoded Proteins Might Play in Internodal Myelination

Many proteins used, e.g., for drosophila development [83], neuronal dendritic [84] and axon growth and function [85], astrocyte function at synapses and along blood vessels [86] and radial glial function [87], are synthesized from mRNAs transported to and translated in intracellular sites distant from perinuclear regions of cell somata. Presumably, many proteins participating in myelination are synthesized at least to some extent in MSAS. However, until studies which identify them are carried out and the relative contributions of local synthesis versus somatic translation and transport are determined, we are left with the small number of MSAS mRNAs identified in our SSH screens and by ISH.
To identify roles which proteins encoded by these few mRNAs might play in myelination, we must place them in a framework of processes believed to occur in MSAS. Myelin sheath formation in MSAS involved major dense line cytoplasmic and interperiod line extracellular leaflet compactions. The former requires MBP [42,88,89], an evolutionarily novel protein [90,91], synthesized in all vertebrate MSAS, except possibly elasmobranch MSAS [92]. Because MBP undergoes post-translational modifications, including deamidation, deimination, N-terminal acylation and phosphorylation [42,88,93], different post-translationally modified MBP variants participate in cytoplasmic membrane compaction [42,88]. As deimination by PADI2 reduces positive charge and influence compaction [35,94,95], and because its mRNA most likely resides in MSAS [18], regulation MBP deimination may include local synthesis of PADI2. To find out if mRNAs encoding other enzymes known to post-translationally modify MBP are similarly regulated, one could use RT-qPCR to determine M/P ratios and ISH approaches to visualize mRNAs in MSAS as a means to see if mRNAs to these enzymes also reside in MSAS.
MBP-regulated compaction involves interactions with lipids at the cytoplasmic surface of oligodendrocyte plasma membrane, among which are polyphosphoinositides [88,96]. Although a great deal of attention has focused on understand how MBP regulates compaction [89,97,98], little has been done to identify the pathways interacting polyphosphoinositides use to get to where locations needed for interactions with MBP. The difficulty of understanding how polyphosphoinositides move among intracellular membranes and the inner surface of the plasma membrane is widespread [99]. In this regard, it would be of interest to know where in myelinated tissues kinases and phosphatases involved in polyphosphoinositide metabolism reside and if any of these are synthesized from mRNAs residing in MSAS.
For major dense line compaction to occur, transmembrane proteins in the oligodendrocyte plasma membrane must be sequestered [100] and cytoplasmic structures, cytoskeleton and organelles removed. Endocytosis and/or autophagy, both associated with myelination [101,102,103] likely contribute to these sequestrations and removals. Among MSAS mRNAs enriched in myelin are SH3GL3 mRNA, encoding endophilin-A3, a protein participating in endocytosis [104,105], and TRP53INP2 mRNAs, encoding a protein participating in autophagy [106]. Knowing the mRNAs encoding these proteins reside in MSAS, it may be possible to link them to major dense line compaction.
Another mRNA identified in MSAS encodes DYNC1LI2, a cargo adaptor for dynein-mediated retrograde transport [107,108]. This adaptor may function in loading cargoes removed from regions of compaction and/or cargoes transported to soma to signal events in MSAS.
MSAS mRNAs associated with kinesin-mediated anterograde transport include KIF1A, MAPK8IP1 and TRAK2 [109,110,111,112,113]. Mitochondria are known to move around MSAS, contributing to needs for ATP and lipid synthesis [114,115,116,117]. Additionally, screens have shown that mRNAs involved in replenishing mitochondrial proteins are located in MSAS [10,44], and mitochondria are known to transport these mRNAs [118,119].
LPAR1 and ENPP2 influence myelination [120,121,122], with activation of the former increasing process outgrowth in cultured oligodendrocyte and expression of MBP and MBP mRNA in these cells [123]. Knowing that LPAR1 and possibly ENPP2 are synthesized in MSAS, possibly in different locations, based on subcellular fractionation results, could mean that if these locally synthesized proteins were functioning in individual internodes, generation of LPA by ENPP2 and activation of LPAR1 by LPA may influence elaboration of myelin at these sites.
TPPP mRNA encodes a protein p25/TPPP enriched in oligodendrocytes [37], intrinsically unstructured [124,125], functioning in microtubule bundling and branching [124,126] and locating to Golgi outposts in cultured cells and tissue [39]. Inhibition of TPPP in myelinating oligodendrocytes in vivo and in vitro alter branching and elaboration of myelin sheaths [39]. Adding knowledge that TPPP is synthesized in MSAS may indicate that local synthesis can contribute to oligodendrocyte process branching, elaboration of myelin internodes and possibly recruitment of Golgi outposts, which may, like in dendrites [127,128], contribute to vesicle trafficking, glycosylation and glycolipid metabolism.
Although the ideas as to how identified MSAS mRNAs may contribute to internodal myelination are highly speculative, they will hopefully encourage studies which focus on roles local protein synthesis play in elaboration of myelin at individual internodes.

4.4. Future Efforts to Identify MSAS mRNAs

To uncover mechanisms which regulate myelin internode development and plasticity, we recognize the need to identify many RNAs, including alternatively-spliced mRNAs, microRNAs and lncRNAs, transported to and functioning in MSAS. Efforts to identify MSAS RNAs and determine roles and roles which encoded proteins play in myelination will both enhance conceptual understanding of myelination and contribute to the broader understanding of how RNA transport and local protein synthesis in neurons and many other cell types [1,2,70,129] contribute to function.

4.4.1. Locating Intracellular Sites Where MSAS mRNAs Reside Using ISH

The distinct and recognizable distributions of MBP versus PLP1 and CNP mRNAs is apparent in low resolution light microscopic images of tissue sections [130,131] and cultured cells [132]. Low-resolution on-line AMBA and AMSCA images of P56 mouse brain caudate putamen confirm differences in localizations of MBP (MSAS) and CNP (somata only) mRNA (Figure 9 in [66]), differences seen in P56 mouse brain and spinal cord (Figure 5). Unfortunately, largely due to the fact that other MSAS mRNAs are expressed at far lower levels than MBP, MOBP and CNP mRNAs, consequently, exposures used for AMBA and AMSCA images were too short to detect expression of any putative MSAS mRNAs identified in our screens or ones identified by ISH (Figure 5).
Hence, it will be necessary to conduct independent ISH studies to determine whether any of these mRNAs and mRNAs identified in future screens reside in MSAS. Fortunately, remarkable advances in single molecule fluorescent ISH (smFISH), as recently reviewed [133,134], will enable investigators to find out if mRNAs and other RNAs identified in screens reside in MSAS. Furthermore, these techniques, alone or modified with tissue expansion protocols [135,136], should allow investigators to distinguish whether expressions occur in outer tongue processes, inner tongue processes, paranodal loops, and/or axoplasm. Applying high resolution ISH will not only enable investigations to find out if mRNAs/RNAs identified in screen reside in MSAS, but also to find out if mRNAs to proteins located in MSAS (e.g., inner tongue processes such as septin and anillin [137,138], myelin-associated glycoprotein [139,140,141] and CADM4 [142]) have mRNAs in these regions. Furthermore, with availability of spatial transcriptomics approaches [143,144,145,146], it should be possible to use these approaches to directly identify MSAS mRNAs in tissue sections.

4.4.2. Differential Gene Expression Analysis

Although clearly mRNAs located in MSAS are selectively enriched in myelin vesicles prepared from tissues homogenized in hypertonic and isosmotic sucrose solutions, mRNAs located in oligodendrocyte soma and in other cellular locations can be trapped to varying degrees in myelin vesicles as well. Among the mRNAs identified in our initial screens was FTH1 mRNA [18]. Our follow up Northern blot analysis showed that the known low molecular weight isoform was not enriched in myelin. Instead, several yet to be characterized higher molecular weight variants were enriched in myelin and, furthermore, these variants were selectively expressed coordinate with MBP mRNA during rat brain development. We also found that some of the other mRNAs identified in our screens that were enriched in myelin were larger than corresponding mRNAs in the starting low-speed supernatant (Gould, unpublished). We believe that it will be important to use next-generation sequencing approaches [147] to determine full-length sequences of putative MSAS mRNAs. Furthermore, one should be mindful that not only mRNAs will be captured in myelin, but also miRNAs and lncRNAs and that sequencing approaches which identify these RNAs should be considered.
Furthermore, once larger numbers of mRNAs are identified, it seems attractive to apply weighted gene co-expression network analysis analyses (WGCNA, https://horvath.genetics.ucla.edu/html/CoexpressionNetwork/Rpackages/WGCNA/Tutorials/, accessed on 30 March 2023) to identify MSAS mRNAs that are functionally linked [148].

4.4.3. Final Thoughts

The focus of this paper is to generate enthusiasm for identifying and characterizing mRNAs which are transported to and are translated in internodal processes, sites allowing independent control of synthesis and interactions that enable internodes to grow with specific regulation from axons being myelinated and from neighboring internodes. We also encourage a broadening of this approach by considering the studies not only in terms of the elaboration of uniquely compacted portions of myelin internodes, but also to proteins underlying functions located at outer and inner tongue processes and in paranodal loops. Clearly high-resolution ISH should help determine whether mRNAs of interest reside in outer versus inner tongue processes versus paranodal loops and axoplasm (Section 4.4.1).
In spite of wide-ranging efforts and a growing interest in myelin lipids and how myelin sheaths become richer in lipids than other plasma membranes [96,149,150,151,152,153,154,155], the idea that some myelin-destined lipids might be synthesized in MSAS, i.e., close to where they enter myelin has, to our knowledge, not been addressed. We learned that a substantial portion of phospholipids incorporated into peripheral nerve myelin is synthesized in superficial cytoplasmic channels [77,78,156], studies backed up by subcellular fractionation studies showing sphingomyelin synthesis occurs in plasma membrane and not in the endoplasmic reticulum [157,158]. We hope that future efforts will include locating sites of metabolism of polyphosphoinositides (Section 4.3) and other myelin-destined lipids.

Supplementary Materials

The following supporting information can be downloaded at: https://www.mdpi.com/article/10.3390/life13040945/s1. Table S1: Real-time PCR primers used in this study; Table S2: Expression patterns of cell-type specific mRNAs—MBRS data; Table S3: Links of cell-type specific mRNAs—AMBA, AMSCA and ADMBA data; Table S4: Links to MSAS mRNAs—AMBA, AMSCA and AMDMB data.

Author Contributions

Conducting studies, formal analysis and writing paper, R.G. Editing and statistical analysis, S.B. All authors have read and agreed to the published version of the manuscript.

Funding

This study was supported in part by grants to SB from the NINDS (NS023868 and NS082730).

Institutional Review Board Statement

The UIC Animal Care and Use committee approved protocol for this project.

Informed Consent Statement

Not applicable.

Data Availability Statement

We include a statement that all of the data used is shown or that links were provided to original data sets.

Conflicts of Interest

The authors declare no conflict of interest.

Abbreviations

AMBA (Allen Mouse Brain Atlas), AMSCA (Allen Mouse Spinal Cord Atlas), ISH, in situ hybridization, MBRS (mouse brain transcriptome, RNA seq), mmRS (mouse myelin transcriptome, RNA seq), scRS (mouse single cell transcriptome, RNA seq), soRS (mouse oligodendrocyte lineage cell transcriptome, RNA seq), SSH (suppression subtractive hybridization).

References

  1. Das, S.; Vera, M.; Gandin, V.; Singer, R.H.; Tutucci, E. Intracellular mRNA transport and localized translation. Nat. Rev. Mol. Cell Biol. 2021, 22, 483–504. [Google Scholar] [CrossRef] [PubMed]
  2. Biever, A.; Donlin-Asp, P.G.; Schuman, E.M. Local translation in neuronal processes. Curr. Opin. Neurobiol. 2019, 57, 141–148. [Google Scholar] [CrossRef] [PubMed]
  3. Cioni, J.M.; Koppers, M.; Holt, C.E. Molecular control of local translation in axon development and maintenance. Curr. Opin. Neurobiol. 2018, 51, 86–94. [Google Scholar] [CrossRef] [PubMed]
  4. Turner-Bridger, B.; Caterino, C.; Cioni, J.M. Molecular mechanisms behind mRNA localization in axons. Open Biol. 2020, 10, 200177. [Google Scholar] [CrossRef] [PubMed]
  5. Brophy, P.J.; Boccaccio, G.L.; Colman, D.R. The distribution of myelin basic protein mRNAs within myelinating oligodendrocytes. Trends Neurol. Sci. 1993, 16, 515–521. [Google Scholar] [CrossRef] [PubMed]
  6. Smith, R. Moving Molecules: mRNA Trafficking in Mammalian Oligodendrocytes and Neurons. Neuroscientist 2004, 10, 495–500. [Google Scholar] [CrossRef]
  7. White, R.; Kramer-Albers, E.M. Axon-glia interaction and membrane traffic in myelin formation. Front. Cell. Neurosci. 2014, 7, 284. [Google Scholar] [CrossRef]
  8. Carson, J.H.; Gao, Y.; Tatavarty, V.; Levin, M.K.; Korza, G.; Francone, V.P.; Kosturko, L.D.; Maggipinto, M.J.; Barbarese, E. Multiplexed RNA trafficking in oligodendrocytes and neurons. Biochim. Biophys. Acta (BBA)-Gene Regul. Mech. 2008, 1779, 453–458. [Google Scholar] [CrossRef] [Green Version]
  9. Torvund-Jensen, J.; Steengaard, J.; Reimer, L.; Fihl, L.B.; Laursen, L.S. Transport and translation of MBP mRNA is regulated differently by distinct hnRNP proteins. J. Cell Sci. 2014, 127, 1550–1564. [Google Scholar] [CrossRef] [Green Version]
  10. Yergert, K.M.; Doll, C.A.; O’Rouke, R.; Hines, J.H.; Appel, B. Identification of 3’ UTR motifs required for mRNA localization to myelin sheaths in vivo. PLoS Biol. 2021, 19, e3001053. [Google Scholar] [CrossRef]
  11. Meservey, L.M.; Topkar, V.V.; Fu, M.M. mRNA Transport and Local Translation in Glia. Trends Cell Biol. 2021, 31, 419–423. [Google Scholar] [CrossRef]
  12. Holz, A.; Schaeren-Wiemers, N.; Schaefer, C.; Pott, U.; Colello, R.J.; Schwab, M.E. Molecular and developmental characterization of novel cDNAs of the myelin-associated oligodendrocytic basic protein. J. Neurosci. 1996, 16, 467–477. [Google Scholar] [CrossRef] [Green Version]
  13. Yamamoto, Y.; Mizuno, R.; Nishimura, T.; Ogawa, Y.; Yoshikawa, H.; Fujimura, H.; Adachi, E.; Kishimoto, T.; Yanagihara, T.; Sakoda, S. Cloning and expression of myelin-associated oligodendrocytic basic protein. A novel basic protein constituting the central nervous system myelin. J. Biol. Chem. 1994, 269, 31725–31730. [Google Scholar] [CrossRef]
  14. LoPresti, P.; Szuchet, S.; Papasozomenos, S.C.; Zinkowski, R.P.; Binder, L.I. Functional implications for the microtubule-associated protein tau: Localization in oligodendrocytes. Proc. Natl. Acad. Sci. USA 1995, 92, 10369–10373. [Google Scholar] [CrossRef] [PubMed] [Green Version]
  15. Ghandour, M.S.; Skoff, R.P. Double-labeling in situ hybridization analysis of mRNAs for carbonic anhydrase II and myelin basic protein: Expression in developing cultured glial cells. Glia 1991, 4, 1–10. [Google Scholar] [CrossRef] [PubMed]
  16. Quraishe, S.; Wyttenbach, A.; Matinyarare, N.; Perry, V.H.; Fern, R.; O’Connor, V. Selective and compartmentalized myelin expression of HspB5. Neuroscience 2016, 316, 130–142. [Google Scholar] [CrossRef]
  17. Gould, R.; Freund, C.; Palmer, F.; Knapp, P.E.; Huang, J.; Morrison, H.; Feinstein, D.L. Messenger RNAs for kinesin and dynein are located in neural processes. Biol. Bull. 1999, 197, 259–260. [Google Scholar] [CrossRef] [Green Version]
  18. Gould, R.M.; Freund, C.M.; Palmer, F.; Feinstein, D.L. Messenger RNAs located at sites of myelin assembly. J. Neurochem. 2000, 75, 1834–1844. [Google Scholar] [CrossRef] [PubMed] [Green Version]
  19. Gould, R.M.; Freund, C.M. mRNAs located at sites of myelin sheath assembly. Mol. Biol. Cell 2000, 11, 154a. [Google Scholar]
  20. Thakurela, S.; Garding, A.; Jung, R.B.; Muller, C.; Goebbels, S.; White, R.; Werner, H.B.; Tiwari, V.K. The transcriptome of mouse central nervous system myelin. Sci. Rep. 2016, 6, 25828. [Google Scholar] [CrossRef] [PubMed] [Green Version]
  21. Schaeren-Wiemers, N.; Schaefer, C.; Valenzuela, D.M.; Yancoupoulos, G.D.; Schwab, M.E. Identification of new oligodendrocyte- and myelin-specific genes by a differential screening approach. J. Neurochem. 1995, 65, 10–22. [Google Scholar] [CrossRef]
  22. Boyles, J.K.; Notterpek, L.M.; Wardell, M.R.; Rall, S.C., Jr. Identification, characterization, and tissue distribution of apolipoprotein D in the rat. J. Lipid Res. 1990, 31, 2243–2256. [Google Scholar] [CrossRef] [PubMed]
  23. Fuss, B.; Baba, H.; Phan, T.; Tuohy, V.K.; Macklin, W.B. Phosphodiesterase I, a novel adhesion molecule and/or cytokine involved in oligodendrocyte function. J. Neurosci. 1997, 17, 9095–9103. [Google Scholar] [CrossRef] [Green Version]
  24. Fox, M.A.; Colello, R.J.; Macklin, W.B.; Fuss, B. Phosphodiesterase-I alpha/autotaxin: A counteradhesive protein expressed by oligodendrocytes during onset of myelination. Mol. Cell. Neurosci. 2003, 23, 507–519. [Google Scholar] [CrossRef]
  25. Tanaka, J.; Sobue, K. Localization and characterization of gelsolin in nervous tissues: Gelsolin is specifically enriched in myelin-forming cells. J. Neurosci. 1994, 14, 1038–1052. [Google Scholar] [CrossRef] [PubMed] [Green Version]
  26. Legrand, C.; Ferraz, C.; Clavel, M.C.; Rabie, A. Immunocytochemical localization of gelsolin in oligodendroglia of the developing rabbit central nervous system. Dev. Brain Res. 1986, 30, 231–235. [Google Scholar] [CrossRef]
  27. Stankoff, B.; Barron, S.; Allard, J.; Barbin, G.; Noel, F.; Aigrot, M.S.; Premont, J.; Sokoloff, P.; Zalc, B.; Lubetzki, C. Oligodendroglial expression of Edg-2 receptor: Developmental analysis and pharmacological responses to lysophosphatidic acid. Mol. Cell. Neurosci. 2002, 20, 415–428. [Google Scholar] [CrossRef]
  28. King, R.H.; Chandler, D.; Lopaticki, S.; Huang, D.; Blake, J.; Muddle, J.R.; Kilpatrick, T.; Nourallah, M.; Miyata, T.; Okuda, T.; et al. Ndrg1 in development and maintenance of the myelin sheath. Neurobiol. Dis. 2011, 42, 368–380. [Google Scholar] [CrossRef]
  29. Okuda, T.; Kokame, K.; Miyata, T. Differential expression patterns of NDRG family proteins in the central nervous system. J. Histochem. Cytochem. 2008, 56, 175–182. [Google Scholar] [CrossRef] [PubMed] [Green Version]
  30. Marechal, D.; Dansu, D.K.; Castro, K.; Patzig, J.; Magri, L.; Inbar, B.; Gacias, M.; Moyon, S.; Casaccia, P. N-myc downstream regulated family member 1 (NDRG1) is enriched in myelinating oligodendrocytes and impacts myelin degradation in response to demyelination. Glia 2022, 70, 321–336. [Google Scholar] [CrossRef]
  31. Mustonen, V.; Muruganandam, G.; Loris, R.; Kursula, P.; Ruskamo, S. Crystal and solution structure of NDRG1, a membrane-binding protein linked to myelination and tumour suppression. FEBS J. 2021, 288, 3507–3529. [Google Scholar] [CrossRef]
  32. Boggs, J.M.; Rangaraj, G.; Koshy, K.M.; Ackerley, C.; Wood, D.D.; Moscarello, M.A. Highly deiminated isoform of myelin basic protein from multiple sclerosis brain causes fragmentation of lipid vesicles. J. Neurosci. Res. 1999, 57, 529–535. [Google Scholar] [CrossRef]
  33. Finch, P.R.; Wood, D.D.; Moscarello, M.A. The presence of citrulline in a myelin protein fraction. FEBS Lett. 1971, 15, 145–148. [Google Scholar] [CrossRef] [PubMed] [Green Version]
  34. Musse, A.A.; Li, Z.; Ackerley, C.A.; Bienzle, D.; Lei, H.; Poma, R.; Harauz, G.; Moscarello, M.A.; Mastronardi, F.G. Peptidylarginine deiminase 2 (PAD2) overexpression in transgenic mice leads to myelin loss in the central nervous system. Dis. Model. Mech. 2008, 1, 229–240. [Google Scholar] [CrossRef] [PubMed]
  35. Pritzker, L.B.; Joshi, S.; Gowan, J.J.; Harauz, G.; Moscarello, M.A. Deimination of myelin basic protein. 1. Effect of deimination of arginyl residues of myelin basic protein on its structure and susceptibility to digestion by cathepsin D. Biochemistry 2000, 39, 5374–5381. [Google Scholar] [CrossRef]
  36. Pritzker, L.B.; Nguyen, T.A.; Moscarello, M.A. The developmental expression and activity of peptidylarginine deiminase in the mouse. Neurosci. Lett. 1999, 266, 161–164. [Google Scholar] [CrossRef]
  37. Takahashi, M.; Tomizawa, K.; Fujita, S.C.; Sato, K.; Uchida, T.; Imahori, K. A brain-specific protein p25 is localized and associated with oligodendrocytes, neuropil, and fiber-like structures of the CA3 hippocampal region in the rat brain. J. Neurochem. 1993, 60, 228–235. [Google Scholar] [CrossRef]
  38. Tirian, L.; Hlavanda, E.; Olah, J.; Horvath, I.; Orosz, F.; Szabo, B.; Kovacs, J.; Szabad, J.; Ovadi, J. TPPP/p25 promotes tubulin assemblies and blocks mitotic spindle formation. Proc. Natl. Acad. Sci. USA 2003, 100, 13976–13981. [Google Scholar] [CrossRef] [Green Version]
  39. Fu, M.M.; McAlear, T.S.; Nguyen, H.; Oses-Prieto, J.A.; Valenzuela, A.; Shi, R.D.; Perrino, J.J.; Huang, T.T.; Burlingame, A.L.; Bechstedt, S.; et al. The Golgi Outpost Protein TPPP Nucleates Microtubules and Is Critical for Myelination. Cell 2019, 179, 132–146.e14. [Google Scholar] [CrossRef]
  40. Ghandour, M.S.; Langley, O.K.; Vincendon, G.; Gombos, G.; Filippi, D.; Limozin, N.; Dalmasso, D.; Laurent, G. Immunochemical and immunohistochemical study of carbonic anhydrase II in adult rat cerebellum: A marker for oligodendrocytes. Neuroscience 1980, 5, 559–571. [Google Scholar] [CrossRef]
  41. Iwaki, T.; Wisniewski, T.; Iwaki, A.; Corbin, E.; Tomokane, N.; Tateishi, J.; Goldman, J.E. Accumulation of alpha B-crystallin in central nervous system glia and neurons in pathologic conditions. Am. J. Pathol. 1992, 140, 345–356. [Google Scholar] [PubMed]
  42. Boggs, J.M. Myelin basic protein: A multifunctional protein. Cell. Mol. Life Sci. CMLS 2006, 63, 1945–1961. [Google Scholar] [CrossRef] [PubMed]
  43. Montague, P.; Dickinson, P.J.; McCallion, A.S.; Stewart, G.J.; Savioz, A.; Davies, R.W.; Kennedy, P.G.E.; Griffiths, I.R. Developmental expression of the murine Mobp gene. J. Neurosci. Res. 1997, 49, 133–143. [Google Scholar] [CrossRef]
  44. Gould, R.M.; Freund, C.M.; Engler, J.; Morrison, H.G. Optimization of homogenization conditions used to isolate mRNAs in processes of myelinating oligodendrocytes. Biol. Bull. 2000, 199, 215–217. [Google Scholar] [CrossRef]
  45. Gould, R.M.; Freund, C.; Barbarese, E. Myelin-associated oligodendrocytic basic protein (MOBP) mRNAs reside at different subcellular locations. J. Neurochem. 1999, 73, 1913–1924. [Google Scholar]
  46. Trapp, B.D.; Bernier, L.; Andrews, S.B.; Colman, D.R. Cellular and subcellular distribution of 2′,3′-cyclic nucleotide 3′-phosphodiesterase and its mRNA in the rat central nervous system. J. Neurochem. 1988, 51, 859–868. [Google Scholar] [CrossRef]
  47. Bloom, G.S. The UNC-104/KIF1 family of kinesins. Curr. Opin. Cell Biol. 2001, 13, 36–40. [Google Scholar] [CrossRef] [PubMed]
  48. Aizawa, H.; Sekine, Y.; Takemura, R.; Nangaku, M.; Hirokawa, N. Kinesin family in murine central nervous system. J. Cell Biol. 1992, 119, 1287–1296. [Google Scholar] [CrossRef] [Green Version]
  49. Zhang, Y.; Chen, K.; Sloan, S.A.; Bennett, M.L.; Scholze, A.R.; O’Keeffe, S.; Phatnani, H.P.; Guarnieri, P.; Caneda, C.; Ruderisch, N.; et al. An RNA-Sequencing Transcriptome and Splicing Database of Glia, Neurons, and Vascular Cells of the Cerebral Cortex. J. Neurosci. 2014, 34, 11929–11947. [Google Scholar] [CrossRef] [Green Version]
  50. Zeisel, A.; Munoz-Manchado, A.B.; Codeluppi, S.; Lonnerberg, P.; La Manno, G.; Jureus, A.; Marques, S.; Munguba, H.; He, L.; Betsholtz, C.; et al. Brain structure. Cell types in the mouse cortex and hippocampus revealed by single-cell RNA-seq. Science 2015, 347, 1138–1142. [Google Scholar] [CrossRef]
  51. Kramer, E.M.; Schardt, A.; Nave, K.A. Membrane traffic in myelinating oligodendrocytes. Microsc. Res. Tech. 2001, 52, 656–671. [Google Scholar] [CrossRef]
  52. Pringle, N.P.; Richardson, W.D. A singularity of PDGF alpha-receptor expression in the dorsoventral axis of the neural tube may define the origin of the oligodendrocyte lineage. Development 1993, 117, 525–533. [Google Scholar] [CrossRef]
  53. Stallcup, W.B. The NG2 proteoglycan: Past insights and future prospects. J. Neurocytol. 2002, 31, 423–435. [Google Scholar] [CrossRef] [PubMed]
  54. Moyon, S.; Dubessy, A.L.; Aigrot, M.S.; Trotter, M.; Huang, J.K.; Dauphinot, L.; Potier, M.C.; Kerninon, C.; Melik Parsadaniantz, S.; Franklin, R.J.; et al. Demyelination causes adult CNS progenitors to revert to an immature state and express immune cues that support their migration. J. Neurosci. 2015, 35, 4–20. [Google Scholar] [CrossRef] [PubMed] [Green Version]
  55. Dawson, M.R.; Polito, A.; Levine, J.M.; Reynolds, R. NG2-expressing glial progenitor cells: An abundant and widespread population of cycling cells in the adult rat CNS. Mol. Cell. Neurosci. 2003, 24, 476–488. [Google Scholar] [CrossRef] [PubMed]
  56. Ferreira, A.; Caceres, A. Expression of the class III beta-tubulin isotype in developing neurons in culture. J. Neurosci. Res. 1992, 32, 516–529. [Google Scholar] [CrossRef]
  57. Jiang, Y.Q.; Oblinger, M.M. Differential regulation of beta III and other tubulin genes during peripheral and central neuron development. J. Cell Sci. 1992, 103 Pt. 3, 643–651. [Google Scholar] [CrossRef]
  58. Mori, N.; Morii, H. SCG10-related neuronal growth-associated proteins in neural development, plasticity, degeneration, and aging. J. Neurosci. Res. 2002, 70, 264–273. [Google Scholar] [CrossRef]
  59. Di Paolo, G.; Pellier, V.; Catsicas, M.; Antonsson, B.; Catsicas, S.; Grenningloh, G. The phosphoprotein stathmin is essential for nerve growth factor-stimulated differentiation. J. Cell Biol. 1996, 133, 1383–1390. [Google Scholar] [CrossRef]
  60. Nielsen, S.; Nagelhus, E.A.; Amiry-Moghaddam, M.; Bourque, C.; Agre, P.; Ottersen, O.P. Specialized membrane domains for water transport in glial cells: High-resolution immunogold cytochemistry of aquaporin-4 in rat brain. J. Neurosci. 1997, 17, 171–180. [Google Scholar] [CrossRef] [Green Version]
  61. Fonseca, M.I.; Chu, S.H.; Hernandez, M.X.; Fang, M.J.; Modarresi, L.; Selvan, P.; MacGregor, G.R.; Tenner, A.J. Cell-specific deletion of C1qa identifies microglia as the dominant source of C1q in mouse brain. J. Neuroinflamm. 2017, 14, 48. [Google Scholar] [CrossRef] [PubMed] [Green Version]
  62. Nitta, T.; Hata, M.; Gotoh, S.; Seo, Y.; Sasaki, H.; Hashimoto, N.; Furuse, M.; Tsukita, S. Size-selective loosening of the blood-brain barrier in claudin-5-deficient mice. J. Cell Biol. 2003, 161, 653–660. [Google Scholar] [CrossRef]
  63. Nico, B.; Ribatti, D.; Frigeri, A.; Nicchia, G.P.; Corsi, P.; Svelto, M.; Roncali, L. Aquaporin-4 expression during development of the cerebellum. Cerebellum 2002, 1, 207–212. [Google Scholar] [CrossRef]
  64. Stevens, B.; Allen, N.J.; Vazquez, L.E.; Howell, G.R.; Christopherson, K.S.; Nouri, N.; Micheva, K.D.; Mehalow, A.K.; Huberman, A.D.; Stafford, B.; et al. The classical complement cascade mediates CNS synapse elimination. Cell 2007, 131, 1164–1178. [Google Scholar] [CrossRef] [Green Version]
  65. Morita, K.; Sasaki, H.; Furuse, M.; Tsukita, S. Endothelial claudin: Claudin-5/TMVCF constitutes tight junction strands in endothelial cells. J. Cell Biol. 1999, 147, 185–194. [Google Scholar] [CrossRef] [PubMed] [Green Version]
  66. Lein, E.S.; Hawrylycz, M.J.; Ao, N.; Ayres, M.; Bensinger, A.; Bernard, A.; Boe, A.F.; Boguski, M.S.; Brockway, K.S.; Byrnes, E.J.; et al. Genome-wide atlas of gene expression in the adult mouse brain. Nature 2007, 445, 168–176. [Google Scholar] [CrossRef]
  67. Landry, C.F.; Watson, J.B.; Kashima, T.; Campagnoni, A.T. Cellular influences on RNA sorting in neurons and glia: An in situ hybridization histochemical study. Mol. Brain Res. 1994, 27, 1–11. [Google Scholar] [CrossRef]
  68. Chong, S.Y.; Rosenberg, S.S.; Fancy, S.P.; Zhao, C.; Shen, Y.A.; Hahn, A.T.; McGee, A.W.; Xu, X.; Zheng, B.; Zhang, L.I.; et al. Neurite outgrowth inhibitor Nogo-A establishes spatial segregation and extent of oligodendrocyte myelination. Proc. Natl. Acad. Sci. USA 2012, 109, 1299–1304. [Google Scholar] [CrossRef] [Green Version]
  69. Baumann, N.; Pham-Dinh, D. Biology of Oligodendrocyte and Myelin in the Mammalian Central Nervous System. Physiol. Rev. 2001, 81, 871–927. [Google Scholar] [CrossRef] [PubMed]
  70. Holt, C.E.; Martin, K.C.; Schuman, E.M. Local translation in neurons: Visualization and function. Nat. Struct. Mol. Biol. 2019, 26, 557–566. [Google Scholar] [CrossRef] [PubMed]
  71. Colman, D.R.; Kreibich, G.; Frey, A.B.; Sabatini, D.D. Synthesis and incorporation of myelin polypeptides into CNS myelin. J. Cell Biol. 1982, 95, 598–608. [Google Scholar] [CrossRef]
  72. Tushev, G.; Glock, C.; Heumuller, M.; Biever, A.; Jovanovic, M.; Schuman, E.M. Alternative 3′ UTRs Modify the Localization, Regulatory Potential, Stability, and Plasticity of mRNAs in Neuronal Compartments. Neuron 2018, 98, 495–511.e6. [Google Scholar] [CrossRef] [Green Version]
  73. LoPresti, P. Regulation and differential expression of tau mRNA isoforms as oligodendrocytes mature in vivo: Implications for myelination. Glia 2002, 37, 250–257. [Google Scholar] [CrossRef]
  74. Pfeiffer, S.E.; Warrington, A.E.; Bansal, R. The oligodendrocyte and its many cellular processes. Trends Cell Biol. 1993, 3, 191–197. [Google Scholar] [CrossRef] [PubMed]
  75. Waehneldt, T.V. Phylogeny of myelin proteins. Ann. N. Y. Acad.Sci. 1990, 605, 15–28. [Google Scholar] [CrossRef]
  76. Gould, R. Neuron Glia Biology. Commentary. Neuron Glia Biol. 2008, 4, 57–58. [Google Scholar]
  77. Gould, R.M.; Dawson, R.M.C. Incorporation of newly formed lecithin into peripheral nerve myelin. J. Cell Biol. 1976, 68, 480–496. [Google Scholar] [CrossRef] [PubMed]
  78. Gould, R.M.; Sinatra, R.S. Internodal distribution of phosphatidylcholine biosynthetic activity in teased peripheral nerve fibers: An autoradiographic study. J. Neurocytol. 1981, 10, 161–167. [Google Scholar] [CrossRef]
  79. Gould, R.M.; Connell, F.; Spivack, W. Phospholipid metabolism in mouse sciatic nerve in vivo. J. Neurochem. 1987, 48, 853–859. [Google Scholar] [CrossRef] [PubMed]
  80. Gould, R.M.; Mattingly, G. Regional localization of RNA, protein and lipid metabolism in Schwann cells in vivo. J. Neurocytol. 1990, 19, 285–301. [Google Scholar] [CrossRef]
  81. Mahalingam, M. Laser Capture Microdissection: Insights into Methods and Applications. Methods Mol. Biol. 2018, 1723, 1–17. [Google Scholar] [CrossRef]
  82. Datta, S.; Malhotra, L.; Dickerson, R.; Chaffee, S.; Sen, C.K.; Roy, S. Laser capture microdissection: Big data from small samples. Histol. Histopathol. 2015, 30, 1255–1269. [Google Scholar] [CrossRef]
  83. Lecuyer, E.; Yoshida, H.; Parthasarathy, N.; Alm, C.; Babak, T.; Cerovina, T.; Hughes, T.R.; Tomancak, P.; Krause, H.M. Global analysis of mRNA localization reveals a prominent role in organizing cellular architecture and function. Cell 2007, 131, 174–187. [Google Scholar] [CrossRef] [Green Version]
  84. Cajigas, I.J.; Tushev, G.; Will, T.J.; tom Dieck, S.; Fuerst, N.; Schuman, E.M. The local transcriptome in the synaptic neuropil revealed by deep sequencing and high-resolution imaging. Neuron 2012, 74, 453–466. [Google Scholar] [CrossRef] [PubMed] [Green Version]
  85. Gumy, L.F.; Yeo, G.S.; Tung, Y.C.; Zivraj, K.H.; Willis, D.; Coppola, G.; Lam, B.Y.; Twiss, J.L.; Holt, C.E.; Fawcett, J.W. Transcriptome analysis of embryonic and adult sensory axons reveals changes in mRNA repertoire localization. RNA 2011, 17, 85–98. [Google Scholar] [CrossRef] [Green Version]
  86. Mazare, N.; Oudart, M.; Cohen-Salmon, M. Local translation in perisynaptic and perivascular astrocytic processes—A means to ensure astrocyte molecular and functional polarity? J. Cell Sci. 2021, 134, jcs251629. [Google Scholar] [CrossRef]
  87. D’Arcy, B.R.; Silver, D.L. Local gene regulation in radial glia: Lessons from across the nervous system. Traffic 2020, 21, 737–748. [Google Scholar] [CrossRef] [PubMed]
  88. Harauz, G.; Boggs, J.M. Myelin management by the 18.5-kDa and 21.5-kDa classic myelin basic protein isoforms. J. Neurochem. 2013, 125, 334–361. [Google Scholar] [CrossRef]
  89. Raasakka, A.; Ruskamo, S.; Kowal, J.; Barker, R.; Baumann, A.; Martel, A.; Tuusa, J.; Myllykoski, M.; Burck, J.; Ulrich, A.S.; et al. Membrane Association Landscape of Myelin Basic Protein Portrays Formation of the Myelin Major Dense Line. Sci. Rep. 2017, 7, 4974. [Google Scholar] [CrossRef] [PubMed] [Green Version]
  90. Gould, R.M.; Oakley, T.; Goldstone, J.V.; Dugas, J.C.; Brady, S.T.; Gow, A. Myelin sheaths are formed with proteins that originated in vertebrate lineages. Neuron Glia Biol. 2008, 4, 137–152. [Google Scholar] [CrossRef] [Green Version]
  91. Wu, L.; Lambert, J.D. Clade-specific genes and the evolutionary origin of novelty; new tools in the toolkit. Semin. Cell Dev. Biol. 2022; in press. [Google Scholar] [CrossRef] [PubMed]
  92. Pahl, N.; Homsi, S.; Morrison, H.G.; Gould, R.M. mRNAs located in Squalus acanthias (spiny dogfish) oligodendrocyte processes. Biol. Bull. 2002, 203, 217–218. [Google Scholar] [CrossRef]
  93. Raasakka, A.; Kursula, P. Flexible Players within the Sheaths: The Intrinsically Disordered Proteins of Myelin in Health and Disease. Cells 2020, 9, 470. [Google Scholar] [CrossRef] [PubMed] [Green Version]
  94. Moscarello, M.A.; Pritzker, L.; Mastronardi, F.G.; Wood, D.D. Peptidylarginine deiminase: A candidate factor in demyelinating disease. J. Neurochem. 2002, 81, 335–343. [Google Scholar] [CrossRef] [PubMed] [Green Version]
  95. Falcao, A.M.; Meijer, M.; Scaglione, A.; Rinwa, P.; Agirre, E.; Liang, J.; Larsen, S.C.; Heskol, A.; Frawley, R.; Klingener, M.; et al. PAD2-Mediated Citrullination Contributes to Efficient Oligodendrocyte Differentiation and Myelination. Cell Rep. 2019, 27, 1090–1102.e10. [Google Scholar] [CrossRef] [Green Version]
  96. Schmitt, S.; Cantuti Castelvetri, L.; Simons, M. Metabolism and functions of lipids in myelin. Biochim. Biophys. Acta (BBA)-Mol. Cell Biol. Lipids 2015, 1851, 999–1005. [Google Scholar] [CrossRef]
  97. Vassall, K.A.; Bamm, V.V.; Harauz, G. MyelStones: The executive roles of myelin basic protein in myelin assembly and destabilization in multiple sclerosis. Biochem. J. 2015, 472, 17–32. [Google Scholar] [CrossRef] [PubMed]
  98. Smirnova, E.V.; Rakitina, T.V.; Ziganshin, R.H.; Arapidi, G.P.; Saratov, G.A.; Kudriaeva, A.A.; Belogurov, A.A. Comprehensive Atlas of the Myelin Basic Protein Interaction Landscape. Biomolecules 2021, 11, 1628. [Google Scholar] [CrossRef] [PubMed]
  99. Larijani, B.; Pytowski, L.; Vaux, D.J. The enigma of phosphoinositides and their derivatives: Their role in regulation of subcellular compartment morphology. Biochim. Biophys. Acta (BBA)-Biomembr. 2022, 1864, 183780. [Google Scholar] [CrossRef]
  100. Bakhti, M.; Aggarwal, S.; Simons, M. Myelin architecture: Zippering membranes tightly together. Cell. Mol. Life Sci. 2014, 71, 1265–1277. [Google Scholar] [CrossRef]
  101. Belgrad, J.; De Pace, R.; Fields, R.D. Autophagy in Myelinating Glia. J. Neurosci. 2020, 40, 256–266. [Google Scholar] [CrossRef]
  102. Baron, W.; Hoekstra, D. On the biogenesis of myelin membranes: Sorting, trafficking and cell polarity. FEBS Lett. 2010, 584, 1760–1770. [Google Scholar] [CrossRef] [PubMed] [Green Version]
  103. Winterstein, C.; Trotter, J.; Kramer-Albers, E.M. Distinct endocytic recycling of myelin proteins promotes oligodendroglial membrane remodeling. J. Cell Sci. 2008, 121, 834–842. [Google Scholar] [CrossRef] [PubMed] [Green Version]
  104. Boucrot, E.; Ferreira, A.P.; Almeida-Souza, L.; Debard, S.; Vallis, Y.; Howard, G.; Bertot, L.; Sauvonnet, N.; McMahon, H.T. Endophilin marks and controls a clathrin-independent endocytic pathway. Nature 2015, 517, 460–465. [Google Scholar] [CrossRef] [PubMed]
  105. Kjaerulff, O.; Brodin, L.; Jung, A. The structure and function of endophilin proteins. Cell Biochem. Biophys. 2011, 60, 137–154. [Google Scholar] [CrossRef]
  106. Nowak, J.; Archange, C.; Tardivel-Lacombe, J.; Pontarotti, P.; Pebusque, M.J.; Vaccaro, M.I.; Velasco, G.; Dagorn, J.C.; Iovanna, J.L. The TP53INP2 protein is required for autophagy in mammalian cells. Mol. Biol. Cell 2009, 20, 870–881. [Google Scholar] [CrossRef] [Green Version]
  107. Goncalves, J.C.; Dantas, T.J.; Vallee, R.B. Distinct roles for dynein light intermediate chains in neurogenesis, migration, and terminal somal translocation. J. Cell Biol. 2019, 218, 808–819. [Google Scholar] [CrossRef] [Green Version]
  108. Kumari, A.; Kumar, C.; Wasnik, N.; Mylavarapu, S.V.S. Dynein light intermediate chains as pivotal determinants of dynein multifunctionality. J. Cell Sci. 2021, 134, jcs254870. [Google Scholar] [CrossRef]
  109. Okada, Y.; Yamazaki, Y.; Sekine-Aizawa, Y.; Hirokawa, N. The neuron-specific kinesin superfamily protein KIF1A is a unique monomeric motor for anterograde axonal transport of synaptic vesicle precursors. Cell 1995, 81, 769–780. [Google Scholar] [CrossRef] [Green Version]
  110. Koushika, S.P. “JIP”ing along the axon: The complex roles of JIPs in axonal transport. BioEssays 2008, 30, 10–14. [Google Scholar] [CrossRef]
  111. Verhey, K.J.; Meyer, D.; Deehan, R.; Blenis, J.; Schnapp, B.J.; Rapoport, T.A.; Margolis, B. Cargo of kinesin identified as JIP scaffolding proteins and associated signaling molecules. J. Cell Biol. 2001, 152, 959–970. [Google Scholar] [CrossRef] [PubMed] [Green Version]
  112. Brickley, K.; Stephenson, F.A. Trafficking kinesin protein (TRAK)-mediated transport of mitochondria in axons of hippocampal neurons. J. Biol. Chem. 2011, 286, 18079–18092. [Google Scholar] [CrossRef] [PubMed] [Green Version]
  113. Fenton, A.R.; Jongens, T.A.; Holzbaur, E.L.F. Mitochondrial adaptor TRAK2 activates and functionally links opposing kinesin and dynein motors. Nat. Commun. 2021, 12, 4578. [Google Scholar] [CrossRef]
  114. Meyer, N.; Rinholm, J.E. Mitochondria in Myelinating Oligodendrocytes: Slow and Out of Breath? Metabolites 2021, 11, 359. [Google Scholar] [CrossRef] [PubMed]
  115. Rinholm, J.E.; Vervaeke, K.; Tadross, M.R.; Tkachuk, A.N.; Kopek, B.G.; Brown, T.A.; Bergersen, L.H.; Clayton, D.A. Movement and structure of mitochondria in oligodendrocytes and their myelin sheaths. Glia 2016, 64, 810–825. [Google Scholar] [CrossRef]
  116. Nakamura, D.S.; Kennedy, T.E. Netrin-1 marshals mitochondrial movement, morphology, and metabolism in myelin. Neural Regen. Res. 2021, 16, 2399–2400. [Google Scholar] [CrossRef]
  117. Battefeld, A.; Popovic, M.A.; de Vries, S.I.; Kole, M.H.P. High-Frequency Microdomain Ca2+ Transients and Waves during Early Myelin Internode Remodeling. Cell Rep. 2019, 26, 182–191.e5. [Google Scholar] [CrossRef] [Green Version]
  118. Muntjes, K.; Devan, S.K.; Reichert, A.S.; Feldbrugge, M. Linking transport and translation of mRNAs with endosomes and mitochondria. EMBO Rep. 2021, 22, e52445. [Google Scholar] [CrossRef]
  119. Gasparski, A.N.; Mason, D.E.; Moissoglu, K.; Mili, S. Regulation and outcomes of localized RNA translation. Wiley Interdiscip. Rev. RNA 2022, 13, e1721. [Google Scholar] [CrossRef]
  120. Wheeler, N.A.; Fuss, B. Extracellular cues influencing oligodendrocyte differentiation and (re)myelination. Exp. Neurol. 2016, 283, 512–530. [Google Scholar] [CrossRef] [Green Version]
  121. Xiao, D.; Su, X.; Gao, H.; Li, X.; Qu, Y. The Roles of Lpar1 in Central Nervous System Disorders and Diseases. Front. Neurosci. 2021, 15, 710473. [Google Scholar] [CrossRef]
  122. Yung, Y.C.; Stoddard, N.C.; Mirendil, H.; Chun, J. Lysophosphatidic Acid signaling in the nervous system. Neuron 2015, 85, 669–682. [Google Scholar] [CrossRef] [Green Version]
  123. Nogaroli, L.; Yuelling, L.M.; Dennis, J.; Gorse, K.; Payne, S.G.; Fuss, B. Lysophosphatidic acid can support the formation of membranous structures and an increase in MBP mRNA levels in differentiating oligodendrocytes. Neurochem. Res. 2009, 34, 182–193. [Google Scholar] [CrossRef] [PubMed] [Green Version]
  124. Olah, J.; Lehotzky, A.; Szunyogh, S.; Szenasi, T.; Orosz, F.; Ovadi, J. Microtubule-Associated Proteins with Regulatory Functions by Day and Pathological Potency at Night. Cells 2020, 9, 357. [Google Scholar] [CrossRef] [PubMed] [Green Version]
  125. Zotter, A.; Bodor, A.; Olah, J.; Hlavanda, E.; Orosz, F.; Perczel, A.; Ovadi, J. Disordered TPPP/p25 binds GTP and displays Mg2+-dependent GTPase activity. FEBS Lett. 2011, 585, 803–808. [Google Scholar] [CrossRef] [Green Version]
  126. Vincze, O.; Tokesi, N.; Olah, J.; Hlavanda, E.; Zotter, A.; Horvath, I.; Lehotzky, A.; Tirian, L.; Medzihradszky, K.F.; Kovacs, J.; et al. Tubulin polymerization promoting proteins (TPPPs): Members of a new family with distinct structures and functions. Biochemistry 2006, 45, 13818–13826. [Google Scholar] [CrossRef]
  127. Kemal, S.; Richardson, H.S.; Dyne, E.D.; Fu, M.M. ER and Golgi trafficking in axons, dendrites, and glial processes. Curr. Opin. Cell Biol. 2022, 78, 102119. [Google Scholar] [CrossRef]
  128. Chen, M.; Xu, L.; Wu, Y.; Soba, P.; Hu, C. The organization and function of the Golgi apparatus in dendrite development and neurological disorders. Genes Dis. 2022; in press. [Google Scholar] [CrossRef]
  129. Agrawal, M.; Welshhans, K. Local Translation Across Neural Development: A Focus on Radial Glial Cells, Axons, and Synaptogenesis. Front. Mol. Neurosci. 2021, 14, 717170. [Google Scholar] [CrossRef] [PubMed]
  130. Trapp, B.D.; Moench, M.; Pulley, E.; Barbosa, E.; Tennekoon, G.I.; Griffin, J. Spatial segregation of mRNA encoding myelin-specific proteins. Proc. Natl. Acad. Sci. USA 1987, 84, 7773–7777. [Google Scholar] [CrossRef] [PubMed] [Green Version]
  131. Breitschopf, H.; Suchanek, G.; Gould, R.M.; Colman, D.R.; Lassmann, H. In situ hybridization with digoxigenin-labeled probes: Sensitive and reliable detection method applied to myelinating rat brain. Acta Neuropathol. 1992, 84, 581–587. [Google Scholar] [CrossRef]
  132. de Vries, H.; de Jonge, J.C.; Schrage, C.; van der Haar, M.E.; Hoekstra, D. Differential and cell development-dependent localization of myelin mRNAs in oligodendrocytes. J. Neurosci. Res. 1997, 47, 479–488. [Google Scholar] [CrossRef]
  133. Le, P.; Ahmed, N.; Yeo, G.W. Illuminating RNA biology through imaging. Nat. Cell Biol. 2022, 24, 815–824. [Google Scholar] [CrossRef]
  134. Pichon, X.; Lagha, M.; Mueller, F.; Bertrand, E. A Growing Toolbox to Image Gene Expression in Single Cells: Sensitive Approaches for Demanding Challenges. Mol. Cell 2018, 71, 468–480. [Google Scholar] [CrossRef] [PubMed] [Green Version]
  135. Safieddine, A.; Coleno, E.; Lionneton, F.; Traboulsi, A.M.; Salloum, S.; Lecellier, C.H.; Gostan, T.; Georget, V.; Hassen-Khodja, C.; Imbert, A.; et al. HT-smFISH: A cost-effective and flexible workflow for high-throughput single-molecule RNA imaging. Nat. Protoc. 2022, 18, 157–187. [Google Scholar] [CrossRef] [PubMed]
  136. Alon, S.; Goodwin, D.R.; Sinha, A.; Wassie, A.T.; Chen, F.; Daugharthy, E.R.; Bando, Y.; Kajita, A.; Xue, A.G.; Marrett, K.; et al. Expansion sequencing: Spatially precise in situ transcriptomics in intact biological systems. Science 2021, 371, eaax2656. [Google Scholar] [CrossRef] [PubMed]
  137. Erwig, M.S.; Patzig, J.; Steyer, A.M.; Dibaj, P.; Heilmann, M.; Heilmann, I.; Jung, R.B.; Kusch, K.; Mobius, W.; Jahn, O.; et al. Anillin facilitates septin assembly to prevent pathological outfoldings of central nervous system myelin. eLife 2019, 8, e43888. [Google Scholar] [CrossRef] [PubMed]
  138. Patzig, J.; Erwig, M.S.; Tenzer, S.; Kusch, K.; Dibaj, P.; Möbius, W.; Goebbels, S.; Schaeren-Wiemers, N.; Nave, K.-A.; Werner, H.B. Septin/anillin filaments scaffold central nervous system myelin to accelerate nerve conduction. eLife 2016, 5, e17119. [Google Scholar] [CrossRef] [PubMed]
  139. Trapp, B.D.; Quarles, R.H. Presence of the myelin-associated glycoprotein correlates with alterations in the periodicity of peripheral myelin. J. Cell Biol. 1982, 92, 877–882. [Google Scholar] [CrossRef] [PubMed] [Green Version]
  140. Montag, D.; Giese, K.P.; Bartsch, U.; Martini, R.; Lang, Y.; BlÅthmann, H.; Karthigasan, J.; Kirschner, D.A.; Wintergerst, E.S.; Nave, K.A.; et al. Mice deficient for the myelin-associated glycoprotein show subtle abnormalities in myelin. Neuron 1994, 13, 229–246. [Google Scholar] [CrossRef]
  141. Quarles, R.H. Myelin-associated glycoprotein (MAG): Past, present and beyond. J. Neurochem. 2007, 100, 1431–1448. [Google Scholar] [CrossRef] [PubMed]
  142. Elazar, N.; Vainshtein, A.; Golan, N.; Vijayaragavan, B.; Schaeren-Wiemers, N.; Eshed-Eisenbach, Y.; Peles, E. Axoglial Adhesion by Cadm4 Regulates CNS Myelination. Neuron 2019, 101, 224–231.e5. [Google Scholar] [CrossRef] [Green Version]
  143. Moffitt, J.R.; Lundberg, E.; Heyn, H. The emerging landscape of spatial profiling technologies. Nat. Rev. Genet. 2022, 23, 741–759. [Google Scholar] [CrossRef] [PubMed]
  144. Rao, A.; Barkley, D.; Franca, G.S.; Yanai, I. Exploring tissue architecture using spatial transcriptomics. Nature 2021, 596, 211–220. [Google Scholar] [CrossRef] [PubMed]
  145. Longo, S.K.; Guo, M.G.; Ji, A.L.; Khavari, P.A. Integrating single-cell and spatial transcriptomics to elucidate intercellular tissue dynamics. Nat. Rev. Genet. 2021, 22, 627–644. [Google Scholar] [CrossRef]
  146. Marx, V. Method of the Year: Spatially resolved transcriptomics. Nat. Methods 2021, 18, 9–14. [Google Scholar] [CrossRef]
  147. Stark, R.; Grzelak, M.; Hadfield, J. RNA sequencing: The teenage years. Nat. Rev. Genet. 2019, 20, 631–656. [Google Scholar] [CrossRef]
  148. Zhao, W.; Langfelder, P.; Fuller, T.; Dong, J.; Li, A.; Hovarth, S. Weighted gene coexpression network analysis: State of the art. J. Biopharm. Stat. 2010, 20, 281–300. [Google Scholar] [CrossRef]
  149. Aureli, M.; Grassi, S.; Prioni, S.; Sonnino, S.; Prinetti, A. Lipid membrane domains in the brain. Biochim. Biophys. Acta (BBA)-Mol. Cell Biol. Lipids 2015, 1851, 1006–1016. [Google Scholar] [CrossRef]
  150. Cermenati, G.; Mitro, N.; Audano, M.; Melcangi, R.C.; Crestani, M.; De Fabiani, E.; Caruso, D. Lipids in the nervous system: From biochemistry and molecular biology to patho-physiology. Biochim. Biophys. Acta (BBA)-Mol. Cell Biol. Lipids 2015, 1851, 51–60. [Google Scholar] [CrossRef]
  151. Marangon, D.; Boccazzi, M.; Lecca, D.; Fumagalli, M. Regulation of Oligodendrocyte Functions: Targeting Lipid Metabolism and Extracellular Matrix for Myelin Repair. J. Clin. Med. 2020, 9, 470. [Google Scholar] [CrossRef] [Green Version]
  152. Poitelon, Y.; Kopec, A.M.; Belin, S. Myelin Fat Facts: An Overview of Lipids and Fatty Acid Metabolism. Cells 2020, 9, 812. [Google Scholar] [CrossRef] [Green Version]
  153. Montani, L. Lipids in regulating oligodendrocyte structure and function. Semin. Cell Dev. Biol. 2020, 112, 114–122. [Google Scholar] [CrossRef]
  154. Wattenberg, B.W. Intra- and intercellular trafficking in sphingolipid metabolism in myelination. Adv. Biol. Regul. 2019, 71, 97–103. [Google Scholar] [CrossRef] [PubMed]
  155. Barnes-Velez, J.A.; Aksoy Yasar, F.B.; Hu, J. Myelin lipid metabolism and its role in myelination and myelin maintenance. Innovation 2023, 4, 100360. [Google Scholar] [CrossRef] [PubMed]
  156. Gould, R.M.; Holshek, J.; Silverman, W.; Spivack, W. Localization of phospholipid synthesis to Schwann cells and axons. J. Neurochem. 1987, 48, 1121–1131. [Google Scholar] [CrossRef] [PubMed]
  157. Boiron, F.; Spivack, W.D.; Deshmukh, D.S.; Gould, R.M. Basis for phospholipid incorporation into peripheral nerve myelin. J. Neurochem. 1993, 60, 320–329. [Google Scholar] [CrossRef] [PubMed]
  158. Vos, J.P.; Giudici, M.L.; Van der Bijl, P.; Magni, P.; Marchesini, S.; Van Golde, L.M.G.; Lopes-Cardozo, M. Sphingomyelin is synthesized at the plasma membrane of oligodendrocytes and by purified myelin membranes: A study with fluorescent- and radio-labelled ceramide analogues. FEBS Lett. 1995, 368, 393–396. [Google Scholar] [CrossRef] [PubMed] [Green Version]
Figure 2. Expressions of different cell-type and MASA mRNA—MBRS data. Expression patterns of MBP, MYRF, PDGFRA, TUBB3 and putative MSAS mRNAs are shown for seven neural cell-types acutely isolated from developing mouse brain (MBRS, http://www.brainrnaseq.org, accessed on 30 March 2023). MSAS mRNAs are ordered based on overall expression levels (Figure 1). Enrichment values (NFO/OPC, MO/NFO and neuron/(MO + NFO + OPC) ratios) are placed next to NFO, MO and neuron (TUBB3) columns, respectively, and percentages of total expressions by differentiated oligodendrocytes, DOs (MOs + NFOs) and by MOs (left and right numbers, respectively, above plots) are given. We add expressions from scRS (http://linnarssonlab.org/cortex/, accessed on 30 March 2023) because neurons used in MBRS do not express some neuronal mRNAs (see below). Positive expressions are shown for neurons, astrocytes, microglia and ependymal cells with colored asterisks (*, *, *, *) above the columns that show mRNA levels.
Life 13 00945 g002
Figure 4. Expression patterns of MSAS mRNAs—AMBA and AMSCA images. Images for MSAS mRNAs are arranged in rows assembled in the same way as neural cell-specific mRNAs (Figure 3) and according to enrichment levels obtained in subcellular fractionation analyses (Figure 1). Among MSAS mRNAs, SH3GL3 mRNA was not expressed at detectable levels (ne) in P56 brain and spinal cord and PADI2 mRNA was not included in AMSCA database. Abbreviations identifying brain and spinal cord regions are shown in LPAR1 mRNA ISH images and cell type expression ratings are recorded in EA images the same as was done for neural cell type expressions. Left panels are boxed in colors representing cell-types expressing the mRNAs, with dominant expressions in the outermost boxes. AMSCA assignments are included following the mRNA name and the percentage of total expression by MOs is included after the mRNA name.
Life 13 00945 g004
Figure 5. Distribution of MO and MSAS mRNAs in Mouse Brain and Spinal Cord, high-magnification ISH images. Distribution of MBP, MOBP, CNP and five MSAS mRNAs in P56 mouse fornix, cerebellar white matter, P56 and P4 spinal cord white matter. Links to the images are in Tables S3 and S4. High-magnification images are placed directly below lower-magnification images and asterisks (*) are used to mark areas in low-magnification images examined at high-magnification. Regions where MBP mRNA are expressed in MSAS are shown with arrows as are regions with similar ‘MSAS’ expressions by other mRNAs in high-magnification images. Instances in which we see particle clusters in high-magnification images are marked with arrowheads. As these clusters occur in oligodendrocyte somata-residing images of CNP, PLP1 and CLDN11, we consider them to be false-positives. Asterisks (*), represent regions in low-magnification images that are shown in figures below at high-magnification. Scale bar in MBP mRNA fornix low-magnification images is 240 μm and for the high-magnification image is 50 μm. Other images are at similar magnifications.
Life 13 00945 g005
Table 1. Putative MSAS mRNAs examined in this study.
#MSAS mRNAsGene SymbolMSAS
1Apolipoprotein DAPOD
2Dynein light intermediate chain 2DYNC1LI2++
3Ectonucleotide pyrophosphatase/phosphodiesterase 2 1ENPP2
4GelsolinGSN
5Kinesin family member 1AKIF1A++
6Lysophosphatidic acid receptor 1 2LPAR1
7Mitogen-activated protein kinase 8 interacting protein-1 3MAPK8IP1
8N-myc downstream regulated 1NDRG1
9Peptidylarginine deiminase 2PADI2++
10SH3 domain containing GRB2 like 3/endophilin-A3SH3GL3++
11Tubulin polymerization promoting protein 4TPPP
12Trafficking kinesin protein 2 5 TRAK2++
13Tumor-promoter p53-inducible nuclear protein-2 6 TRP53INP2++
14Carbonic anhydrase 2CAR2
15Crystallin alpha BCRYAB
1 Also known as autotaxin, 2 Also known as EDG2, 3 Also known as JIP1, 4 TPPP was designated as 63OR10 in our publication [18], 5 TRAK2 was designated as 63NA25 in our publication [18], 6 TRP53INP2 was designated as SH3-227 in our publication [18]. Thirteen putative MSAS mRNAs identified in our screens [18] plus two others identified by ISH. Six MSAS mRNAs were enriched in myelin over levels in starting material used for subcellular fractionation as determined by Northern blot (++). References to mRNAs experimentally linked to oligodendrocyte differentiation and/or myelination are: (1) APOD [21,22], (2) ENPP2 [23,24], (3) GSN [25,26], (4) LPAR1 [27], (5) NDRG1 [28,29,30,31], (6) PADI2 [32,33,34,35,36], (7) TPPP [37,38,39], (8) CAR2 [15,40], (9) CRYAB [16,41].
Table 2. Amounts of known MSAS, oligodendrocyte somata, neuron, astrocyte and MSAS mRNAs in myelin vesicles. Comparison of suppression subtractive hybridization (SSH) and mouse myelin transcriptome RNA seq (mmRS) data.
#mRNASSH%MBP mmRS%MBP SSH/RS
kMSAS1MBP44,468 ± 20,315 (10)100.001,265,436 ± 290,298100.001.00
kMSAS2MOBP-81A1191 ± 225 (5)2.6893,503 ± 31,016 * 7.390.36
OLS1PLP11096 ± 471 (4)2.4688,651 ± 62787.010.35
OLS2MOBP-81B36 ± 17 (6)0.08------
OLS3CNP28 ± 12 (4)0.0610,985 ± 5970.870.07
NE1NEFL8 ± 3 (5)0.025693 ± 2550.450.04
AST1GFAP11 ± 4 (3)0.025729 ± 2960.450.04
MSAS1LPAR1156 ± 102 (10)0.356673 ± 9840.530.66
MSAS2NDRG1103 ± 33 (6)0.236334 ± 830.500.46
MSAS3TRAK241 ± 25 (11)0.0919,253 ± 53711.520.06
MSAS4APOD33 ± 14 (11) 0.0712,428 ± 13380.980.07
MSAS5KIF1A23 ± 11 (11) 0.0515,742 ± 22771.240.04
MSAS6TPPP19 ± 15 (9)0.049353 ± 21010.740.05
MSAS7SH3GL317 ± 4 (13)0.044343 ± 3470.340.12
MSAS8ENPP27 ± 2 (11)0.0212,016 ± 13710.950.02
MSAS9GSN3 ± 2 (8) 0.011992 ± 1810.160.06
MSAS10MAPK81P12 ± 2 (8) 0.005269 ± 2050.42<0.01
MSAS11TRP53INP21 ± 1 (7) 0.00491 ± 430.04<0.01
MSAS12PADI2----760 ± 710.06--
MSAS13DYNC1LI2----17,565 ± 42341.39--
* Value is for total MOBP mRNA, measured with primers that include all splice variants. Amount ± standard deviation (μg/μl) with numbers of replicates (parentheses) in myelin subfractions were quantified by RT-qPCR with primers listed in Table S1. Comparisons were made with mRNAs (normalized read count) in P72 mouse brain myelin ± standard deviation (mmRS, mouse brain myelin transcriptome, RNA seq, n = 3, Supplementary Table S1 [20]). Percentages relative to MBP mRNA are given for both data sets. To facilitate comparisons, SSH/mmRS ratios of %MBP mRNA were included. Abbreviations: kMSAS, known MSAS; OLS, oligodendrocyte somata; NE, neuron; AST, astrocyte; and putative MSAS mRNAs.
Disclaimer/Publisher’s Note: The statements, opinions and data contained in all publications are solely those of the individual author(s) and contributor(s) and not of MDPI and/or the editor(s). MDPI and/or the editor(s) disclaim responsibility for any injury to people or property resulting from any ideas, methods, instructions or products referred to in the content.

