

Imaging of Cartilage and Chondral Defects: An Overview

Abstract
:1. Introduction
2. Anatomy
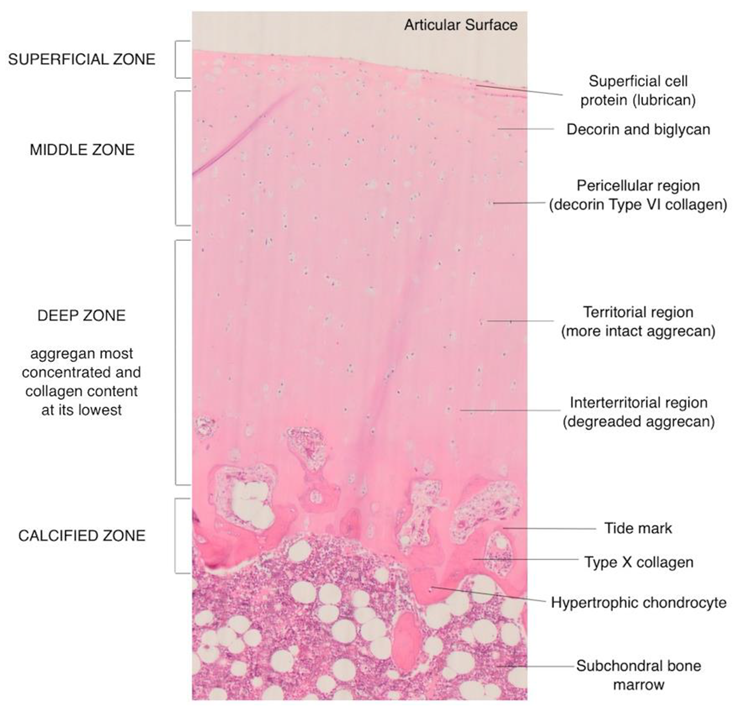
Microscopic Structure
- Superficial or tangential zone. This is the thinnest layer which is adjacent and parallel to the joint surface and is made up of flattened cells. With the highest water content and greatest tensile strength, the integrity of this layer is crucial to prevent osteoarthritis.
- Transitional or intermediate zone. Spheroidal cells are found in this zone along with randomly oriented collagen fibers.
- Middle zone. The lowest cell density with the highest proteoglycan content is found in this layer. The cells are arranged in a perpendicular orientation to the surface.
- Calcified cartilage zone. It is a mineralized zone acting as a shock absorber along with the subchondral bone. Owing to the low number of cells in a calcified matrix, there is a very low metabolic activity in this zone.
3. Cartilage Imaging
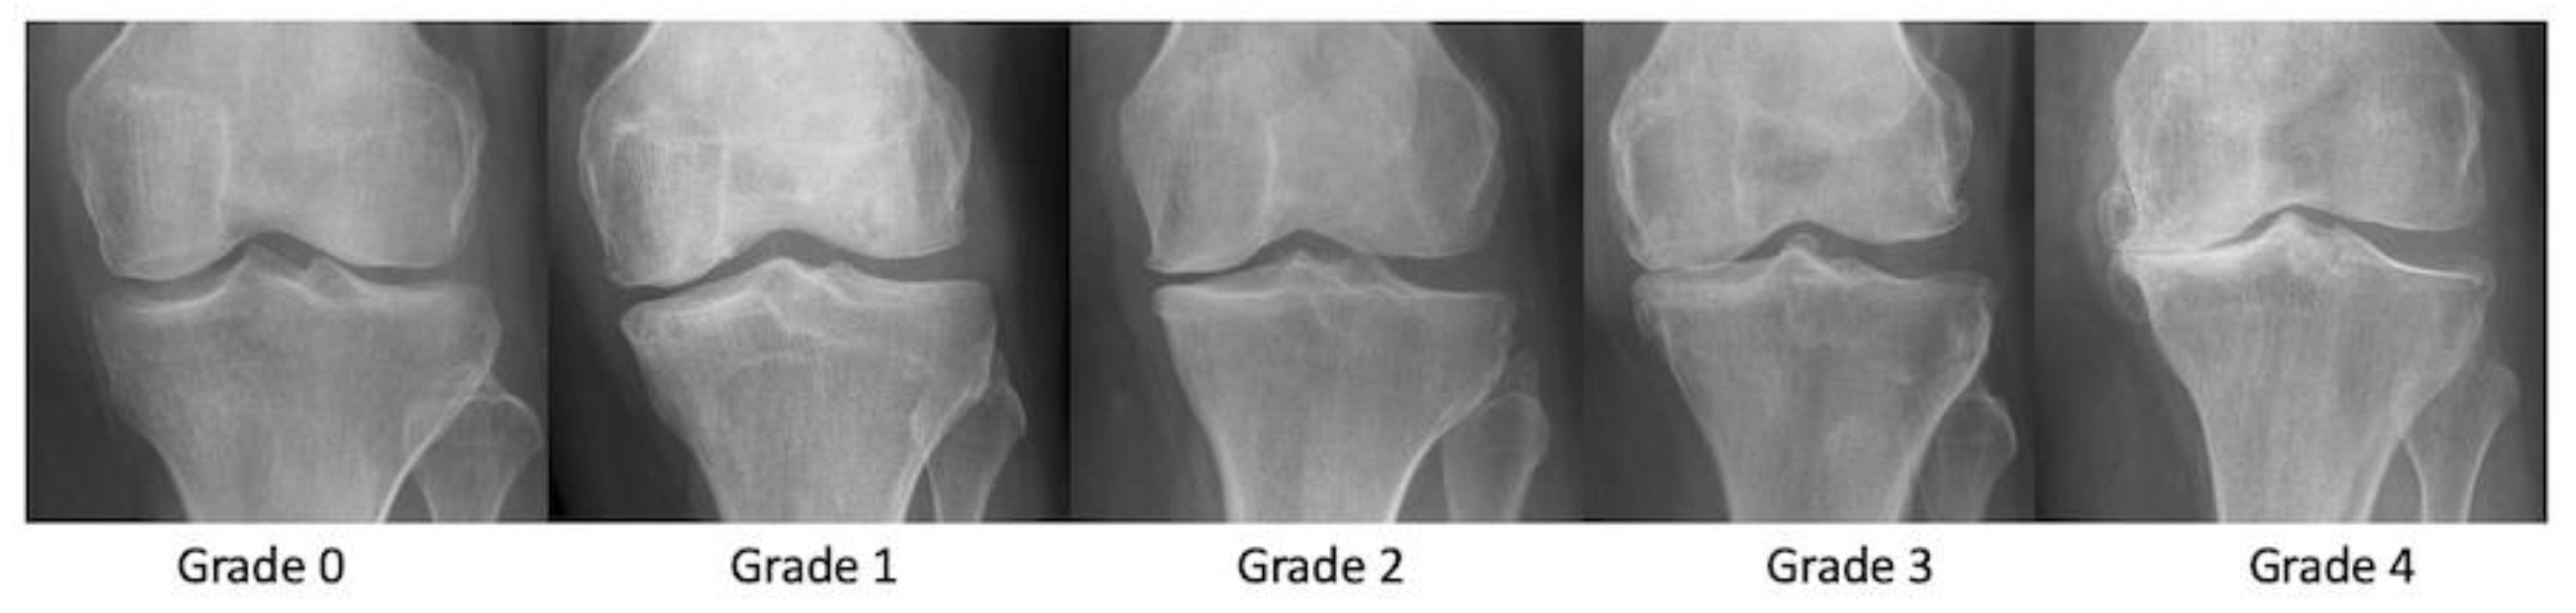
3.1. Radiographs
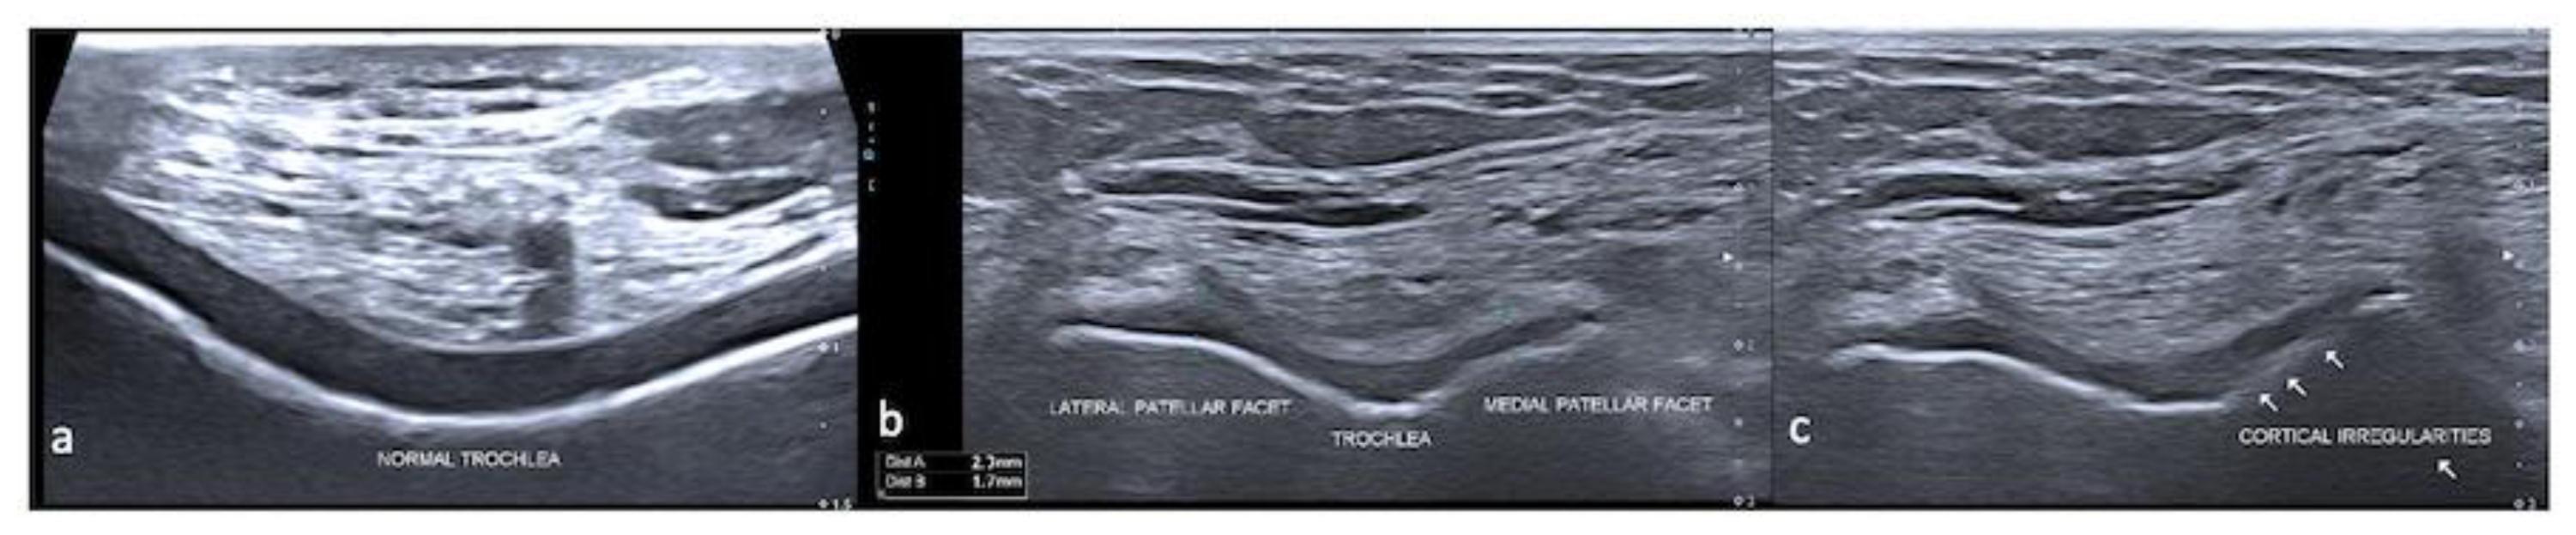
3.2. Ultrasound
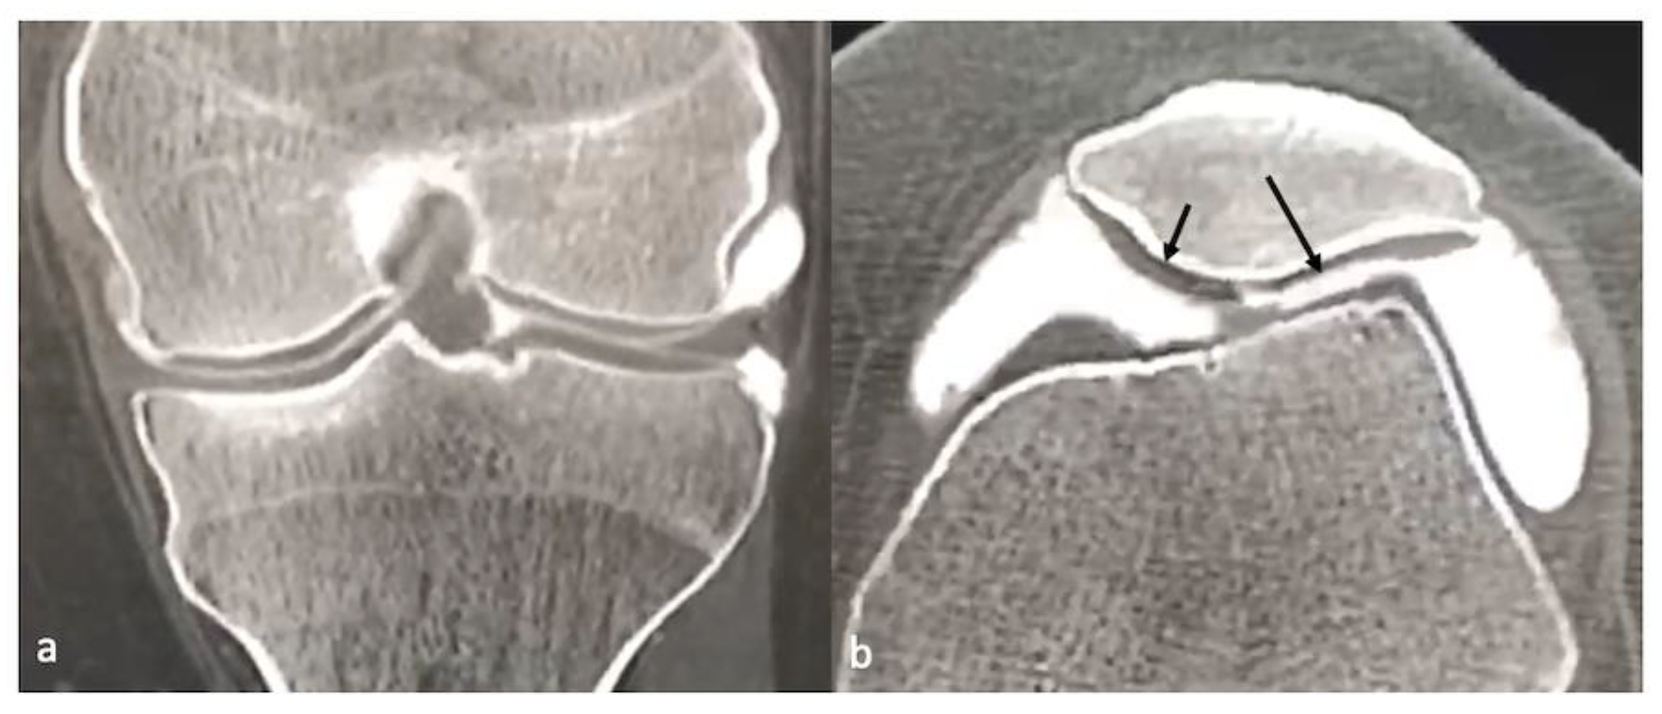
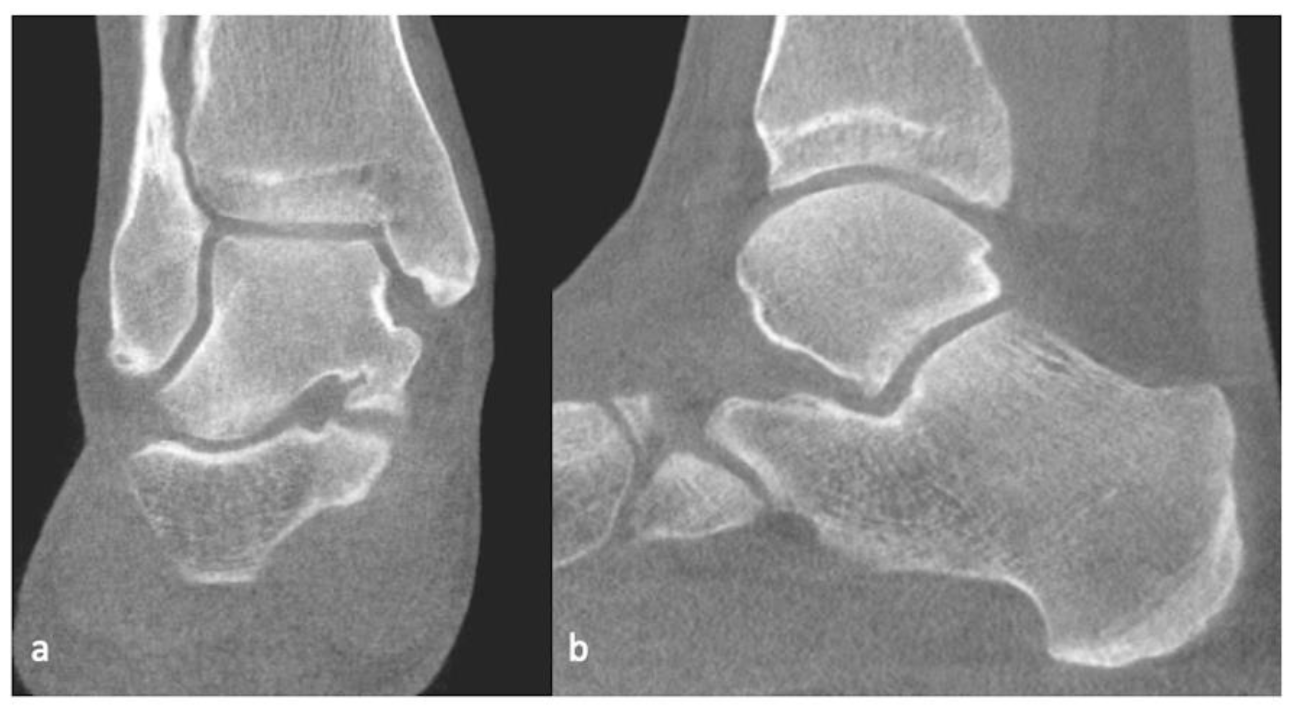
3.3. CT/CT Arthrogram
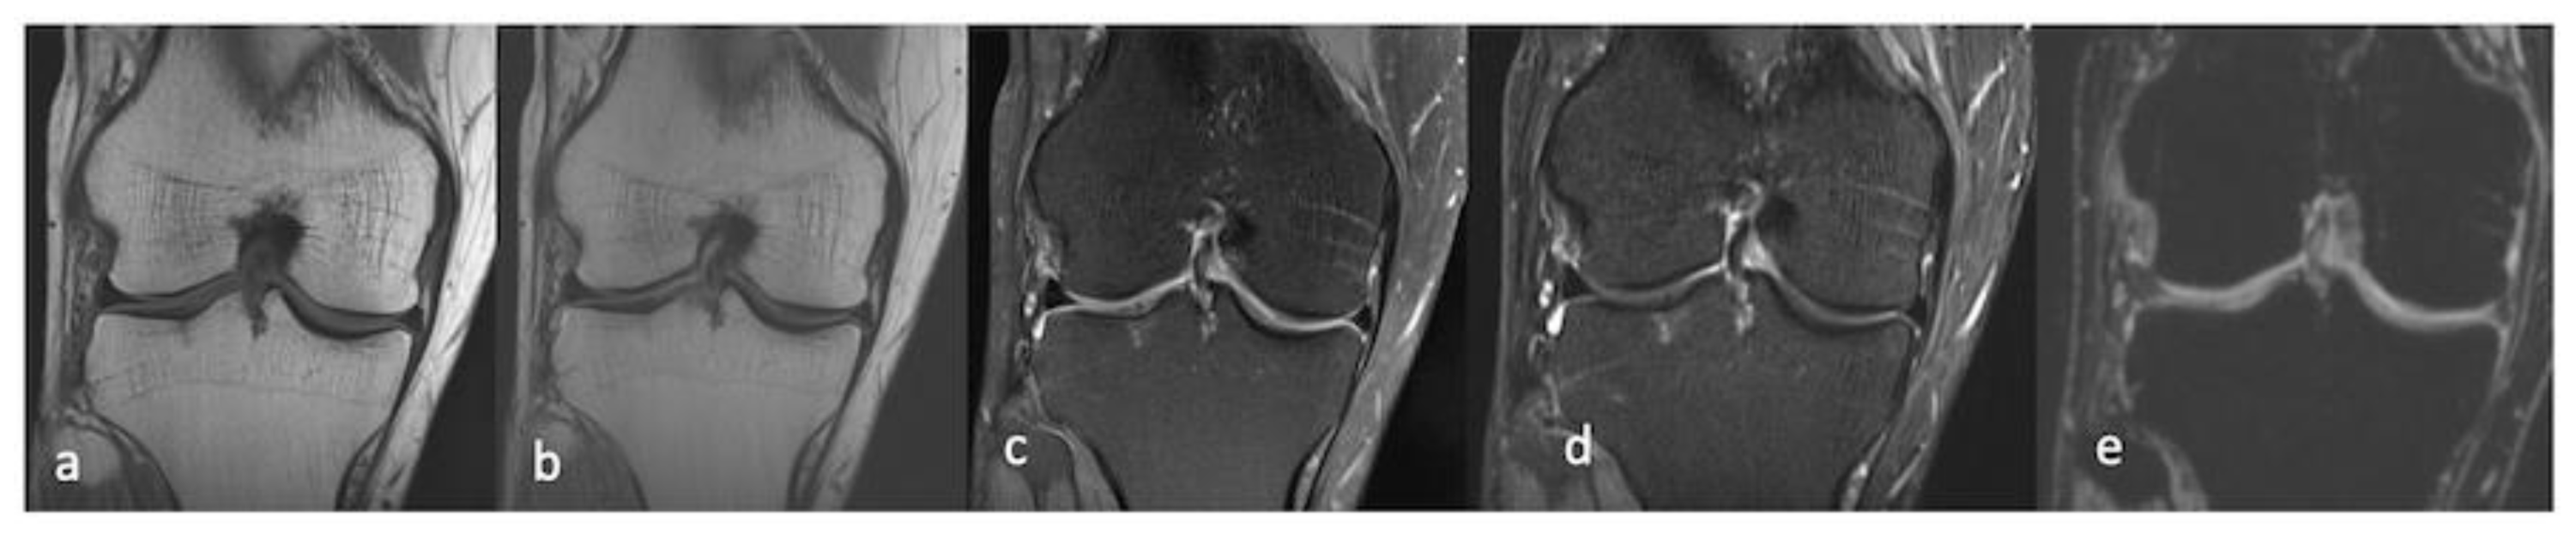
3.4. MRI
3.4.1. Morphological Sequences
3.4.2. Compositional Sequences
T2 and T2* Mapping
Gd-Enhanced MRI (dGEMRI)
T1ρ Imaging
Sodium MRI
gagCEST
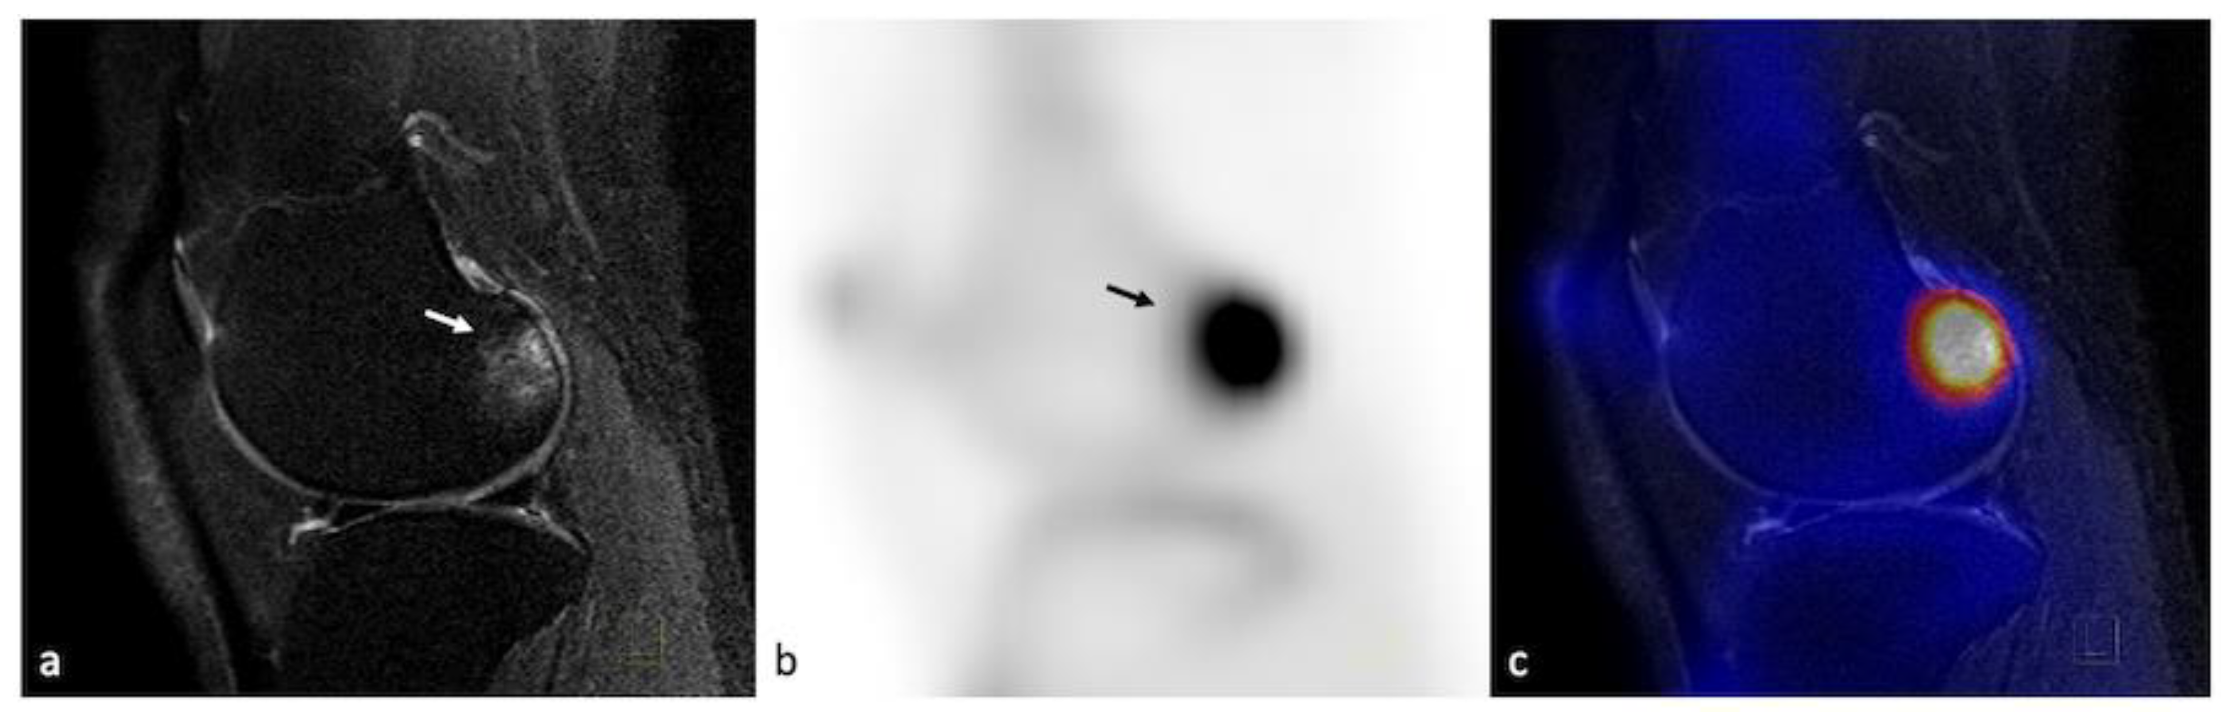
3.5. Integrated PET–MRI
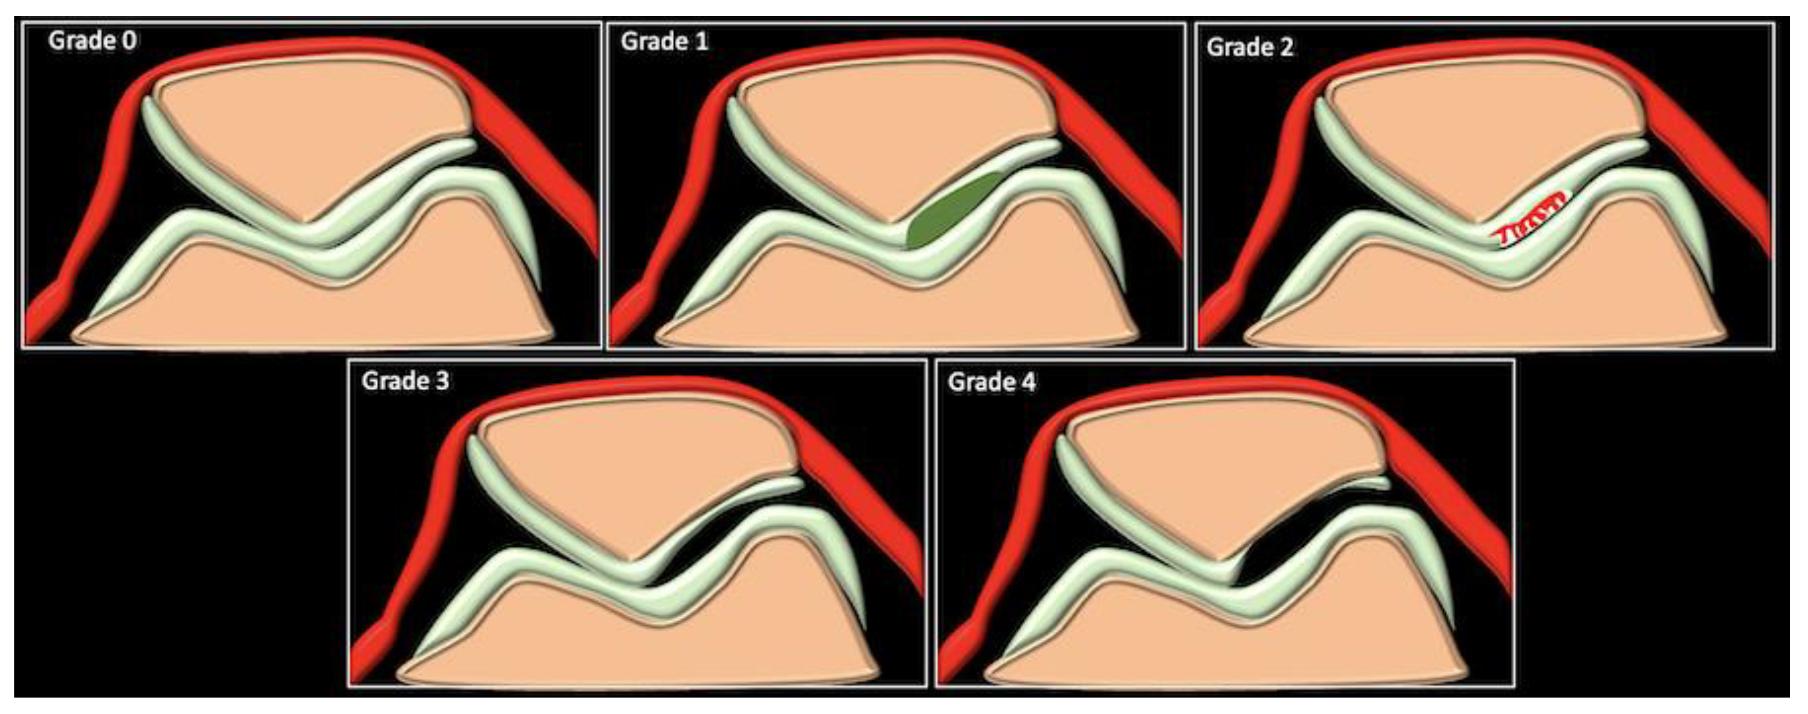
4. Pathologies
5. Imaging Evaluation of Cartilage Repair Procedures
6. Conclusions
Author Contributions
Funding
Institutional Review Board Statement
Informed Consent Statement
Data Availability Statement
Conflicts of Interest
References
- Cui, A.; Li, H.; Wang, D.; Zhong, J.; Chen, Y.; Lu, H. Global, regional prevalence, incidence and risk factors of knee osteoarthritis in population-based studies. Eclinicalmedicine 2020, 29–30, 100587. [Google Scholar] [CrossRef] [PubMed]
- Sophia Fox, A.J.; Bedi, A.; Rodeo, S.A. The Basic Science of Articular Cartilage: Structure, Composition, and Function. Sport. Health A Multidiscip. Approach 2009, 1, 461–468. [Google Scholar] [CrossRef] [PubMed]
- Bhosale, A.M.; Richardson, J.B. Articular cartilage: Structure, injuries and review of management. Br. Med. Bull. 2008, 87, 77–95. [Google Scholar] [CrossRef]
- Alford, J.W.; Cole, B.J. Cartilage Restoration, Part 1. Am. J. Sport. Med. 2005, 33, 295–306. [Google Scholar] [CrossRef]
- Decker, R.S.; Koyama, E.; Pacifici, M. Articular Cartilage: Structural and Developmental Intricacies and Questions. Curr. Osteoporos. Rep. 2015, 13, 407–414. [Google Scholar] [CrossRef] [PubMed]
- Mollenhauer, J.; Aurich, M.E.; Zhong, Z.; Muehleman, C.; Cole, A.A.; Hasnah, M.; Oltulu, O.; Kuettner, K.E.; Margulis, A.; Chapman, L.D. Diffraction-enhanced X-ray imaging of articular cartilage. Osteoarthr. Cartil. 2002, 10, 163–171. [Google Scholar] [CrossRef]
- Aisen, A.M.; McCune, W.J.; Macguire, A.; Carson, P.L.; Silver, T.M.; Jafri, S.Z.; Martel, W. Sonographic evaluation of the cartilage of the knee. Radiology 1984, 153, 781–784. [Google Scholar] [CrossRef]
- Lee, C.-L.; Huang, M.-H.; Chai, C.-Y.; Chen, C.-H.; Su, J.-Y.; Tien, Y.-C. The validity of in vivo ultrasonographic grading of osteoarthritic femoral condylar cartilage: A comparison with in vitro ultrasonographic and histologic gradings. Osteoarthr. Cartil. 2008, 16, 352–358. [Google Scholar] [CrossRef]
- Maeguchi, K.; Ito, H.; Morita, Y.; Furu, M.; Fujii, T.; Azukizawa, M.; Okahata, A.; Nishitani, K.; Kuriyama, S.; Nakamura, S.; et al. How precisely does ultrasonographic evaluation reflect the histological status of the articular cartilage of the knee joint? J Orthop. 2018, 15, 636–640. [Google Scholar] [CrossRef]
- Iagnocco, A. Imaging the joint in osteoarthritis: A place for ultrasound? Best Pract. Res. Clin. Rheumatol. 2010, 24, 27–38. [Google Scholar] [CrossRef]
- Meenagh, G.; Iagnocco, A.; Filippucci, E.; Riente, L.; Sedie, A.D.; Bombardieri, S.; Valesini, G.; Grassi, W. Ultrasound imaging for the rheumatologist IV. Ultrasonography of the knee. Clin. Exp. Rheumatol. 2006, 24, 357–360. [Google Scholar] [PubMed]
- Vlad, V.; Micu, M.; Porta, F.; Radunovic, G.; Nestorova, R.; Petranova, T.; Cerinic, M.M.; Iagnocco, A. Ultrasound of the hand and wrist in rheumatology. Med. Ultrason. 2012, 14, 42–48. [Google Scholar] [PubMed]
- Roemer, F.W.; Demehri, S.; Omoumi, P.; Link, T.M.; Kijowski, R.; Saarakkala, S.; Crema, M.D.; Guermazi, A. State of the Art: Imaging of Osteoarthritis—Revisited 2020. Radiology 2020, 296, 5–21. [Google Scholar] [CrossRef]
- Yoo, H.J.; Hong, S.H.; Choi, J.-Y.; Lee, I.J.; Kim, S.J.; Kang, H.S. Contrast-enhanced CT of Articular Cartilage: Experimental Study for Quantification of Glycosaminoglycan Content in Articular Cartilage. Radiology 2011, 261, 805–812. [Google Scholar] [CrossRef]
- Carrino, J.A.; al Muhit, A.; Zbijewski, W.; Thawait, G.K.; Stayman, J.W.; Packard, N.; Senn, R.; Yang, D.; Foos, D.H.; Yorkston, J.; et al. Dedicated Cone-Beam CT System for Extremity Imaging. Radiology 2014, 270, 816–824. [Google Scholar] [CrossRef] [PubMed]
- Demehri, S.; Muhit, A.; Zbijewski, W.; Stayman, J.W.; Yorkston, J.; Packard, N.; Senn, R.; Yang, D.; Foos, D.; Thawait, G.K.; et al. Assessment of image quality in soft tissue and bone visualization tasks for a dedicated extremity cone-beam CT system. Eur. Radiol. 2015, 25, 1742–1751. [Google Scholar] [CrossRef] [PubMed]
- Barr, C.; Bauer, J.S.; Malfair, D.; Ma, B.; Henning, T.D.; Steinbach, L.; Link, T.M. MR imaging of the ankle at 3 Tesla and 1.5 Tesla: Protocol optimization and application to cartilage, ligament and tendon pathology in cadaver specimens. Eur. Radiol. 2006, 17, 1518–1528. [Google Scholar] [CrossRef]
- Oei, E.H.; Wick, M.C.; Müller-Lutz, A.; Schleich, C.; Miese, F.R. Cartilage Imaging: Techniques and Developments. Semin. Musculoskelet. Radiol. 2018, 22, 245–260. [Google Scholar] [CrossRef]
- Eagle, S.; Potter, H.G.; Koff, M.F. Morphologic and quantitative magnetic resonance imaging of knee articular cartilage for the assessment of post-traumatic osteoarthritis. J. Orthop. Res. 2016, 35, 412–423. [Google Scholar] [CrossRef]
- Mamisch, T.C.; Trattnig, S.; Quirbach, S.; Marlovits, S.; White, L.M.; Welsch, G.H. Quantitative T2 Mapping of Knee Cartilage: Dif-ferentiation of Healthy Control Cartilage and Cartilage Repair Tissue in the Knee with Unloading—Initial Results. Radiology 2010, 254, 818–826. [Google Scholar] [CrossRef]
- Mars, M.; Tbini, Z.; Gharbi, S.; Bouaziz, M.C.; Ladeb, F. T2 Versus T2* MRI Mapping in the Knee Articular Cartilage at 1.5 Tesla and 3 Tesla. Open Med. J. 2018, 5, 119–129. [Google Scholar] [CrossRef]
- Fleming, B.; Oksendahl, H.; Mehan, W.; Portnoy, R.; Fadale, P.; Hulstyn, M.; Bowers, M.; Machan, J.; Tung, G. Delayed Gadolinium-Enhanced MR Imaging of Cartilage (dGEMRIC) following ACL injury. Osteoarthr. Cartil. 2010, 18, 662–667. [Google Scholar] [CrossRef] [PubMed]
- Schmaranzer, F.; Haefeli, P.C.; Hanke, M.S.; Liechti, E.F.; Werlen, S.F.; Siebenrock, K.A.; Tannast, M. How Does the dGEMRIC Index Change After Surgical Treatment for FAI? A Prospective Controlled Study: Preliminary Results. Clin. Orthop. Relat. Res. 2017, 475, 1080–1099. [Google Scholar] [CrossRef] [PubMed]
- Watanabe, A.; Wada, Y.; Obata, T.; Ueda, T.; Tamura, M.; Ikehira, H.; Moriya, H. Delayed Gadolinium-enhanced MR to Determine Gly-cosaminoglycan Concentration in Reparative Cartilage after Autologous Chondrocyte Implantation: Preliminary Results. Radiology 2006, 239, 201–208. [Google Scholar] [CrossRef]
- Stahl, R.; Luke, A.; Li, X.; Carballido-Gamio, J.; Ma, C.B.; Majumdar, S.; Link, T.M. T1rho, T2 and focal knee cartilage abnormalities in physically active and sedentary healthy subjects versus early OA patients—A 3. 0-Tesla MRI study. Eur. Radiol. 2009, 19, 132–143. [Google Scholar] [CrossRef]
- Li, Z.; Wang, H.; Lu, Y.; Jiang, M.; Chen, Z.; Xi, X.; Ding, X.; Yan, F. Diagnostic value of T1ρ and T2 mapping sequences of 3D fat-suppressed spoiled gradient (FS SPGR-3D) 3.0-T magnetic resonance imaging for osteoarthritis. Medicine 2019, 98, e13834. [Google Scholar] [CrossRef]
- Le, J.; Peng, Q.; Sperling, K. Biochemical magnetic resonance imaging of knee articular cartilage: T1rho and T2 mapping as car-tilage degeneration biomarkers. Ann. N. Y. Acad. Sci. 2016, 1383, 34–42. [Google Scholar] [CrossRef]
- Bolbos, R.; Link, T.; Ma, C.B.; Majumdar, S.; Li, X. T1ρ relaxation time of the meniscus and its relationship with T1ρ of adjacent cartilage in knees with acute ACL injuries at 3T. Osteoarthr. Cartil. 2009, 17, 12–18. [Google Scholar] [CrossRef]
- Rakhra, K.S.; Melkus, G.; Anwander, H.; E Beaulé, P. T1ρ MRI detects cartilage damage in asymptomatic individuals with a cam deformity. J. Orthop. Res. 2016, 34, 1004–1009. [Google Scholar]
- Wheaton, A.J.; Borthakur, A.; Shapiro, E.M.; Regatte, R.R.; Akella, S.V.S.; Kneeland, J.B.; Reddy, R. Proteoglycan Loss in Human Knee Cartilage: Quantitation with Sodium MR Imaging—Feasibility Study. Radiology 2004, 231, 900–905. [Google Scholar] [CrossRef]
- Madelin, G.; Babb, J.S.; Xia, D.; Chang, G.; Jerschow, A.; Regatte, R.R. Reproducibility and repeatability of quantitative sodium mag-netic resonance imaging in vivo in articular cartilage at 3 T and 7 T. Magn. Reson. Med. 2012, 68, 841–849. [Google Scholar] [CrossRef] [PubMed]
- Kogan, F.; Hargreaves, B.A.; Gold, G.E. Volumetric multislice gagCEST imaging of articular cartilage: Optimization and comparison with T1rho. Magn. Reson. Med. 2016, 77, 1134–1141. [Google Scholar] [CrossRef] [PubMed]
- Schmitt, B.; Zbýň, Š.; Stelzeneder, D.; Jellus, V.; Paul, D.; Lauer, L.; Bachert, P.; Trattnig, S. Cartilage Quality Assessment by Using Glycosaminoglycan Chemical Exchange Saturation Transfer and 23Na MR Imaging at 7 T. Radiology 2011, 260, 257–264. [Google Scholar] [CrossRef]
- Nakamura, H.; Masuko, K.; Yudoh, K.; Kato, T.; Nishioka, K.; Sugihara, T.; Beppu, M. Positron emission tomography with 18F-FDG in osteoarthritic knee. Osteoarthr. Cartil. 2007, 15, 673–681. [Google Scholar] [CrossRef]
- Kobayashi, N.; Inaba, Y.; Tateishi, U.; Yukizawa, Y.; Ike, H.; Inoue, T.; Saito, T. New Application of 18F-Fluoride PET for the Detection of Bone Remodeling in Early-Stage Osteoarthritis of the Hip. Clin. Nucl. Med. 2013, 38, e379–e383. [Google Scholar] [CrossRef] [PubMed]
- Jena, A.; Taneja, S.; Rana, P.; Goyal, N.; Vaish, A.; Botchu, R.; Vaishya, R. Emerging role of integrated PET-MRI in osteoarthritis. Skelet. Radiol. 2021, 50, 2349–2363. [Google Scholar] [CrossRef]
- Sofu, H.; Oner, A.; Camurcu, Y.; Gursu, S.; Ucpunar, H.; Sahin, V. Predictors of the Clinical Outcome After Arthroscopic Partial Meniscectomy for Acute Trauma–Related Symptomatic Medial Meniscal Tear in Patients More Than 60 Years of Age. Arthrosc. J. Arthrosc. Relat. Surg. 2016, 32, 1125–1132. [Google Scholar] [CrossRef]
- Kemp, J.L.; Makdissi, M.; Schache, A.G.; Pritchard, M.G.; Pollard, T.C.B.; Crossley, K.M. Hip chondropathy at arthroscopy: Prevalence and relationship to labral pathology, femoroacetabular impingement and patient-reported outcomes. Br. J. Sport. Med. 2014, 48, 1102–1107. [Google Scholar] [CrossRef]
- Bateman, D.K.; Black, E.M.; Lazarus, M.D.; Abboud, J.A. Outcomes Following Arthroscopic Repair of Posterior Labral Tears in Patients Older Than 35 Years. Orthopedics 2017, 40, e305–e311. [Google Scholar] [CrossRef]
- Slattery, C.; Kweon, C.Y. Classifications in Brief: Outerbridge Classification of Chondral Lesions. Clin. Orthop. Relat. Res. 2018, 476, 2101–2104. [Google Scholar] [CrossRef]
- Peterfy, C.; Guermazi, A.; Zaim, S.; Tirman, P.; Miaux, Y.; White, D.; Kothari, M.; Lu, Y.; Fye, K.; Zhao, S.; et al. Whole-Organ Magnetic Resonance Imaging Score (WORMS) of the knee in osteoarthritis. Osteoarthr. Cartil. 2004, 12, 177–190. [Google Scholar] [CrossRef] [PubMed]
- Kornaat, P.R.; Ceulemans, R.Y.T.; Kroon, H.M.; Riyazi, N.; Kloppenburg, M.; Carter, W.O.; Woodworth, T.G.; Bloem, J.L. MRI assessment of knee osteoarthritis: Knee Osteoarthritis Scoring System (KOSS)?inter-observer and intra-observer reproducibility of a compartment-based scoring system. Skelet. Radiol. 2004, 34, 95–102. [Google Scholar] [CrossRef]
- Hunter, D.J.; Lo, G.H.; Gale, D.; Grainger, A.J.; Guermazi, A.; Conaghan, P.G. The reliability of a new scoring system for knee osteo-arthritis MRI and the validity of bone marrow lesion assessment: BLOKS (Boston–Leeds Osteoarthritis Knee Score). Ann. Rheum. Dis. 2008, 67, 206–211. [Google Scholar] [CrossRef] [PubMed]
- Hunter, D.; Guermazi, A.; Lo, G.; Grainger, A.; Conaghan, P.; Boudreau, R.; Roemer, F. Evolution of semi-quantitative whole joint assessment of knee OA: MOAKS (MRI Osteoarthritis Knee Score). Osteoarthr. Cartil. 2011, 19, 990–1002. [Google Scholar] [CrossRef]
- Colak, C.; Polster, J.M.; Obuchowski, N.A.; Jones, M.H.; Strnad, G.; Gyftopoulos, S.; Spindler, K.P.; Subhas, N. Comparison of Clinical and Semiquantitative Cartilage Grading Systems in Predicting Outcomes After Arthroscopic Partial Meniscectomy. Am. J. Roentgenol. 2020, 215, 441–447. [Google Scholar] [CrossRef]
- Disler, D.G.; McCauley, T.R.; Wirth, C.R.; Fuchs, M.D. Detection of knee hyaline cartilage defects using fat-suppressed three-dimensional spoiled gradient-echo MR imaging: Comparison with standard MR imaging and correlation with arthros-copy. Am. J. Roentgenol. 1995, 165, 377–382. [Google Scholar] [CrossRef]
- Recht, M.P.; Piraino, D.W.; Paletta, G.A.; Schils, J.P.; Belhobek, G.H. Accuracy of fat-suppressed three-dimensional spoiled gradi-ent-echo FLASH MR imaging in the detection of patellofemoral articular cartilage abnormalities. Radiology 1996, 198, 209–212. [Google Scholar] [CrossRef] [PubMed]
- Bredella, M.A.; Tirman, P.F.; Peterfy, C.G.; Zarlingo, M.; Feller, J.F.; Bost, F.W.; Belzer, J.P.; Wischer, T.K.; Genant, H.K. Accuracy of T2-weighted fast spin-echo MR imaging with fat saturation in detecting cartilage defects in the knee: Comparison with arthroscopy in 130 patients. Am. J. Roentgenol. 1999, 172, 1073–1080. [Google Scholar] [CrossRef] [PubMed]
- Recht, M.P.; Goodwin, D.W.; Winalski, C.S.; White, L.M. MRI of Articular Cartilage: Revisiting Current Status and Future Directions. Am. J. Roentgenol. 2005, 185, 899–914. [Google Scholar] [CrossRef]
- Gorbachova, T.; Melenevsky, Y.; Cohen, M.; Cerniglia, B.W. Osteochondral Lesions of the Knee: Differentiating the Most Common Entities at MRI. Radiographics 2018, 38, 1478–1495. [Google Scholar] [CrossRef]
- Smet, A.A.D.; Ilahi, O.A.; Graf, B.K. Reassessment of the MR criteria for stability of osteochondritis dissecans in the knee and ankle. Skeletal. Radiol. 1996, 25, 159–163. [Google Scholar] [CrossRef] [PubMed]
- Kijowski, R.; de Smet, A.A. MRI Findings of Osteochondritis Dissecans of the Capitellum with Surgical Correlation. Am. J. Roentgenol. 2005, 185, 1453–1459. [Google Scholar] [CrossRef]
- Takahara, M.; Ogino, T.; Takagi, M.; Tsuchida, H.; Orui, H.; Nambu, T. Natural Progression of Osteochondritis Dissecans of the Humeral Capitellum: Initial Observations. Radiology 2000, 216, 207–212. [Google Scholar] [CrossRef]
- Schenck, R.C.; Goodnight, J.M. Osteochondritis dissecans. J. Bone Jt. Surg. Am. 1996, 78, 439–456. [Google Scholar] [CrossRef]
- Berndt Al Harty, M. Transchondral fractures (osteochondritis dissecans) of the talus. J. Bone Jt. Surg. Am. 1959, 41, 988–1020. [Google Scholar] [CrossRef]
- Anderson, I.F.; Crichton, K.J.; Grattan-Smith, T.; Cooper, R.A.; Brazier, D. Osteochondral fractures of the dome of the talus. J. Bone Jt. Surg. Am. 1989, 71, 1143–1152. [Google Scholar] [CrossRef]
- Loomer, R.; Fisher, C.; Lloyd-Smith, R.; Sisler, J.; Cooney, T. Osteochondral lesions of the talus. Am. J. Sport. Med. 1993, 21, 13–19. [Google Scholar] [CrossRef]
- Hepple, S.; Winson, I.G.; Glew, D. Osteochondral Lesions of the Talus: A Revised Classification. Foot Ankle Int. 1999, 20, 789–793. [Google Scholar] [CrossRef]
- Choi, Y.S.; Potter, H.G.; Chun, T.J. MR Imaging of Cartilage Repair in the Knee and Ankle. Radiographics 2008, 28, 1043–1059. [Google Scholar] [CrossRef] [PubMed]
- Verstraete, K.; Almqvist, F.; Verdonk, P.; Vanderschueren, G.; Huysse, W.; Verdonk, R.; Verbrugge, G. Magnetic resonance imaging of cartilage and cartilage repair. Clin. Radiol. 2004, 59, 674–689. [Google Scholar] [CrossRef]
- Alparslan, L.; Winalski, C.S.; Boutin, R.D.; Minas, T. Postoperative Magnetic Resonance Imaging of Articular Cartilage Repair. Semin. Musculoskelet. Radiol. 2001, 5, 345–364. [Google Scholar] [CrossRef] [PubMed]
- Smith, G.D.; Knutsen, G.; Richardson, J.B. A clinical review of cartilage repair techniques. J. Bone Jt. Surg. Am. 2005, 87, 445–449. [Google Scholar] [CrossRef] [PubMed]
- Hangody, L.; Ráthonyi, G.K.; Duska, Z.; Vásárhelyi, G.; Füles, P.; Módis, L. Autologous osteochondral mosaicplasty: Surgical technique. J. Bone Jt. Surg. Am. 2004, 86 (Suppl. 1), 65–72. [Google Scholar] [CrossRef]


| Water |
|
| Collagen |
|
| Proteoglycans (PGs) |
|
| Chondrocytes |
|
| Berndt and Harty (X-ray) | Loomer et al. [57] Modification (CT) | Hepple et al. [58] (MRI) |
|---|---|---|
|
|
|
Disclaimer/Publisher’s Note: The statements, opinions and data contained in all publications are solely those of the individual author(s) and contributor(s) and not of MDPI and/or the editor(s). MDPI and/or the editor(s) disclaim responsibility for any injury to people or property resulting from any ideas, methods, instructions or products referred to in the content. |
© 2023 by the authors. Licensee MDPI, Basel, Switzerland. This article is an open access article distributed under the terms and conditions of the Creative Commons Attribution (CC BY) license (https://creativecommons.org/licenses/by/4.0/).
Share and Cite
Nischal, N.; Iyengar, K.P.; Herlekar, D.; Botchu, R. Imaging of Cartilage and Chondral Defects: An Overview. Life 2023, 13, 363. https://doi.org/10.3390/life13020363
Nischal N, Iyengar KP, Herlekar D, Botchu R. Imaging of Cartilage and Chondral Defects: An Overview. Life. 2023; 13(2):363. https://doi.org/10.3390/life13020363
Chicago/Turabian StyleNischal, Neha, Karthikeyan P. Iyengar, Deepak Herlekar, and Rajesh Botchu. 2023. "Imaging of Cartilage and Chondral Defects: An Overview" Life 13, no. 2: 363. https://doi.org/10.3390/life13020363