1. Introduction
Existing cells use a complex mechanism in order to grow and divide. Primitive cells, on the other hand, do not have such a complex mechanism and can undergo protein-free cell division. Therefore, biochemical and simulation studies have been conducted to investigate primitive cell division. One of the primitive cell models used in biochemical experiments is L-form cells with gene mutations that inhibit cell wall formation [
1,
2]. L-form cells have been observed in various bacteria such as
Bacillus subtilis,
Escherichia coli, and
Listeria monocytogenes [
3,
4,
5]. Irregular shape changes are observed in the cell division of L-form cells as shown in the
Figure 1.
Mercier et al. used
B.
subtilis to study the characteristic division mechanism found in this L-form cells [
6]. In their study, experiments were conducted using a wild-type strain of
B. subtilis and a protoplast of its mutant strain. The protoplasts are cells from which the cell walls of plant cells and bacteria have been removed by enzymatic treatment, and have a spherical shape under isotonic pressure. However, while protoplasts from wild-type do not cause cell division, the protoplasts from mutant with gene mutations which overproduce cell membranes were found to undergo irregular cell division like L-form cell. Furthermore, it was also revealed that by removing the cell wall after growing a wild-type strain that inhibited cell division, the wild-type strain divides like L-form cells. What all these experimental results have in common is that when the cell walls of rod cells and spherical cells are removed to make spherical cells, extra membranes are formed on these cells and irregular division occurs. Based on this result, the cell division mechanism could be explained by physical factors based on elasticity theory of the cell membrane [
7]. That is, the excessive growth of the cell membrane relative to the cytoplasm creates an excess membrane region that allows cell deformation, and cell division occurs.
In order to analyze the deformation and division of L-form cells quantitatively, it is a very meaningful modeling to regard L-form cells as vesicles, which are closed lipid bilayer membranes. Ziherl et al. theoretically investigated the stable shape of symmetric vesicles based on the bending elasticity model of the membrane [
8]. Since they performed the analysis using the area differential elasticity (ADE) model, it was not possible to consider the topological deformation of the membrane [
9]. Grafümuler et al. also analyzed how vesicles fuse with lipid bilayer membranes [
10]. They composed coarse-grained particles of water and lipid molecules and simulated them using the dissipative particle dynamics (DPD) method [
11]. As a result, it was clarified that the tension of the lipid bilayer needs to exceed a certain threshold for the fusion of the lipid bilayer and the vesicle.
Baoukina et al. performed simulation analysis of the topological changes in a single layer membrane, such as the formation of bucklings or semivesicles, which are observed when pressure is applied to both ends of the single layer membrane formed at the interface between water and air [
12]. They performed MD calculations using coarse-grained lipid molecules and found that the topological changes of the membrane were controlled by macroscopic parameters such as curvature elasticity and tension of the membrane. Furthermore, Nakagawa et al. found that the formation of bilayer sheet protrusions (BP) in bilayers and vesicles is induced by hydrolysis and condensation reactions of amphipathic molecules [
13]. It was clarified that the relative ratio of the viscosity in the bilayer membrane and the surrounding viscosity is important for the formation of BP, and that the higher the viscosity of the surrounding fluid, the more BP is formed. They also found that vesicle division was observed by hydrolysis and condensation reaction of lipids.
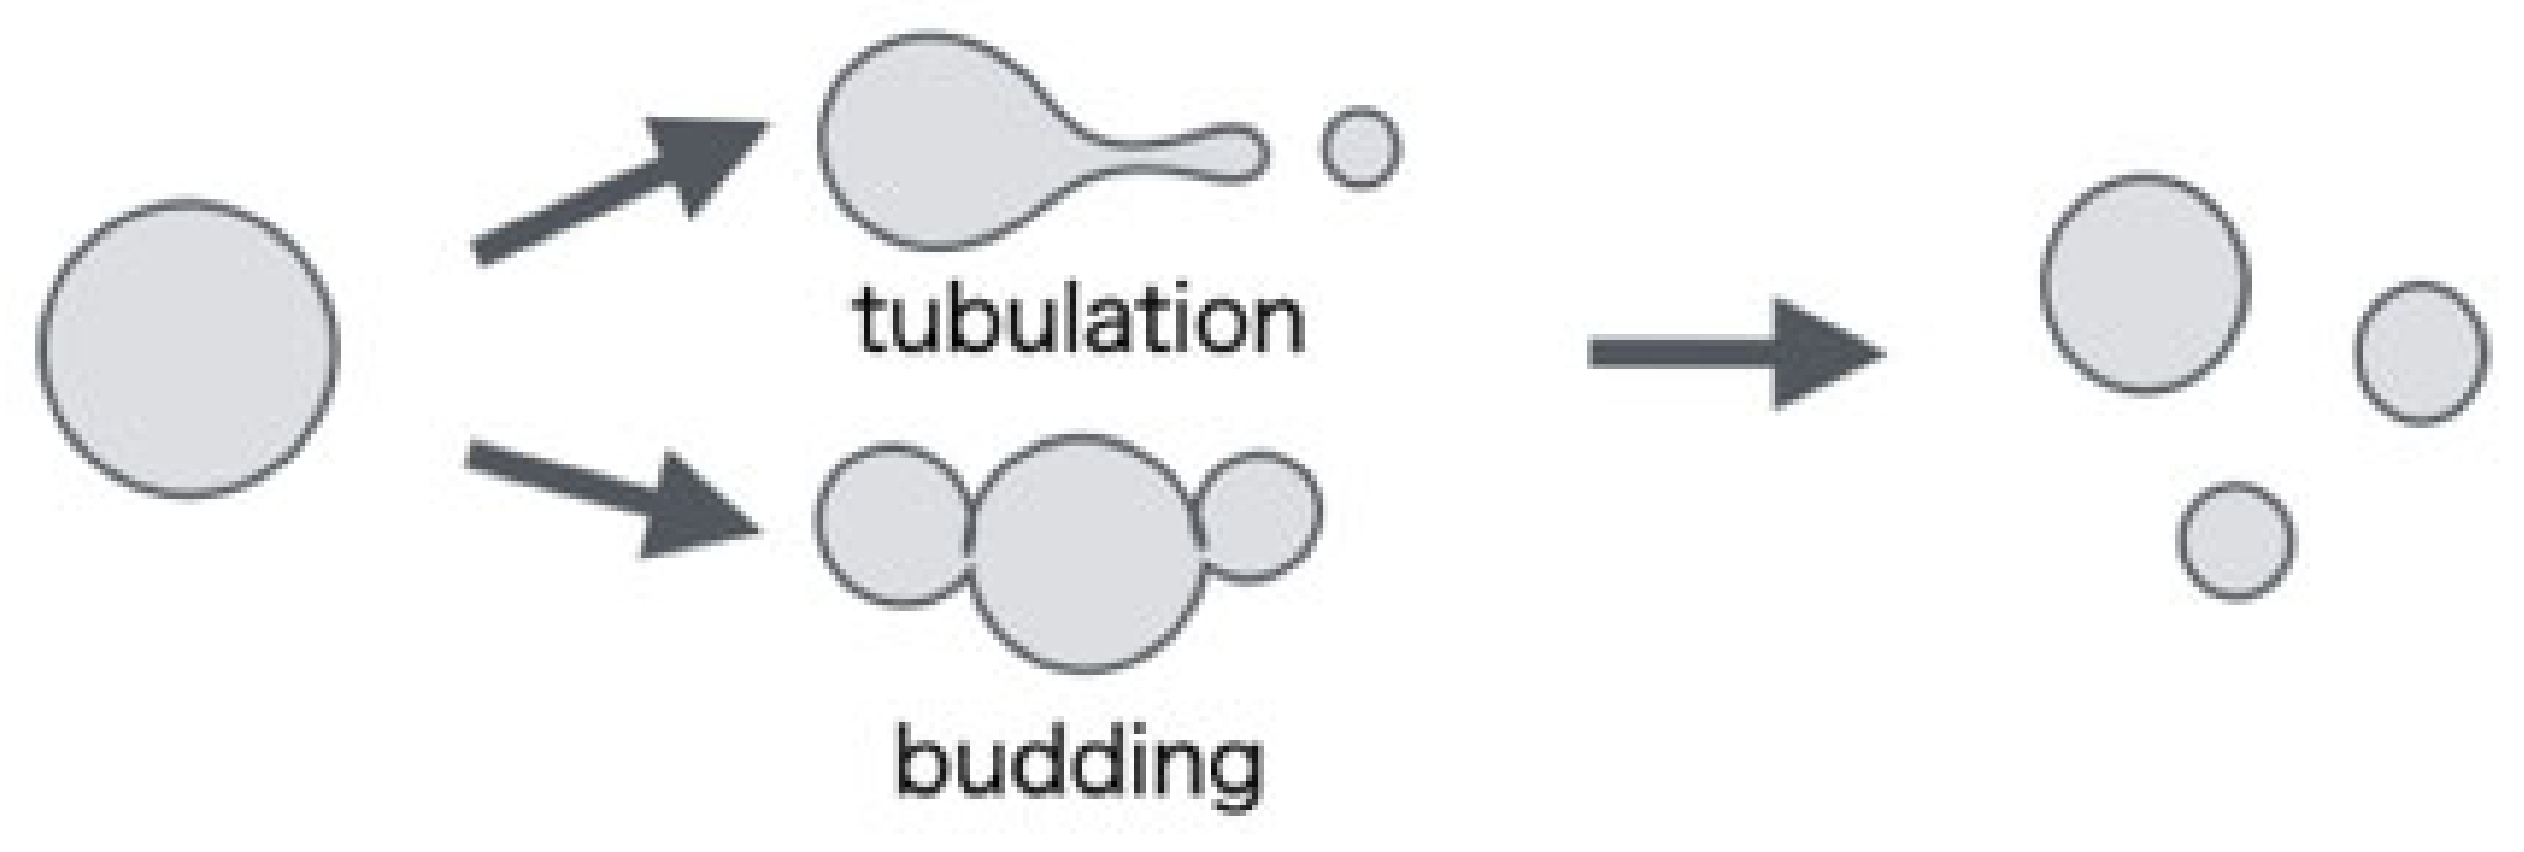
Ruiz-Herrero et al. used a simulation of the triangular lattice membrane model to investigate the shape change in the non-equilibrium state as observed during the division of L-form cells [
14]. They simulated using a growth vesicle model that took into account the growth of lipid membranes and the penetration of water in the membranes. As a result, when the value of the dimensionless parameter indicating the magnitude of the relative spontaneous curvature is positive, the shape (tubulation, budding) that forms small vesicles on the outside is observed, and when the value is negative, a shape that forms small vesicles inside (vesiculation) is obtained. On the other hand, when the dimensionless parameter indicating the strength to grow beyond the critical radius is large, the amount of increase in both the volume and surface area of the vesicle becomes faster than the relaxation rate, so that elastic energy accumulates in the membrane. Small vesicles were formed on the entire surface of the vesicle so as to relieve the elastic energy. However, since the model did not allow changes in topology, the shape of the vesicles observed was limited. In addition, as revealed by Ziherl et al. [
8], the difference between the area of the outer membrane surface and the area of the inner membrane surface of the vesicle plays an important role in determining the shape. On the other hand, Ruiz-Herrero’s model is composed of a single layer of membrane, and the area difference of the membranes is not considered. Therefore, the above-mentioned problem can be avoided by allowing the topological change and performing the simulation using the model that accurately represents the lipid bilayer membrane.
In this paper, we constructed a model of a vesicle with an increasing membrane area and simulated it in order to investigate the reason why L-shaped cells may reach division by different deformation pathways, as shown in
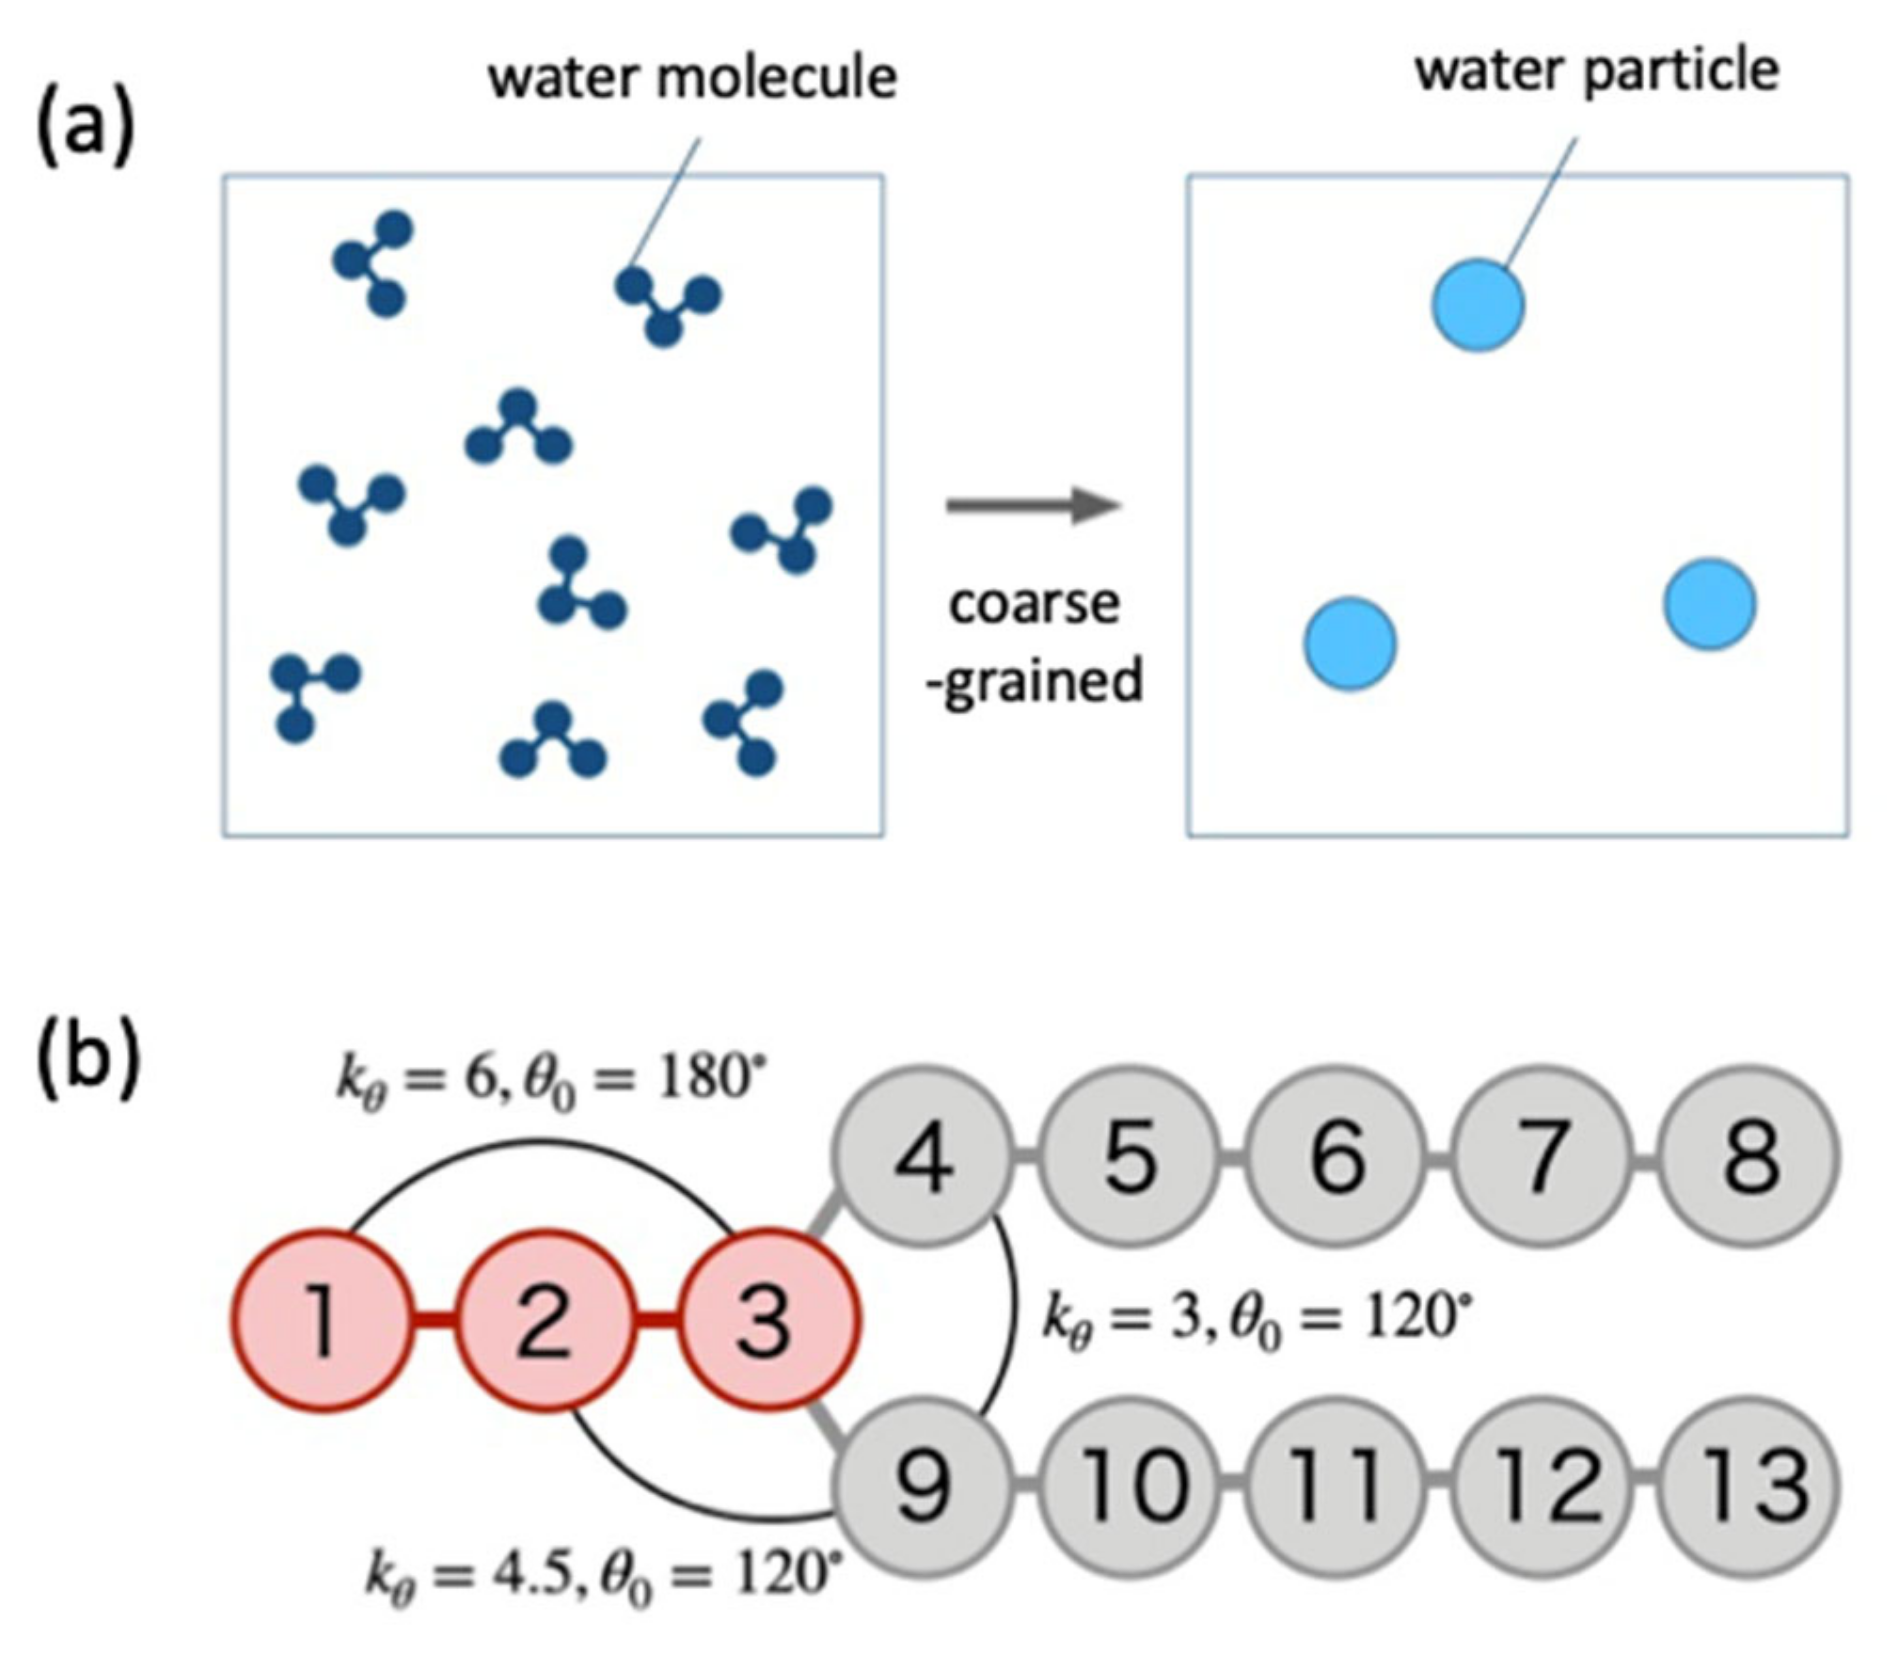
Figure 1. Although cell division in bacteria requires the prokaryotic cytoskeletal protein FtsZ, it is known that L-form cells without cell walls undergo characteristic cell division independent of FtsZ. Therefore, in order to understand the mechanism of cell division in L-form cells or primitive cells without cell walls, it is important to investigate the division mechanism of vesicles composed only of lipid molecules and the deformation during the process from a physical point of view. Analysis using molecular simulation, in particular, is very meaningful because it can show the correlation between the deformation of the vesicle and the behavior of the lipid molecules that make up the vesicle. Specifically, we investigate the characteristics of the shape change of the growing vesicles in the non-equilibrium state by using a model in which the molecule is coarse-grained by the dissipative particle dynamics (DPD) method [
11]. In this model, not only the topological changes of vesicle are allowed, but also lipid molecules are added to the system at regular time intervals in order to increase the surface area of the lipid bilayer membrane. Since the number of particles in the system increases with time, the simulation is performed under a constant pressure, and the size of the system changes accordingly.
We find that the vesicle deformed into a tube shape when lipid molecules were added uniformly to the lipid bilayer. On the other hand, when a lipid molecule is added only to one layer of the lipid bilayer, semi-vesicle-like structures are generated inside or outside the vesicle through topological changes. Since the result of the former condition is a deformation corresponding to “tubulation” and the latter condition is the deformations corresponding to “budding”, the molecular transport process by which lipid molecules are incorporated into the lipid bilayer is important and might be involved in the path selection of these deformations in L-form cells.
3. Results
3.1. Construction of Initial Structure
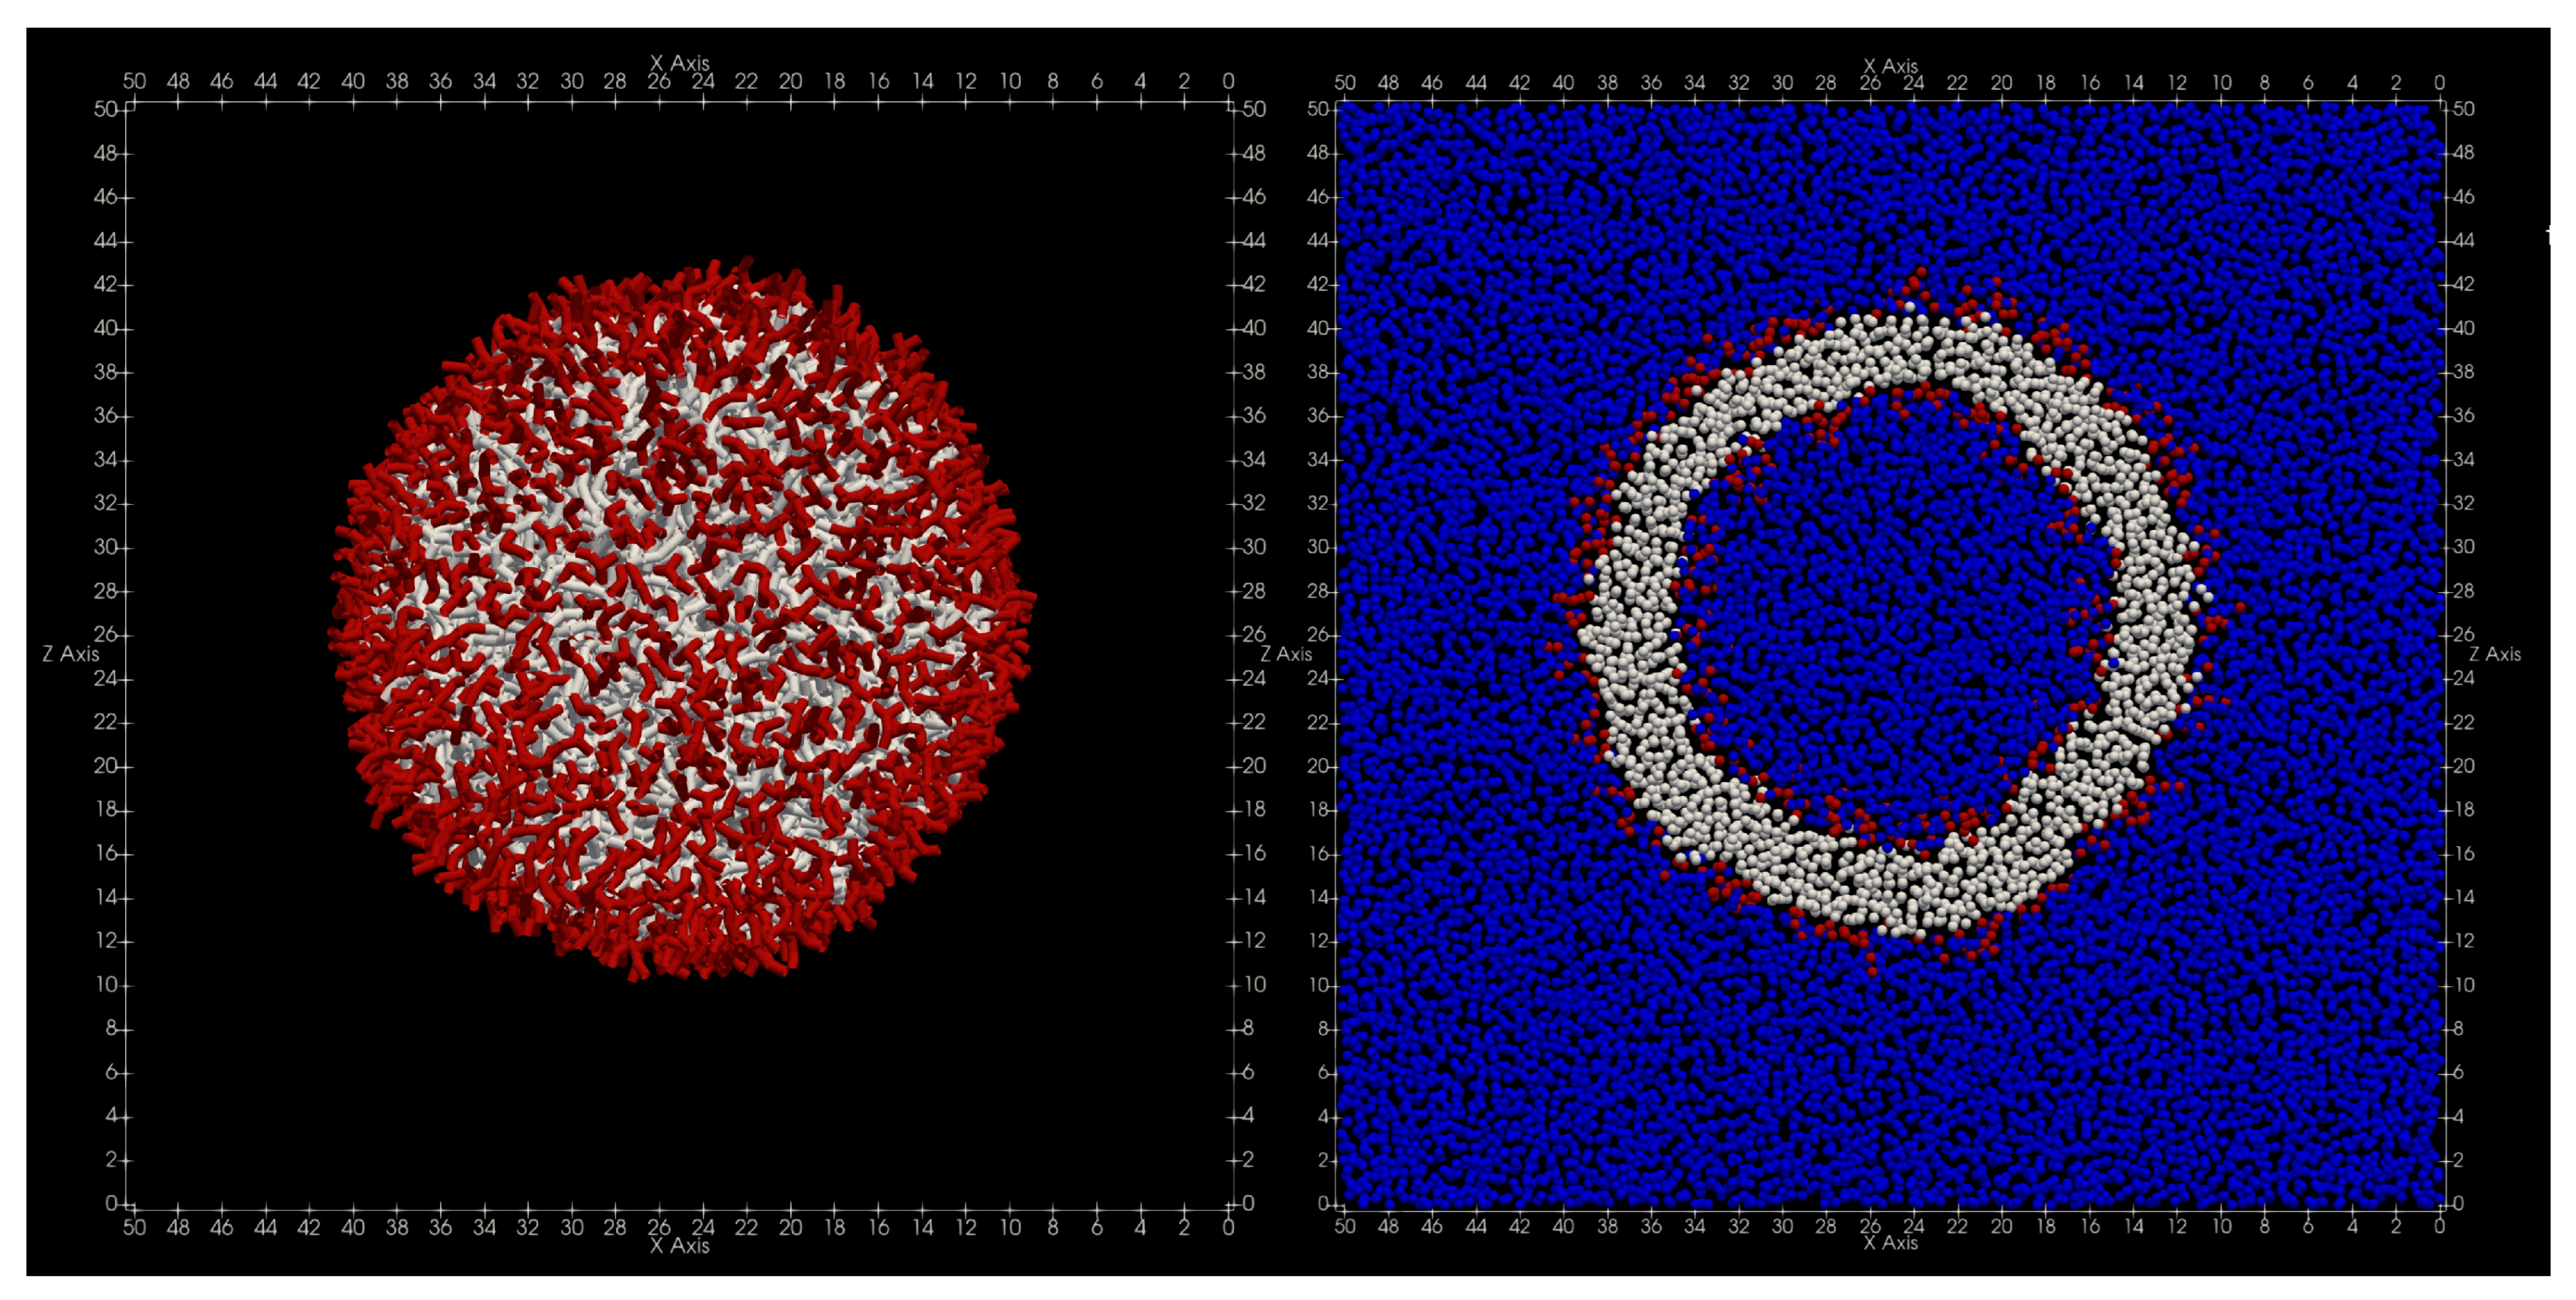
In order to construct the initial structure of the vesicle used in the simulation, a spherical vesicle with a radius of consisting of 4000 lipid molecules is first placed in the system together with 323,000 water particles. Here, 27,289 water particles are contained inside the spherical vesicle. Next, while keeping the temperature and pressure of this system constant, the simulation is performed for 100,000 steps with the time step and the parameter , and the system is sufficiently relaxed. The pressure and temperature of the system are set to and as in the simulation of adding lipids.
The shape of the finally obtained vesicle is shown in
Figure 5. Immediately after the start of the simulation, the pressure value became constant immediately, and the volume, temperature, and energy values became constant after 20,000 steps. Additionally, the radius of inertia of the vesicles became nearly constant around
after 50,000 steps.
During this relaxation process, water particles inside and outside the vesicle did not penetrate the lipid bilayer membrane. Therefore, if we investigate whether the water particles closest to the lipid molecule are inside or outside the vesicle, we could distinguish whether the lipid molecules that make up the vesicle are in the inner layer or the outer layer of the membrane. However, if the vesicle undergoes a large deformation and its topology changes, it will be impossible to distinguish it in such a way. In this case, when the lipid molecule in the inner or outer layer of the membrane is specified in the following sections of simulations and results, this suggests that the position of the lipid molecule is in the initial shape of the vesicle.
3.2. Simulation of Adding Lipid Molecules (1 in 50 Steps)
Simulations were performed by adding lipid molecules one by one to the following locations: (1) the inner membrane of the vesicle, (2) the outer membrane, and (3) the membranes on both sides. One lipid molecule is added every 50 steps, and this is performed up to 200,000 steps to double the number of lipid molecules.
3.2.1. Adding to Inner Layer
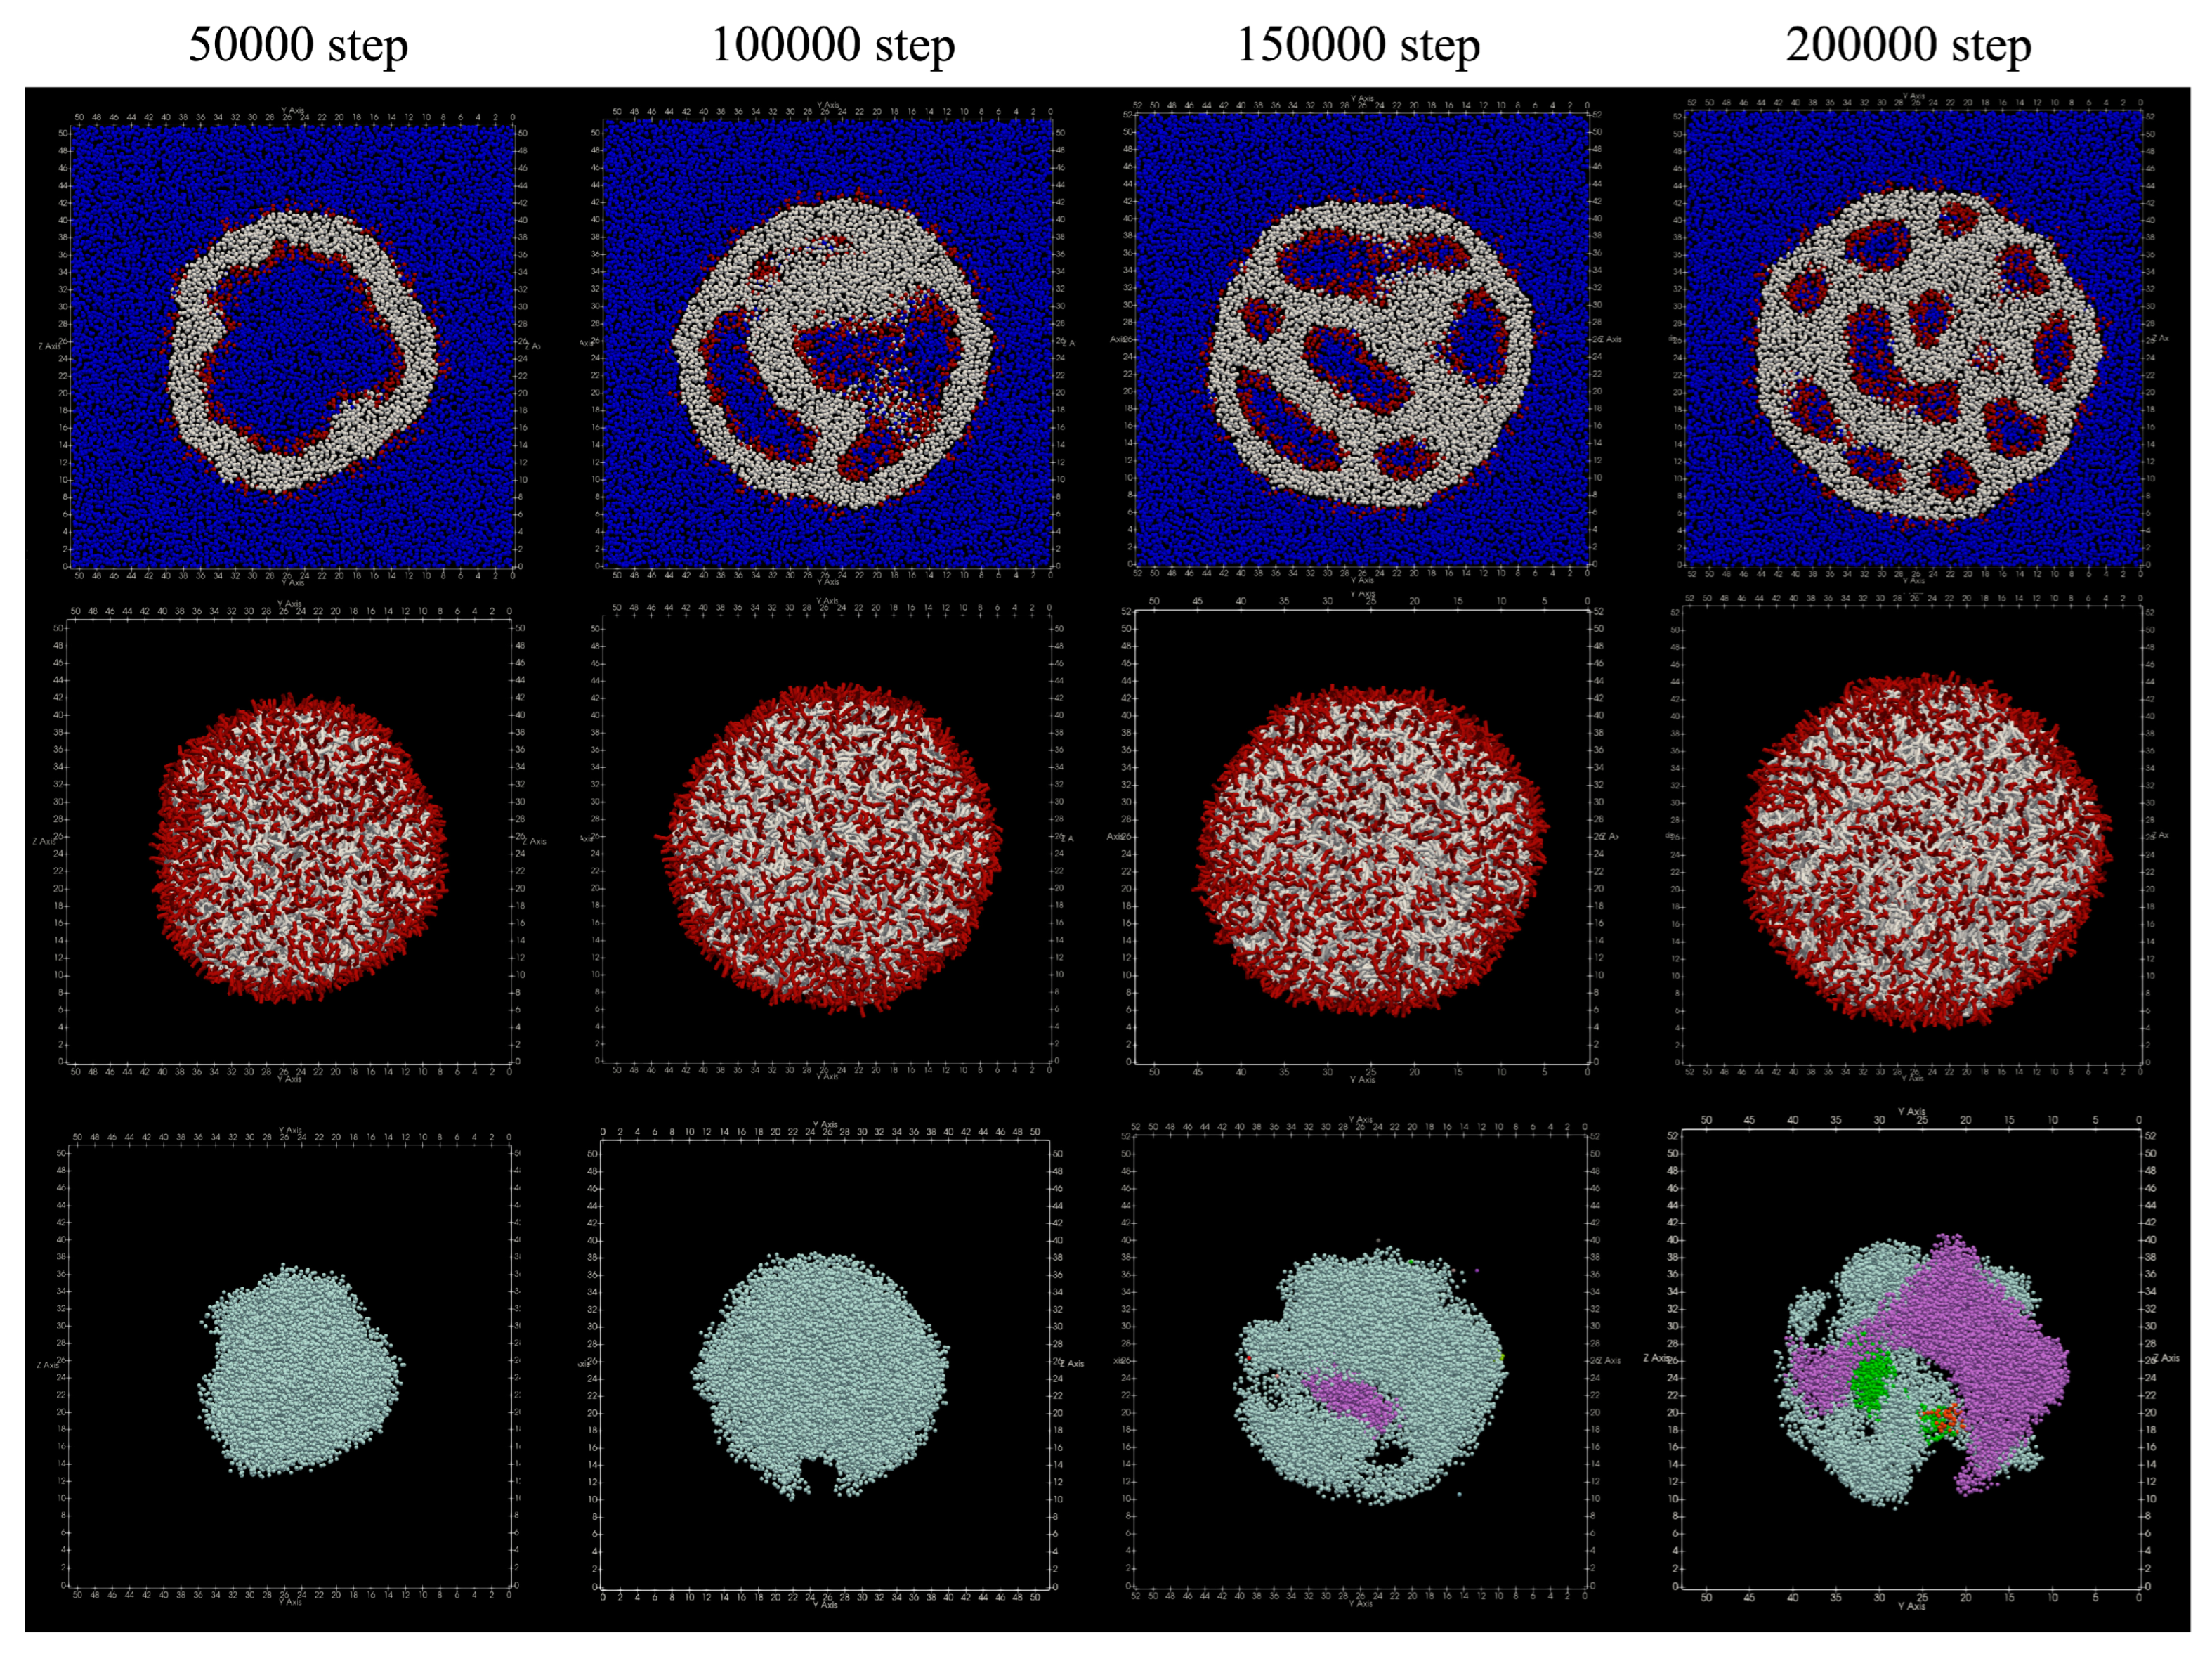
Structures obtained by adding lipids to the inner membrane of the vesicle are shown in
Figure 6 From around 50,000 steps, the membrane inside the vesicle begins to protrude, and around 150,000 steps, the membrane is seen to stretch so as to divide the inside of the vesicle. Furthermore, it can be seen that the number of divided areas is increasing around 200,000 steps.
At 200,000 steps, the number of lipid molecules that moved from the inner membrane to the outer membrane was 16, and the number of lipid molecules that moved from the outer membrane to the inner membrane was five, so a total of 21 lipid molecules moved. No lipid molecules that migrated between the bilayer membranes were found.
Table 2 shows the number of particles in the cluster of water particles. Since the data of No. 1 indicates the water particles located outside the vesicle, it can be seen that the number of clusters in the vesicle, that is, the number of compartments separated by the membrane, eventually increased to six.
3.2.2. Adding to Outer Layer
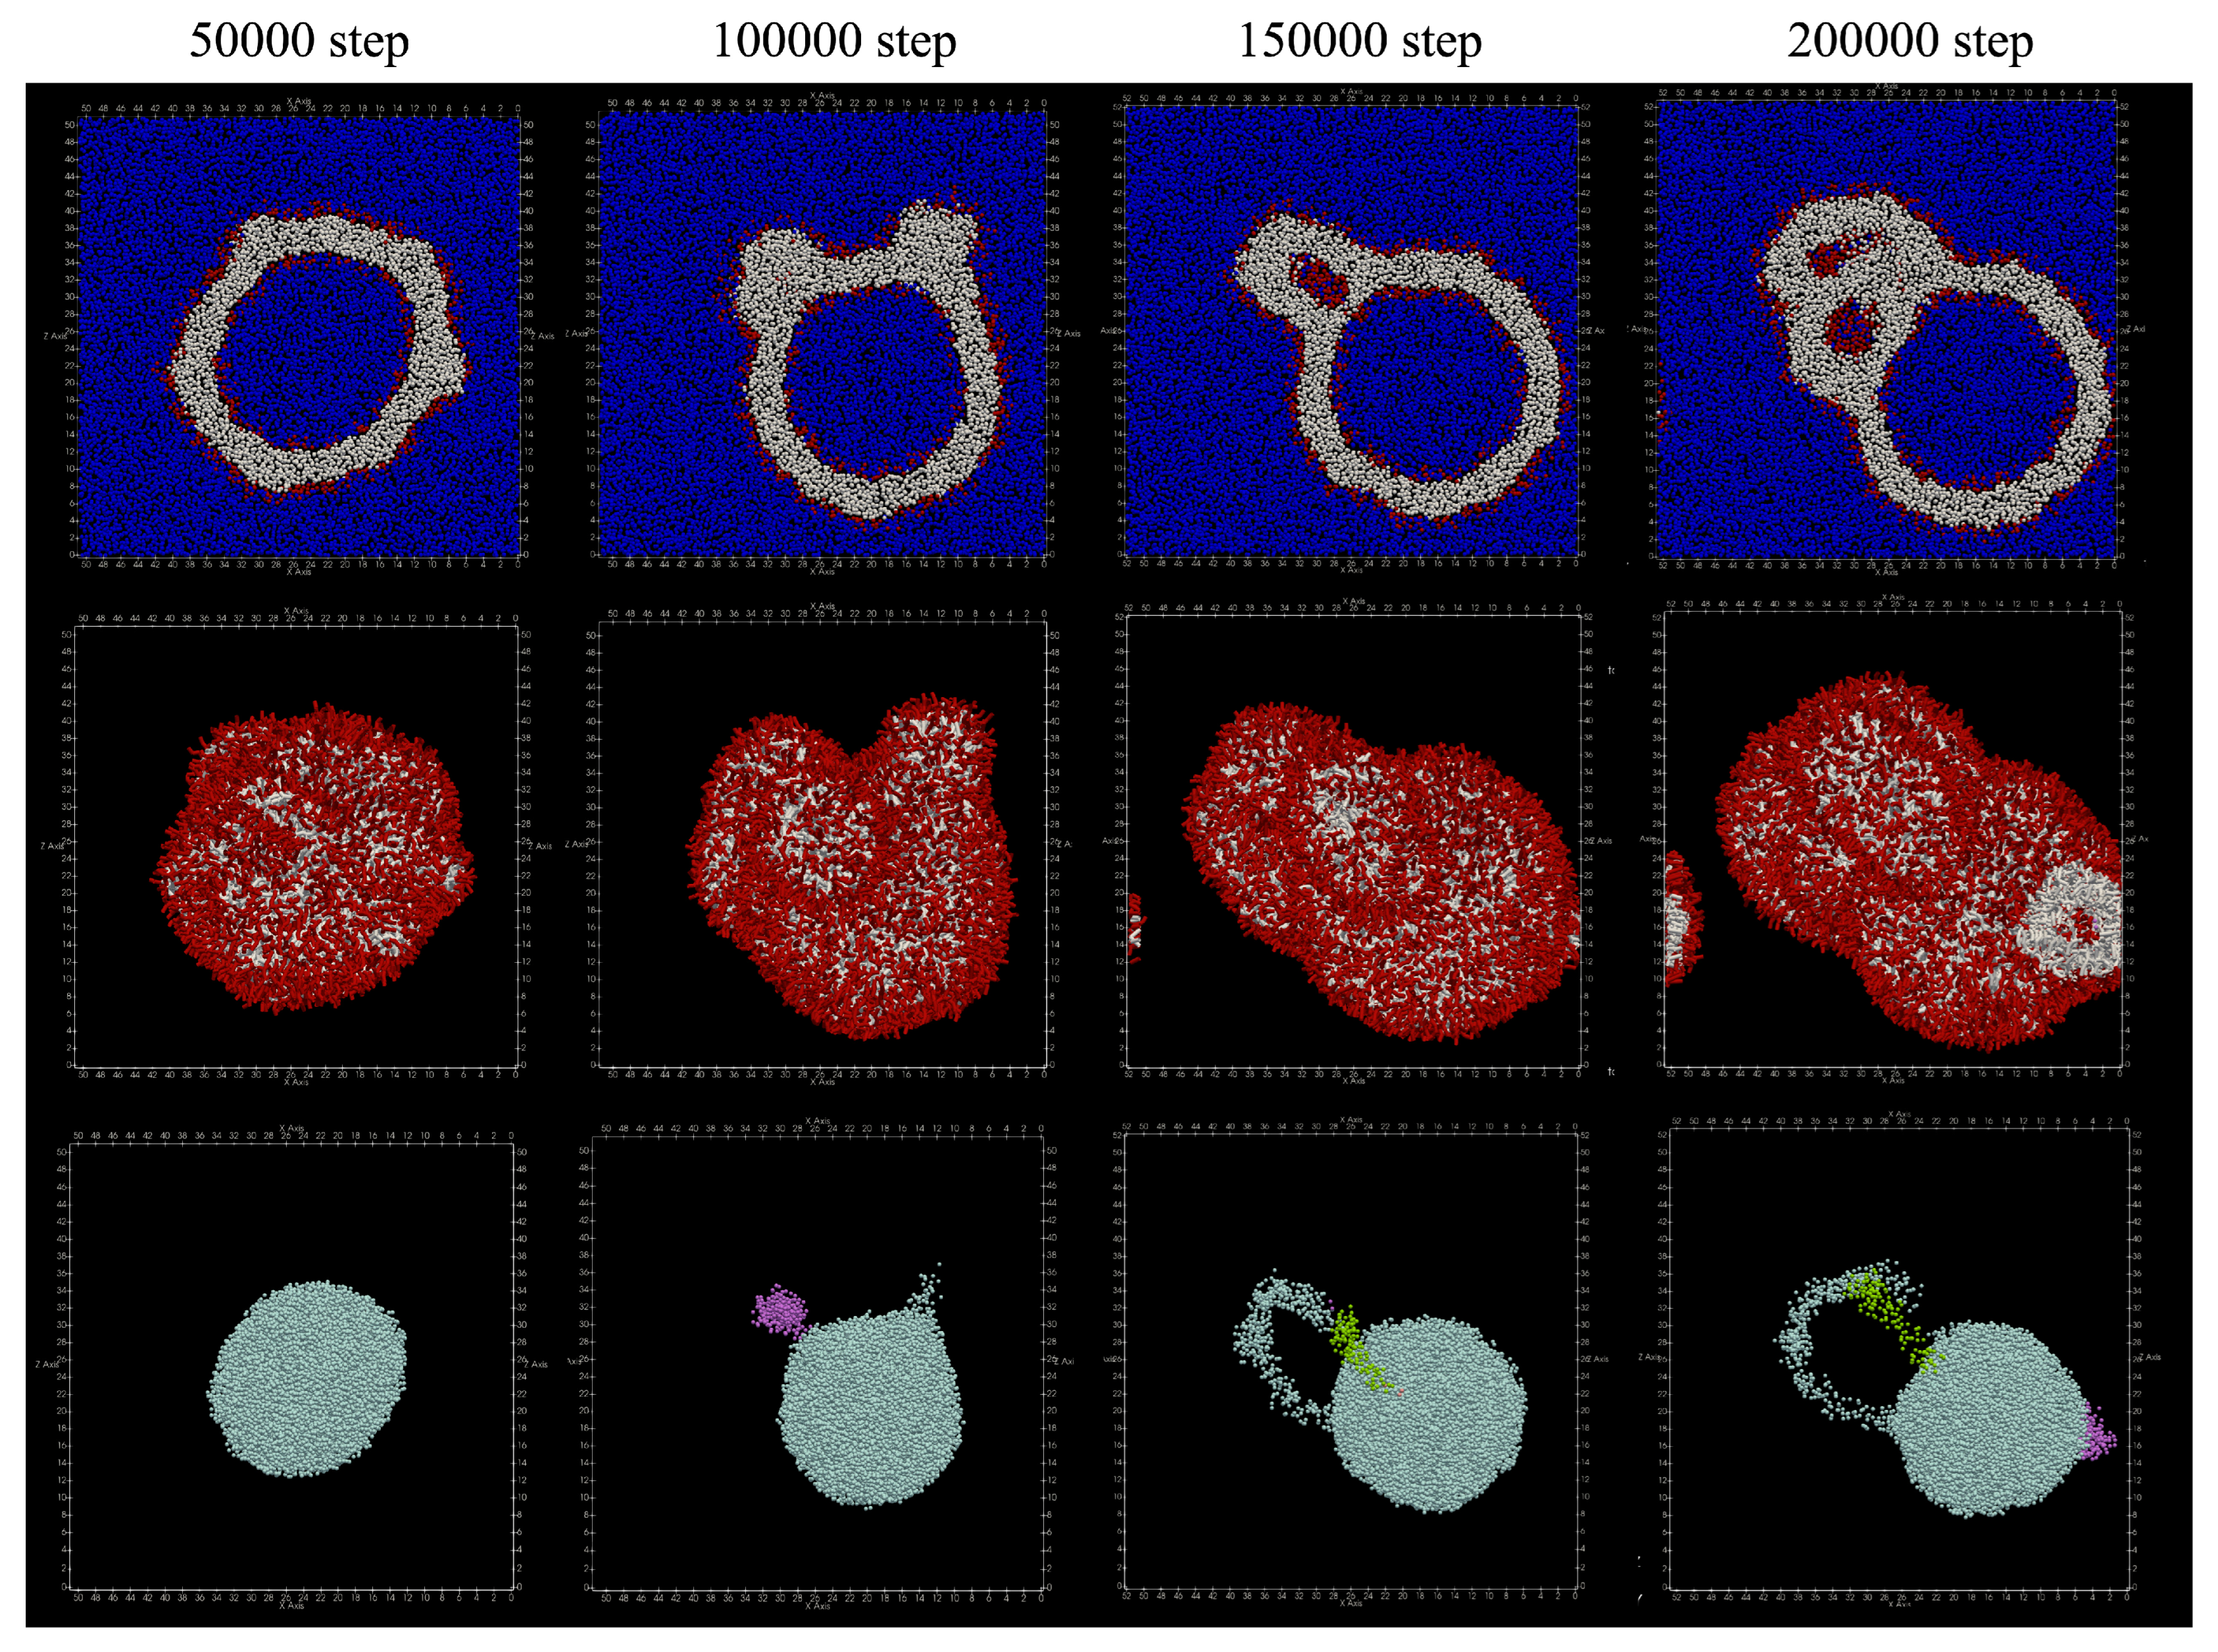
The structures obtained by adding lipids to the outer membrane of the vesicle are shown in
Figure 7. At 100,000 steps, a structure was seen in which the outer membrane of the vesicle was projected. After that, at the 200,000 steps, it was observed that the protruding structure became a double membrane. In addition, no lipid molecules that migrated between the bilayer membranes were found.
Table 3 shows the number of particles in the cluster of water particles. It can be seen that the number of clusters has finally increased to three or four.
3.2.3. Adding Lipid Molecules to Both Layers
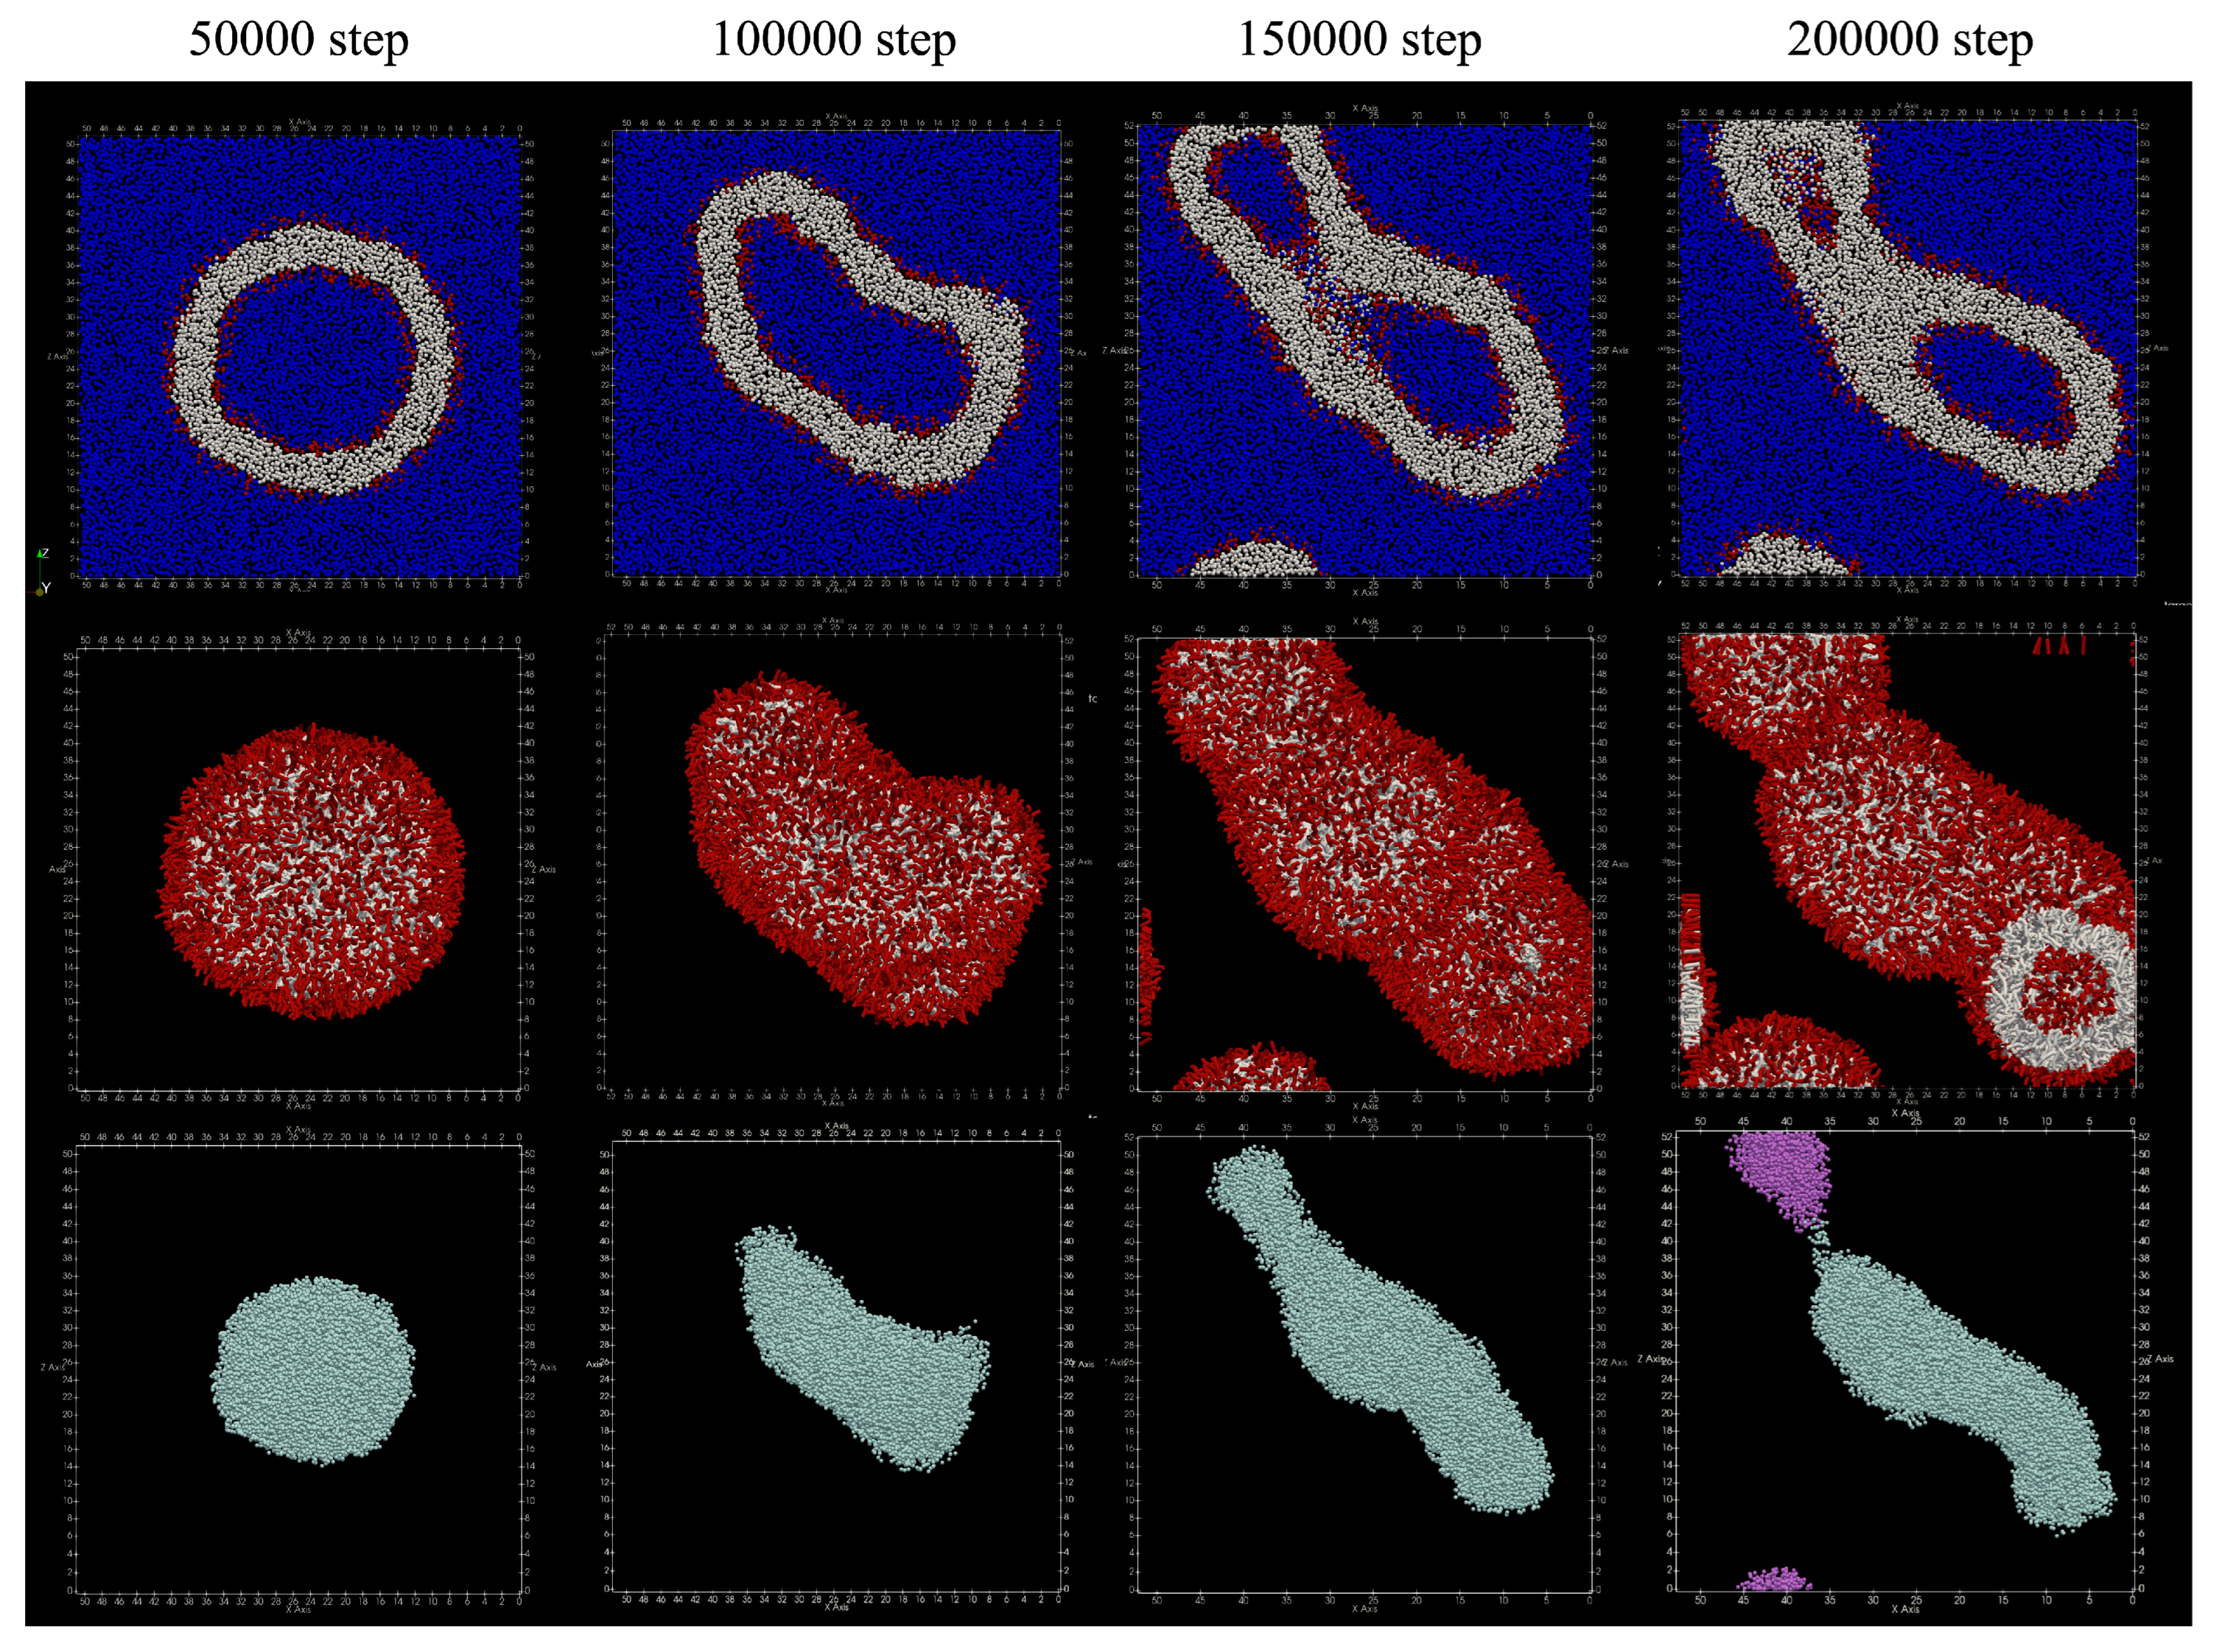
The number of lipid molecules added in the simulation was 1289 in the inner membrane and 2711 in the outer membrane. The number of lipid molecules that migrated from the inner membrane to the outer membrane was only three. The obtained structure is shown in
Figure 8. Spherical vesicles were observed around 50,000 steps, and they were transformed into flat vesicles after the 100,000 steps. Around 200,000 steps, the water particles inside the vesicle are divided. From
Table 4, the number of water particle regions inside the vesicle has increased to a few.
3.3. Shape Relaxation
We performed relaxation simulations of the shape of the vesicles, using the three types of structures obtained by the above simulations of adding lipid molecules every 50 steps as the initial structures. In the relaxation simulation, 200,000 steps were calculated under constant temperature and pressure conditions without adding lipid molecules.
As a result of relaxing the structure obtained by adding lipid only to the inner membrane of the vesicle, there were 87 lipid molecules that migrated from the inner membrane of the bilayer to the outside, 20 that migrated from the outside to the inside, and a total of 107 lipid molecules that migrated between the bilayers.
Figure 9a shows the relaxation process of the vesicle structure. The shape of the vesicle remained spherical during the simulation. Around 250,000 steps, membrane pores were formed in the vesicle, and water particles inside the vesicle were observed to move outward. The number of regions of water particles inside the vesicle divided by the membrane decreased from 11 to three.
On the other hand, as a result of relaxing the structure obtained by adding lipid only to the outer membrane of the vesicle, the number of lipid molecules that migrated from the inner membrane of the bilayer to the outside was three, and the number of lipid molecules that migrated from the outside to the inside was 87. Therefore, the total number of lipid molecules that migrated between the bilayers was 90.
Figure 9b shows the vesicle shape relaxation process of the obtained structure. From the figure, it can be seen that the shape has not changed significantly through the simulation. The number of regions of water particles inside the vesicle divided by the membrane increased or decreased between four and six.
When the structure obtained by adding lipids to both layers of the vesicle membrane is relaxed, the number of lipid molecules that have moved outward from the inner membrane of the bilayer was six, and the number of lipid molecules that have moved from the outside to the inside was three. That is, there has been almost no movement of lipid molecules between the two layers of membranes. Additionally, as shown in
Figure 9c, the shape of the vesicle has not changed significantly through the relaxation simulation. In addition, the three compartments inside the vesicle merged into one at around 250,000 steps and has not changed thereafter.
In the simulation of duplicating lipid molecules in the membrane and adding one lipid molecule every 50 steps, different vesicle shapes were obtained depending on the layer to which the lipid molecule was added. When a lipid molecule is added to the inner membrane of the vesicle, the inside of the vesicle is divided by the bilayer membrane, and when added to the outer membrane, the bilayer membrane protrudes to the outside of the vesicle. When lipid molecules were added to the membranes on both sides, the vesicles showed a flat structure. Furthermore, in the simulation to relax the obtained shape, a deformation was observed in which the number of regions of water particles in the divided vesicles was reduced.
3.4. Simulation of Adding Lipid Molecules (1 in 100 Steps)
By performing a simulation in which the frequency of addition of lipid molecules was halved, the deformation of the vesicle due to the difference in the dynamics of addition of lipids was investigated. In this simulation, once every 100 steps, one lipid molecule was duplicated and added into the bilayer, and 4000 lipid molecules were added to the vesicle membrane during 400,000 steps. As a result, the number of lipid molecules is twice the number in the initial state. The number of lipids in this final state is the same as in the simulation in which lipid molecules are added every 50 steps.
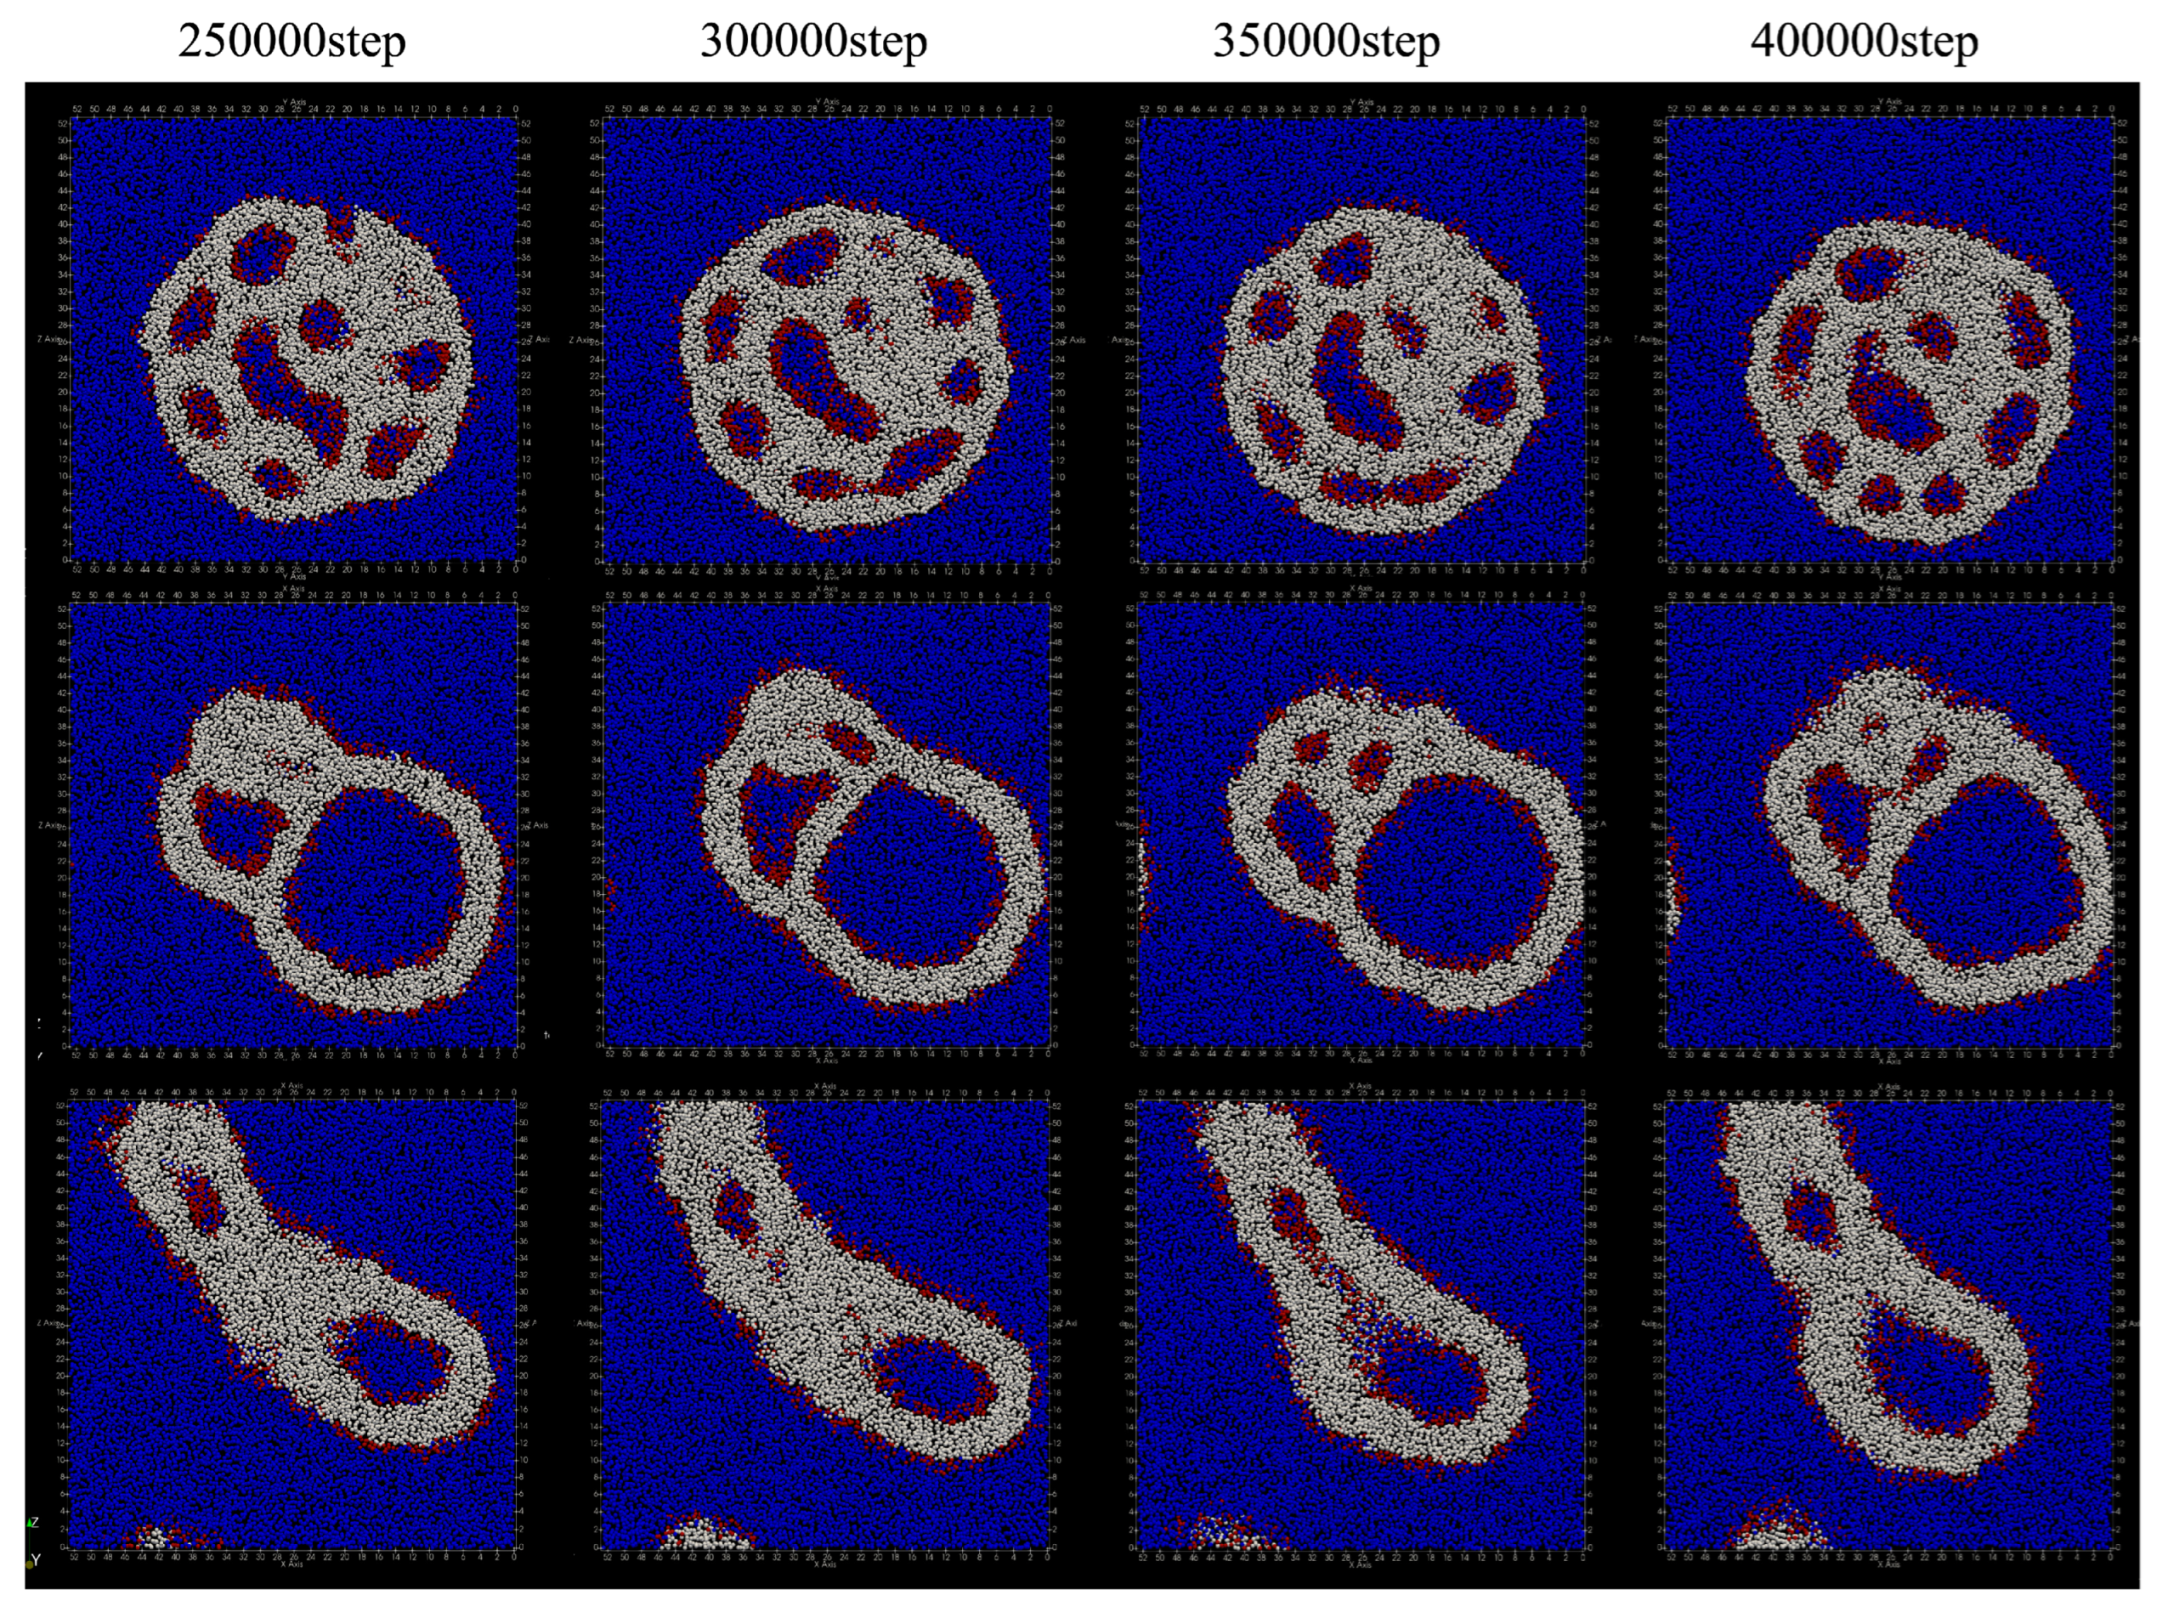
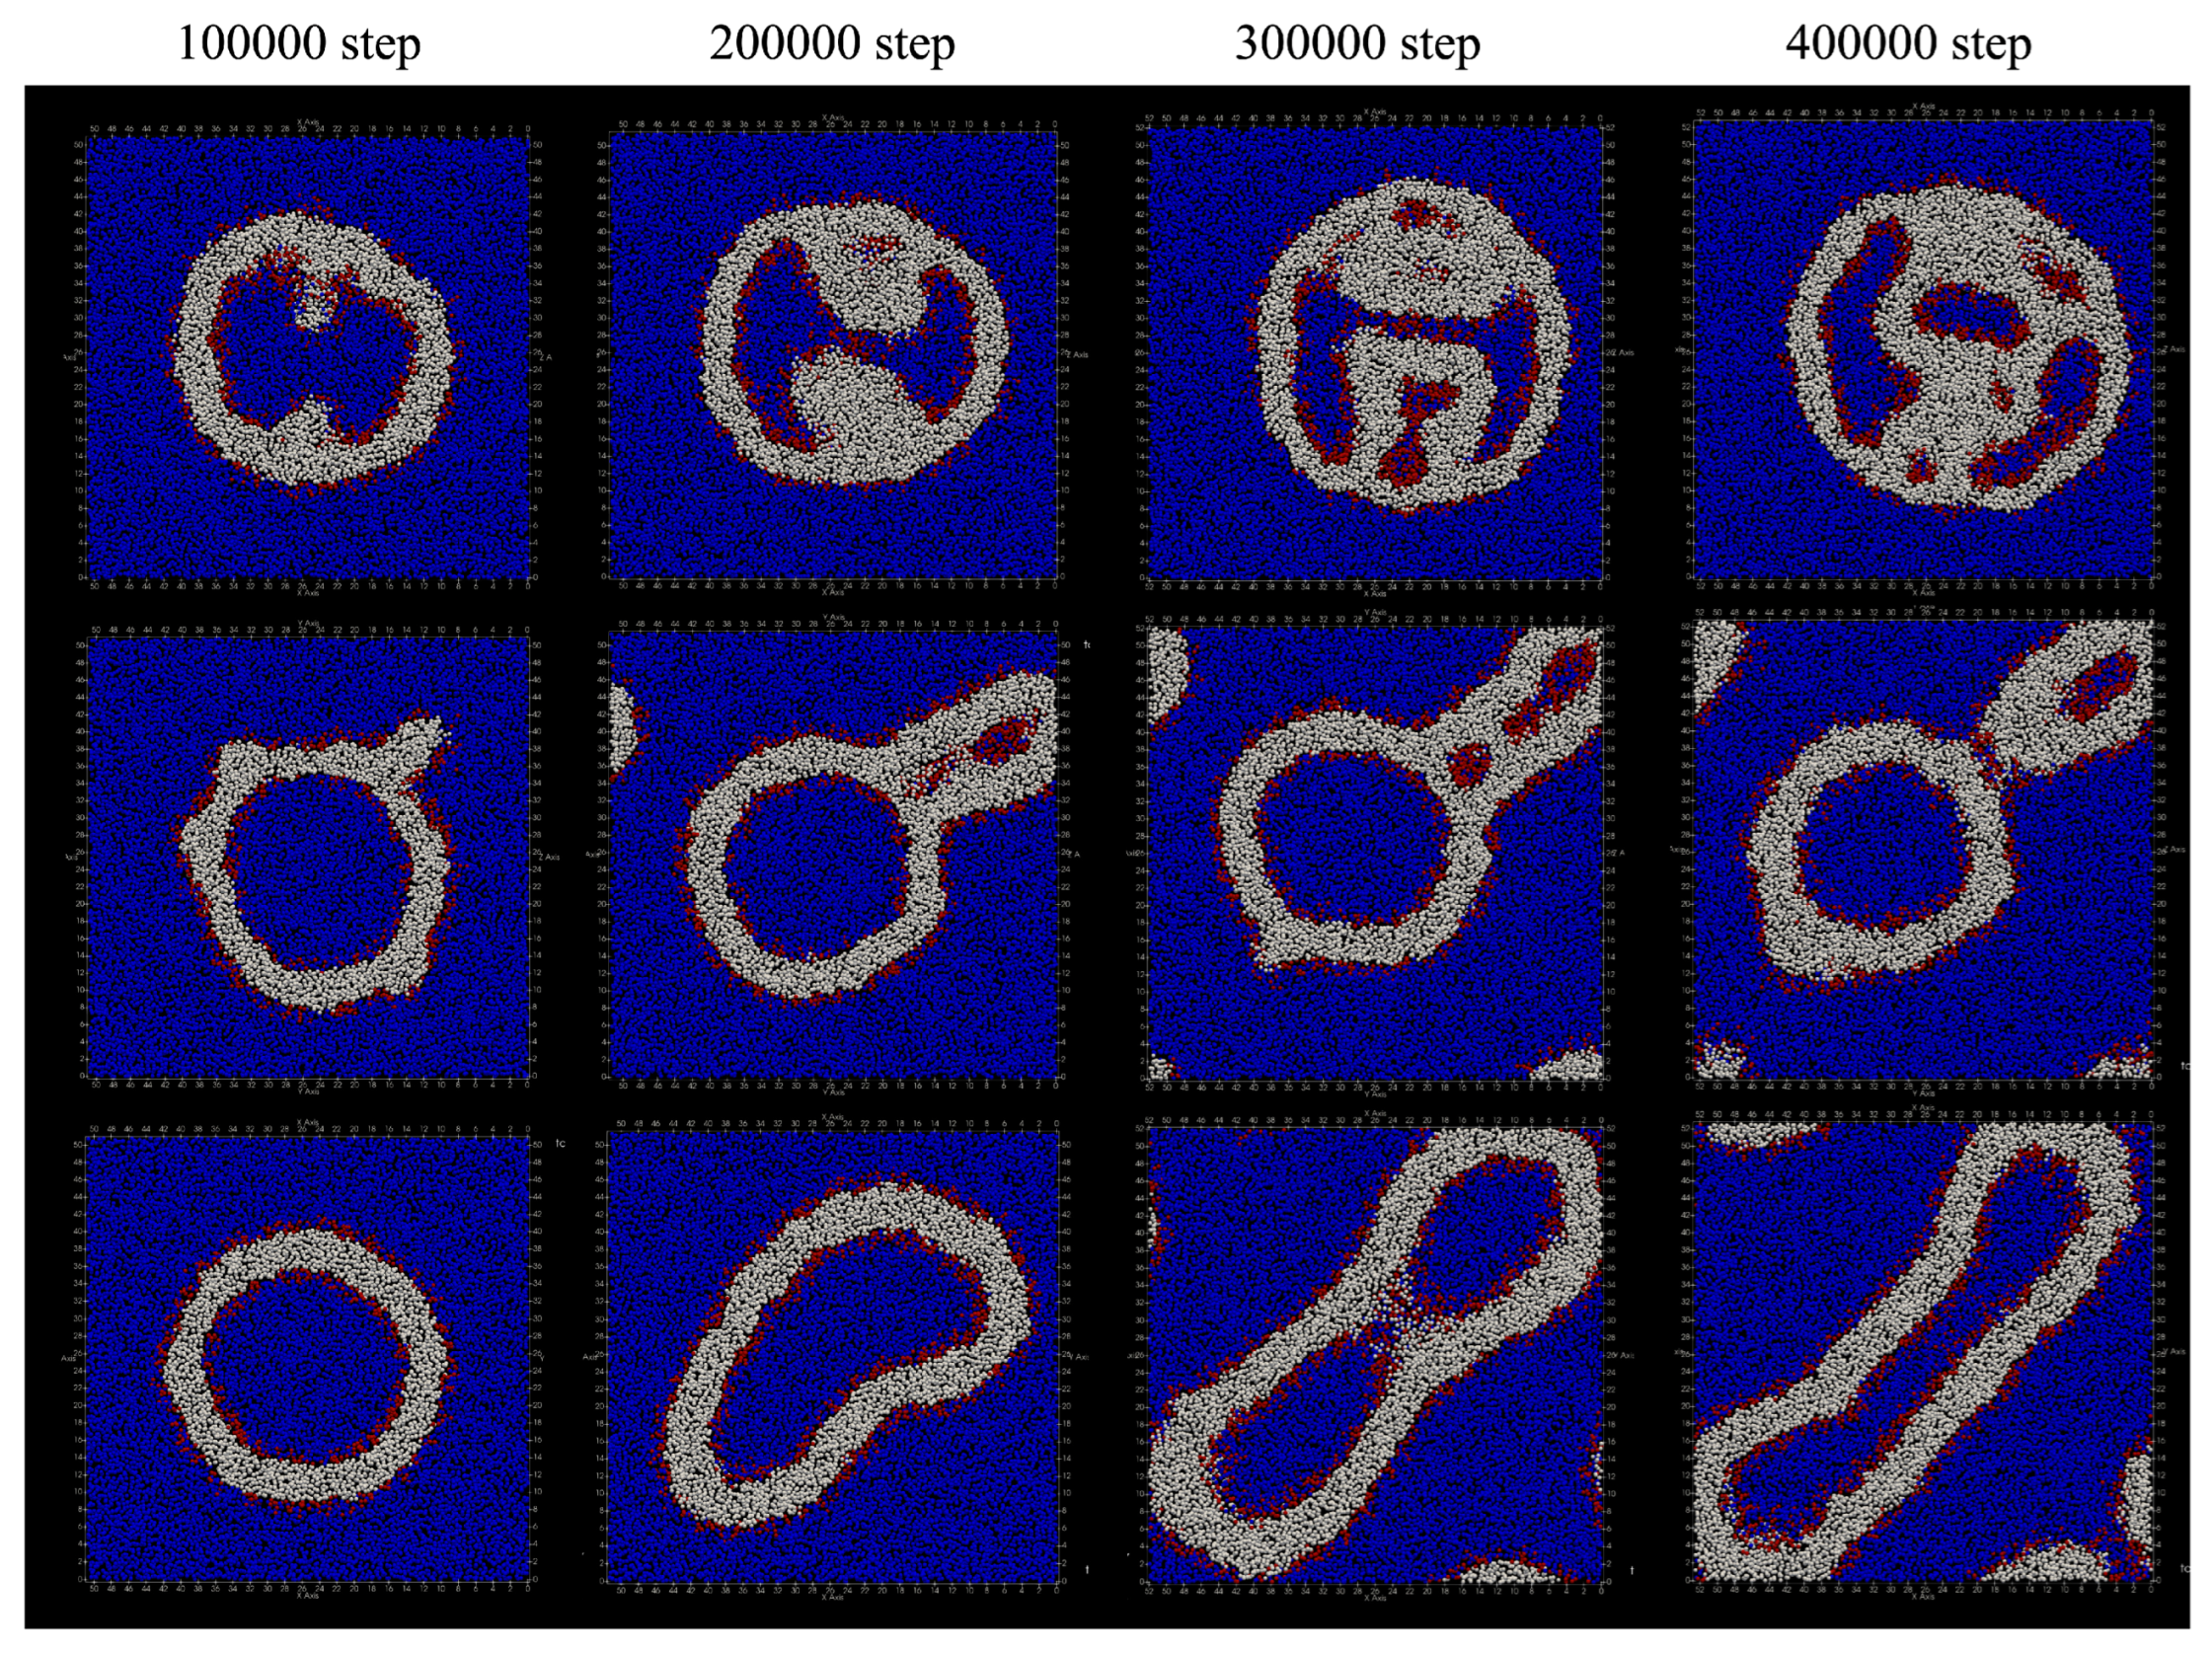
The deformation process of the vesicle by adding lipid molecules every 100 steps is shown in
Figure 10. Compared to the case where lipids are added every 50 steps, the vesicles are significantly deformed, but the characteristics of deformation due to changing the location where lipid molecules are added have not changed.
When added only to the inner membrane of the vesicle, the outer shape of the vesicle remains spherical, but a double membrane protrusion appeared from the inner membrane of the vesicle at 100,000 steps (
Figure 10a). With the passage of time, the inside of the vesicle was divided into multiple regions by the protrusions of this membrane, and finally the number of divided regions became six. During the 400,000 steps, the number of lipid molecules that migrated from the inner membrane of the bilayer to the outside was 61, and the number of lipid molecules that migrated from the outside to the inside was 12. As the result, the total number of lipid molecules that migrated between the bilayers was 73.
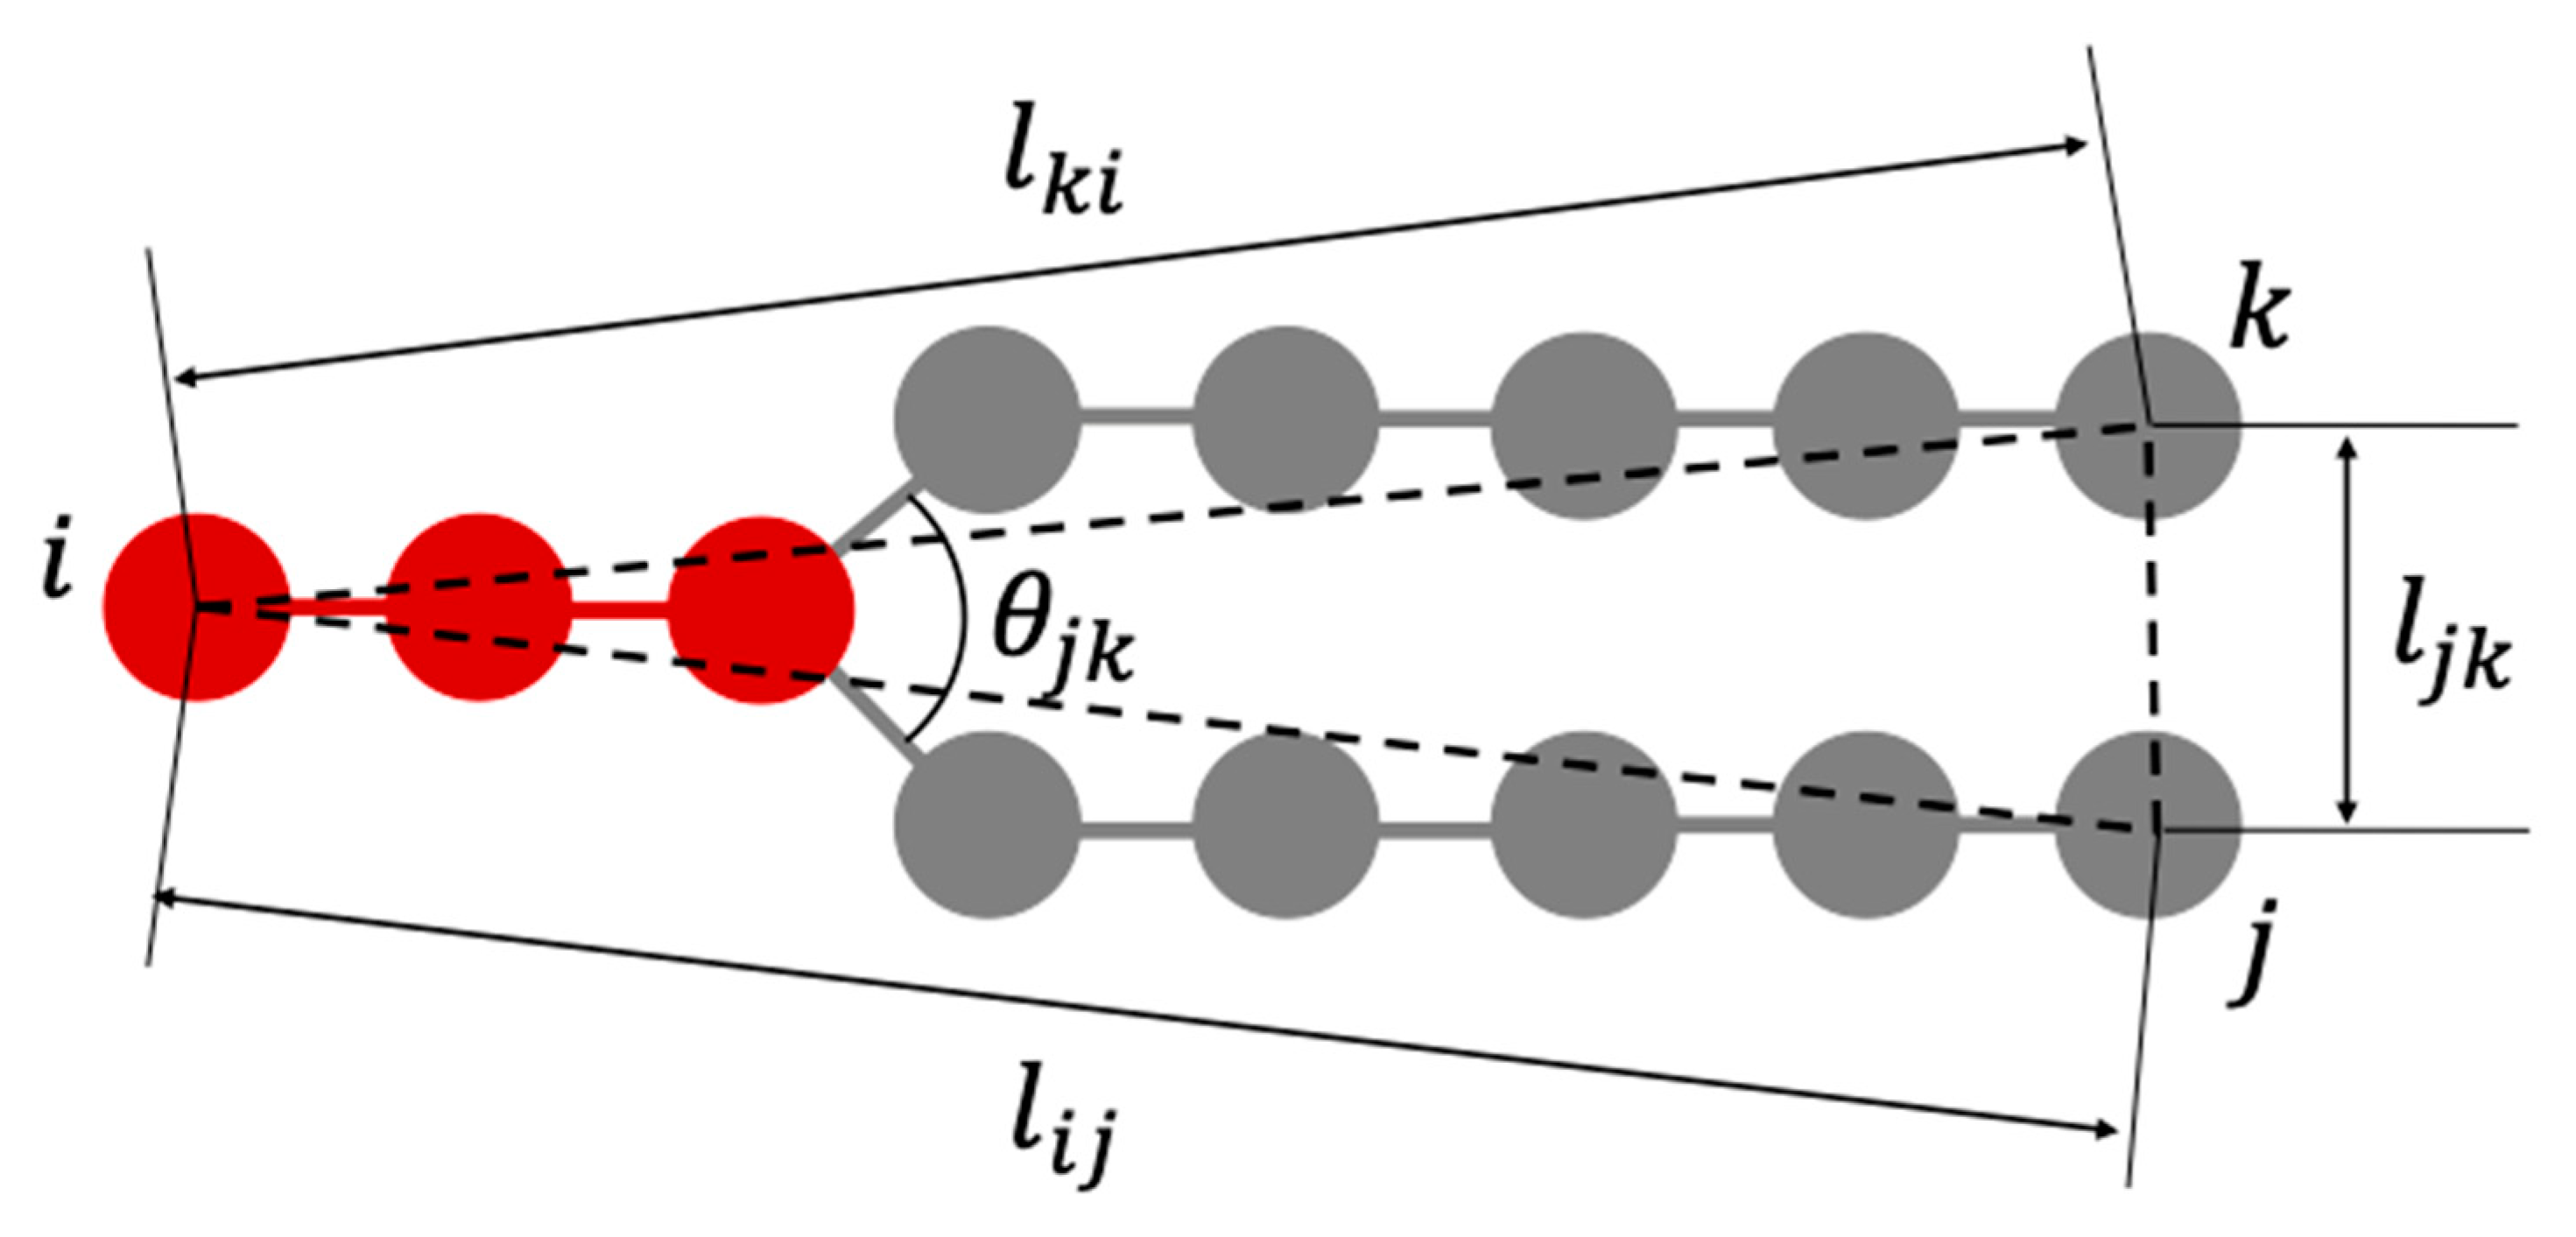
The deformation of the lipid bilayers constituting the vesicles is considered to be interdependent with the change in the steric structure of each lipid molecule. Therefore, we defined parameters that represent the shape of lipid molecules as shown in
Figure 11, and investigated how these parameter values change during the deformation process of the vesicles shown in
Figure 10. Although
and
are parameters that represent the length of lipid molecule,
is used when calculating statistics because of the symmetry of the molecule shape. The parameter
represents the distance between the ends of the two hydrophobic groups of the lipid molecule.
represents the angle formed by the roots of two hydrophobic groups.
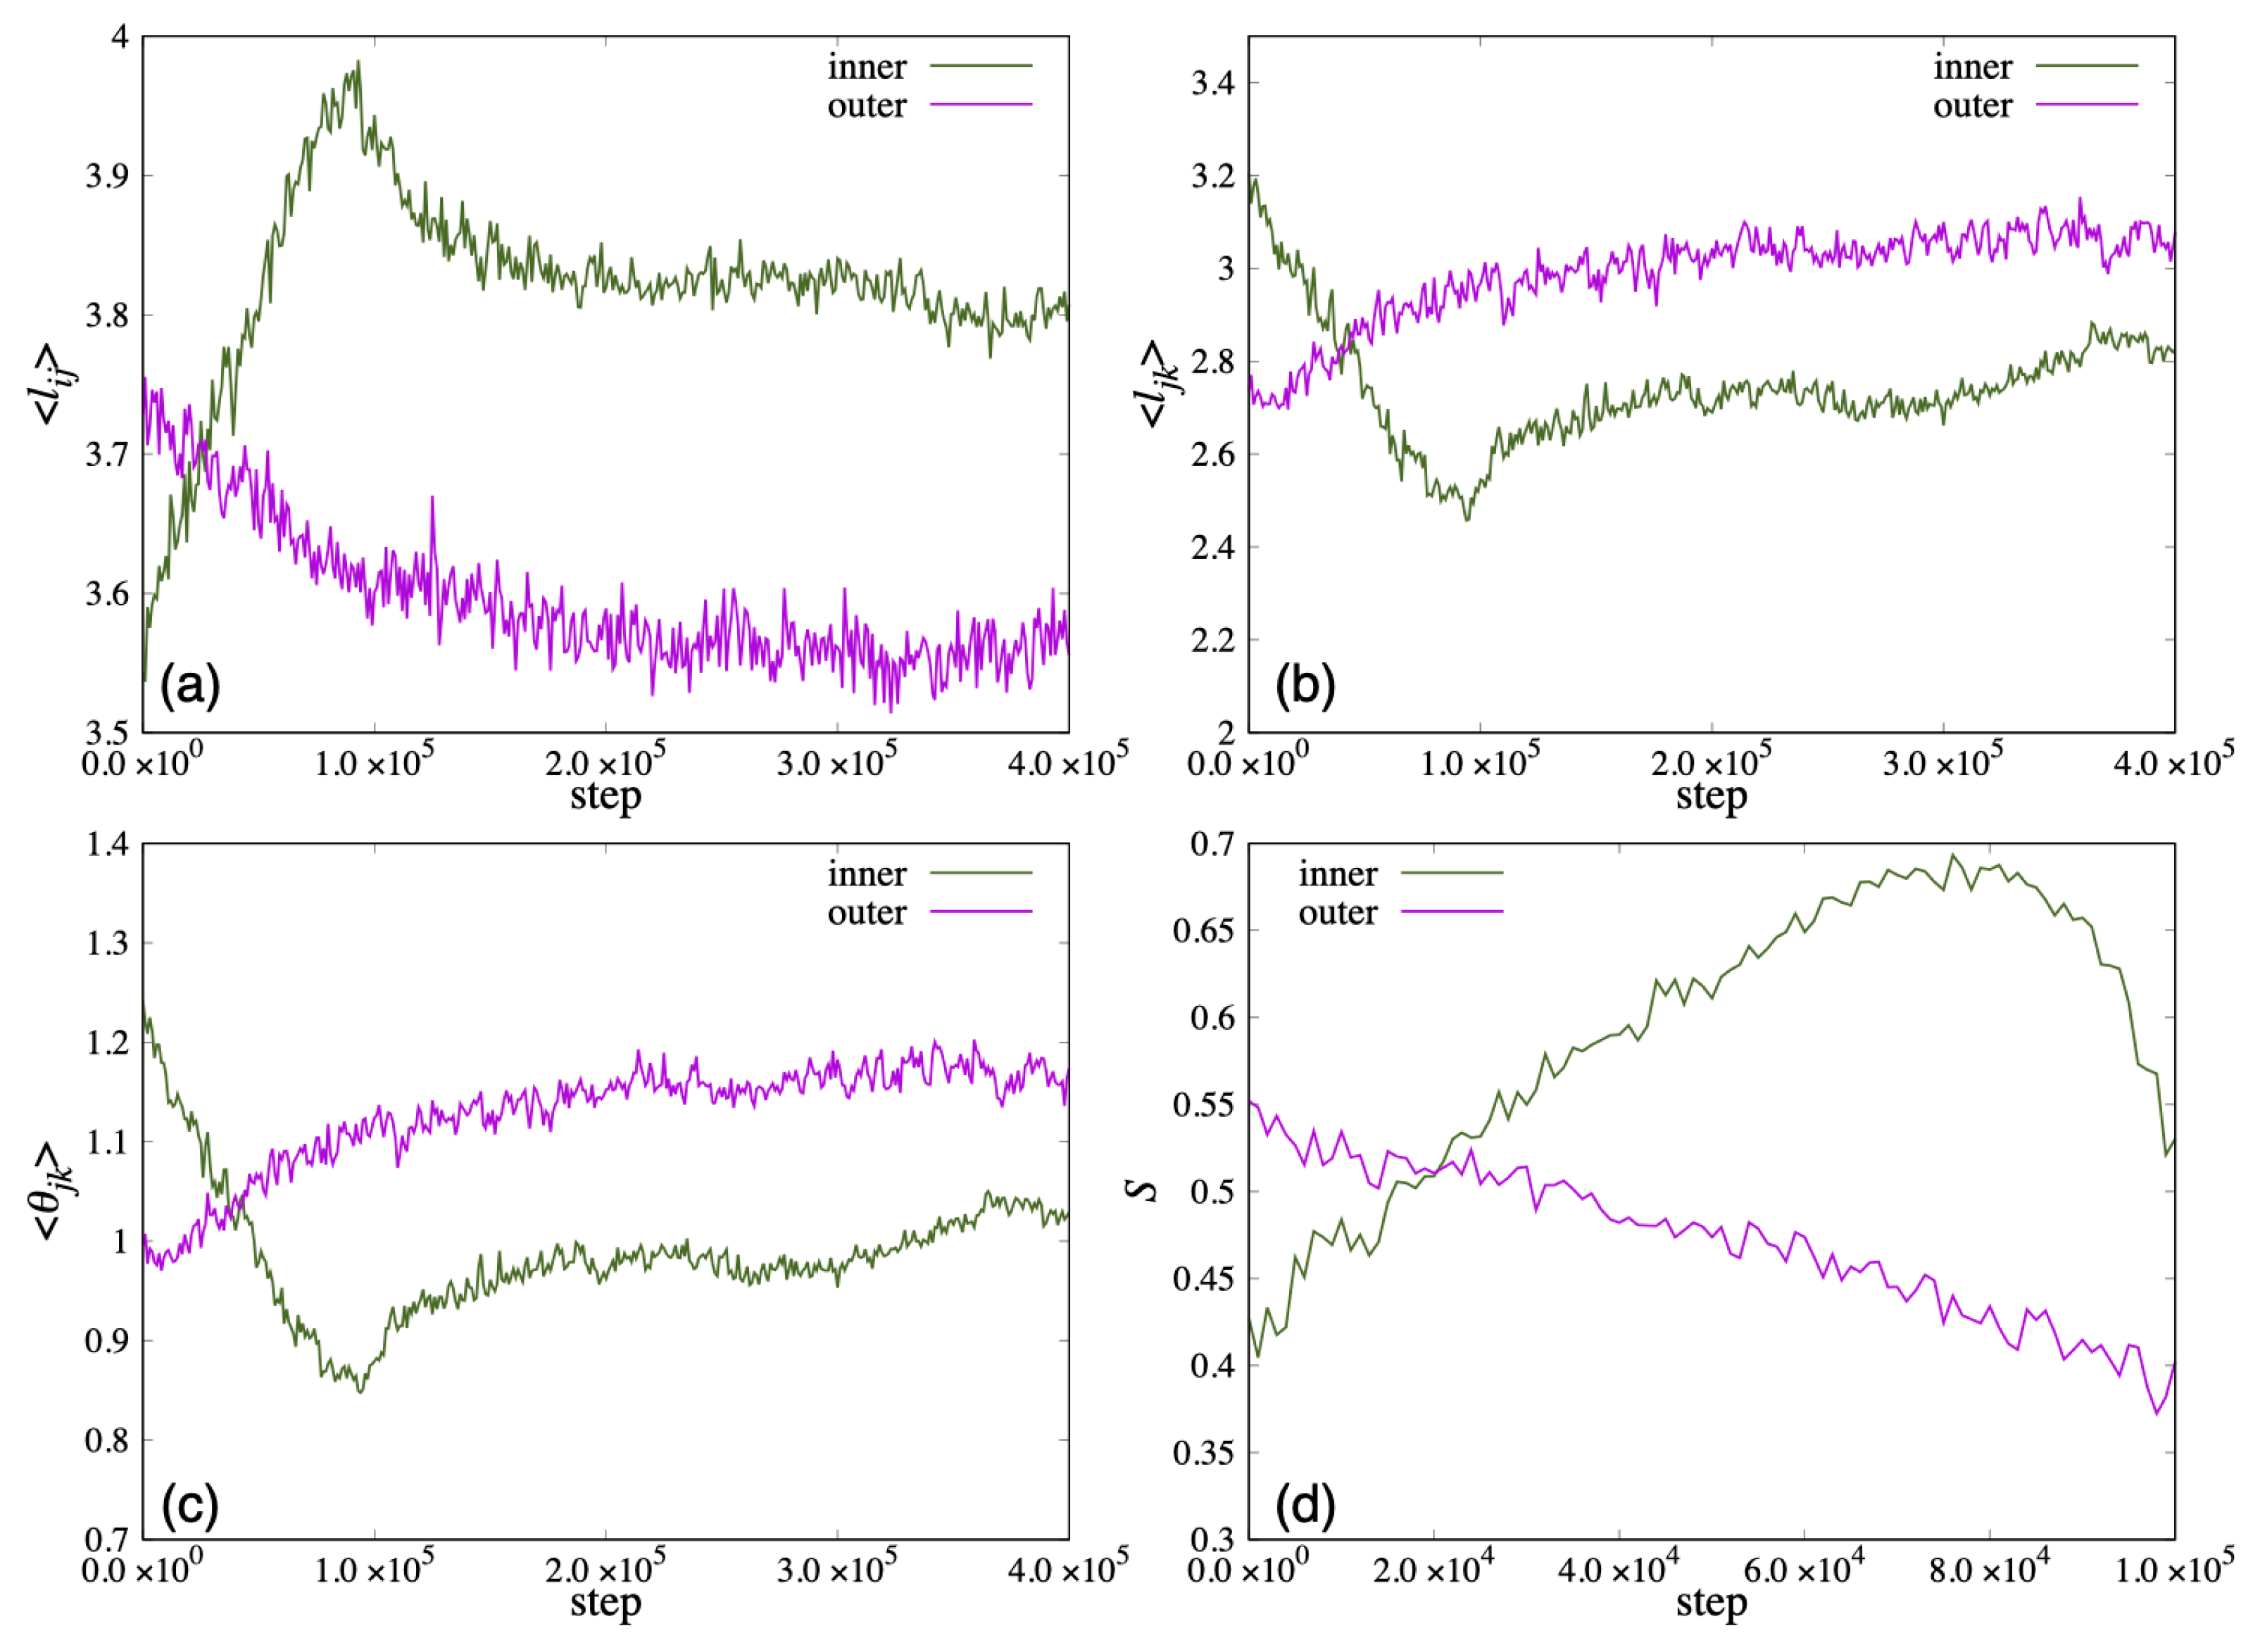
In
Figure 12, we show the time variation of the average length
and the distance between the ends of the two hydrophobic groups
that characterize the shape of the lipid molecule, and the average value of the angle formed by the roots of the two hydrophobic groups
. Because the vesicle deformed significantly from a spherical shape in 100,000 steps, the order parameter
S could not be calculated accurately. Therefore,
S was calculated up to 100,000 steps and plotted in (d). In addition,
was omitted because
was almost the same value as
. In early steps, the
of the lipid molecule inside the bilayer membrane was shorter than the outside lipid. After 20,000 steps, the
of the lipid molecule inside the bilayer membrane increased more than the outside lipid. Then, the
increased, and the
, the angle
decreased until 100,000 steps (
Figure 12a–c). The order parameter
S of the inner lipid increased until 80,000 steps and then decreased (
Figure 12d).
On the other hand, while the
and the angle
of the lipid molecule in the outside of the bilayer decreased with time, the
of the lipid molecule increased, shown in
Figure 12a–c. The order parameter
S of the outside lipid molecules decreased with time and the tilt angle of the lipid molecules increased.
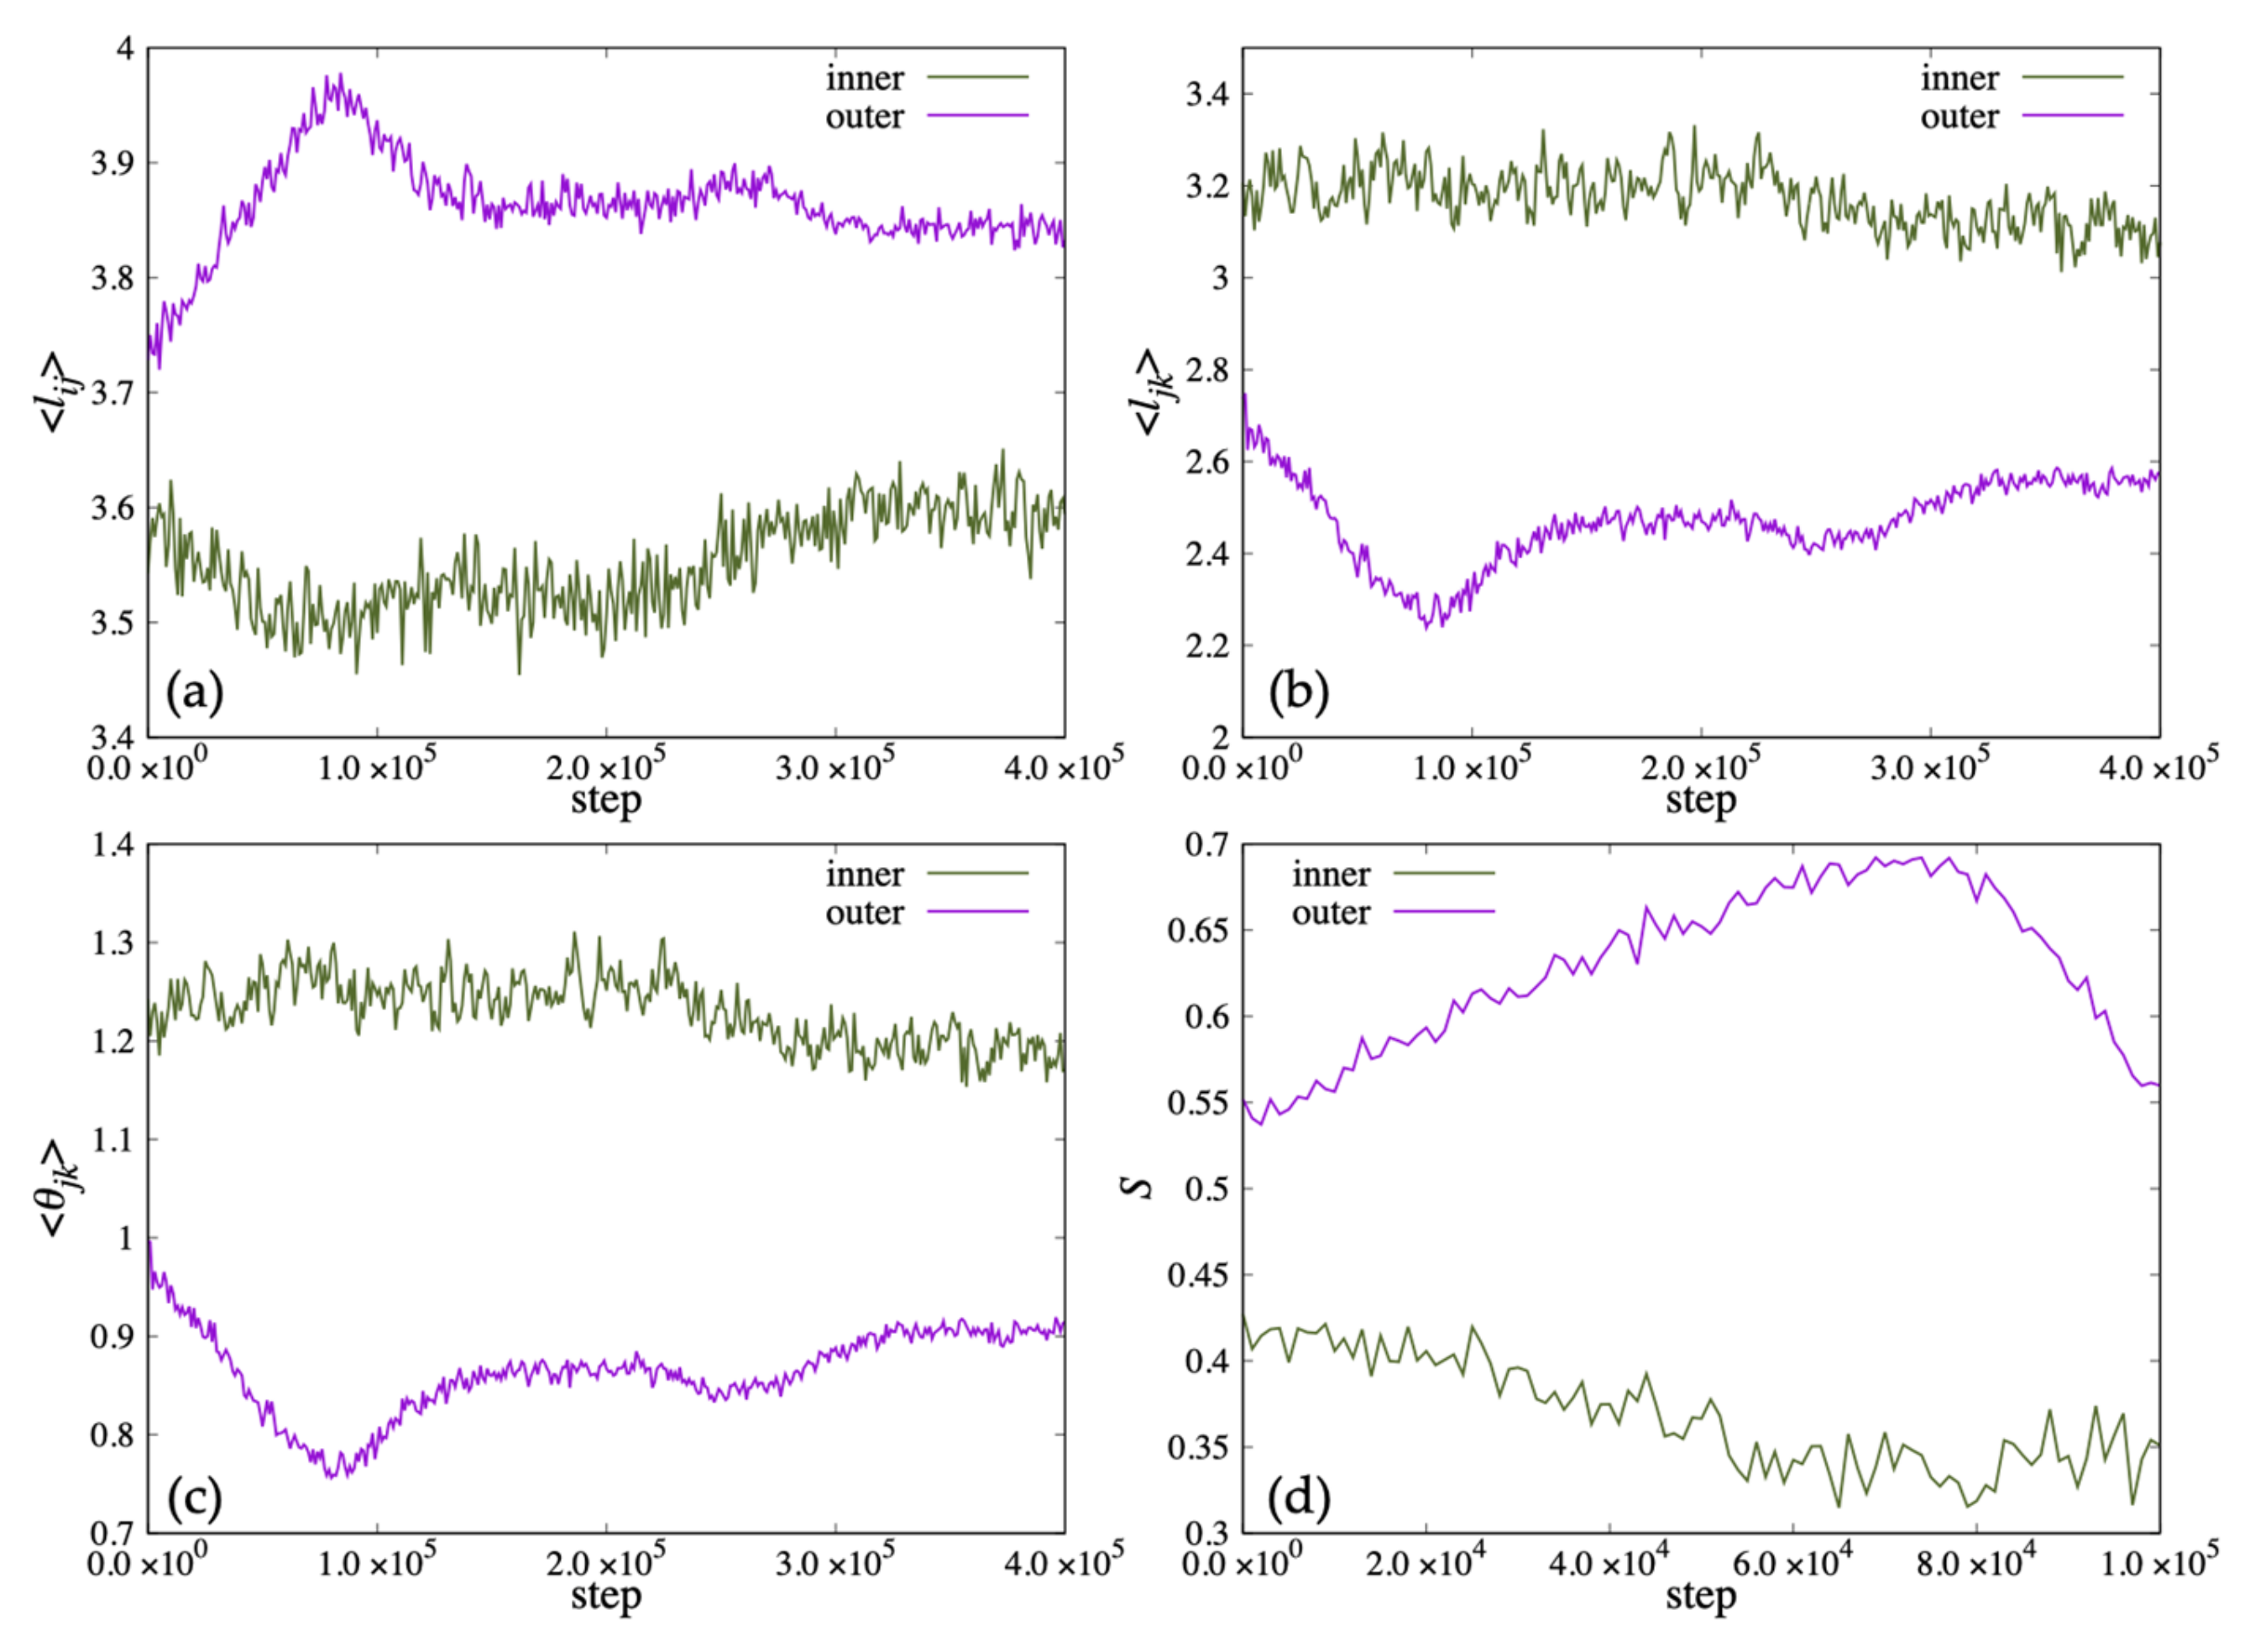
When lipid molecules were added only to the outer membrane of the vesicle, the shape change of the vesicle up to 400,000 steps was observed as shown in
Figure 10b. During this period, three lipid molecules moved outward from the inner membrane of the bilayer, and 54 molecules moved from the outside to the inside. At 100,000 steps, some double membrane protrusions were seen extending from the outer membrane of the vesicle. After 200,000 steps, two of the protrusions grew large, and multiple regions containing water particles were formed inside them. The area containing these water particles eventually increased to five.
In
Figure 13a–c, we show the time variation of the average length
, the average distance between the ends of the two hydrophobic groups
and the average value of the angle
for the lipid molecules inside the membrane. The lipid length
of the inner lipid molecule decreased with time, and increased to almost the same value as the initial state after 300,000 steps. In addition,
and
decreased around the 220,000 steps. On the other hand, the outside lipid molecules increased to 80,000 steps and then decreased at 80,000 step and 260,000 step. In
Figure 13d, the order parameter
S of the lipid molecule inside decreased with time for the inner lipid molecule. The outside lipid molecule increased until 80,000 steps and then decreased.
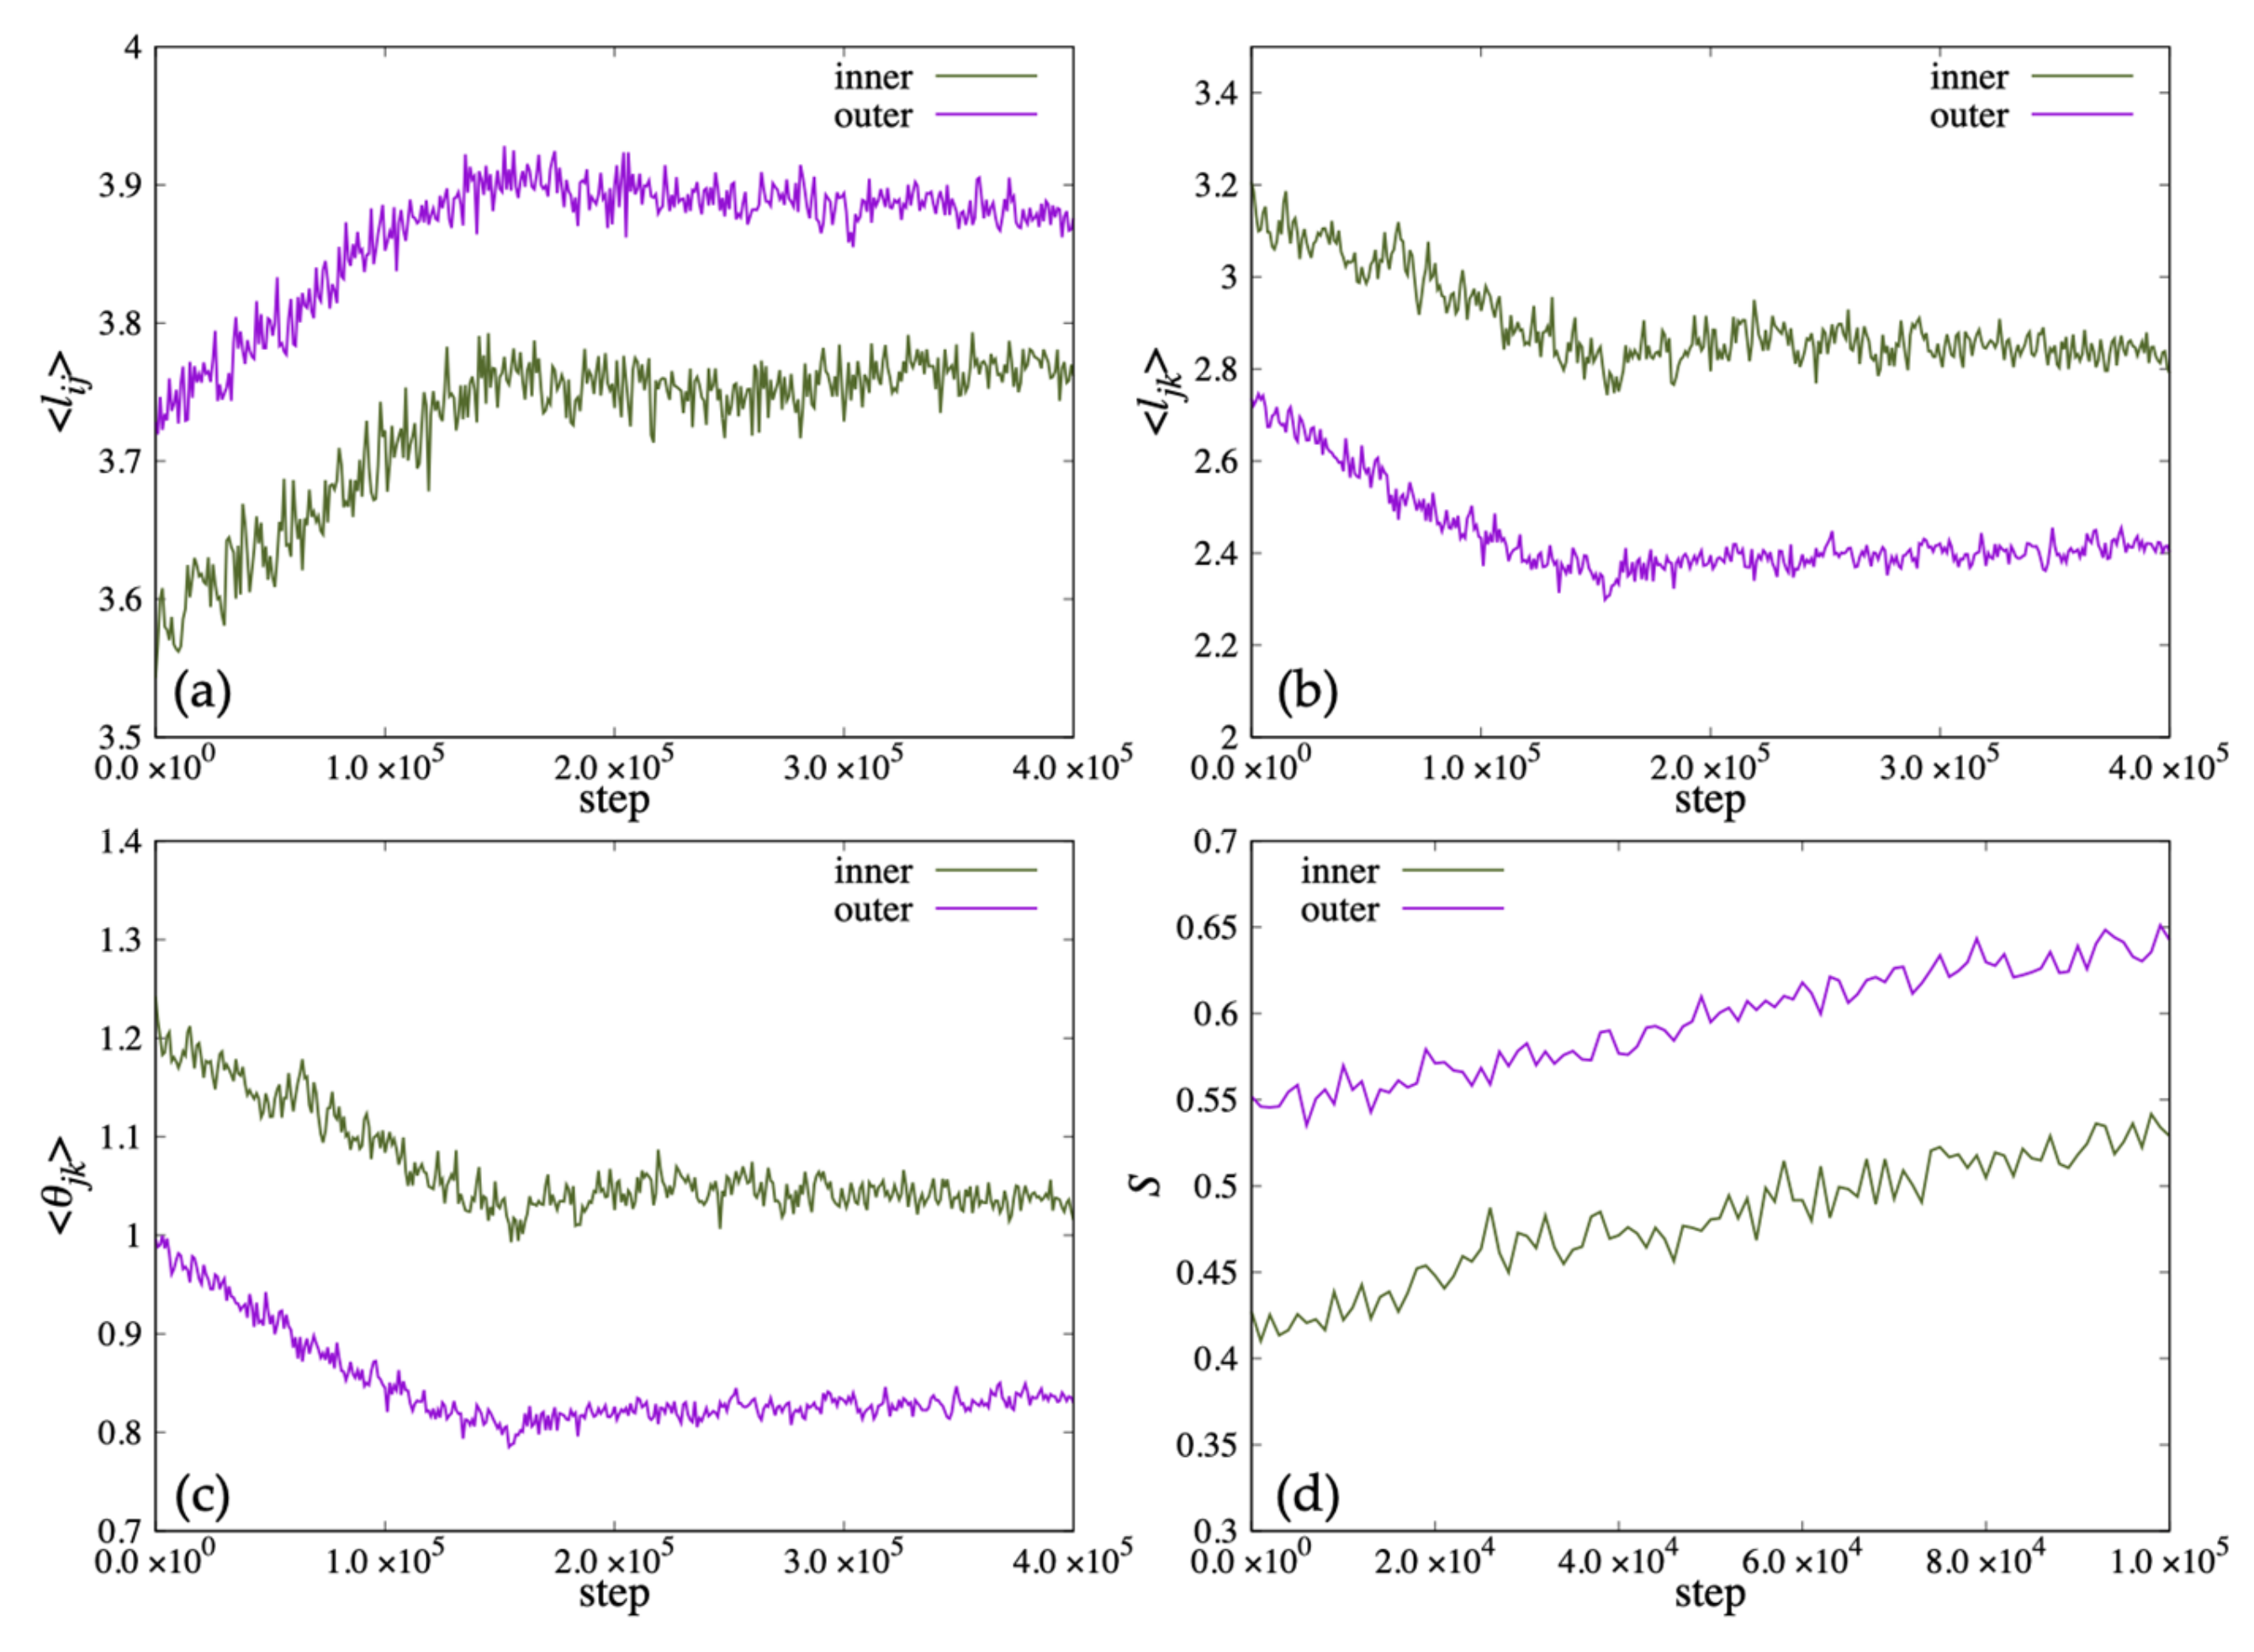
Figure 10c shows the structural change of the vesicle when lipid molecules are added to both the inside and outside of the membrane. During this period, the only lipid molecule that moved between the bilayer membranes was one lipid molecule that moved outward from the inner membrane of the bilayer membrane. The vesicle remained spherical up to 100,000 steps, but deformed flat at 200,000 steps. After 300,000 steps, the shape of the vesicle was deformed to extend like a tube. Additionally, unlike the case where lipid molecules were added to the outside or inside of the membrane, the inside of the vesicle was not divided by the membrane.
The time change of the average length
,
and the average angle
for the lipid molecules are shown in
Figure 14. The average length
of lipid molecules increased to 150,000 steps and then became constant for both inside and outside the bilayer. On the other hand,
and the average angle
decreased until 150,000 steps and then became constant. The order parameter
S increased for both layers of lipid, and the tilt angle decreased with time.
4. Discussion
From the simulation results in the previous section, it was found that the deformation process of vesicles changes depending on the position of lipid molecules incorporated into the lipid bilayer. These deformation processes resemble the shape change during the division of L-form cells, as shown in
Figure 1. Several protrusions were created on the outside of the vesicle when lipid molecules were added to the outer layer of the vesicle or on the inside of the vesicle when added to the inner layer. As the protrusions grow, semi-vesicle-like structures [
12] are formed inside or outside the vesicles causing topological changes such as membrane division. The shapes obtained by adding lipid molecules to outside membrane look like the “budding” observed during the division process of L-form cells [
1,
2]. On the other hand, the shape was similar to multi-vesicular endosome (MVE) [
24] when lipid molecules were added inside. When lipid molecules were added to both sides of the vesicle membrane, the shape of the entire vesicle was deformed so as to extend like a tube. This seems to be a shape change corresponding to the “tubulation” observed during the division process of L-form cells [
2]. In addition, in the simulation that relaxes the structure obtained by the simulation of adding lipid molecules, deformations such as returning to the vesicle of a single membrane and forming a structure close to the vesicle on the outside were observed.
Considering the relationship between the deformation of the vesicle and the behavior of the lipid molecule from a microscopic point of view, we focus on the shape of lipid molecules and their movement in the lipid bilayer, especially the flip-flop. The frequency of flip-flops of lipid molecules in the membrane was higher when lipid molecules were added to only one layer than when they were added to both layers of the membrane. Since the molecular density in the layer where the lipid molecule was added became high, the lipid molecule moved to the other layer in which the lipid molecule was not added. In addition, when lipid molecules were added to the inner layer of the membrane, protrusions of the lipid bilayer membrane were generated on the inner membrane of the vesicles, and when lipid molecules were added to the outer layer, membrane protrusions were formed on the outer membrane. That is, the excess lipid molecules in one layer move to the other layer by flip-flop, reducing the free energy due to strain between lipid molecules. However, if lipid molecules are added before the free energy due to the strain is sufficiently relaxed, the free energy of local strain in the layer to which the lipid molecules are added increases, and as a result, protrusions on the outside of the bilayer membrane will form as a new membrane structure. These bilayer protrusions are thought to have a structure similar to BP, found by Nakagawa et al. [
13].
In other words, the addition of lipid molecules increases the potential energy locally, and the kinetic energy of the particles that make up the lipid molecules increases accordingly. As a result, the lipid molecules that make up the membrane may have strong repulsion with each other, resulting in a structure in which the bilayer membrane protrudes. Similar to the study by Baoukina et al. [
12], the further addition of lipid molecules may cause the bilayer projections to bend and deform to form vesicles.
In the simulation, in which lipid molecules were added to both layers of the membrane, the shape of the vesicle was observed to change in an elongated manner. The frequency of flip-flopped lipid molecules was smaller than that of the simulation added to one layer of the membrane. The lipid molecular densities of the outer layer and the inner layer of the membrane may increase evenly, so that the area of both layers increased while suppressing the increase of strain due to the area difference elasticity between the two layers. As a result, the vesicle was deformed instead of the membrane protrusions observed in the simulation added to one side of the layer.
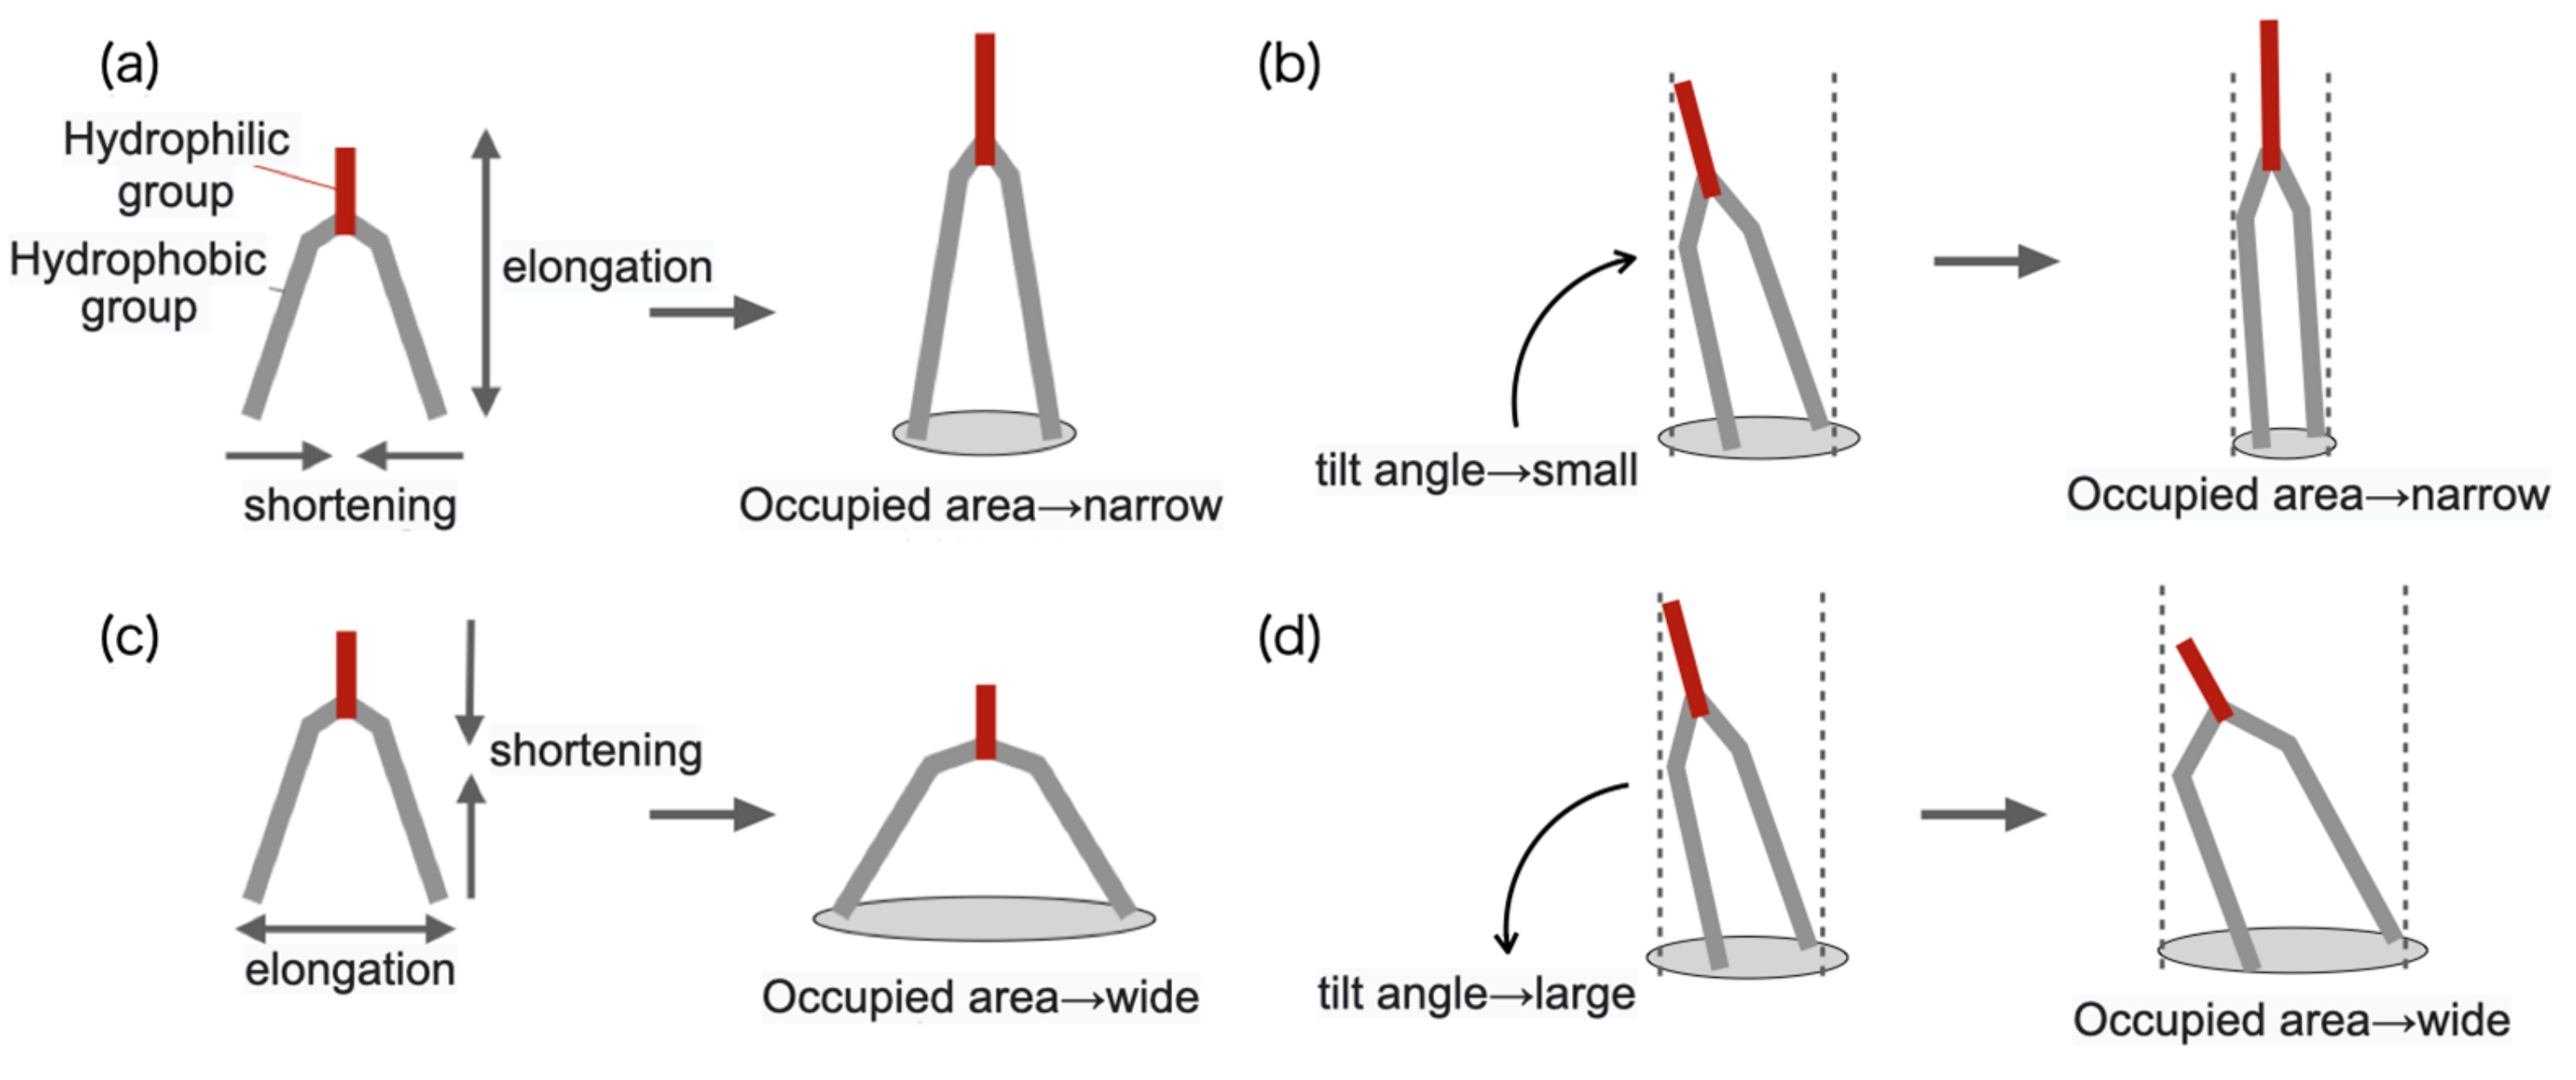
In addition,
of lipid molecules constituting the layer to which lipid molecules were added tended to increase, and
tended to decrease as shown in
Figure 15a. The shape of the lipid molecule may have been deformed so as to elongate to lipid direction. Moreover, the order parameter
S was increasing, which implies that the tilt angle was decreasing, as shown in
Figure 15b. These are because the area of the membrane that can be occupied by one lipid molecule has decreased due to the addition of the lipid molecule. On the other hand, the
of the lipid molecules constituting the layer to which the lipid molecule was not added decreased, and the
tended to increase. In other words, the shape of the lipid molecule was deformed so as to extend laterally toward the membrane surface as shown in
Figure 15c. Furthermore, the order parameter
S decreased and the tilt angle increased as shown in
Figure 15d. Since the area of the layer to which the lipid molecule was added increased, the area of the paired layer increased accordingly, and the deformation that expanded the occupied area of each lipid molecule occurred. This corresponds to the deformation to reduce the area difference elastic energy between the layers of the membrane.
During the deformation of the vesicle, the length of the lipid molecules constituting the layer to which the lipid molecules were added tended to return to the original length. It is supposed that the individual lipid molecules were deformed to their original stable shape due to the change in the global shape.
In the simulation of structural relaxation of a vesicle with multiple regions separated by a membrane, the final structure obtained by the simulation, in which lipid molecules were added every 50 steps, was used as the initial structure. When the structure obtained by the simulation of adding lipid molecules to the inner layer or both layers of the membrane was used as the initial structure, the number of water regions inside the vesicle divided by the membrane decreased with time. The shape observed during the addition of lipid molecules is thought to be the characteristic structure found in the non-equilibrium state. Therefore, it is expected that the vesicle will eventually return to a more stable single-membrane vesicle.
In the relaxation simulation of the structure, generated by adding lipid molecules to the outer membrane, the number of regions divided by the bilayer membrane repeatedly increased and decreased, as shown in
Figure 9b. This indicates that on the outside of the vesicle, the semi-vesicle structures [
12], which were formed by bending and fusing the protrusions of the bilayer membrane, repeats generation and disappearance in thermal fluctuation. This may indicate that the free energy barrier for returning to the single membrane vesicle is high. Therefore, even if the relaxation simulation is continued for a longer period of time, it is possible that the shape will be different from that of the single bilayer vesicle, causing vesicular division through budding.
Table 5 shows the number of lipid molecules flip-flopped per 10,000 steps in the addition and relaxation simulations.
The frequency of flip-flops per unit time was higher when lipid molecules were added every 100 steps than when lipid molecules were added to one layer every 50 steps. Flip-flops are generated to eliminate the strain generated in the membrane structure; the longer the time interval for adding lipid molecules, the more efficiently the strain in the membrane structure can be eliminated. In addition, in the simulation that relaxes the structure obtained by adding lipid molecules every 50 steps, more lipid molecules flip-flopped per unit time than in the simulation that added every 100 steps. The lipid molecules that could not be flip-flopped in the additional simulation flip-flopped during relaxation.
On the other hand, in the simulation in which lipid molecules were added to both layers, there were fewer lipid molecules that flip-flop than those in which lipid molecules were added to one side, including the case of relaxation. This is a result of suppressing the increase in free energy due to the area difference between the two layers by adding lipid molecules proportional to the number of lipid molecules in both layers.
5. Conclusions
In this study, we performed a simulation in which lipid molecules were added to the lipid bilayer vesicle and then relaxed. Additions to the outer layer and both layers resulted in a shape similar to an L-form cell. On the other hand, additions to the inner layer did not obtain that shape. In addition, in the simulation that relaxes the structure obtained by the simulation of adding lipid molecules, deformations such as returning to the vesicle of a single membrane and forming a structure close to the vesicle on the outside, were observed.
Though we were able to observe the shape change accompanied by the topology change as mentioned above, we could not reproduce the division of vesicle. In order to confirm the state of division, it may be necessary to perform a longer simulation and to make the interval of adding lipid molecules slower.
Due to computer specifications, in this study, simulations were performed using a small vesicle with a radius of
nm as a model. Adding lipid molecules directly to the membrane also shortened the calculation time. In order to calculate with a larger system, it is necessary to devise ways to reduce the calculation time. Simulations of larger vesicles using some useful technique may show shape changes in more metastable states seen during the division of L-form cells, as well as the MVE [
24] observed in vivo.
The important points suggested by the simulation results in this study are as follows. It was shown that when lipids were added to the outer layer of the lipid bilayer that forms the vesicle, the area of the outer layer increased and the vesicle grew via the budding path. It was also found that when lipids were added to both layers of the lipid bilayer, the vesicles grew elongated and deformed like tubulation. These closely resemble the deformations seen in the growth of L-form cells. On the other hand, when lipids were added to the inner layer of the lipid bilayer, the interior of the vesicle was divided into several regions separated by membranes. Although this morphology has not been observed in the growth of L-form cells, similar morphology has been observed in MVE. Thus, it is expected that the pathway of shape change during division of L-form cells is selected depending on which layer of the cell membrane the lipid is added to.


