

Intragenic L1 Insertion: One Possibility of Brain Disorder


Abstract
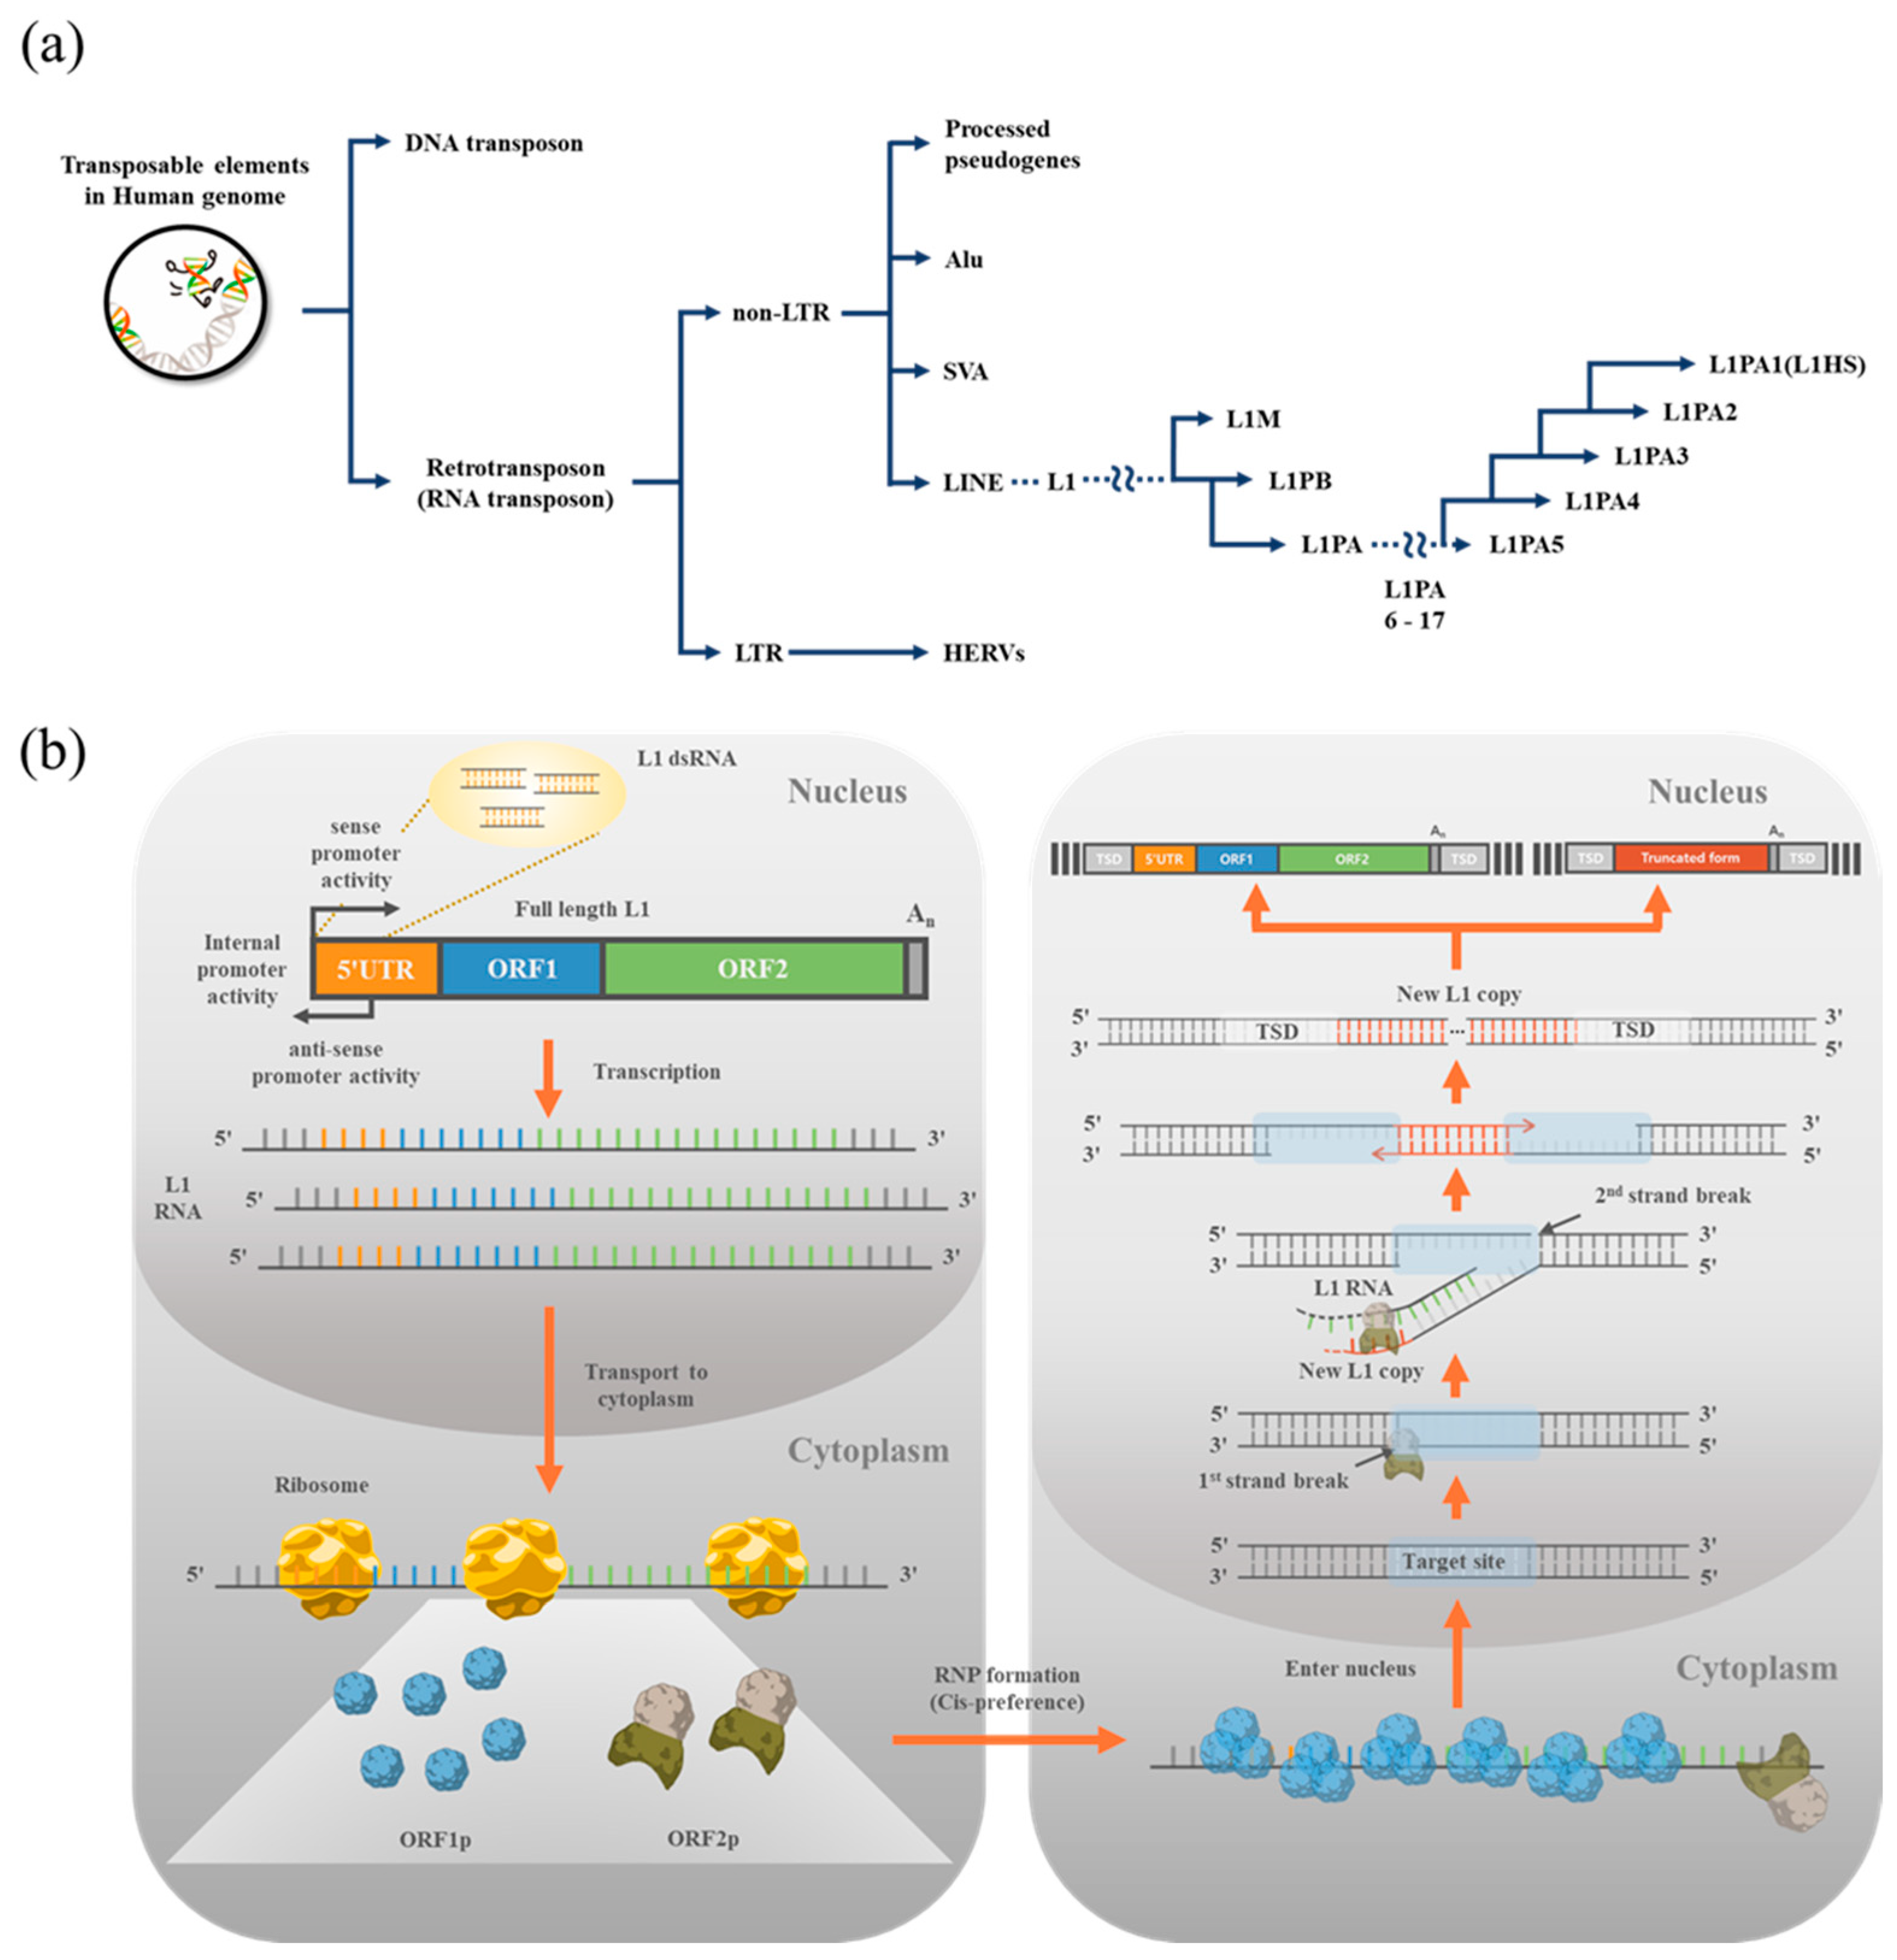
:1. Transposons in the Human Genome
2. LINE1 (L1)
3. Monitoring L1 Expression and Retrotransposition
4. L1 in Physiological Condition
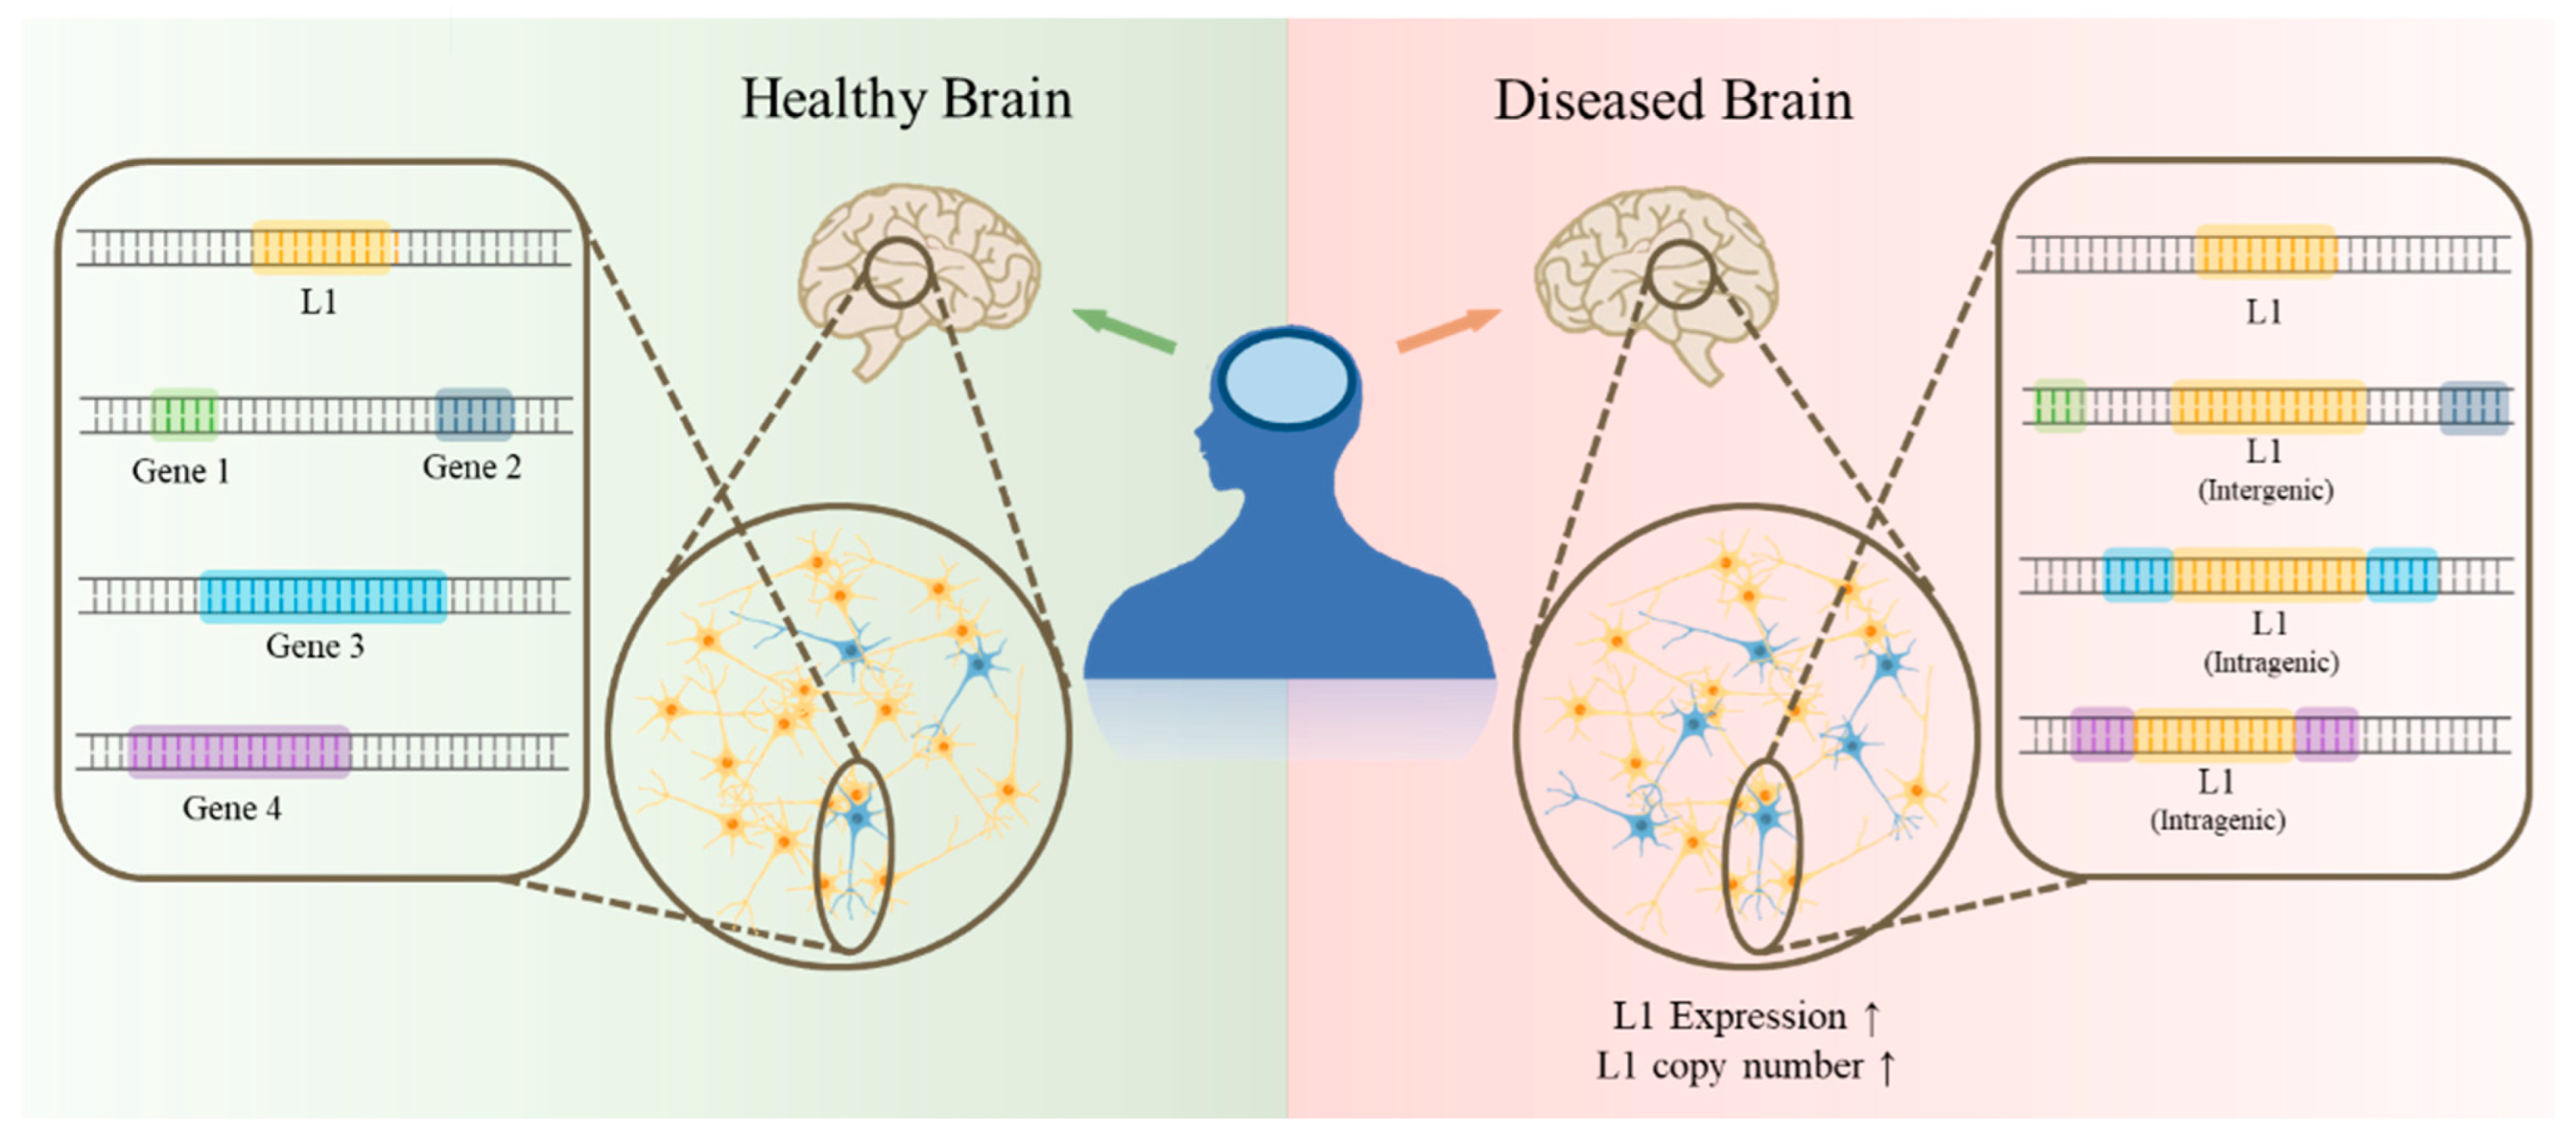
5. L1 in Pathological Condition

| Brain Disorder | Sample Origin | Relative L1 Copy Numbers between Diseased Brain and Healthy Brain | Ref |
|---|---|---|---|
| SZ | PFC | 1.62 | [60] |
| RTT | PFC | 1.04 | [50] |
| CB | 3.17 | [69] | |
| AT | CB | 1.38 | |
| ASD | CB | 3.07 | |
| TSC | CB | 1.11 | |
| Healthy Subjects | PFC/CB | 1 | - |
6. L1 Insertion into Genes, Associated with Brain Disorders: Potential Trigger of Diseases
7. Discussion
Funding
Institutional Review Board Statement
Informed Consent Statement
Acknowledgments
Conflicts of Interest
References
- Lander, E.S.; Linton, L.M.; Birren, B.; Nusbaum, C.; Zody, M.C.; Baldwin, J.; Devon, K.; Dewar, K.; Doyle, M.; FitzHugh, W.; et al. Initial sequencing and analysis of the human genome. Nature 2001, 409, 860–921. [Google Scholar] [CrossRef] [PubMed]
- Barbulescu, M.; Turner, G.; Seaman, M.I.; Deinard, A.S.; Kidd, K.K.; Lenz, J. Many human endogenous retrovirus K (HERV-K) proviruses are unique to humans. Curr. Biol. 1999, 9, 861–868. [Google Scholar] [CrossRef]
- Shin, W.; Lee, J.; Son, S.Y.; Ahn, K.; Kim, H.S.; Han, K. Human-specific HERV-K insertion causes genomic variations in the human genome. PLoS ONE 2013, 8, e60605. [Google Scholar] [CrossRef]
- Jha, A.R.; Pillai, S.K.; York, V.A.; Sharp, E.R.; Storm, E.C.; Wachter, D.J.; Martin, J.N.; Deeks, S.G.; Rosenberg, M.G.; Nixon, D.F.; et al. Cross-sectional dating of novel haplotypes of HERV-K 113 and HERV-K 115 indicate these proviruses originated in Africa before Homo sapiens. Mol. Biol. Evol. 2009, 26, 2617–2626. [Google Scholar] [CrossRef]
- Jha, A.R.; Nixon, D.F.; Rosenberg, M.G.; Martin, J.N.; Deeks, S.G.; Hudson, R.R.; Garrison, K.E.; Pillai, S.K. Human endogenous retrovirus K106 (HERV-K106) was infectious after the emergence of anatomically modern humans. PLoS ONE 2011, 6, e20234. [Google Scholar] [CrossRef]
- Mills, R.E.; Bennett, E.A.; Iskow, R.C.; Devine, S.E. Which transposable elements are active in the human genome? Trends Genet. 2007, 23, 183–191. [Google Scholar] [CrossRef]
- Vargiu, L.; Rodriguez-Tome, P.; Sperber, G.O.; Cadeddu, M.; Grandi, N.; Blikstad, V.; Tramontano, E.; Blomberg, J. Classification and characterization of human endogenous retroviruses; mosaic forms are common. Retrovirology 2016, 13, 7. [Google Scholar] [CrossRef]
- Moran, J.V.; Holmes, S.E.; Naas, T.P.; DeBerardinis, R.J.; Boeke, J.D.; Kazazian, H.H., Jr. High frequency retrotransposition in cultured mammalian cells. Cell 1996, 87, 917–927. [Google Scholar] [CrossRef]
- Khan, H.; Smit, A.; Boissinot, S. Molecular evolution and tempo of amplification of human LINE-1 retrotransposons since the origin of primates. Genome Res. 2006, 16, 78–87. [Google Scholar] [CrossRef]
- Giordano, J.; Ge, Y.; Gelfand, Y.; Abrusan, G.; Benson, G.; Warburton, P.E. Evolutionary history of mammalian transposons determined by genome-wide defragmentation. PLoS Comput. Biol. 2007, 3, e137. [Google Scholar] [CrossRef] [Green Version]
- Boissinot, S.; Chevret, P.; Furano, A.V. L1 (LINE-1) retrotransposon evolution and amplification in recent human history. Mol. Biol. Evol. 2000, 17, 915–928. [Google Scholar] [CrossRef] [PubMed]
- Smit, A.F.; Toth, G.; Riggs, A.D.; Jurka, J. Ancestral, mammalian-wide subfamilies of LINE-1 repetitive sequences. J. Mol. Biol. 1995, 246, 401–417. [Google Scholar] [CrossRef] [PubMed]
- Skowronski, J.; Fanning, T.G.; Singer, M.F. Unit-length line-1 transcripts in human teratocarcinoma cells. Mol. Cell. Biol. 1988, 8, 1385–1397. [Google Scholar] [CrossRef]
- Sun, X.; Wang, X.; Tang, Z.; Grivainis, M.; Kahler, D.; Yun, C.; Mita, P.; Fenyo, D.; Boeke, J.D. Transcription factor profiling reveals molecular choreography and key regulators of human retrotransposon expression. Proc. Natl. Acad. Sci. USA 2018, 115, E5526–E5535. [Google Scholar] [CrossRef]
- Szak, S.T.; Pickeral, O.K.; Makalowski, W.; Boguski, M.S.; Landsman, D.; Boeke, J.D. Molecular archeology of L1 insertions in the human genome. Genome Biol. 2002, 3, research0052. [Google Scholar] [CrossRef] [PubMed]
- Swergold, G.D. Identification, characterization, and cell specificity of a human LINE-1 promoter. Mol. Cell Biol. 1990, 10, 6718–6729. [Google Scholar] [CrossRef]
- Esnault, C.; Maestre, J.; Heidmann, T. Human LINE retrotransposons generate processed pseudogenes. Nat. Genet. 2000, 24, 363–367. [Google Scholar] [CrossRef]
- Wei, W.; Gilbert, N.; Ooi, S.L.; Lawler, J.F.; Ostertag, E.M.; Kazazian, H.H.; Boeke, J.D.; Moran, J.V. Human L1 retrotransposition: Cis preference versus trans complementation. Mol. Cell Biol. 2001, 21, 1429–1439. [Google Scholar] [CrossRef]
- Jurka, J. Sequence patterns indicate an enzymatic involvement in integration of mammalian retroposons. Proc. Natl. Acad. Sci. USA 1997, 94, 1872–1877. [Google Scholar] [CrossRef]
- Cost, G.J.; Feng, Q.; Jacquier, A.; Boeke, J.D. Human L1 element target-primed reverse transcription in vitro. EMBO J. 2002, 21, 5899–5910. [Google Scholar] [CrossRef]
- Ostertag, E.M.; Kazazian, H.H., Jr. Twin priming: A proposed mechanism for the creation of inversions in L1 retrotransposition. Genome Res. 2001, 11, 2059–2065. [Google Scholar] [CrossRef] [PubMed]
- Zingler, N.; Willhoeft, U.; Brose, H.P.; Schoder, V.; Jahns, T.; Hanschmann, K.M.; Morrish, T.A.; Lower, J.; Schumann, G.G. Analysis of 5’ junctions of human LINE-1 and Alu retrotransposons suggests an alternative model for 5’-end attachment requiring microhomology-mediated end-joining. Genome Res. 2005, 15, 780–789. [Google Scholar] [CrossRef] [PubMed]
- Kojima, K.K. Different integration site structures between L1 protein-mediated retrotransposition in cis and retrotransposition in trans. Mob. DNA 2010, 1, 17. [Google Scholar] [CrossRef] [PubMed]
- Goodier, J.L.; Ostertag, E.M.; Kazazian, H.H., Jr. Transduction of 3’-flanking sequences is common in L1 retrotransposition. Hum. Mol. Genet. 2000, 9, 653–657. [Google Scholar] [CrossRef] [PubMed]
- Gogvadze, E.; Buzdin, A. Retroelements and their impact on genome evolution and functioning. Cell Mol. Life Sci. 2009, 66, 3727–3742. [Google Scholar] [CrossRef] [PubMed]
- Elbarbary, R.A.; Lucas, B.A.; Maquat, L.E. Retrotransposons as regulators of gene expression. Science 2016, 351, aac7247. [Google Scholar] [CrossRef]
- Cordaux, R.; Batzer, M.A. The impact of retrotransposons on human genome evolution. Nat. Rev. Genet. 2009, 10, 691–703. [Google Scholar] [CrossRef]
- Symer, D.E.; Connelly, C.; Szak, S.T.; Caputo, E.M.; Cost, G.J.; Parmigiani, G.; Boeke, J.D. Human l1 retrotransposition is associated with genetic instability in vivo. Cell 2002, 110, 327–338. [Google Scholar] [CrossRef]
- Beck, C.R.; Garcia-Perez, J.L.; Badge, R.M.; Moran, J.V. LINE-1 elements in structural variation and disease. Annu. Rev. Genom. Hum. Genet. 2011, 12, 187–215. [Google Scholar] [CrossRef]
- Chen, J.M.; Ferec, C.; Cooper, D.N. LINE-1 endonuclease-dependent retrotranspositional events causing human genetic disease: Mutation detection bias and multiple mechanisms of target gene disruption. J. Biomed. Biotechnol. 2006, 2006, 56182. [Google Scholar] [CrossRef] [Green Version]
- Goodier, J.L.; Kazazian, H.H., Jr. Retrotransposons revisited: The restraint and rehabilitation of parasites. Cell 2008, 135, 23–35. [Google Scholar] [CrossRef] [PubMed]
- Han, J.S.; Boeke, J.D. LINE-1 retrotransposons: Modulators of quantity and quality of mammalian gene expression? Bioessays 2005, 27, 775–784. [Google Scholar] [CrossRef] [PubMed]
- Medstrand, P.; van de Lagemaat, L.N.; Dunn, C.A.; Landry, J.R.; Svenback, D.; Mager, D.L. Impact of transposable elements on the evolution of mammalian gene regulation. Cytogenet. Genome Res. 2005, 110, 342–352. [Google Scholar] [CrossRef]
- Belancio, V.P.; Hedges, D.J.; Deininger, P. Mammalian non-LTR retrotransposons: For better or worse, in sickness and in health. Genome Res. 2008, 18, 343–358. [Google Scholar] [CrossRef]
- Lutz, S.M.; Vincent, B.J.; Kazazian, H.H., Jr.; Batzer, M.A.; Moran, J.V. Allelic heterogeneity in LINE-1 retrotransposition activity. Am. J. Hum. Genet. 2003, 73, 1431–1437. [Google Scholar] [CrossRef] [PubMed]
- Selvin, S. Maximum likelihood estimation for complete or incomplete discrete data. Comput. Programs Biomed. 1980, 11, 83–87. [Google Scholar] [CrossRef]
- Fadloun, A.; Le Gras, S.; Jost, B.; Ziegler-Birling, C.; Takahashi, H.; Gorab, E.; Carninci, P.; Torres-Padilla, M.E. Chromatin signatures and retrotransposon profiling in mouse embryos reveal regulation of LINE-1 by RNA. Nat. Struct. Mol. Biol. 2013, 20, 332–338. [Google Scholar] [CrossRef]
- Jachowicz, J.W.; Bing, X.; Pontabry, J.; Boskovic, A.; Rando, O.J.; Torres-Padilla, M.E. LINE-1 activation after fertilization regulates global chromatin accessibility in the early mouse embryo. Nat. Genet. 2017, 49, 1502–1510. [Google Scholar] [CrossRef]
- Percharde, M.; Lin, C.J.; Yin, Y.; Guan, J.; Peixoto, G.A.; Bulut-Karslioglu, A.; Biechele, S.; Huang, B.; Shen, X.; Ramalho-Santos, M. A LINE1-Nucleolin Partnership Regulates Early Development and ESC Identity. Cell 2018, 174, 391–405.e319. [Google Scholar] [CrossRef]
- Gabellini, D.; Green, M.R.; Tupler, R. Inappropriate gene activation in FSHD: A repressor complex binds a chromosomal repeat deleted in dystrophic muscle. Cell 2002, 110, 339–348. [Google Scholar] [CrossRef] [Green Version]
- Newkirk, S.J.; Lee, S.; Grandi, F.C.; Gaysinskaya, V.; Rosser, J.M.; Vanden Berg, N.; Hogarth, C.A.; Marchetto, M.C.N.; Muotri, A.R.; Griswold, M.D.; et al. Intact piRNA pathway prevents L1 mobilization in male meiosis. Proc. Natl. Acad. Sci. USA 2017, 114, E5635–E5644. [Google Scholar] [CrossRef] [PubMed]
- Malki, S.; van der Heijden, G.W.; O’Donnell, K.A.; Martin, S.L.; Bortvin, A. A role for retrotransposon LINE-1 in fetal oocyte attrition in mice. Dev. Cell 2014, 29, 521–533. [Google Scholar] [CrossRef] [PubMed]
- Muotri, A.R.; Chu, V.T.; Marchetto, M.C.; Deng, W.; Moran, J.V.; Gage, F.H. Somatic mosaicism in neuronal precursor cells mediated by L1 retrotransposition. Nature 2005, 435, 903–910. [Google Scholar] [CrossRef]
- Coufal, N.G.; Garcia-Perez, J.L.; Peng, G.E.; Yeo, G.W.; Mu, Y.; Lovci, M.T.; Morell, M.; O’Shea, K.S.; Moran, J.V.; Gage, F.H. L1 retrotransposition in human neural progenitor cells. Nature 2009, 460, 1127–1131. [Google Scholar] [CrossRef]
- Erwin, J.A.; Paquola, A.C.; Singer, T.; Gallina, I.; Novotny, M.; Quayle, C.; Bedrosian, T.A.; Alves, F.I.; Butcher, C.R.; Herdy, J.R.; et al. L1-associated genomic regions are deleted in somatic cells of the healthy human brain. Nat. Neurosci. 2016, 19, 1583–1591. [Google Scholar] [CrossRef] [PubMed]
- Baillie, J.K.; Barnett, M.W.; Upton, K.R.; Gerhardt, D.J.; Richmond, T.A.; De Sapio, F.; Brennan, P.M.; Rizzu, P.; Smith, S.; Fell, M.; et al. Somatic retrotransposition alters the genetic landscape of the human brain. Nature 2011, 479, 534–537. [Google Scholar] [CrossRef]
- Evrony, G.D.; Cai, X.; Lee, E.; Hills, L.B.; Elhosary, P.C.; Lehmann, H.S.; Parker, J.J.; Atabay, K.D.; Gilmore, E.C.; Poduri, A.; et al. Single-neuron sequencing analysis of L1 retrotransposition and somatic mutation in the human brain. Cell 2012, 151, 483–496. [Google Scholar] [CrossRef]
- Evrony, G.D.; Lee, E.; Mehta, B.K.; Benjamini, Y.; Johnson, R.M.; Cai, X.; Yang, L.; Haseley, P.; Lehmann, H.S.; Park, P.J.; et al. Cell lineage analysis in human brain using endogenous retroelements. Neuron 2015, 85, 49–59. [Google Scholar] [CrossRef]
- Upton, K.R.; Gerhardt, D.J.; Jesuadian, J.S.; Richardson, S.R.; Sanchez-Luque, F.J.; Bodea, G.O.; Ewing, A.D.; Salvador-Palomeque, C.; van der Knaap, M.S.; Brennan, P.M.; et al. Ubiquitous L1 mosaicism in hippocampal neurons. Cell 2015, 161, 228–239. [Google Scholar] [CrossRef]
- Zhao, B.; Wu, Q.; Ye, A.Y.; Guo, J.; Zheng, X.; Yang, X.; Yan, L.; Liu, Q.R.; Hyde, T.M.; Wei, L.; et al. Somatic LINE-1 retrotransposition in cortical neurons and non-brain tissues of Rett patients and healthy individuals. PLoS Genet. 2019, 15, e1008043. [Google Scholar] [CrossRef] [Green Version]
- Zhu, X.; Zhou, B.; Pattni, R.; Gleason, K.; Tan, C.; Kalinowski, A.; Sloan, S.; Fiston-Lavier, A.S.; Mariani, J.; Petrov, D.; et al. Machine learning reveals bilateral distribution of somatic L1 insertions in human neurons and glia. Nat. Neurosci. 2021, 24, 186–196. [Google Scholar] [CrossRef] [PubMed]
- Kazazian, H.H., Jr.; Wong, C.; Youssoufian, H.; Scott, A.F.; Phillips, D.G.; Antonarakis, S.E. Haemophilia A resulting from de novo insertion of L1 sequences represents a novel mechanism for mutation in man. Nature 1988, 332, 164–166. [Google Scholar] [CrossRef] [PubMed]
- Seleme, M.C.; Vetter, M.R.; Cordaux, R.; Bastone, L.; Batzer, M.A.; Kazazian, H.H., Jr. Extensive individual variation in L1 retrotransposition capability contributes to human genetic diversity. Proc. Natl. Acad. Sci. USA 2006, 103, 6611–6616. [Google Scholar] [CrossRef] [PubMed]
- Witherspoon, D.J.; Marchani, E.E.; Watkins, W.S.; Ostler, C.T.; Wooding, S.P.; Anders, B.A.; Fowlkes, J.D.; Boissinot, S.; Furano, A.V.; Ray, D.A.; et al. Human population genetic structure and diversity inferred from polymorphic L1(LINE-1) and Alu insertions. Hum. Hered. 2006, 62, 30–46. [Google Scholar] [CrossRef] [PubMed]
- Anwar, S.L.; Wulaningsih, W.; Lehmann, U. Transposable Elements in Human Cancer: Causes and Consequences of Deregulation. Int. J. Mol. Sci. 2017, 18, 974. [Google Scholar] [CrossRef]
- Konkel, M.K.; Batzer, M.A. A mobile threat to genome stability: The impact of non-LTR retrotransposons upon the human genome. Semin. Cancer Biol. 2010, 20, 211–221. [Google Scholar] [CrossRef]
- Rodriguez-Martin, B.; Alvarez, E.G.; Baez-Ortega, A.; Zamora, J.; Supek, F.; Demeulemeester, J.; Santamarina, M.; Ju, Y.S.; Temes, J.; Garcia-Souto, D.; et al. Pan-cancer analysis of whole genomes identifies driver rearrangements promoted by LINE-1 retrotransposition. Nat. Genet. 2020, 52, 306–319. [Google Scholar] [CrossRef]
- Erwin, J.A.; Marchetto, M.C.; Gage, F.H. Mobile DNA elements in the generation of diversity and complexity in the brain. Nat. Rev. Neurosci. 2014, 15, 497–506. [Google Scholar] [CrossRef]
- Suarez, N.A.; Macia, A.; Muotri, A.R. LINE-1 retrotransposons in healthy and diseased human brain. Dev. Neurobiol. 2018, 78, 434–455. [Google Scholar] [CrossRef]
- Bundo, M.; Toyoshima, M.; Okada, Y.; Akamatsu, W.; Ueda, J.; Nemoto-Miyauchi, T.; Sunaga, F.; Toritsuka, M.; Ikawa, D.; Kakita, A.; et al. Increased l1 retrotransposition in the neuronal genome in schizophrenia. Neuron 2014, 81, 306–313. [Google Scholar] [CrossRef] [Green Version]
- Shpyleva, S.; Melnyk, S.; Pavliv, O.; Pogribny, I.; Jill James, S. Overexpression of LINE-1 Retrotransposons in Autism Brain. Mol. Neurobiol. 2018, 55, 1740–1749. [Google Scholar] [CrossRef] [PubMed]
- Cheng, Q.; Chen, J. Mechanism of p53 stabilization by ATM after DNA damage. Cell Cycle 2010, 9, 472–478. [Google Scholar] [CrossRef] [PubMed]
- Tiwari, B.; Jones, A.E.; Caillet, C.J.; Das, S.; Royer, S.K.; Abrams, J.M. p53 directly represses human LINE1 transposons. Genes Dev. 2020, 34, 1439–1451. [Google Scholar] [CrossRef] [PubMed]
- Tangsuwansri, C.; Saeliw, T.; Thongkorn, S.; Chonchaiya, W.; Suphapeetiporn, K.; Mutirangura, A.; Tencomnao, T.; Hu, V.W.; Sarachana, T. Investigation of epigenetic regulatory networks associated with autism spectrum disorder (ASD) by integrated global LINE-1 methylation and gene expression profiling analyses. PLoS ONE 2018, 13, e0201071. [Google Scholar] [CrossRef] [PubMed]
- Misiak, B.; Szmida, E.; Karpinski, P.; Loska, O.; Sasiadek, M.M.; Frydecka, D. Lower LINE-1 methylation in first-episode schizophrenia patients with the history of childhood trauma. Epigenomics 2015, 7, 1275–1285. [Google Scholar] [CrossRef]
- Bollati, V.; Galimberti, D.; Pergoli, L.; Dalla Valle, E.; Barretta, F.; Cortini, F.; Scarpini, E.; Bertazzi, P.A.; Baccarelli, A. DNA methylation in repetitive elements and Alzheimer disease. Brain Behav. Immun. 2011, 25, 1078–1083. [Google Scholar] [CrossRef]
- Hernandez, H.G.; Mahecha, M.F.; Mejia, A.; Arboleda, H.; Forero, D.A. Global long interspersed nuclear element 1 DNA methylation in a Colombian sample of patients with late-onset Alzheimer’s disease. Am. J. Alzheimer’s Dis. Other Demen. 2014, 29, 50–53. [Google Scholar] [CrossRef]
- Bachiller, S.; Del-Pozo-Martin, Y.; Carrion, A.M. L1 retrotransposition alters the hippocampal genomic landscape enabling memory formation. Brain Behav. Immun. 2017, 64, 65–70. [Google Scholar] [CrossRef]
- Jacob-Hirsch, J.; Eyal, E.; Knisbacher, B.A.; Roth, J.; Cesarkas, K.; Dor, C.; Farage-Barhom, S.; Kunik, V.; Simon, A.J.; Gal, M.; et al. Whole-genome sequencing reveals principles of brain retrotransposition in neurodevelopmental disorders. Cell Res. 2018, 28, 187–203. [Google Scholar] [CrossRef]
- Borges-Monroy, R.; Chu, C.; Dias, C.; Choi, J.; Lee, S.; Gao, Y.; Shin, T.; Park, P.J.; Walsh, C.A.; Lee, E.A. Whole-genome analysis reveals the contribution of non-coding de novo transposon insertions to autism spectrum disorder. Mob. DNA 2021, 12, 28. [Google Scholar] [CrossRef]
- Doyle, G.A.; Crist, R.C.; Karatas, E.T.; Hammond, M.J.; Ewing, A.D.; Ferraro, T.N.; Hahn, C.G.; Berrettini, W.H. Analysis of LINE-1 Elements in DNA from Postmortem Brains of Individuals with Schizophrenia. Neuropsychopharmacology 2017, 42, 2602–2611. [Google Scholar] [CrossRef] [PubMed]
- Niu, Y.; Teng, X.; Shi, Y.; Li, Y.; Tang, Y.; Zhang, P.; Luo, H.; Kang, Q.; Xu, T.; He, S. Genome-wide analysis of mobile element insertions in human genomes. bioRxiv 2021. [CrossRef]
- Zara, F.; Biancheri, R.; Bruno, C.; Bordo, L.; Assereto, S.; Gazzerro, E.; Sotgia, F.; Wang, X.B.; Gianotti, S.; Stringara, S.; et al. Deficiency of hyccin, a newly identified membrane protein, causes hypomyelination and congenital cataract. Nat. Genet. 2006, 38, 1111–1113. [Google Scholar] [CrossRef] [PubMed]
- Bergmann, C.; Zerres, K.; Senderek, J.; Rudnik-Schoneborn, S.; Eggermann, T.; Hausler, M.; Mull, M.; Ramaekers, V.T. Oligophrenin 1 (OPHN1) gene mutation causes syndromic X-linked mental retardation with epilepsy, rostral ventricular enlargement and cerebellar hypoplasia. Brain 2003, 126, 1537–1544. [Google Scholar] [CrossRef] [PubMed]
- Philip, N.; Chabrol, B.; Lossi, A.M.; Cardoso, C.; Guerrini, R.; Dobyns, W.B.; Raybaud, C.; Villard, L. Mutations in the oligophrenin-1 gene (OPHN1) cause X linked congenital cerebellar hypoplasia. J. Med. Genet. 2003, 40, 441–446. [Google Scholar] [CrossRef]
- Piton, A.; Gauthier, J.; Hamdan, F.F.; Lafreniere, R.G.; Yang, Y.; Henrion, E.; Laurent, S.; Noreau, A.; Thibodeau, P.; Karemera, L.; et al. Systematic resequencing of X-chromosome synaptic genes in autism spectrum disorder and schizophrenia. Mol. Psychiatry 2011, 16, 867–880. [Google Scholar] [CrossRef]
- Meisler, M.H.; O’Brien, J.E.; Sharkey, L.M. Sodium channel gene family: Epilepsy mutations, gene interactions and modifier effects. J. Physiol. 2010, 588, 1841–1848. [Google Scholar] [CrossRef]
- Lossin, C.; Rhodes, T.H.; Desai, R.R.; Vanoye, C.G.; Wang, D.; Carniciu, S.; Devinsky, O.; George, A.L., Jr. Epilepsy-associated dysfunction in the voltage-gated neuronal sodium channel SCN1A. J. Neurosci. 2003, 23, 11289–11295. [Google Scholar] [CrossRef]
- Mulley, J.C.; Scheffer, I.E.; Petrou, S.; Dibbens, L.M.; Berkovic, S.F.; Harkin, L.A. SCN1A mutations and epilepsy. Hum. Mutat. 2005, 25, 535–542. [Google Scholar] [CrossRef]
- Kamiya, K.; Kaneda, M.; Sugawara, T.; Mazaki, E.; Okamura, N.; Montal, M.; Makita, N.; Tanaka, M.; Fukushima, K.; Fujiwara, T.; et al. A nonsense mutation of the sodium channel gene SCN2A in a patient with intractable epilepsy and mental decline. J. Neurosci. 2004, 24, 2690–2698. [Google Scholar] [CrossRef]
- Reynolds, C.; King, M.D.; Gorman, K.M. The phenotypic spectrum of SCN2A-related epilepsy. Eur. J. Paediatr. Neurol. 2020, 24, 117–122. [Google Scholar] [CrossRef] [PubMed]
- Weiss, L.A.; Escayg, A.; Kearney, J.A.; Trudeau, M.; MacDonald, B.T.; Mori, M.; Reichert, J.; Buxbaum, J.D.; Meisler, M.H. Sodium channels SCN1A, SCN2A and SCN3A in familial autism. Mol. Psychiatry 2003, 8, 186–194. [Google Scholar] [CrossRef] [PubMed]
- Meyer, G.; De Rouvroit, C.L.; Goffinet, A.M.; Wahle, P. Disabled-1 mRNA and protein expression in developing human cortex. Eur. J. Neurosci. 2003, 17, 517–525. [Google Scholar] [CrossRef]
- Hashimoto-Torii, K.; Torii, M.; Sarkisian, M.R.; Bartley, C.M.; Shen, J.; Radtke, F.; Gridley, T.; Sestan, N.; Rakic, P. Interaction between Reelin and Notch signaling regulates neuronal migration in the cerebral cortex. Neuron 2008, 60, 273–284. [Google Scholar] [CrossRef] [PubMed]
- Ishii, K.; Kubo, K.I.; Nakajima, K. Reelin and Neuropsychiatric Disorders. Front. Cell Neurosci. 2016, 10, 229. [Google Scholar] [CrossRef]
- Kristiansen, L.V.; Beneyto, M.; Haroutunian, V.; Meador-Woodruff, J.H. Changes in NMDA receptor subunits and interacting PSD proteins in dorsolateral prefrontal and anterior cingulate cortex indicate abnormal regional expression in schizophrenia. Mol. Psychiatry 2006, 11, 737–747, 705. [Google Scholar] [CrossRef]
- Irie, M.; Hata, Y.; Takeuchi, M.; Ichtchenko, K.; Toyoda, A.; Hirao, K.; Takai, Y.; Rosahl, T.W.; Sudhof, T.C. Binding of neuroligins to PSD-95. Science 1997, 277, 1511–1515. [Google Scholar] [CrossRef]
- Petrini, E.M.; Ravasenga, T.; Hausrat, T.J.; Iurilli, G.; Olcese, U.; Racine, V.; Sibarita, J.B.; Jacob, T.C.; Moss, S.J.; Benfenati, F.; et al. Synaptic recruitment of gephyrin regulates surface GABAA receptor dynamics for the expression of inhibitory LTP. Nat. Commun. 2014, 5, 3921. [Google Scholar] [CrossRef]
- Dos Reis, R.; Kornobis, E.; Pereira, A.; Tores, F.; Carrasco, J.; Gautier, C.; Jahannault-Talignani, C.; Nitschke, P.; Muchardt, C.; Schlosser, A.; et al. Complex regulation of Gephyrin splicing is a determinant of inhibitory postsynaptic diversity. Nat. Commun. 2022, 13, 3507. [Google Scholar] [CrossRef]
- Muller, T.; Braud, S.; Juttner, R.; Voigt, B.C.; Paulick, K.; Sheean, M.E.; Klisch, C.; Gueneykaya, D.; Rathjen, F.G.; Geiger, J.R.; et al. Neuregulin 3 promotes excitatory synapse formation on hippocampal interneurons. EMBO J. 2018, 37, e98858. [Google Scholar] [CrossRef]
- Yang, Z.H.; Shi, M.M.; Liu, Y.T.; Wang, Y.L.; Luo, H.Y.; Wang, Z.L.; Shi, C.H.; Xu, Y.M. TGM6 gene mutations in undiagnosed cerebellar ataxia patients. Park. Relat. Disord. 2018, 46, 84–86. [Google Scholar] [CrossRef] [PubMed]
- Wang, J.L.; Yang, X.; Xia, K.; Hu, Z.M.; Weng, L.; Jin, X.; Jiang, H.; Zhang, P.; Shen, L.; Guo, J.F.; et al. TGM6 identified as a novel causative gene of spinocerebellar ataxias using exome sequencing. Brain 2010, 133, 3510–3518. [Google Scholar] [CrossRef] [PubMed]
- Fung, J.L.F.; Tsang, M.H.Y.; Leung, G.K.C.; Yeung, K.S.; Mak, C.C.Y.; Fung, C.W.; Chan, S.H.S.; Yu, M.H.C.; Chung, B.H.Y. A significant inflation in TGM6 genetic risk casts doubt in its causation in spinocerebellar ataxia type 35. Park. Relat. Disord. 2019, 63, 42–45. [Google Scholar] [CrossRef] [PubMed]
- Koh, K.; Shimazaki, H.; Ogawa, M.; Takiyama, Y. A heterozygous GRID2 mutation in autosomal dominant cerebellar ataxia. Hum. Genome Var. 2022, 9, 27. [Google Scholar] [CrossRef]
- Utine, G.E.; Haliloglu, G.; Salanci, B.; Cetinkaya, A.; Kiper, P.O.; Alanay, Y.; Aktas, D.; Boduroglu, K.; Alikasifoglu, M. A homozygous deletion in GRID2 causes a human phenotype with cerebellar ataxia and atrophy. J. Child Neurol. 2013, 28, 926–932. [Google Scholar] [CrossRef]
- Veerapandiyan, A.; Enner, S.; Thulasi, V.; Ming, X. A Rare Syndrome of GRID2 Deletion in 2 Siblings. Child Neurol. Open 2017, 4, 2329048X17726168. [Google Scholar] [CrossRef]
- Baker, K.D.; Edwards, T.M.; Rickard, N.S. The role of intracellular calcium stores in synaptic plasticity and memory consolidation. Neurosci. Biobehav. Rev. 2013, 37, 1211–1239. [Google Scholar] [CrossRef]
- Abu-Omar, N.; Das, J.; Szeto, V.; Feng, Z.P. Neuronal Ryanodine Receptors in Development and Aging. Mol. Neurobiol. 2018, 55, 1183–1192. [Google Scholar] [CrossRef]
- Iwamoto, K.; Bundo, M.; Kato, T. Serotonin receptor 2C and mental disorders: Genetic, expression and RNA editing studies. RNA Biol. 2009, 6, 248–253. [Google Scholar] [CrossRef] [Green Version]


| Estimated Somatic L1 Insertion Rate in the Human Brain | Brain Regions | Information of Subjects (Age/Sex) | Selection (Neuron) | L1 Analysis Method | DNA Amplification Method | Reference |
|---|---|---|---|---|---|---|
| 80 | Hippocampus, Cerebellum | Fetal/unknown | No | L1 qPCR | None | [44] |
| 0.04 | Hippocampus, Caudate nucleus | 91/M, 87/M, 97/F | No | RC-seq | None | [46] |
| 0.04 | Cortex, Caudate nucleus | * 17/M, 15/F, 42/F, 21 weeks Fetus/M | Yes | L1-IP | MDA | [47] |
| 0.32 | Cortex | * 17/M | Yes | WGS | MDA | [48] |
| 13.7 | Hippocampus, Cortex | 18/F, 29/M, 45/M, 76/M, # 18/F-AGS | Yes | RC-seq | MALBAC | [49] |
| 0.58–1 | Hippocampus, Cortex | 17/M, 15/F, 42/F, 21 weeks Fetus/M | Yes | SLAV-seq | MDA | [45] |
| 0.63–1.66 | Prefrontal cortex | 16/F, 18/F, 19/F, 20/F, 25/F | Yes | HAT-seq | PCR | [50] |
| ≤1 | Superior temporal gyrus, Fetal cortex | 80/M, 47/M, 55/M, 18 weeks Fetus/Unkown | Yes | WGS | None | [51] |
| Related Brain Disorder | Gene | Insertion Region | SFARI Gene Score | Sample Origin | Seq Method | Ref |
|---|---|---|---|---|---|---|
| ASD | DAB1 | Intronic | N | Blood (From SSC data set) | WGS | [70] |
| SCN1A | Intronic | 1 | Postmortem brain | WGS | [69] | |
| SCN2A | Intronic | 1 | Postmortem brain | WGS | ||
| CTNNA3 | Intronic | 2 | Postmortem brain | WGS | ||
| CNTNAP2 | Intronic | 2S | Postmortem brain | WGS | ||
| AT | DLG2 | Intronic | 2 | Postmortem brain | WGS | |
| SCN1A | Intronic | 1 | Postmortem brain | WGS | ||
| RELN | Intronic | 1 | Postmortem brain | WGS | ||
| FAM126A | Exonic | N | Postmortem brain | WGS | ||
| OPHN1 | Exonic | 2 | Postmortem brain | WGS | ||
| TSC | GPHN | Intronic | 2 | Postmortem brain | WGS | |
| RTT | CTNNA3 | Intronic | 2 | Postmortem brain | WGS | |
| TGM6 | Intronic | N | Postmortem brain | HAT-seq | [50] | |
| SZ | ERI3 | Intragenic | N | Postmortem brain | L1-seq | [71] |
| GRID2 | Intragenic | 2 | Postmortem brain | L1-seq | ||
| KHDRBS2 | Intragenic | 2 | Postmortem brain | L1-seq | ||
| NRG3 | Intragenic | N | Postmortem brain | L1-seq | ||
| HTR2C | Intragenic | N | Postmortem brain | L1-seq | ||
| RYR2 | Intragenic | N | Postmortem brain | L1-seq | ||
| SYNE1 | Intragenic | 2S | Postmortem brain | L1-seq | ||
| SYN3 | Intragenic | N | Postmortem brain | L1-seq | ||
| ABCF1 | Intragenic | N | Postmortem brain | L1-seq |
Publisher’s Note: MDPI stays neutral with regard to jurisdictional claims in published maps and institutional affiliations. |
© 2022 by the authors. Licensee MDPI, Basel, Switzerland. This article is an open access article distributed under the terms and conditions of the Creative Commons Attribution (CC BY) license (https://creativecommons.org/licenses/by/4.0/).
Share and Cite
Son, J.-H.; Do, H.; Han, J. Intragenic L1 Insertion: One Possibility of Brain Disorder. Life 2022, 12, 1425. https://doi.org/10.3390/life12091425
Son J-H, Do H, Han J. Intragenic L1 Insertion: One Possibility of Brain Disorder. Life. 2022; 12(9):1425. https://doi.org/10.3390/life12091425
Chicago/Turabian StyleSon, Ji-Hoon, Hyunsu Do, and Jinju Han. 2022. "Intragenic L1 Insertion: One Possibility of Brain Disorder" Life 12, no. 9: 1425. https://doi.org/10.3390/life12091425