
Temperature Increase and Damage Extent at Retinal Pigment Epithelium Compared between Continuous Wave and Micropulse Laser Application
 , , ,
, , , 
Abstract
:1. Introduction
2. Methods
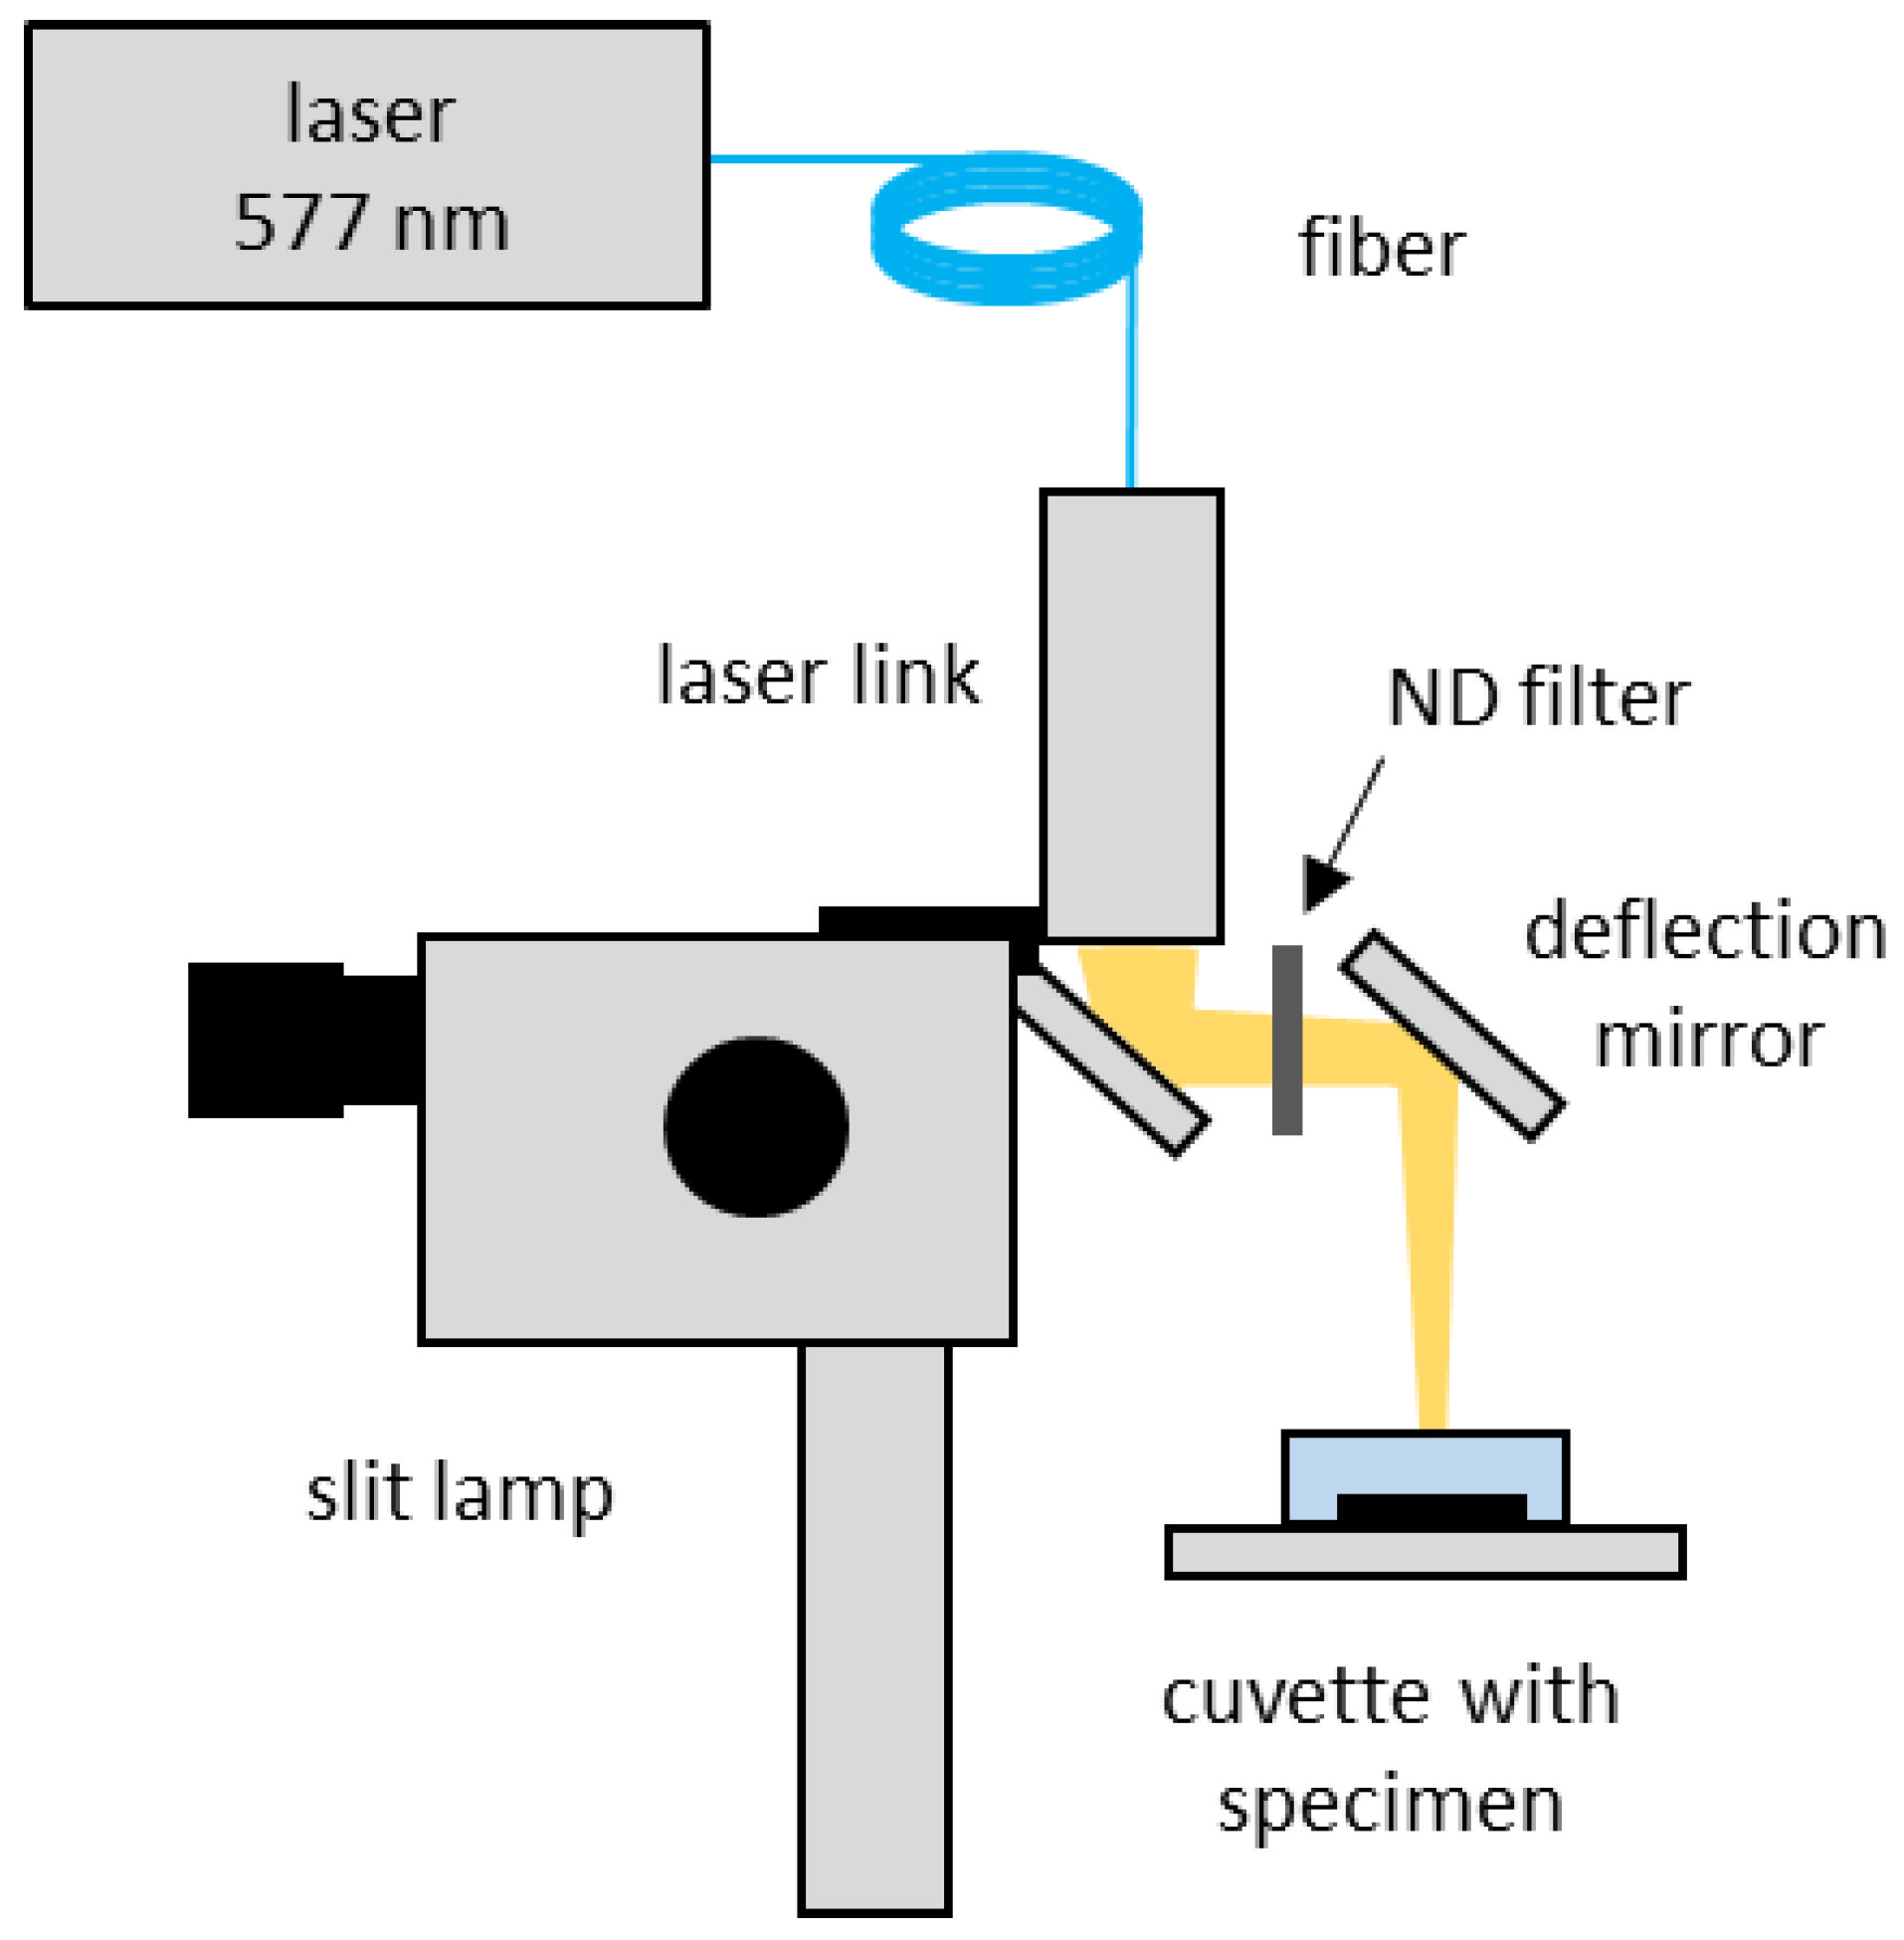
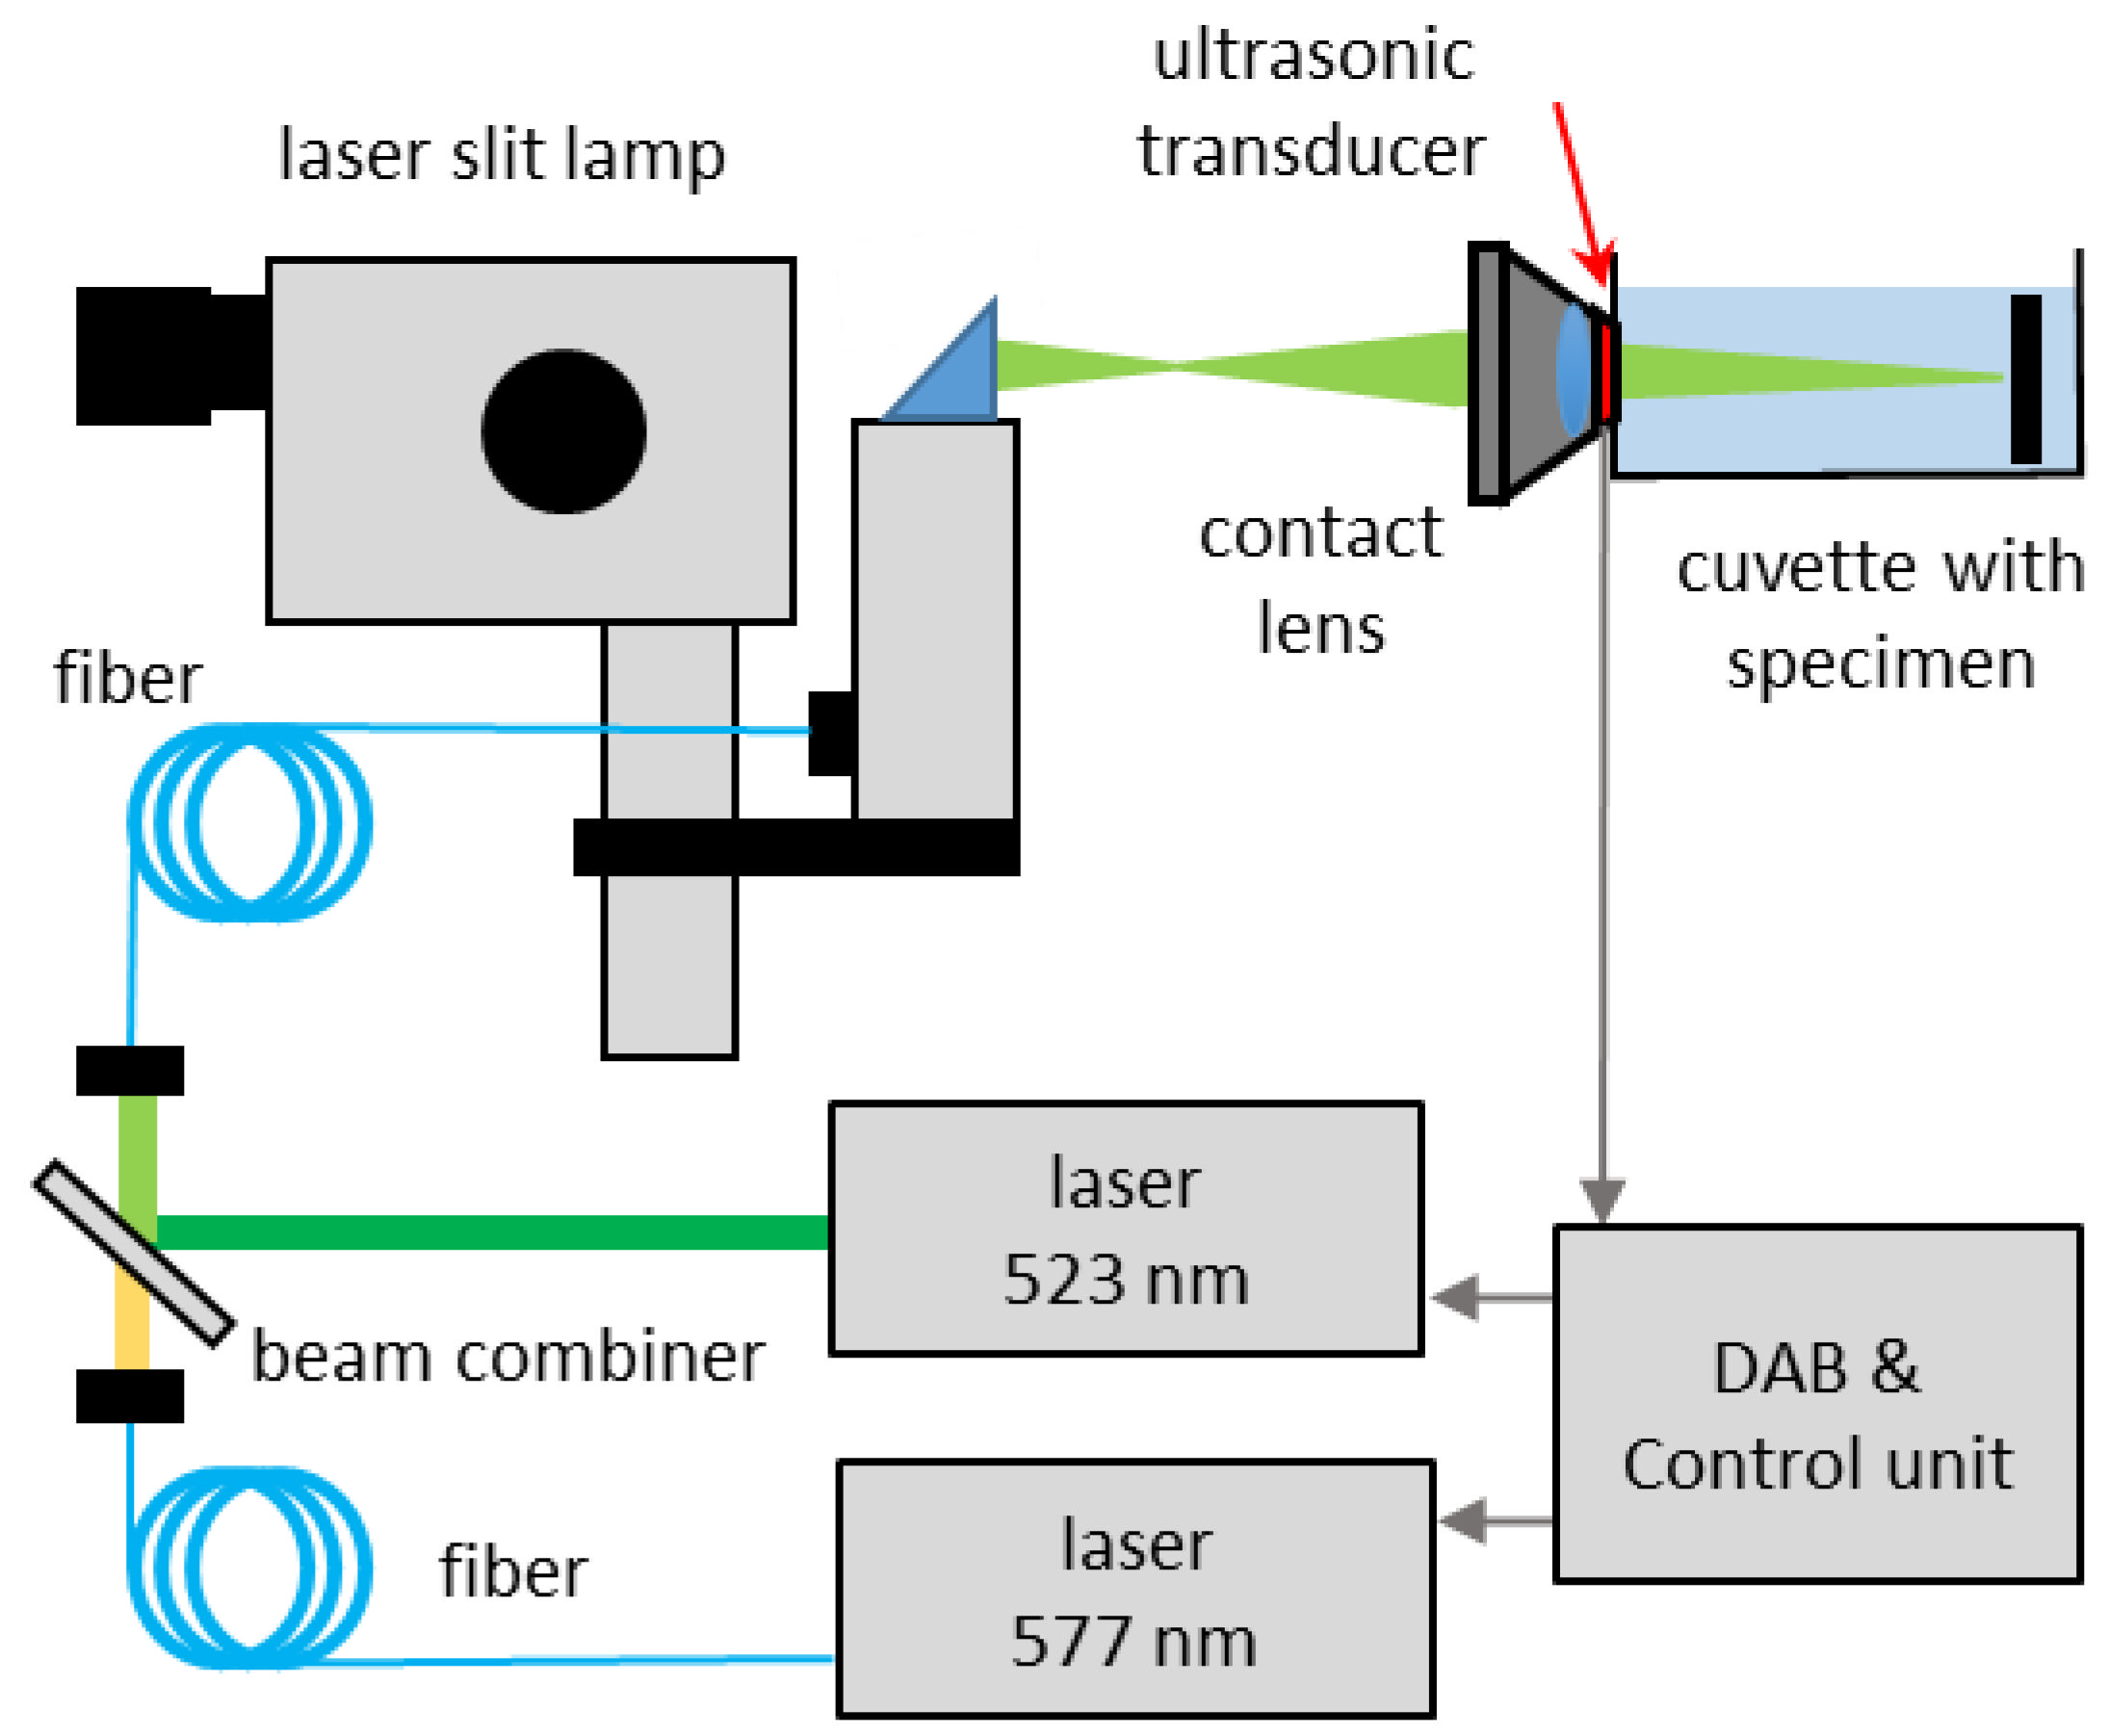
2.1. Laser System and Power Measurement
2.2. RPE Organ Culture
2.3. RPE Cell Viability Test
2.4. Laser Irradiation
2.4.1. Part I: Setup for Determination of Damage Areas and Thresholds
2.4.2. Part II: Temperature Determination during Irradiation
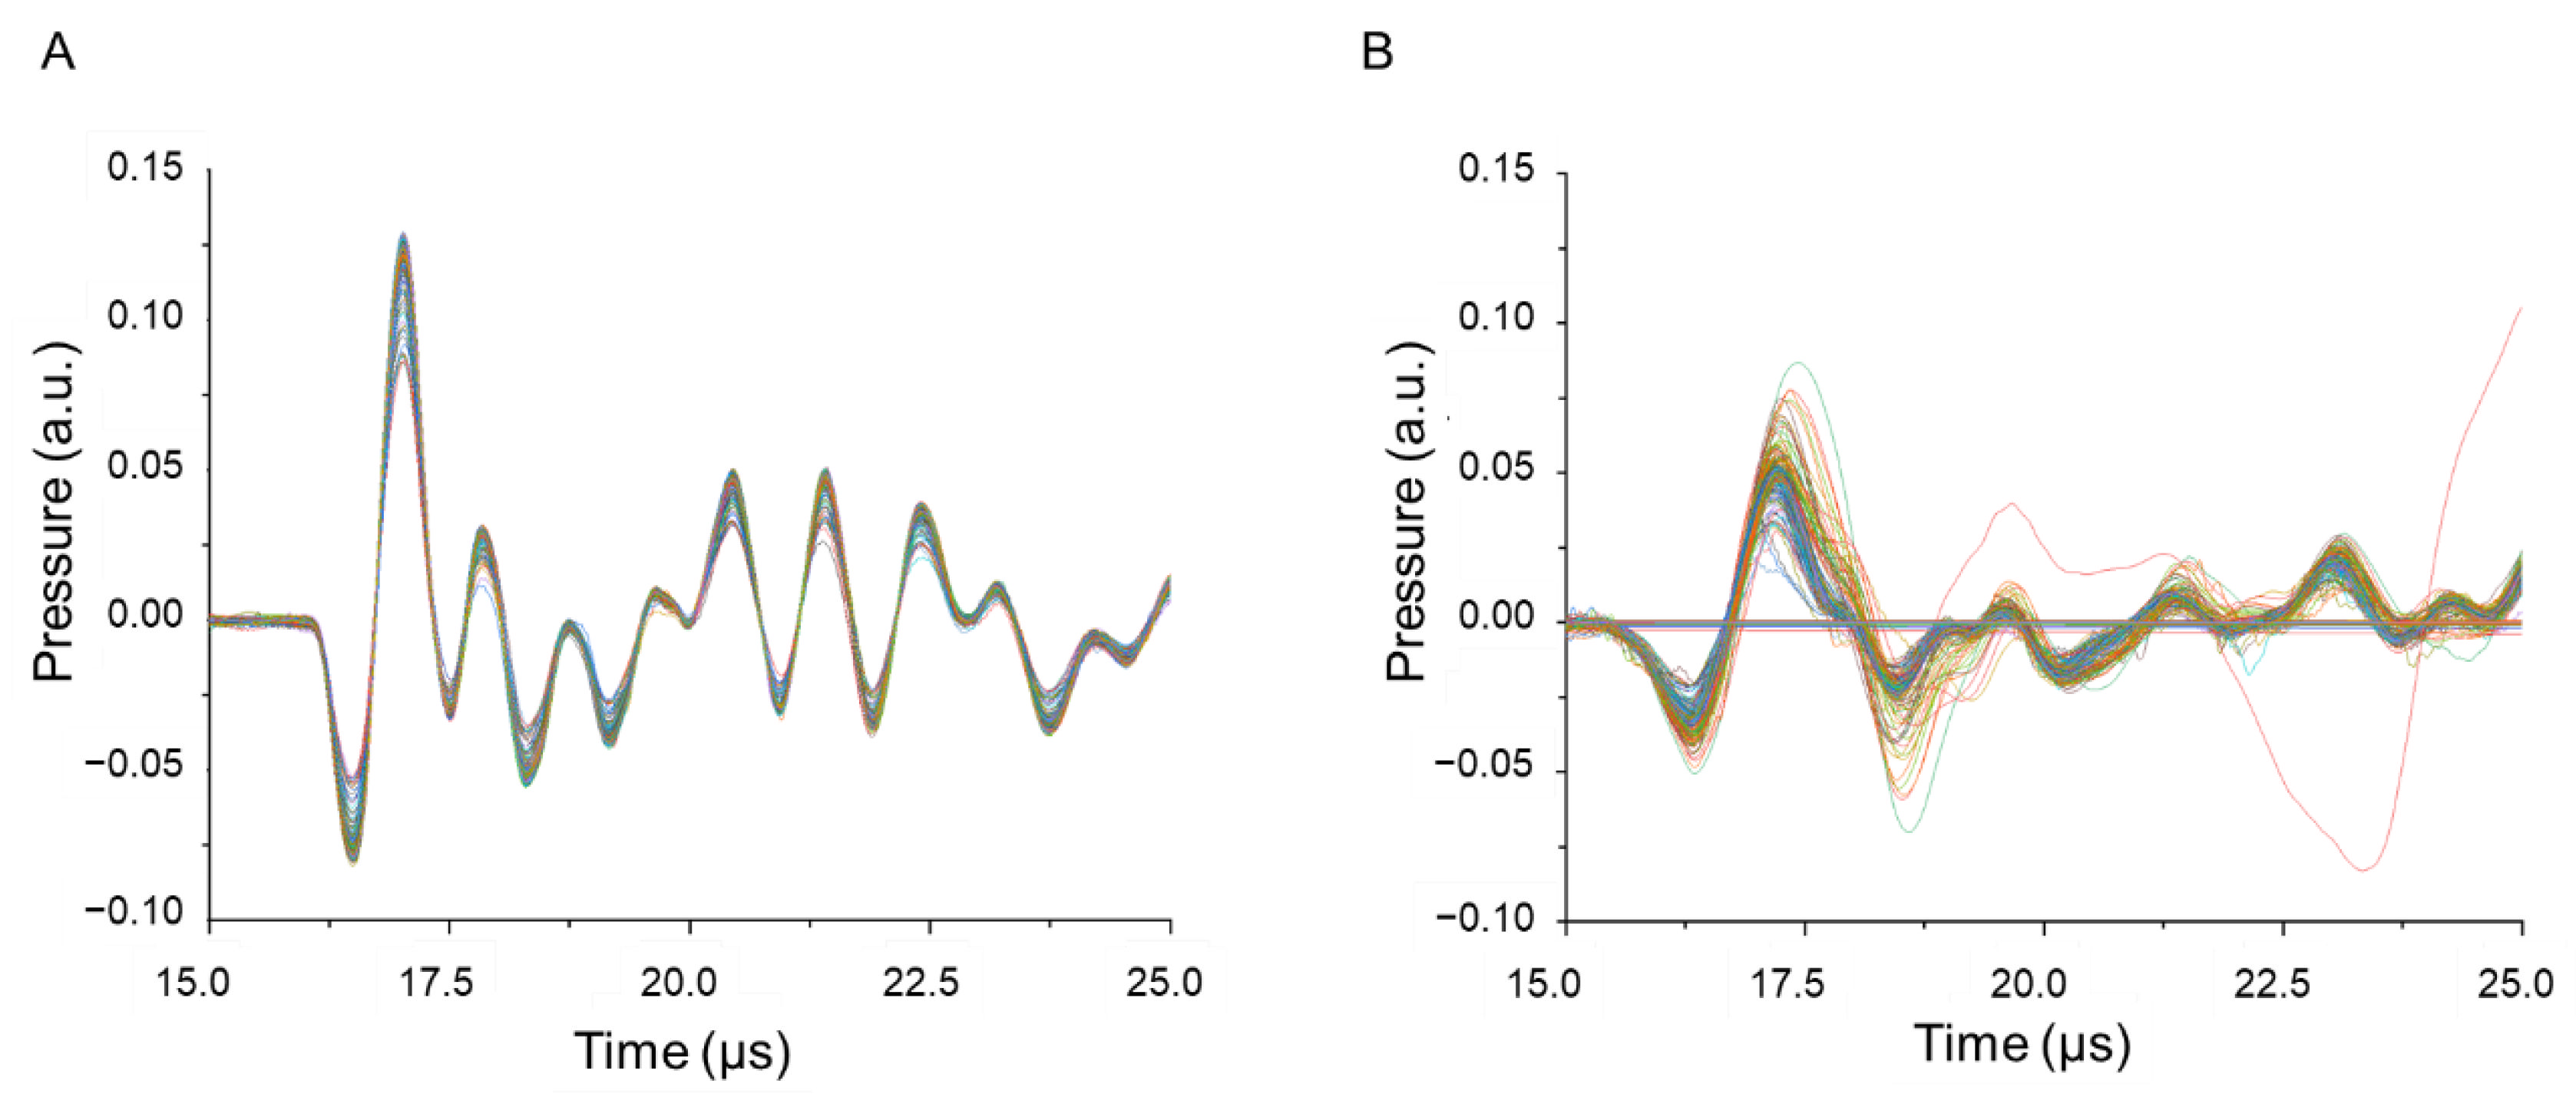
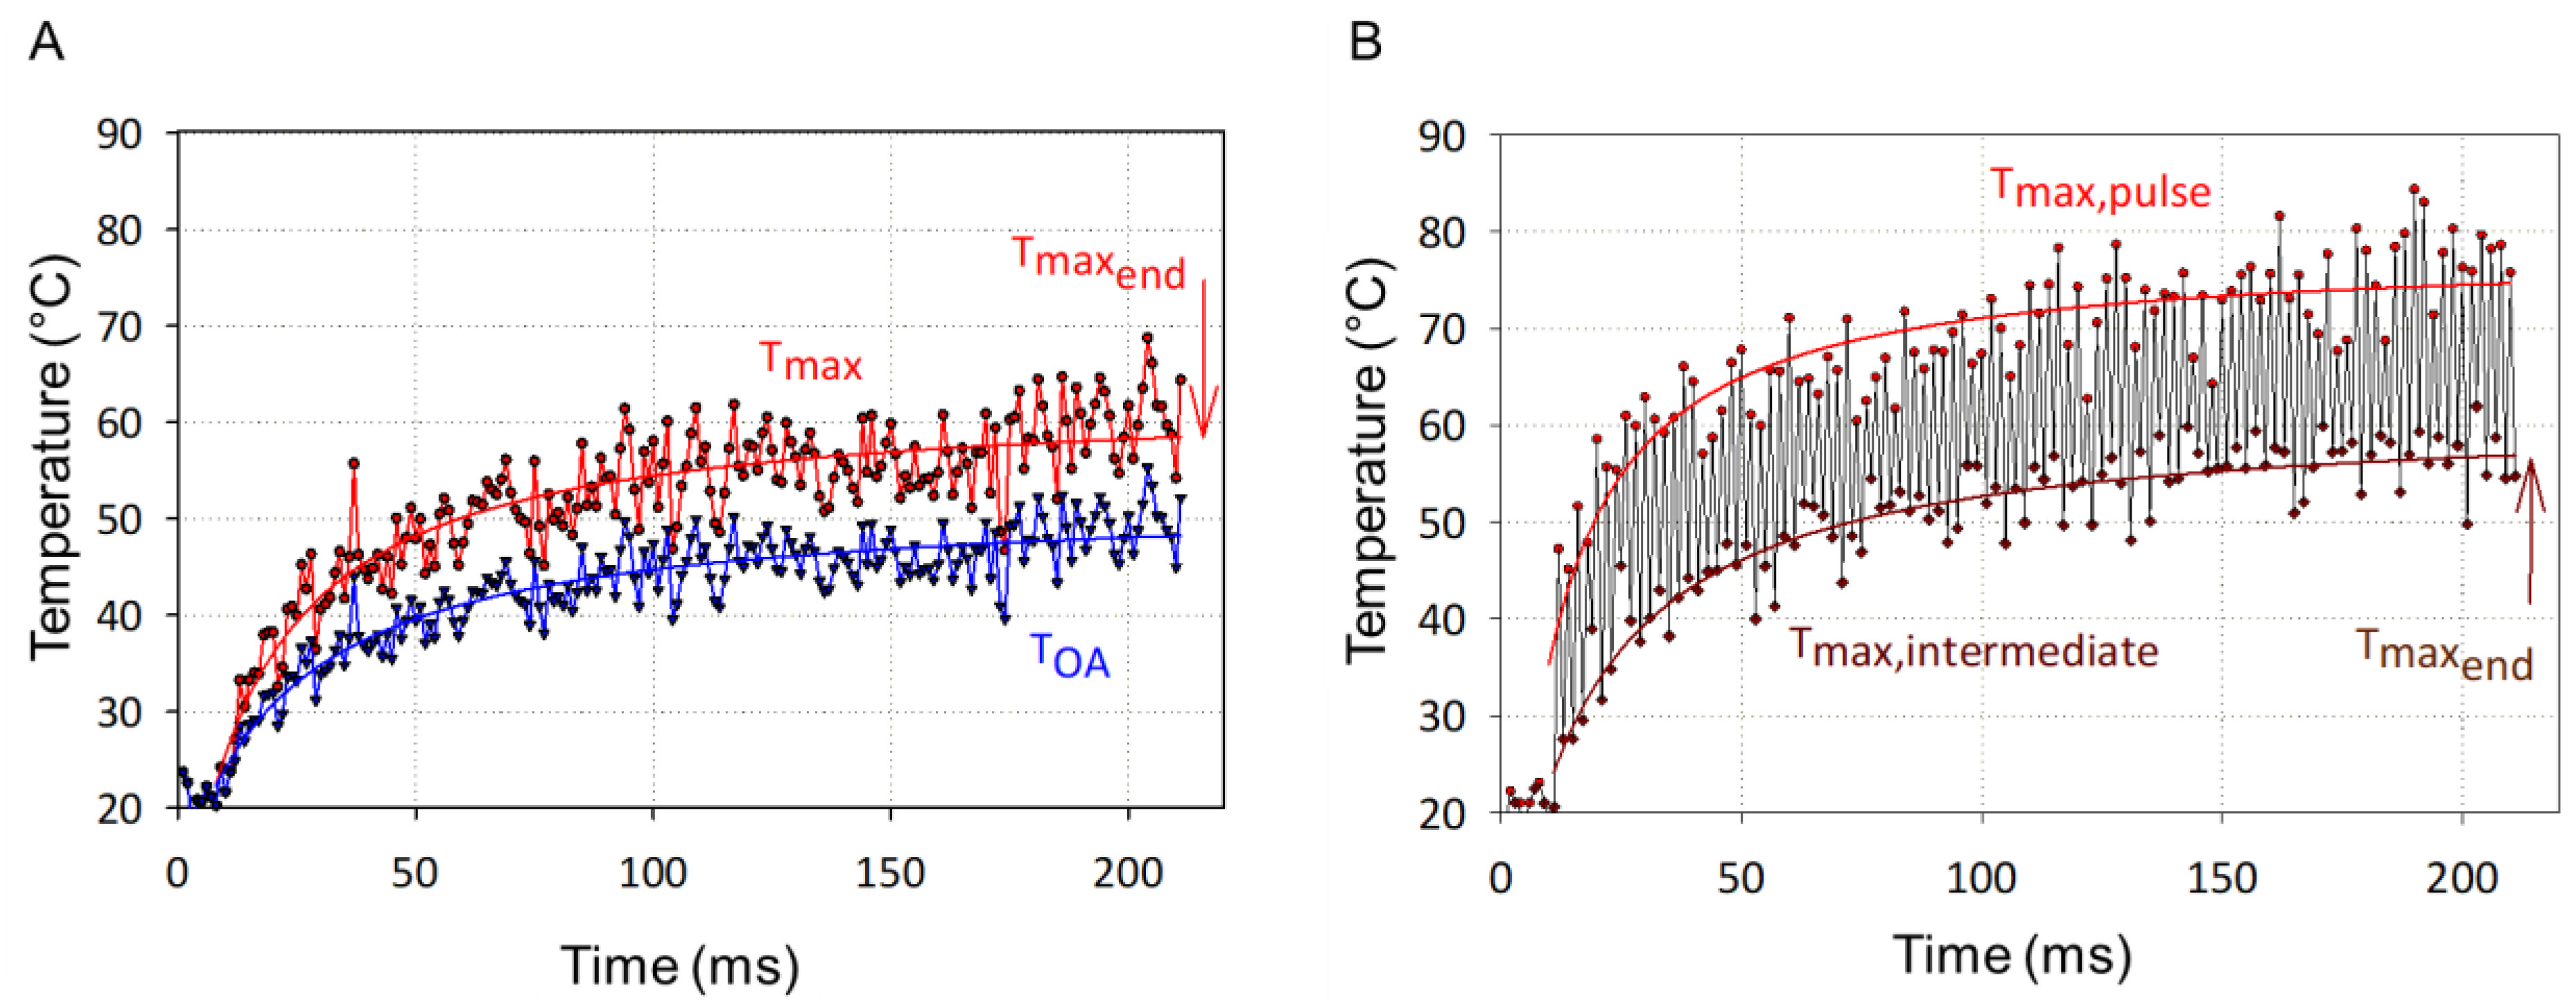
Optoacoustic Temperature Measurement
- -
- Spot diameter with top hat radiant exposure: 200 µm
- -
- RPE’s absorption coefficient and thickness: µa = 575 cm−1, d = 6 µm
- -
- Unpigmented layer: µa = 0, d = 4 µm
- -
- Choroid’s absorption coefficient and thickness: µa = 4.2 cm−1, d = 400 µm
3. Results
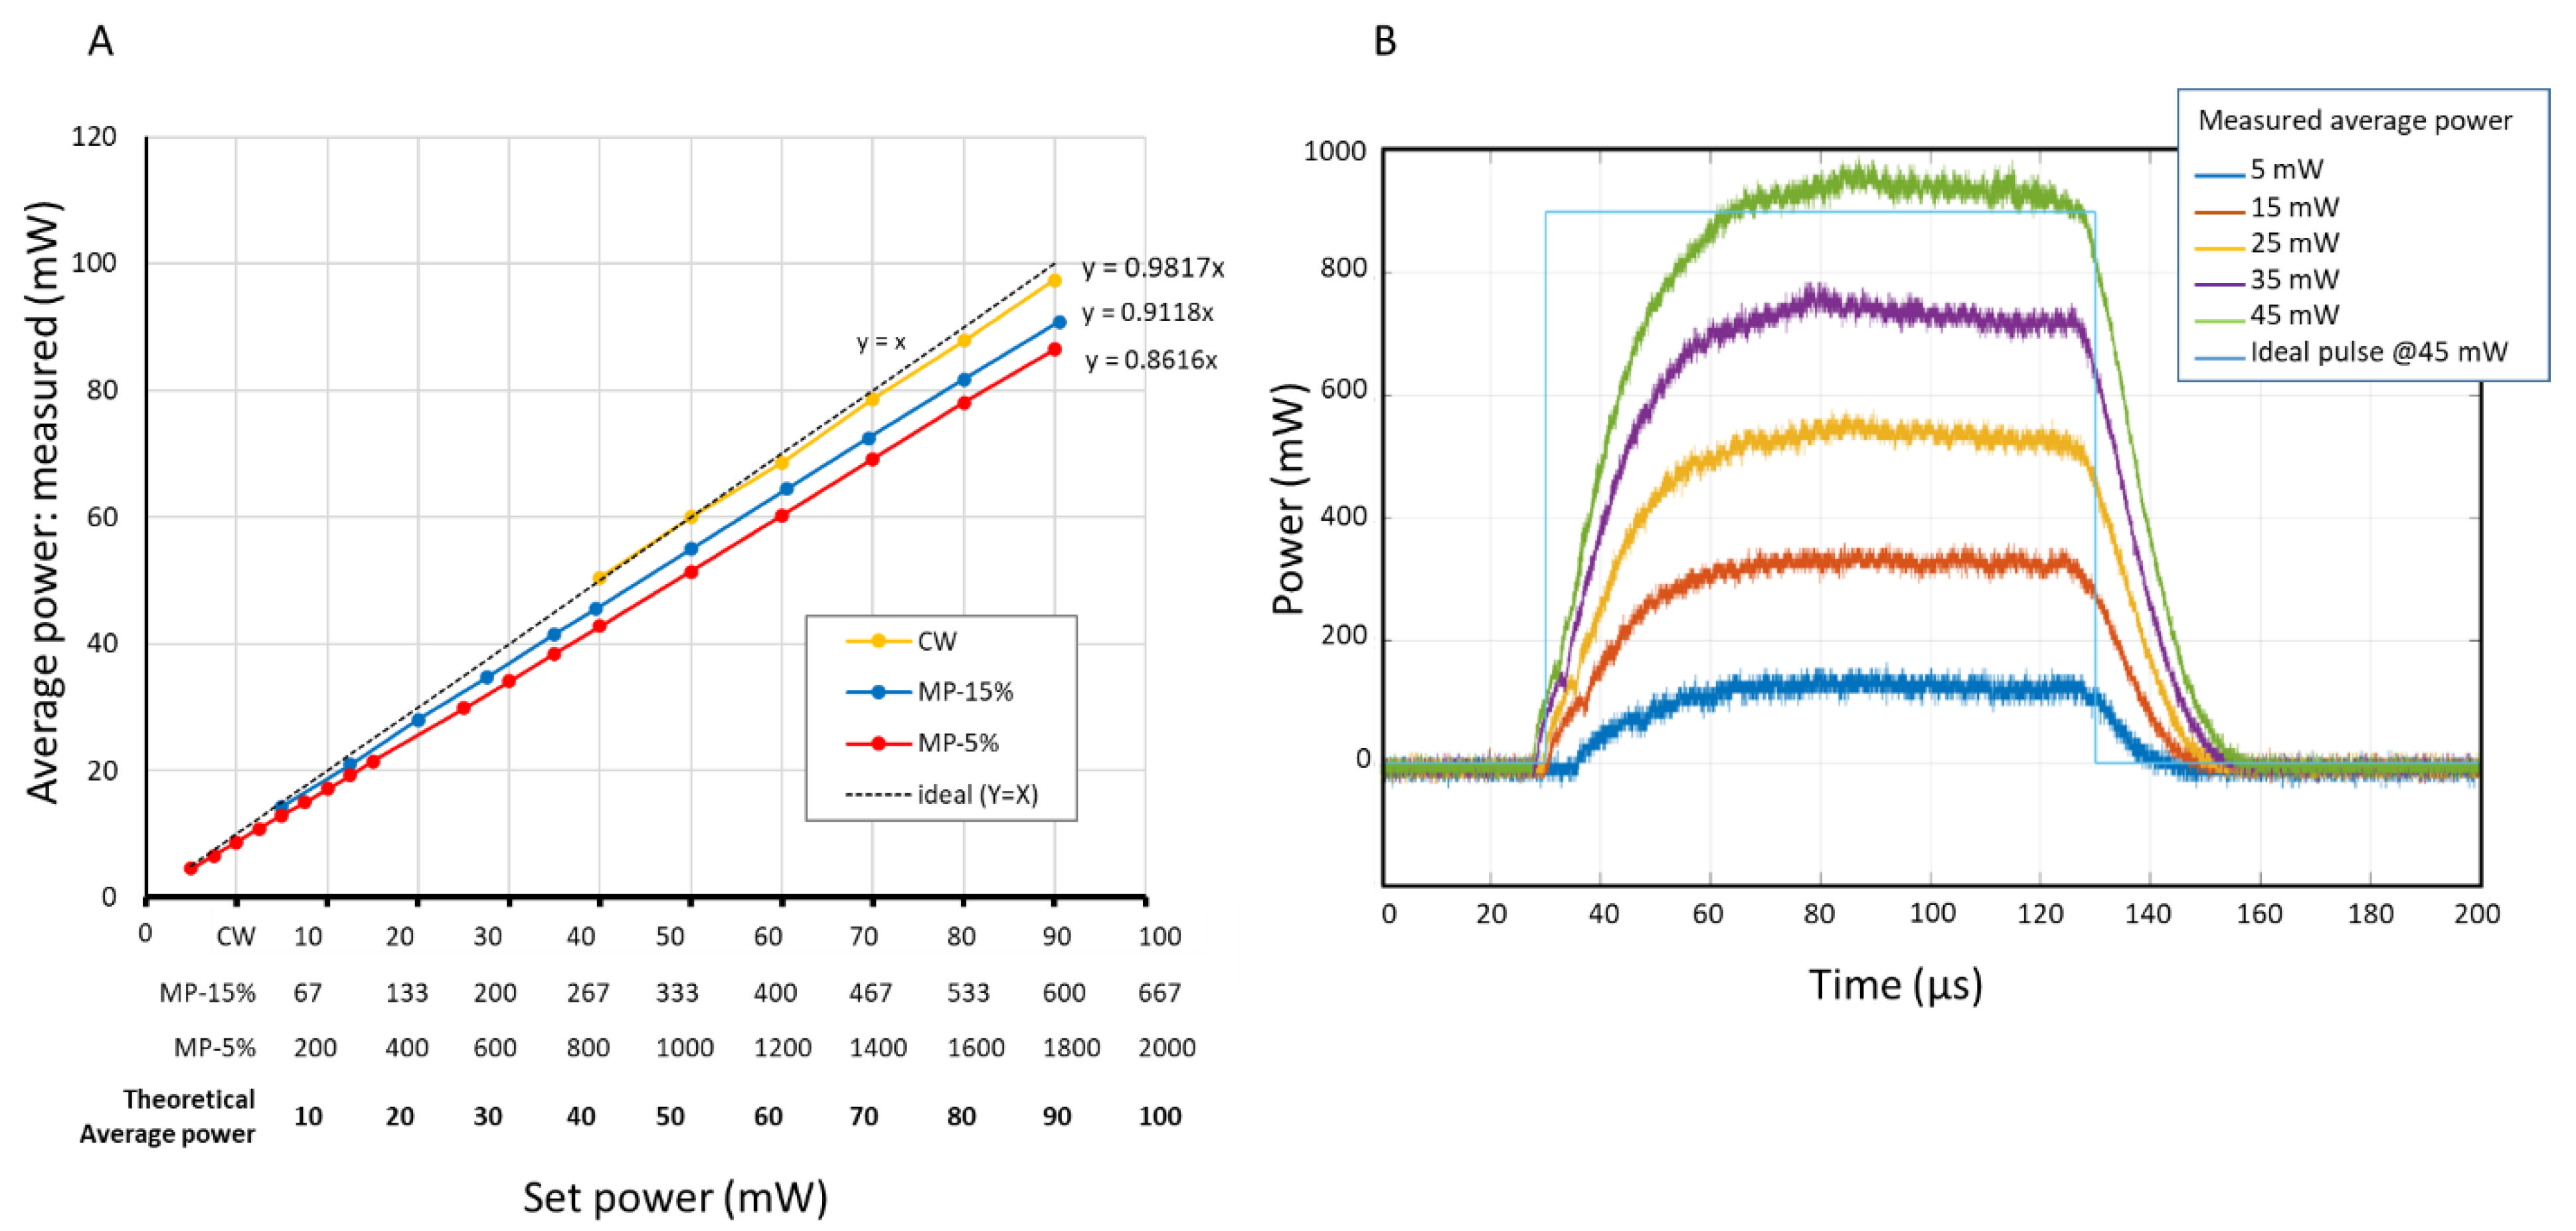
3.1. Laser Characteristics
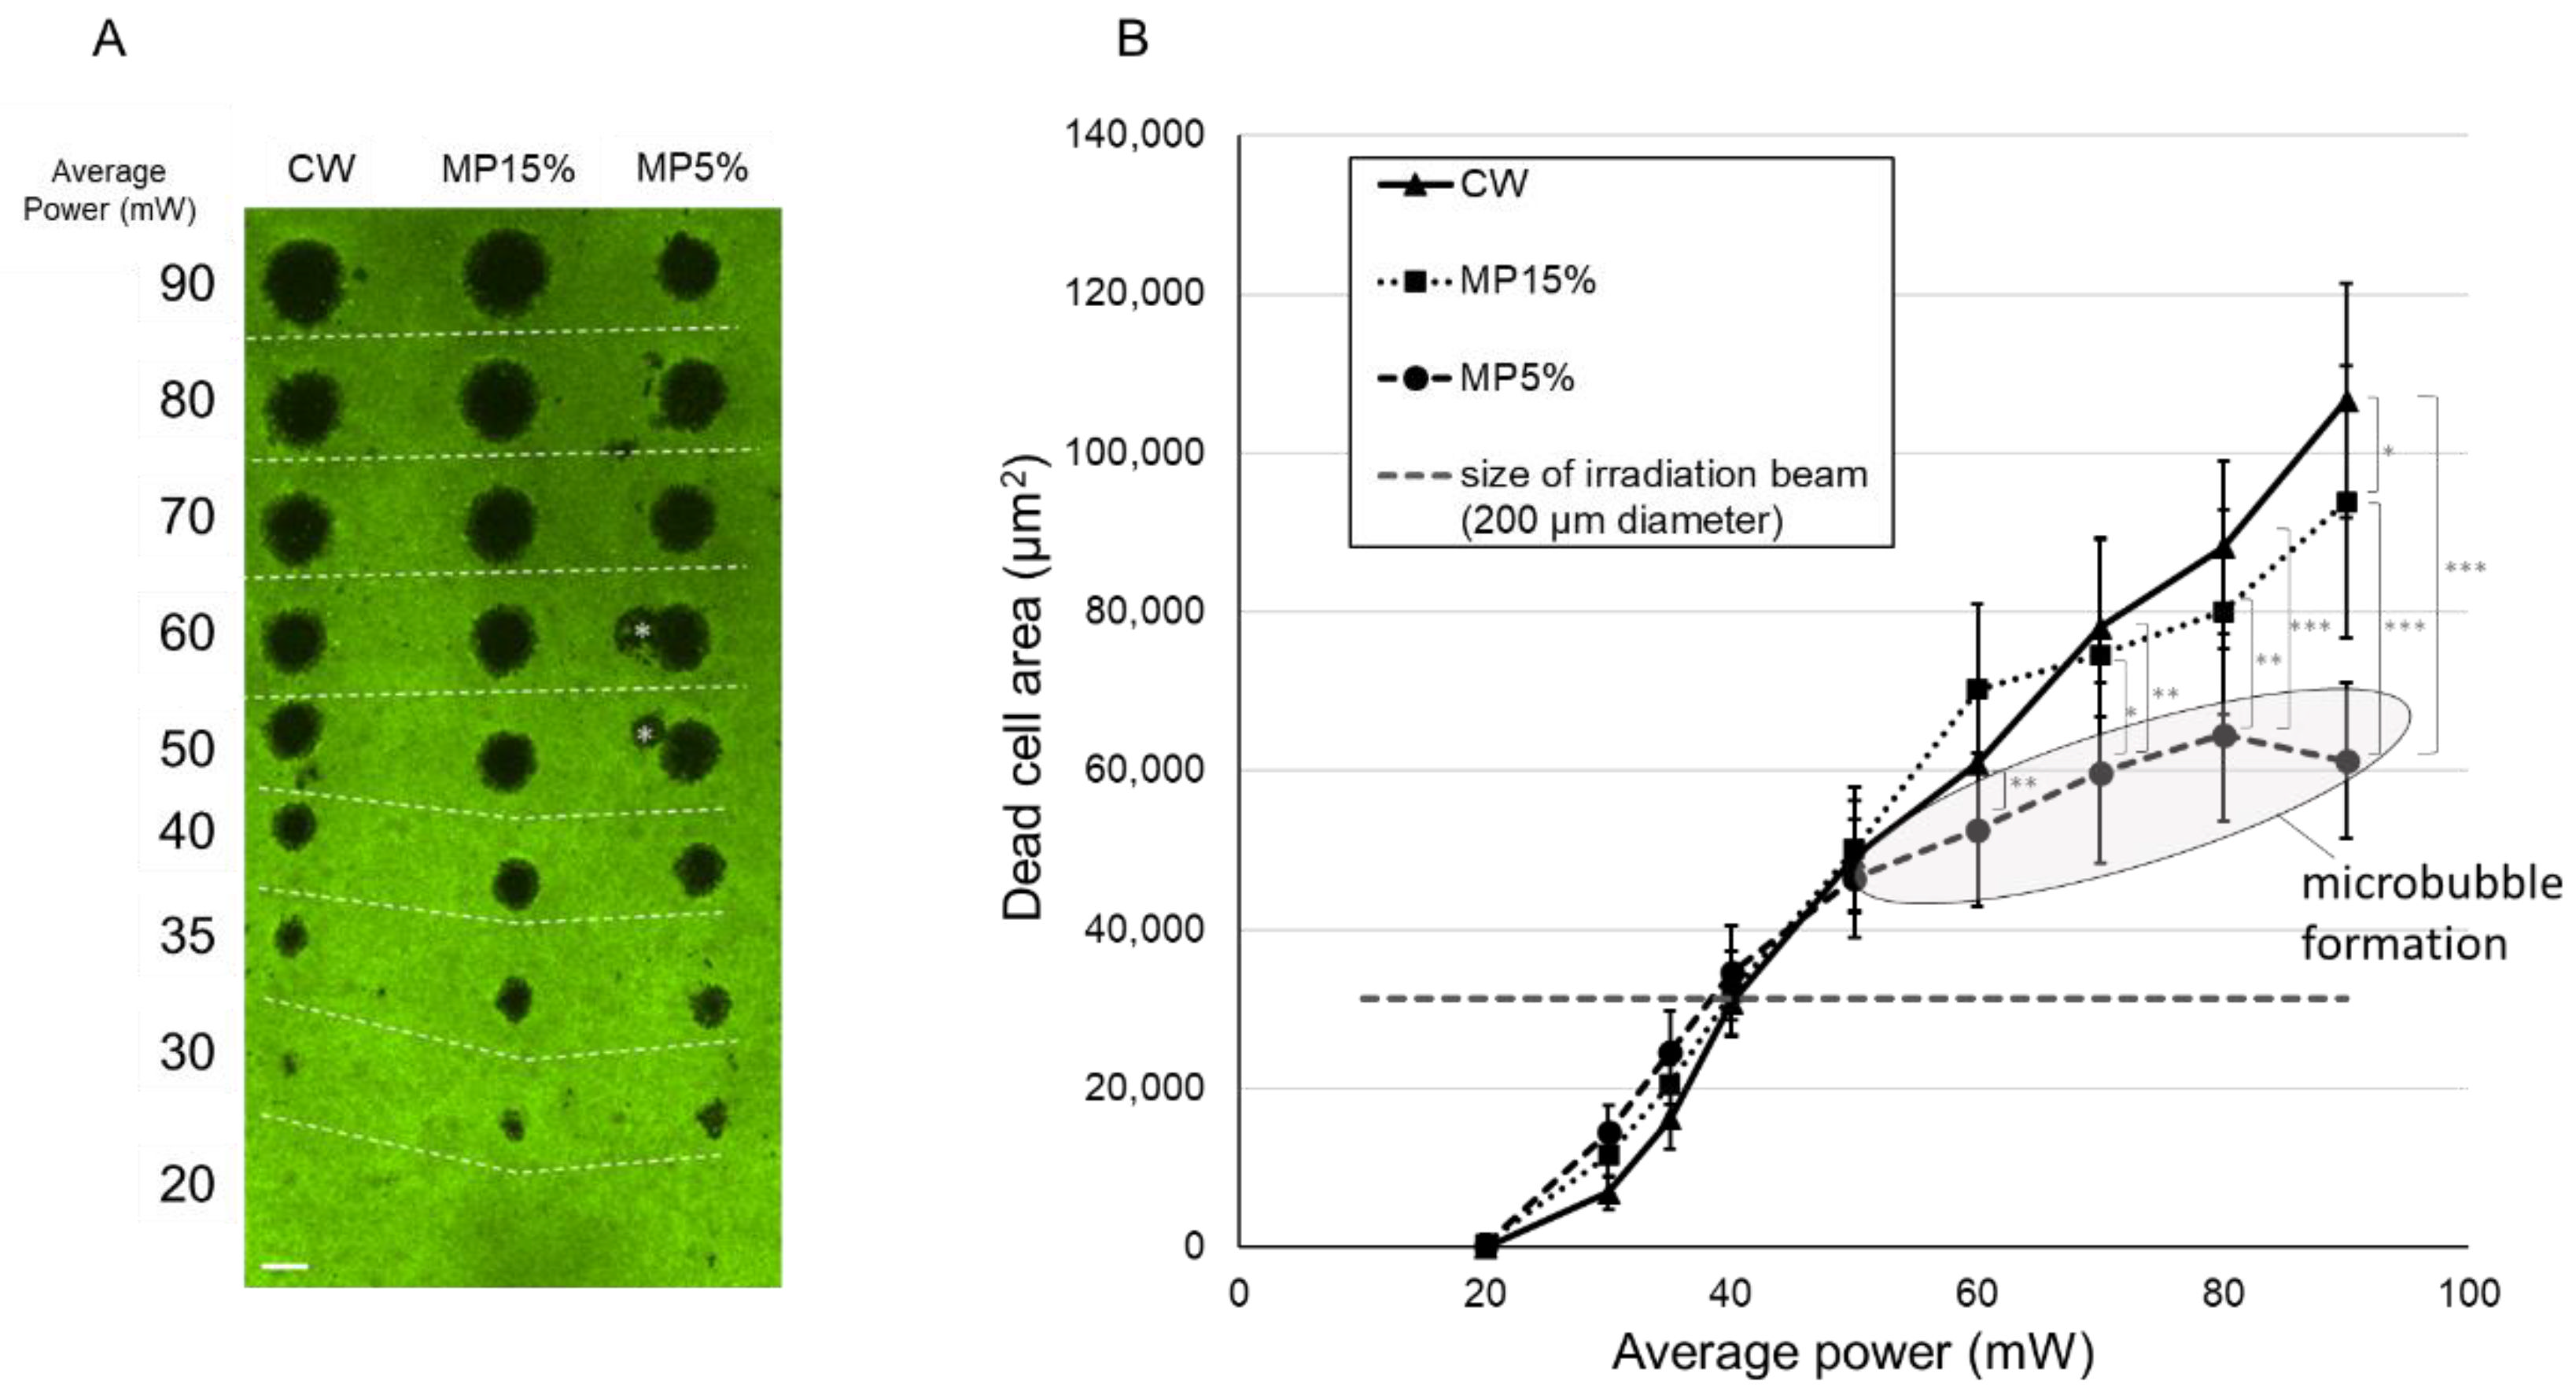
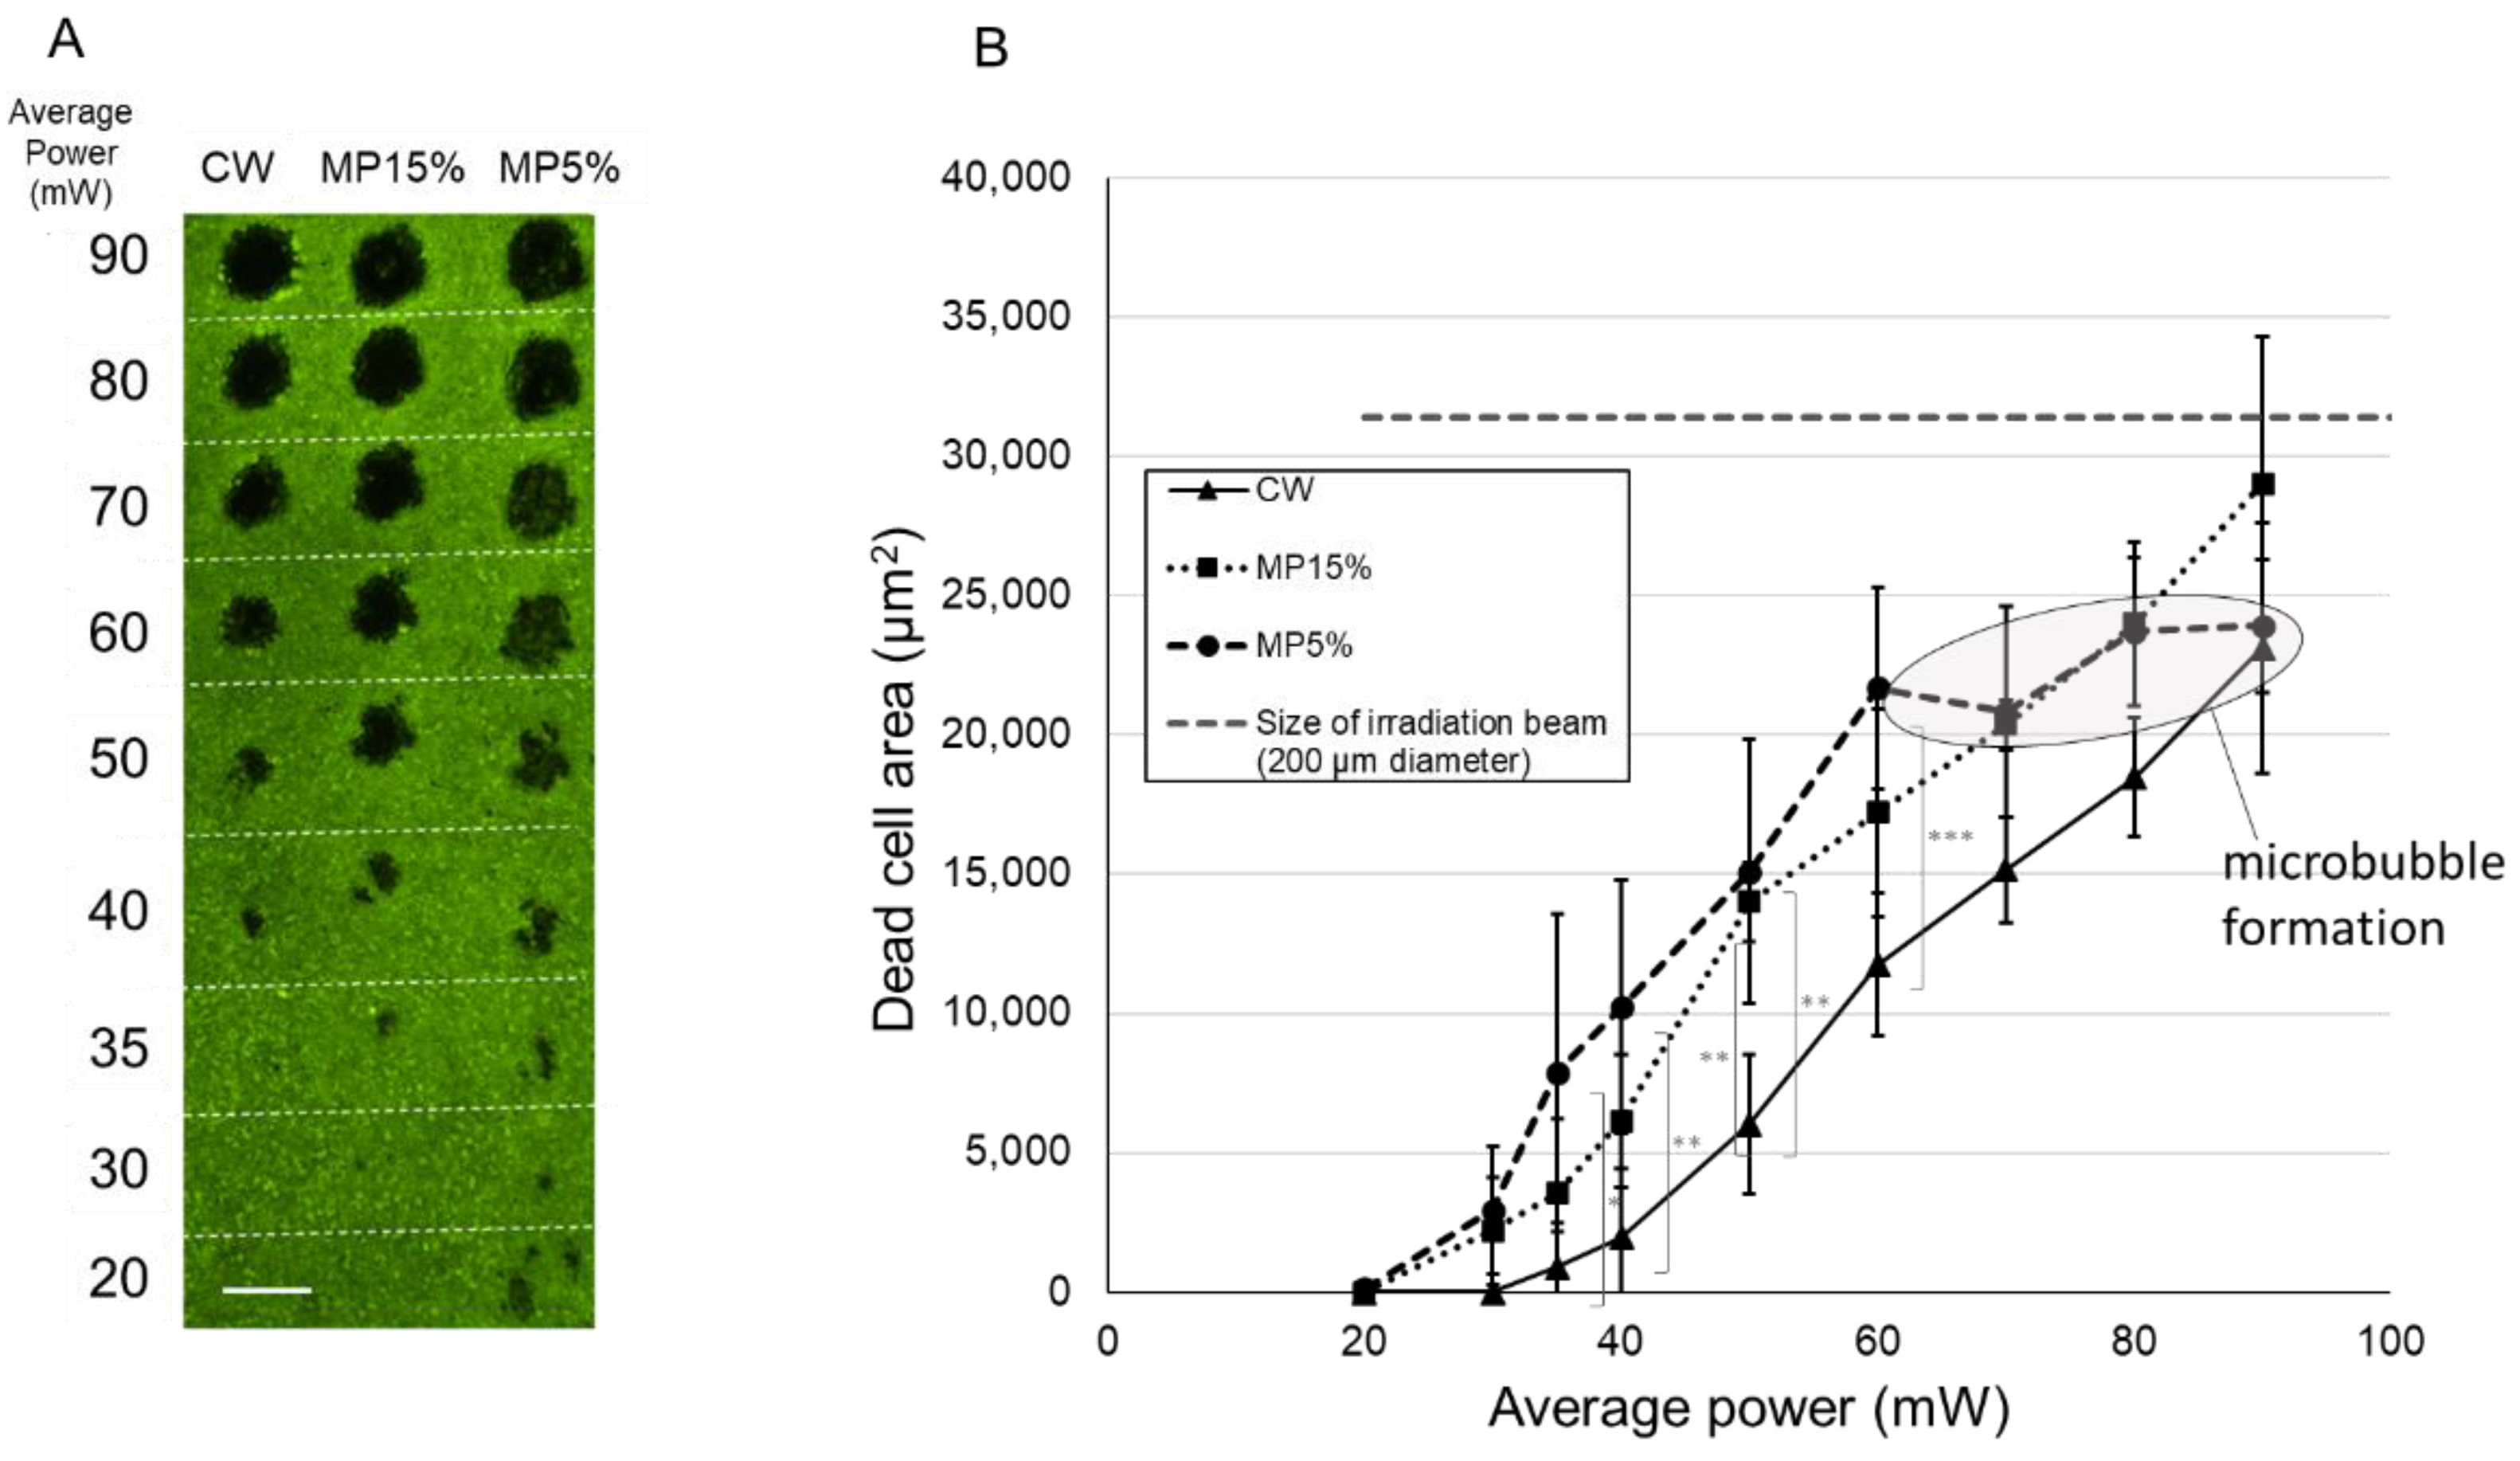
3.2. Comparison of RPE Dead Cell Area (DCA)
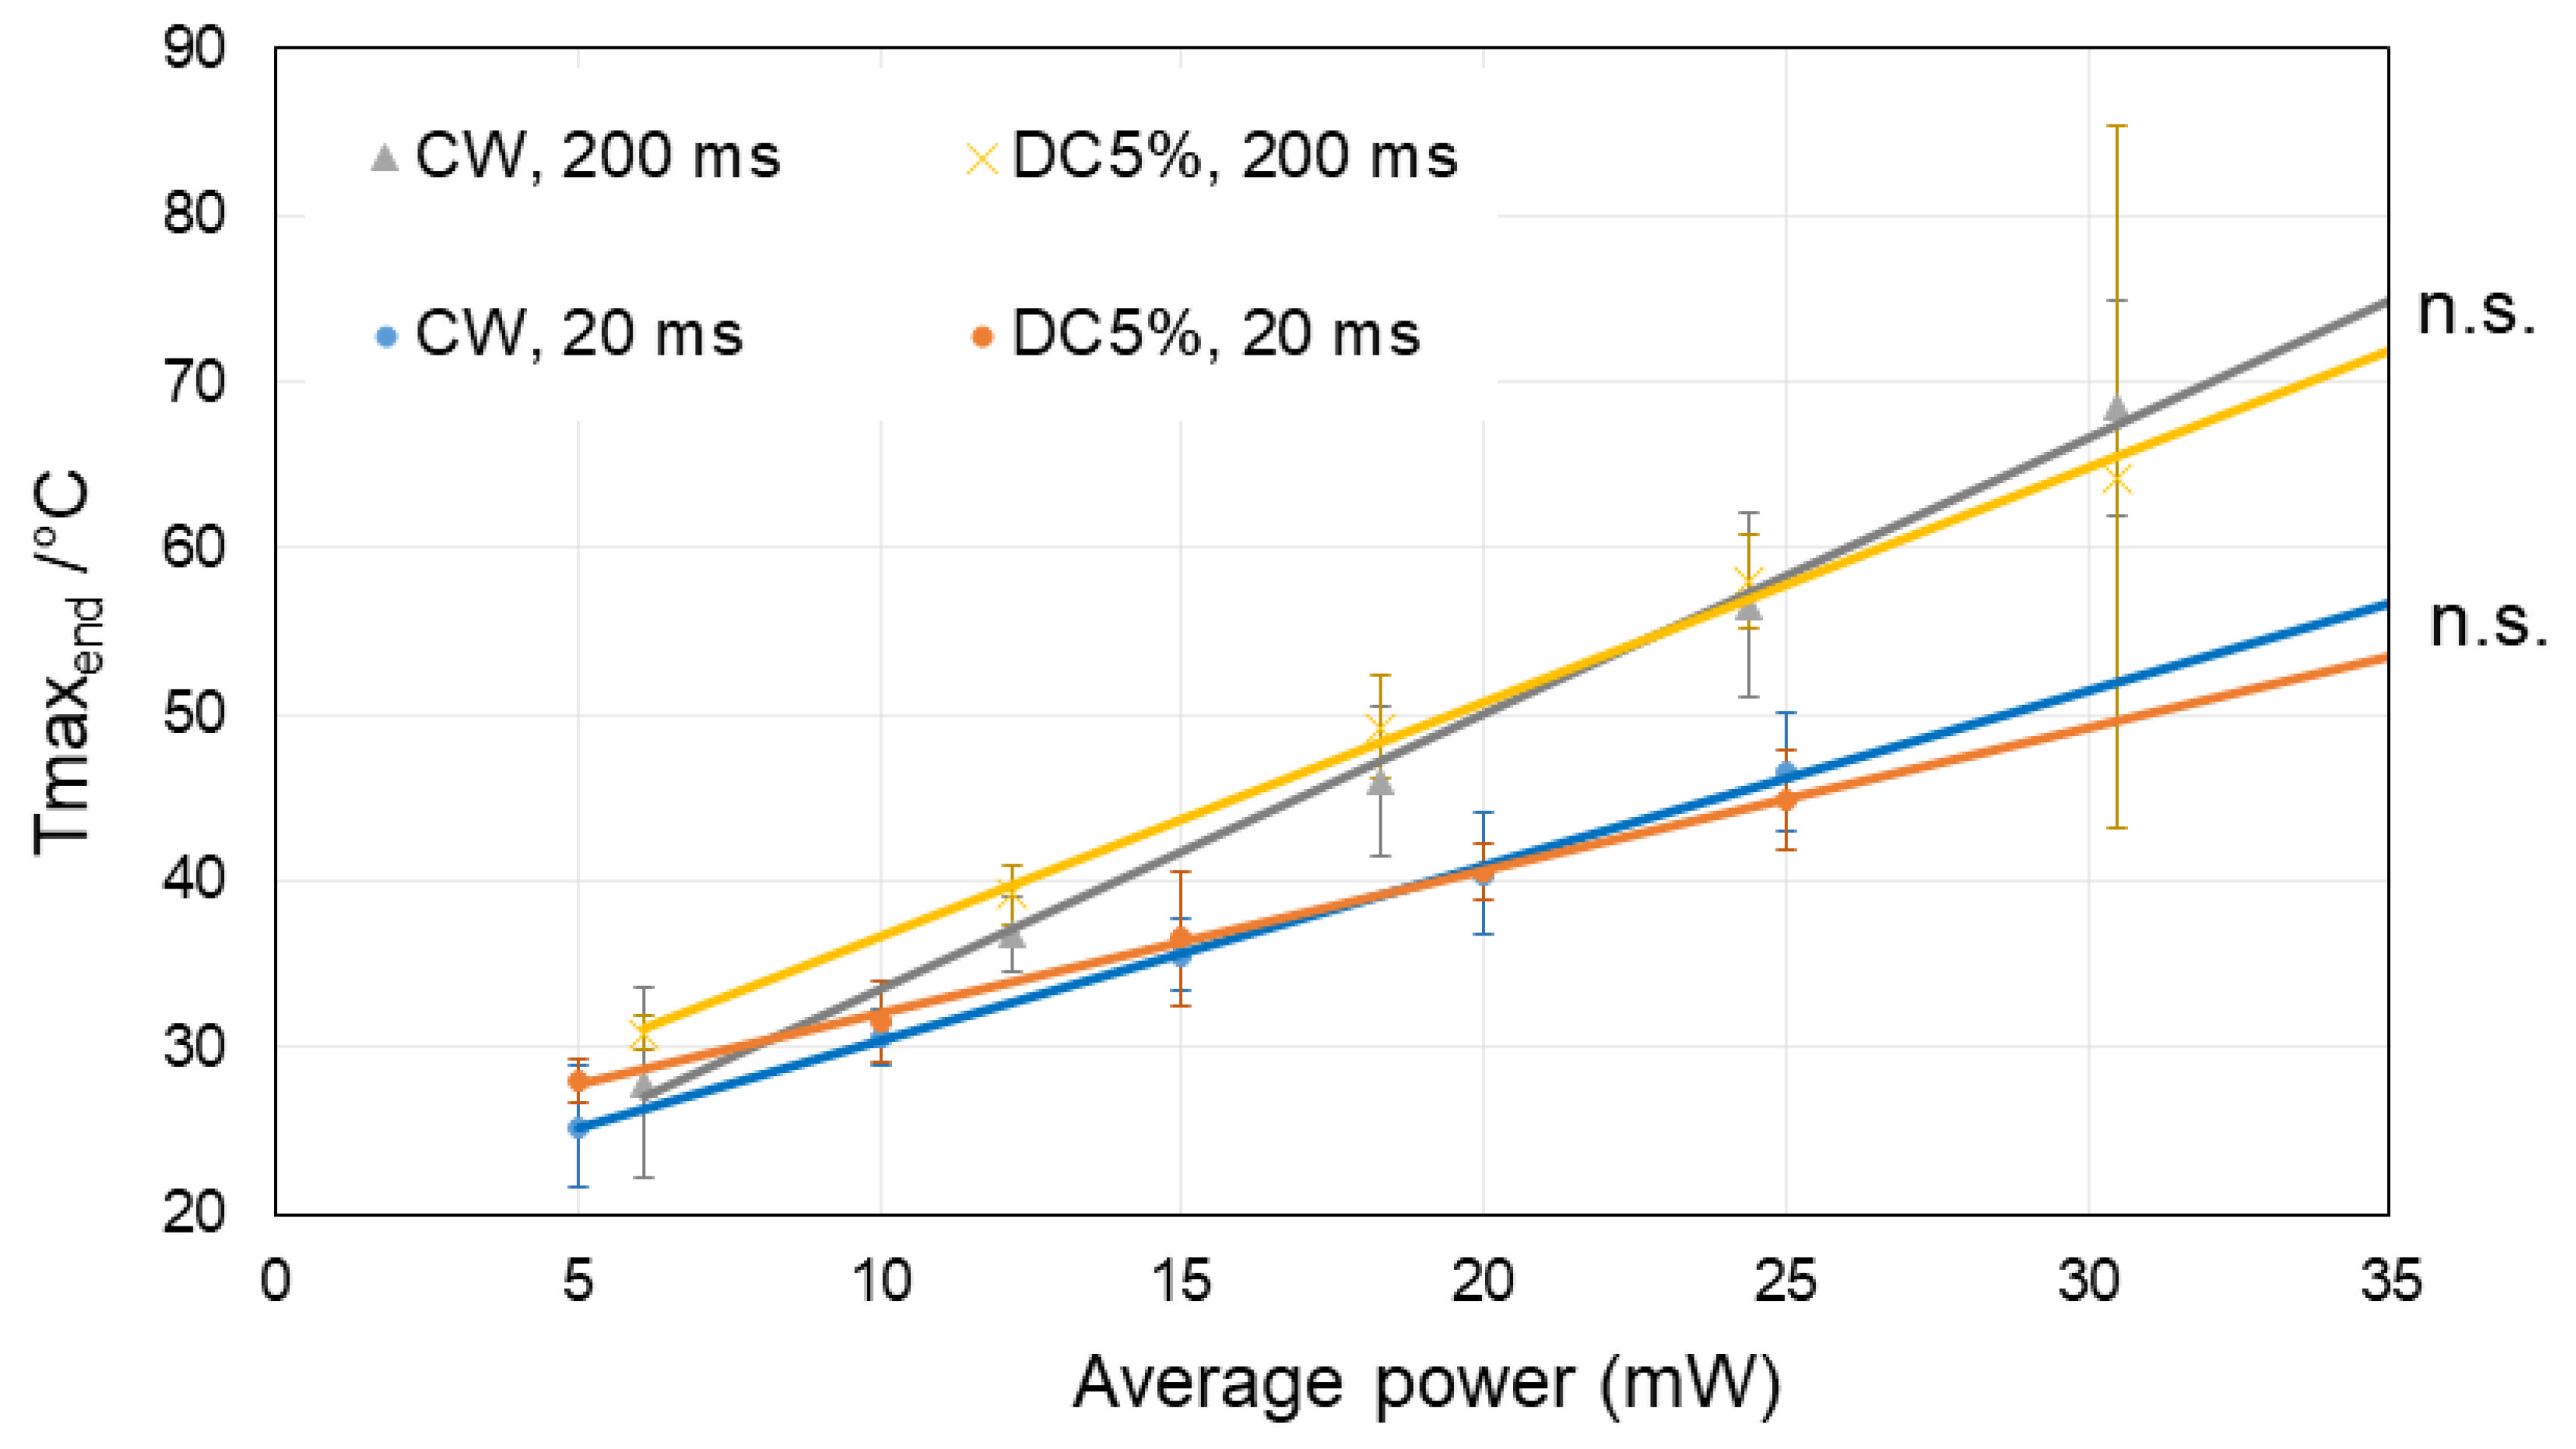
3.3. Optoacoustic Temperature Measurements
4. Discussion
4.1. Power Accuracy
4.2. Damage Mechanism
4.3. RPE Cell Damage: Threshold Power and Damage Extent
4.4. Temperature Measurements Methods
4.5. Temperature Results
4.6. Biological Effects CW and MP
5. Conclusions
Author Contributions
Funding
Institutional Review Board Statement
Informed Consent Statement
Acknowledgments
Conflicts of Interest
References
- Luttrull, J.K.; Musch, D.C.; Mainster, M.A. Subthreshold diode micropulse photocoagulation for the treatment of clinically significant diabetic macular oedema. Br. J. Ophthalmol. 2005, 89, 74–80. [Google Scholar] [CrossRef] [PubMed]
- Ohkoshi, K.; Yamaguchi, T. Subthreshold micropulse diode laser photocoagulation for diabetic macular edema in Japanese patients. Am. J. Ophthalmol. 2010, 149, 133–139. [Google Scholar] [CrossRef]
- Lavinsky, D.; Sramek, C.; Wang, J.; Huie, P.; Dalal, R.; Mandel, Y.; Palanker, D. Subvisible retinal laser therapy: Titration algorithm and tissue response. Retina 2014, 34, 87–97. [Google Scholar] [CrossRef] [PubMed]
- Berger, J.W. Thermal modelling of micropulsed diode laser retinal photocoagulation. Lasers Surg. Med. 1997, 20, 409–415. [Google Scholar] [CrossRef]
- Malik, K.J.; Sampat, K.M.; Mansouri, A.; Steiner, J.N.; Glaser, B.M. Low-intensity/high-density subthreshold microPulse diode laser for chronic central serous chorioretinopathy. Retina 2015, 35, 532–536. [Google Scholar] [CrossRef]
- Luttrull, J.K. Low-Intensity/High-Density Subthreshold Diode Micropulse Laser for Central Serous Chorioretinopathy. Retina 2016, 36, 1658–1663. [Google Scholar] [CrossRef]
- Scholz, P.; Ersoy, L.; Boon, C.J.; Fauser, S. Subthreshold Micropulse Laser (577 nm) Treatment in Chronic Central Serous Chorioretinopathy. Ophthalmologica 2015, 234, 189–194. [Google Scholar] [CrossRef]
- Prasuhn, M.; Miura, Y.; Tura, A.; Rommel, F.; Kakkassery, V.; Sonntag, S.; Grisanti, S.; Ranjbar, M. Influence of Retinal Microsecond Pulse Laser Treatment in Central Serous Chorioretinopathy: A Short-Term Optical Coherence Tomography Angiography Study. J. Clin. Med. 2021, 10, 2418. [Google Scholar] [CrossRef]
- Luttrull, J.K.; Dorin, G. Subthreshold diode micropulse laser photocoagulation (SDM) as invisible retinal phototherapy for diabetic macular edema: A review. Curr. Diabetes Rev. 2012, 8, 274–284. [Google Scholar] [CrossRef]
- Vujosevic, S.; Toma, C.; Villani, E.; Brambilla, M.; Torti, E.; Leporati, F.; Muraca, A.; Nucci, P.; De Cilla, S. Subthreshold Micropulse Laser in Diabetic Macular Edema: 1-Year Improvement in OCT/OCT-Angiography Biomarkers. Transl. Vis. Sci. Technol. 2020, 9, 31. [Google Scholar] [CrossRef]
- Inagaki, K.; Hamada, M.; Ohkoshi, K. Minimally invasive laser treatment combined with intravitreal injection of anti-vascular endothelial growth factor for diabetic macular oedema. Sci. Rep. 2019, 9, 7585. [Google Scholar] [CrossRef] [PubMed]
- Donati, M.C.; Murro, V.; Mucciolo, D.P.; Giorgio, D.; Cinotti, G.; Virgili, G.; Rizzo, S. Subthreshold yellow micropulse laser for treatment of diabetic macular edema: Comparison between fixed and variable treatment regimen. Eur. J. Ophthalmol. 2021, 31, 1254–1260. [Google Scholar] [CrossRef] [PubMed]
- Scholz, P.; Altay, L.; Fauser, S. A Review of Subthreshold Micropulse Laser for Treatment of Macular Disorders. Adv. Ther. 2017, 34, 1528–1555. [Google Scholar] [CrossRef] [PubMed]
- Birngruber, R.; Hillenkamp, F.; Gabel, V.P. Theoretical investigations of laser thermal retinal injury. Health Phys. 1985, 48, 781–796. [Google Scholar] [CrossRef] [PubMed]
- Wang, J.; Quan, Y.; Dalal, R.; Palanker, D. Comparison of Continuous-Wave and Micropulse Modulation in Retinal Laser Therapy. Investig. Ophthalmol. Vis. Sci. 2017, 58, 4722–4732. [Google Scholar] [CrossRef]
- Baade, A.; von der Burchard, C.; Lawin, M.; Koinzer, S.; Schmarbeck, B.; Schlott, K.; Miura, Y.; Roider, J.; Birngruber, R.; Brinkmann, R. Power-controlled temperature guided retinal laser therapy. J. Biomed. Opt. 2017, 22, 118001. [Google Scholar] [CrossRef]
- Kandulla, J.; Elsner, H.; Birngruber, R.; Brinkmann, R. Noninvasive optoacoustic online retinal temperature determination during continuous-wave laser irradiation. J. Biomed. Opt. 2006, 11, 041111. [Google Scholar] [CrossRef]
- Brinkmann, R.; Koinzer, S.; Schlott, K.; Ptaszynski, L.; Bever, M.; Baade, A.; Luft, S.; Miura, Y.; Roider, J.; Birngruber, R. Real-time temperature determination during retinal photocoagulation on patients. J. Biomed. Opt. 2012, 17, 061219. [Google Scholar] [CrossRef]
- Schuele, G.; Rumohr, M.; Huettmann, G.; Brinkmann, R. RPE damage thresholds and mechanisms for laser exposure in the microsecond-to-millisecond time regimen. Investig. Ophthalmol. Vis. Sci. 2005, 46, 714–719. [Google Scholar] [CrossRef]
- Alt, C.; Framme, C.; Schnell, S.; Lee, H.; Brinkmann, R.; Lin, C.P. Selective targeting of the retinal pigment epithelium using an acousto-optic laser scanner. J. Biomed. Opt. 2005, 10, 064014. [Google Scholar] [CrossRef] [Green Version]
- Seifert, E.; Sonntag, S.R.; Kleingarn, P.; Theisen-Kunde, D.; Grisanti, S.; Birngruber, R.; Miura, Y.; Brinkmann, R. Investigations on Retinal Pigment Epithelial Damage at Laser Irradiation in the Lower Microsecond Time Regime. Investig. Ophthalmol. Vis. Sci. 2021, 62, 32. [Google Scholar] [CrossRef] [PubMed]
- Neumann, J.; Brinkmann, R. Self-limited growth of laser-induced vapor bubbles around single microabsorbers. Appl. Phys. Lett. 2008, 93, 033901. [Google Scholar] [CrossRef]
- Brinkmann, R.; Roider, J.; Birngruber, R. Selective retina therapy (SRT): A review on methods, techniques, preclinical and first clinical results. Bull. Soc. Belg. Ophtalmol. 2006, 302, 51–69. [Google Scholar]
- Guymer, R.H.; Wu, Z.; Hodgson, L.A.B.; Caruso, E.; Brassington, K.H.; Tindill, N.; Aung, K.Z.; McGuinness, M.B.; Fletcher, E.L.; Chen, F.K.; et al. Subthreshold Nanosecond Laser Intervention in Age-Related Macular Degeneration: The LEAD Randomized Controlled Clinical Trial. Ophthalmology 2019, 126, 829–838. [Google Scholar] [CrossRef] [PubMed]
- Schule, G.; Huttmann, G.; Framme, C.; Roider, J.; Brinkmann, R. Noninvasive optoacoustic temperature determination at the fundus of the eye during laser irradiation. J. Biomed. Opt. 2004, 9, 173–179. [Google Scholar] [CrossRef]
- Koinzer, S.; Baade, A.; Schlott, K.; Hesse, C.; Caliebe, A.; Roider, J.; Brinkmann, R. Temperature-Controlled Retinal Photocoagulation Reliably Generates Uniform Subvisible, Mild, or Moderate Lesions. Transl. Vis. Sci. Technol. 2015, 4, 9. [Google Scholar] [CrossRef]
- Koinzer, S.; Schlott, K.; Ptaszynski, L.; Bever, M.; Kleemann, S.; Saeger, M.; Baade, A.; Caliebe, A.; Miura, Y.; Birngruber, R.; et al. Temperature-controlled retinal photocoagulation—A step toward automated laser treatment. Investig. Ophthalmol. Vis. Sci. 2012, 53, 3605–3614. [Google Scholar] [CrossRef]
- Schlott, K.; Koinzer, S.; Ptaszynski, L.; Bever, M.; Baade, A.; Roider, J.; Birngruber, R.; Brinkmann, R. Automatic temperature controlled retinal photocoagulation. J. Biomed. Opt. 2012, 17, 061223. [Google Scholar] [CrossRef]
- Sramek, C.; Paulus, Y.; Nomoto, H.; Huie, P.; Brown, J.; Palanker, D. Dynamics of retinal photocoagulation and rupture. J. Biomed. Opt. 2009, 14, 034007. [Google Scholar] [CrossRef]
- Denton, M.L.; Noojin, G.D.; Foltz, M.S.; Clark, C.D., 3rd; Estlack, L.E.; Rockwell, B.A.; Thomas, R.J. Spatially correlated microthermography maps threshold temperature in laser-induced damage. J. Biomed. Opt. 2011, 16, 036003. [Google Scholar] [CrossRef]
- Ji, R.R.; Lee, S.Y. Molecular Sensors of Temperature, Pressure, and Pain with Special Focus on TRPV1, TRPM8, and PIEZO2 Ion Channels. Neurosci. Bull. 2021, 37, 1745–1749. [Google Scholar] [CrossRef] [PubMed]
- Lavinsky, D.; Wang, J.; Huie, P.; Dalal, R.; Lee, S.J.; Lee, D.Y.; Palanker, D. Nondamaging Retinal Laser Therapy: Rationale and Applications to the Macula. Investig. Ophthalmol. Vis. Sci. 2016, 57, 2488–2500. [Google Scholar] [CrossRef] [PubMed]
- Kleyman, V.; Gernandt, H.; Worthmann, K.; Abbas, H.S.; Brinkmann, R.; Muller, M.A. Modeling and parameter identification for real-time temperature controlled retinal laser therapies. At-Automatisierungstechnik 2020, 68, 953–966. [Google Scholar] [CrossRef]
- Inagaki, K.; Shuo, T.; Katakura, K.; Ebihara, N.; Murakami, A.; Ohkoshi, K. Sublethal Photothermal Stimulation with a Micropulse Laser Induces Heat Shock Protein Expression in ARPE-19 Cells. J. Ophthalmol. 2015, 2015, 729792. [Google Scholar] [CrossRef]
- Iwami, H.; Pruessner, J.; Shiraki, K.; Brinkmann, R.; Miura, Y. Protective effect of a laser-induced sub-lethal temperature rise on RPE cells from oxidative stress. Exp. Eye Res. 2014, 124, 37–47. [Google Scholar] [CrossRef]
- Richert, E.; Papenkort, J.; Klettner, A.; Tode, J.; Koinzer, S.; Brinkmann, R.; Fink, C.; Roeder, T.; Lucius, R.; Roider, J. Response of Retinal Pigment Epithelium (RPE)-Choroid Explants to Thermal Stimulation Therapy of the RPE (TSR). Lasers Surg. Med. 2021, 53, 359–369. [Google Scholar] [CrossRef]
- Tode, J.; Richert, E.; Koinzer, S.; Klettner, A.; von der Burchard, C.; Brinkmann, R.; Lucius, R.; Roider, J. Thermal Stimulation of the Retina Reduces Bruch’s Membrane Thickness in Age Related Macular Degeneration Mouse Models. Transl. Vis. Sci. Technol. 2018, 7, 2. [Google Scholar] [CrossRef]


Publisher’s Note: MDPI stays neutral with regard to jurisdictional claims in published maps and institutional affiliations. |
© 2022 by the authors. Licensee MDPI, Basel, Switzerland. This article is an open access article distributed under the terms and conditions of the Creative Commons Attribution (CC BY) license (https://creativecommons.org/licenses/by/4.0/).
Share and Cite
Miura, Y.; Inagaki, K.; Hutfilz, A.; Seifert, E.; Schmarbeck, B.; Murakami, A.; Ohkoshi, K.; Brinkmann, R. Temperature Increase and Damage Extent at Retinal Pigment Epithelium Compared between Continuous Wave and Micropulse Laser Application. Life 2022, 12, 1313. https://doi.org/10.3390/life12091313
Miura Y, Inagaki K, Hutfilz A, Seifert E, Schmarbeck B, Murakami A, Ohkoshi K, Brinkmann R. Temperature Increase and Damage Extent at Retinal Pigment Epithelium Compared between Continuous Wave and Micropulse Laser Application. Life. 2022; 12(9):1313. https://doi.org/10.3390/life12091313
Chicago/Turabian StyleMiura, Yoko, Keiji Inagaki, Alessa Hutfilz, Eric Seifert, Benedikt Schmarbeck, Akira Murakami, Kishiko Ohkoshi, and Ralf Brinkmann. 2022. "Temperature Increase and Damage Extent at Retinal Pigment Epithelium Compared between Continuous Wave and Micropulse Laser Application" Life 12, no. 9: 1313. https://doi.org/10.3390/life12091313