
Determination of the Respiratory Compensation Point by Detecting Changes in Intercostal Muscles Oxygenation by Using Near-Infrared Spectroscopy

 ,
,  ,
,  ,
,  , ,
, ,
Abstract
:1. Introduction
2. Materials and Methods
2.1. Design of Study and Participants
2.2. Procedures
2.3. Anthropometric and Respiratory Measurements
2.4. Oxygen-Uptake Test
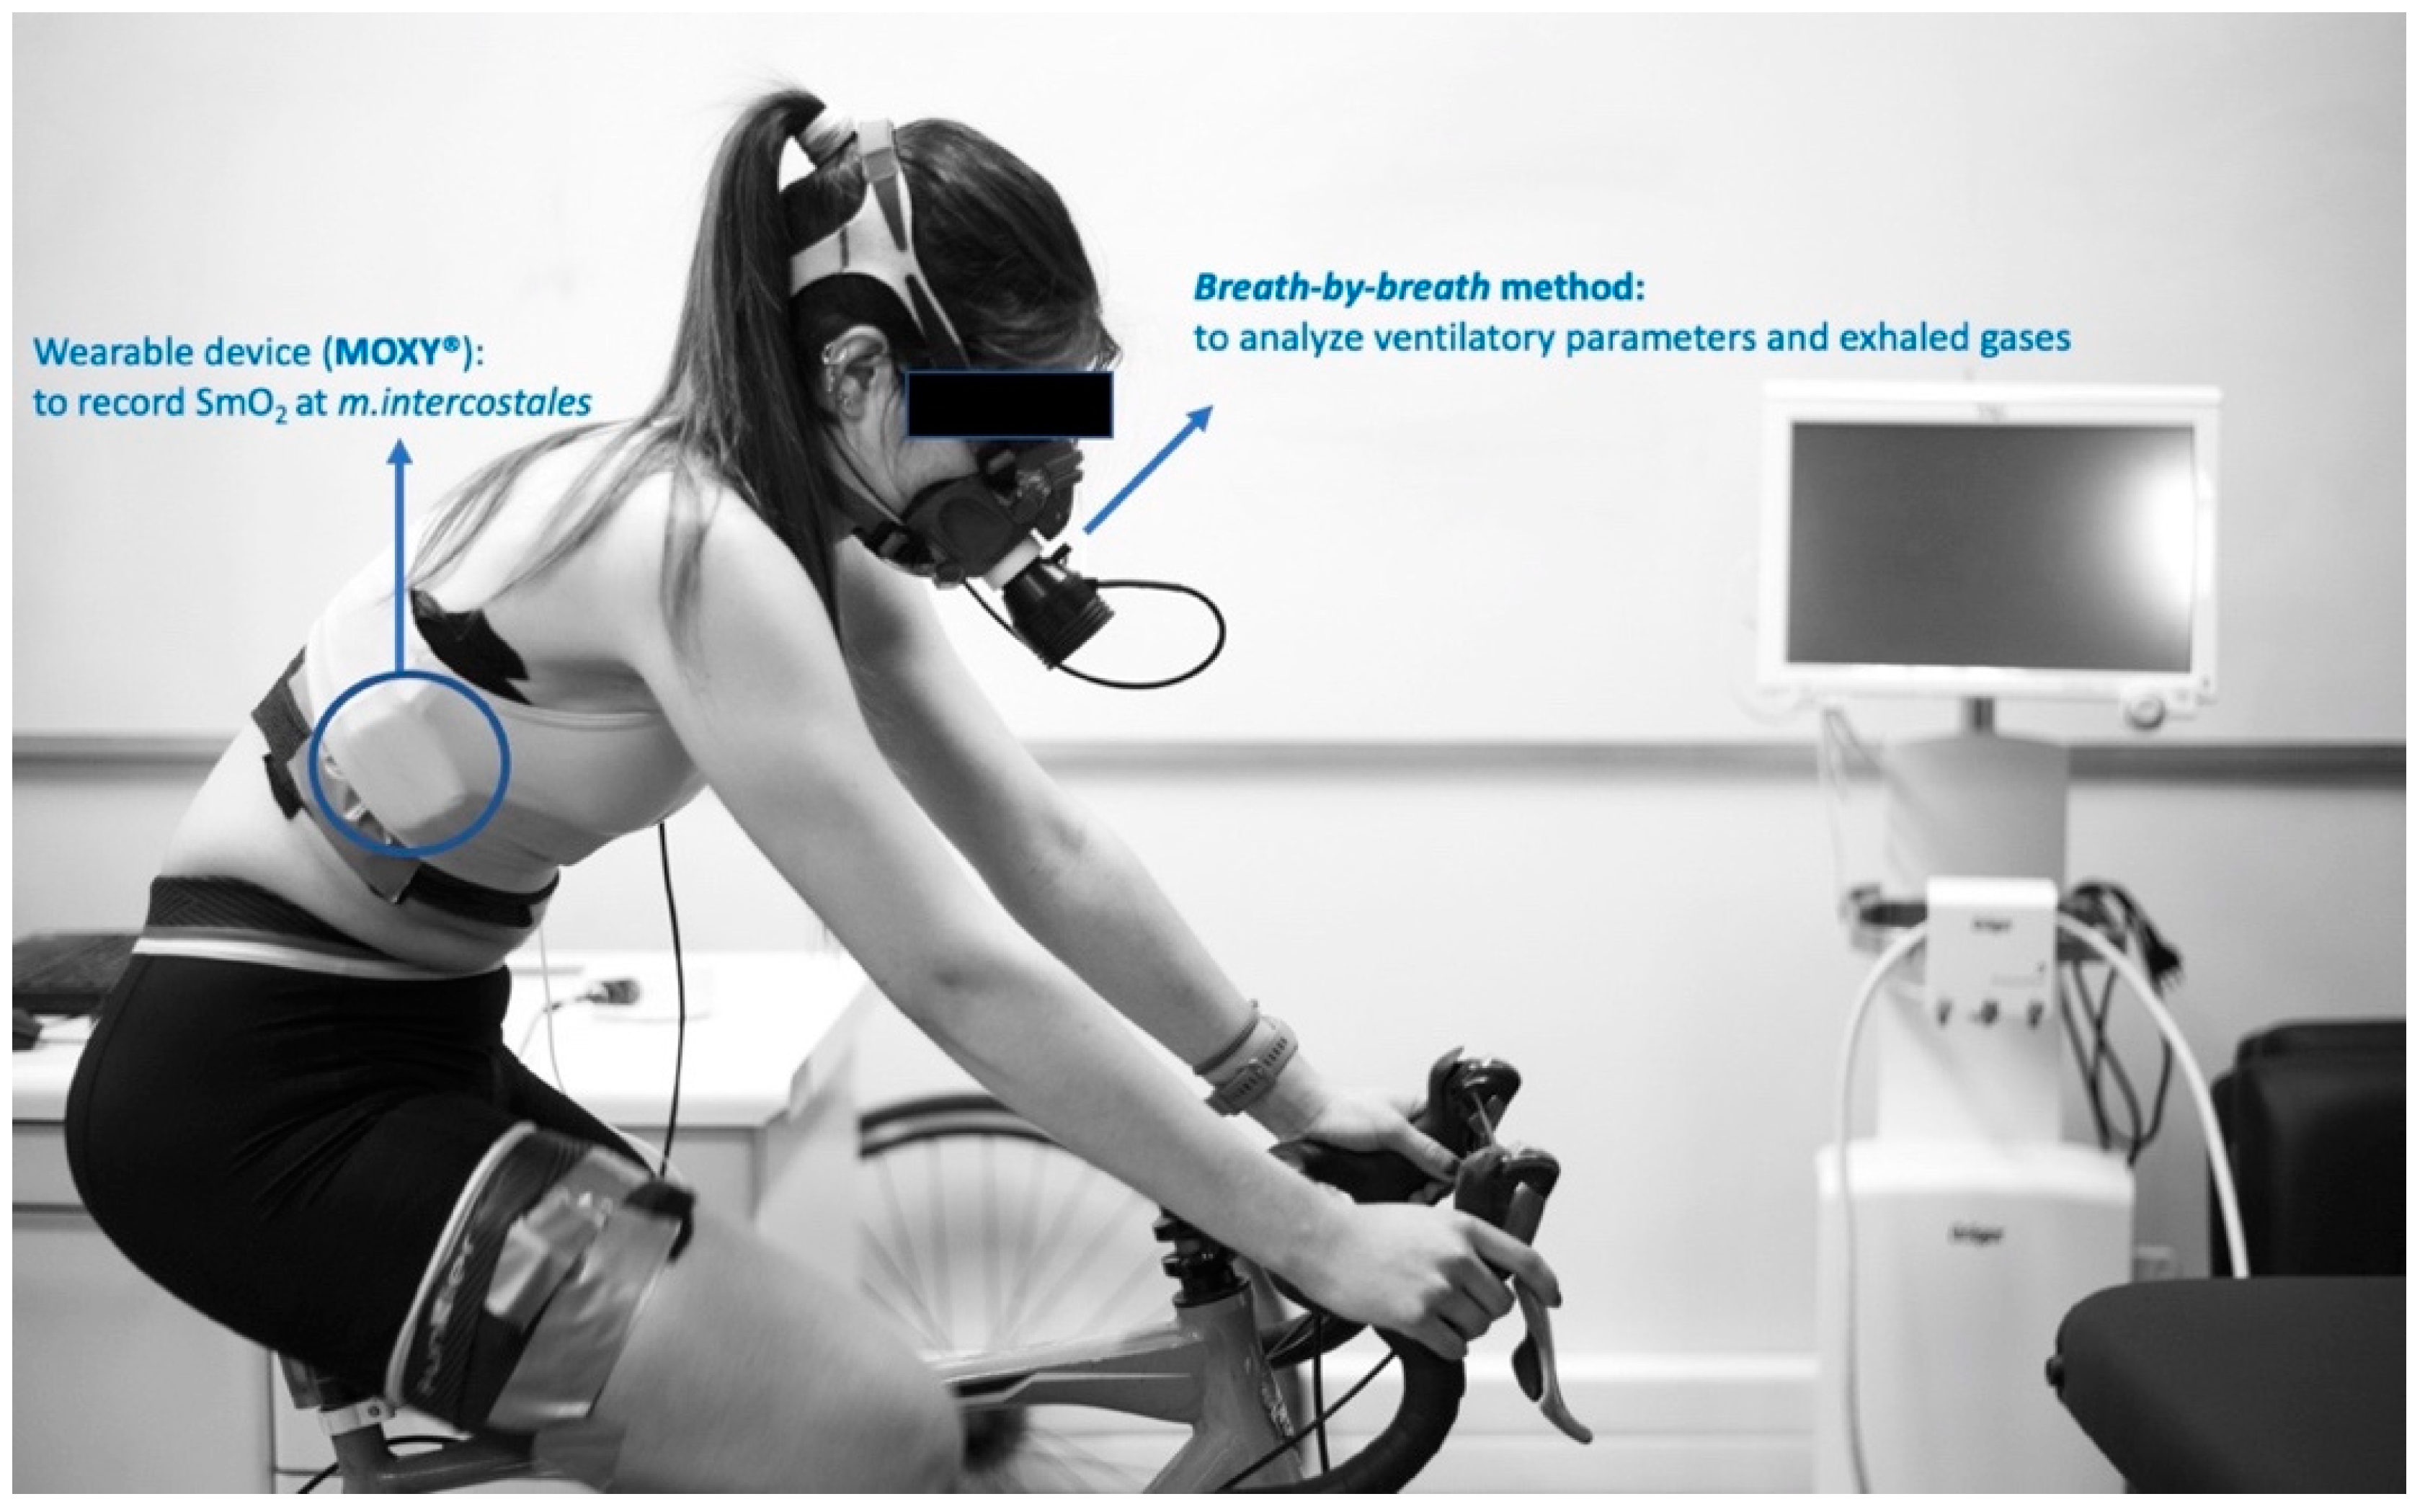
2.5. Measurement of Muscle Oxygenation (SmO2)
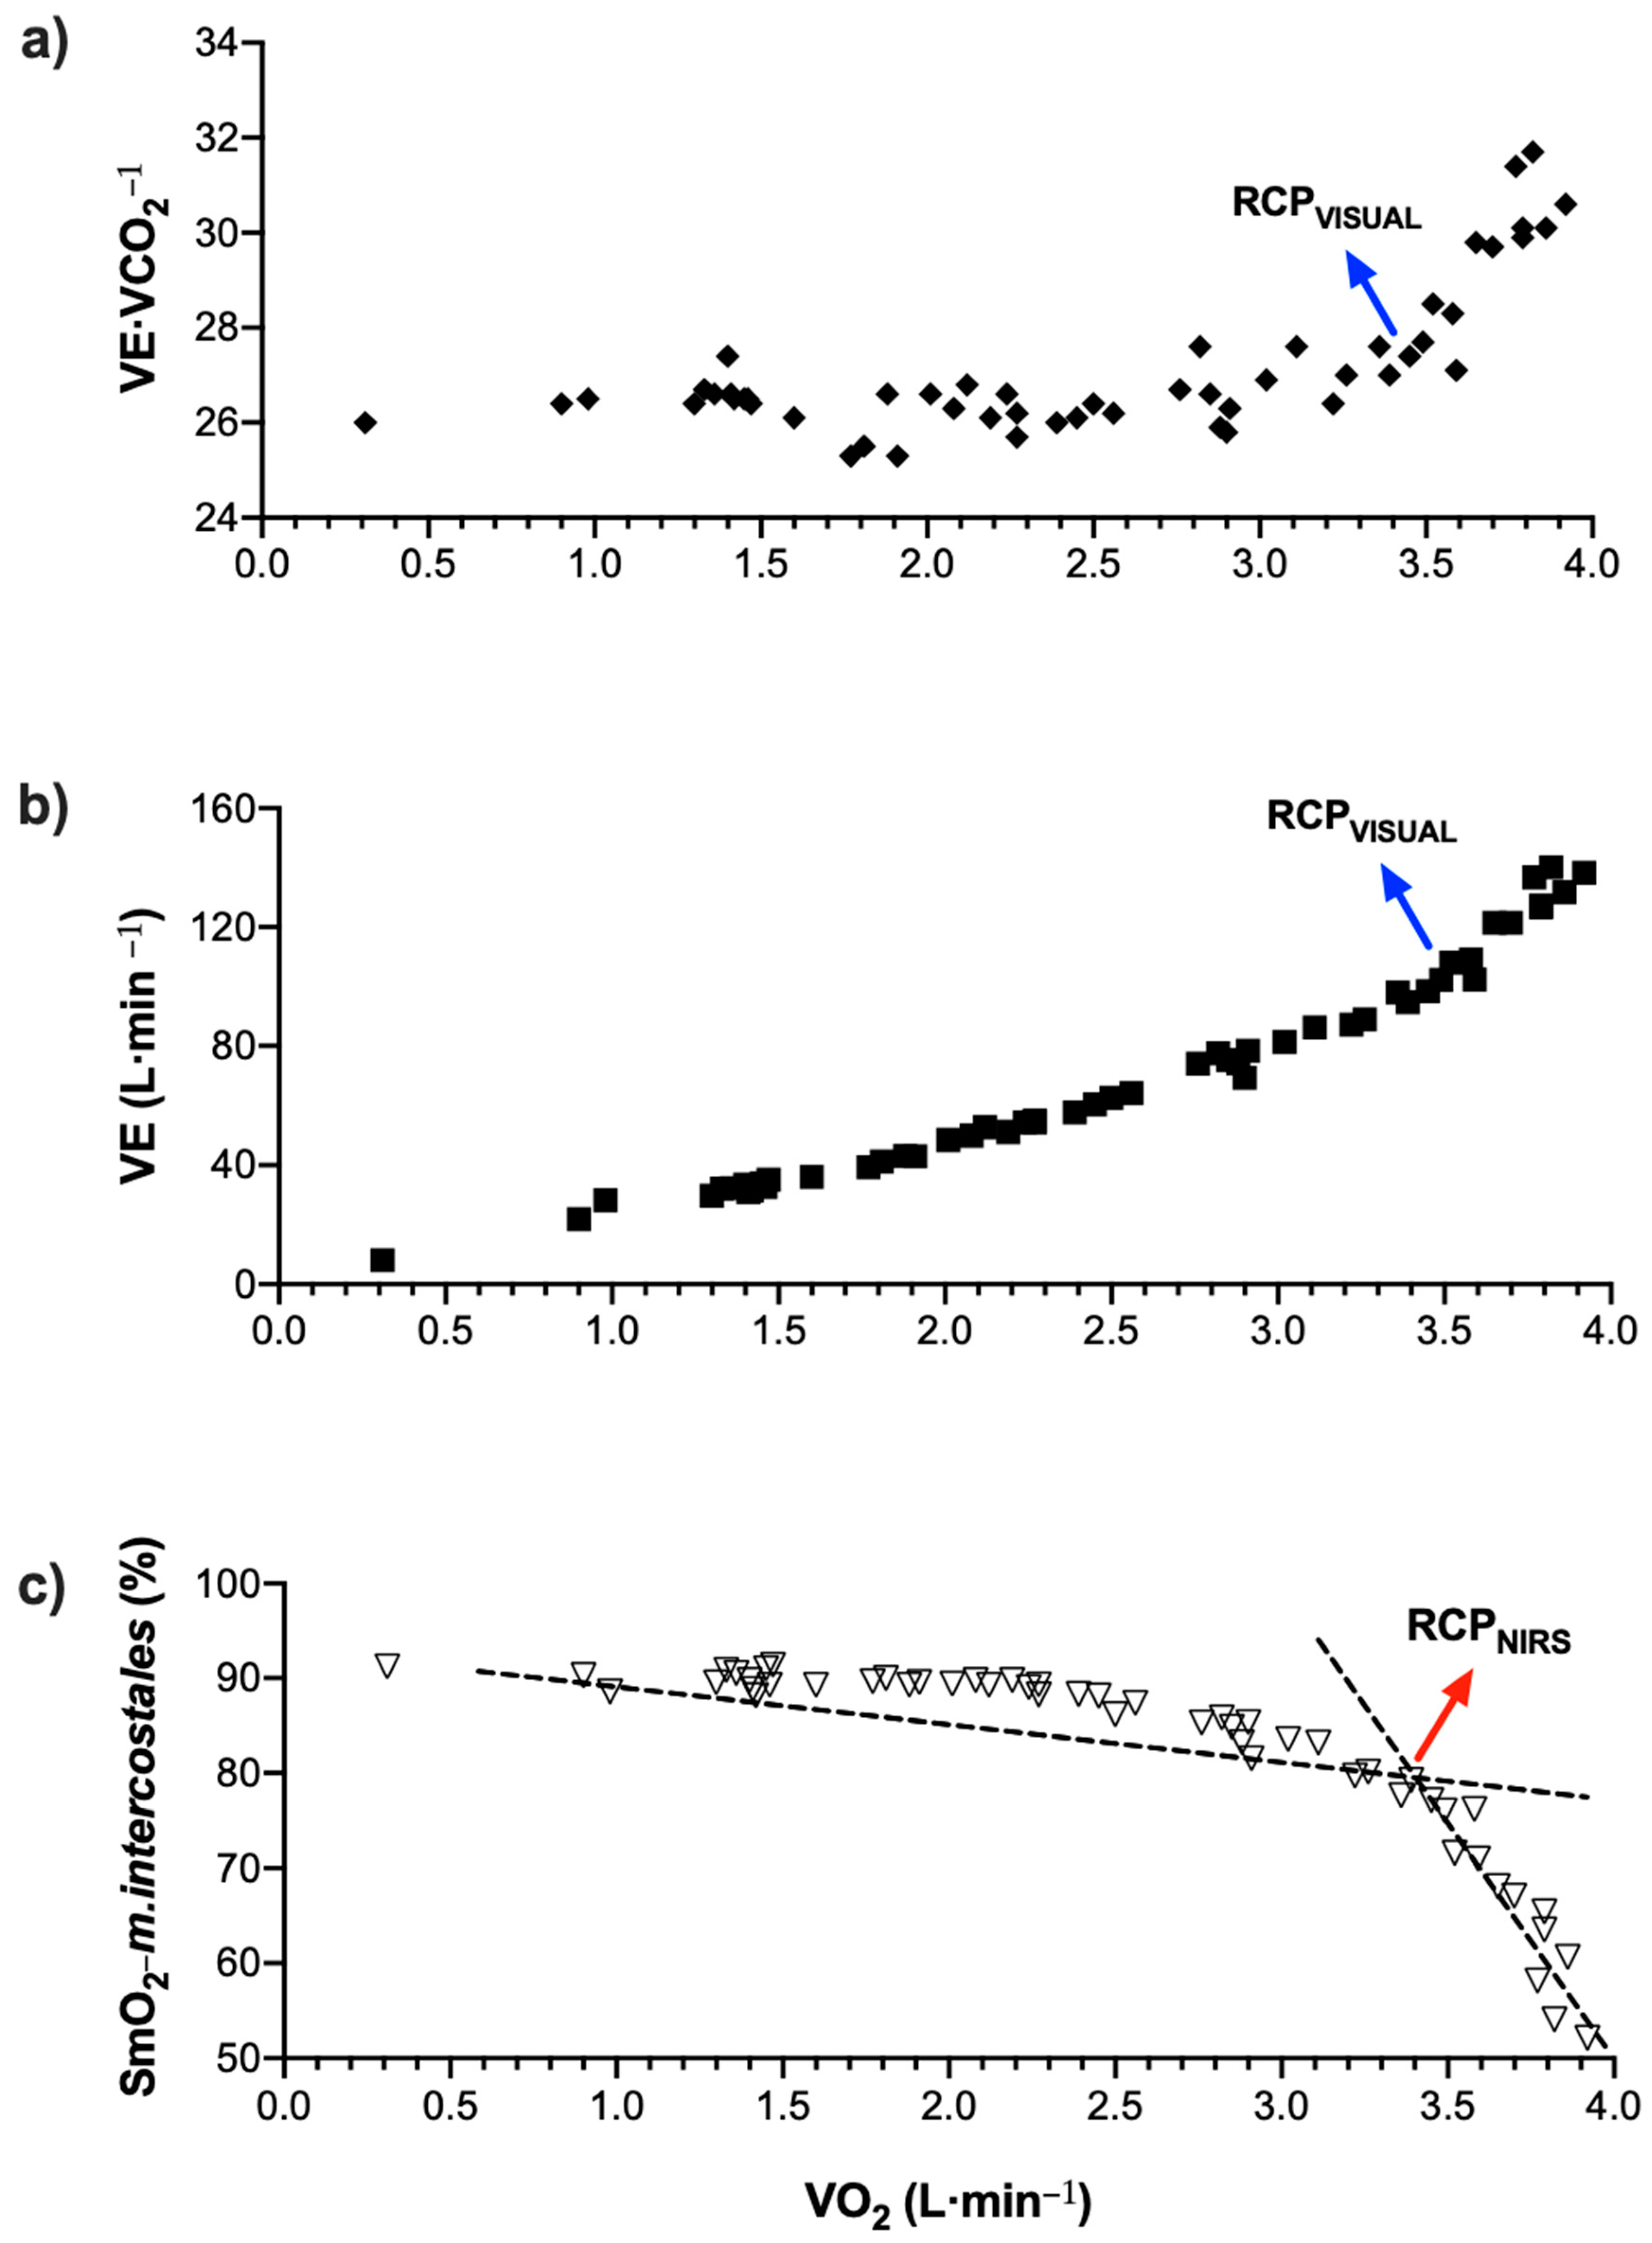
2.6. Data Analysis
2.7. Statistical Analysis
3. Results
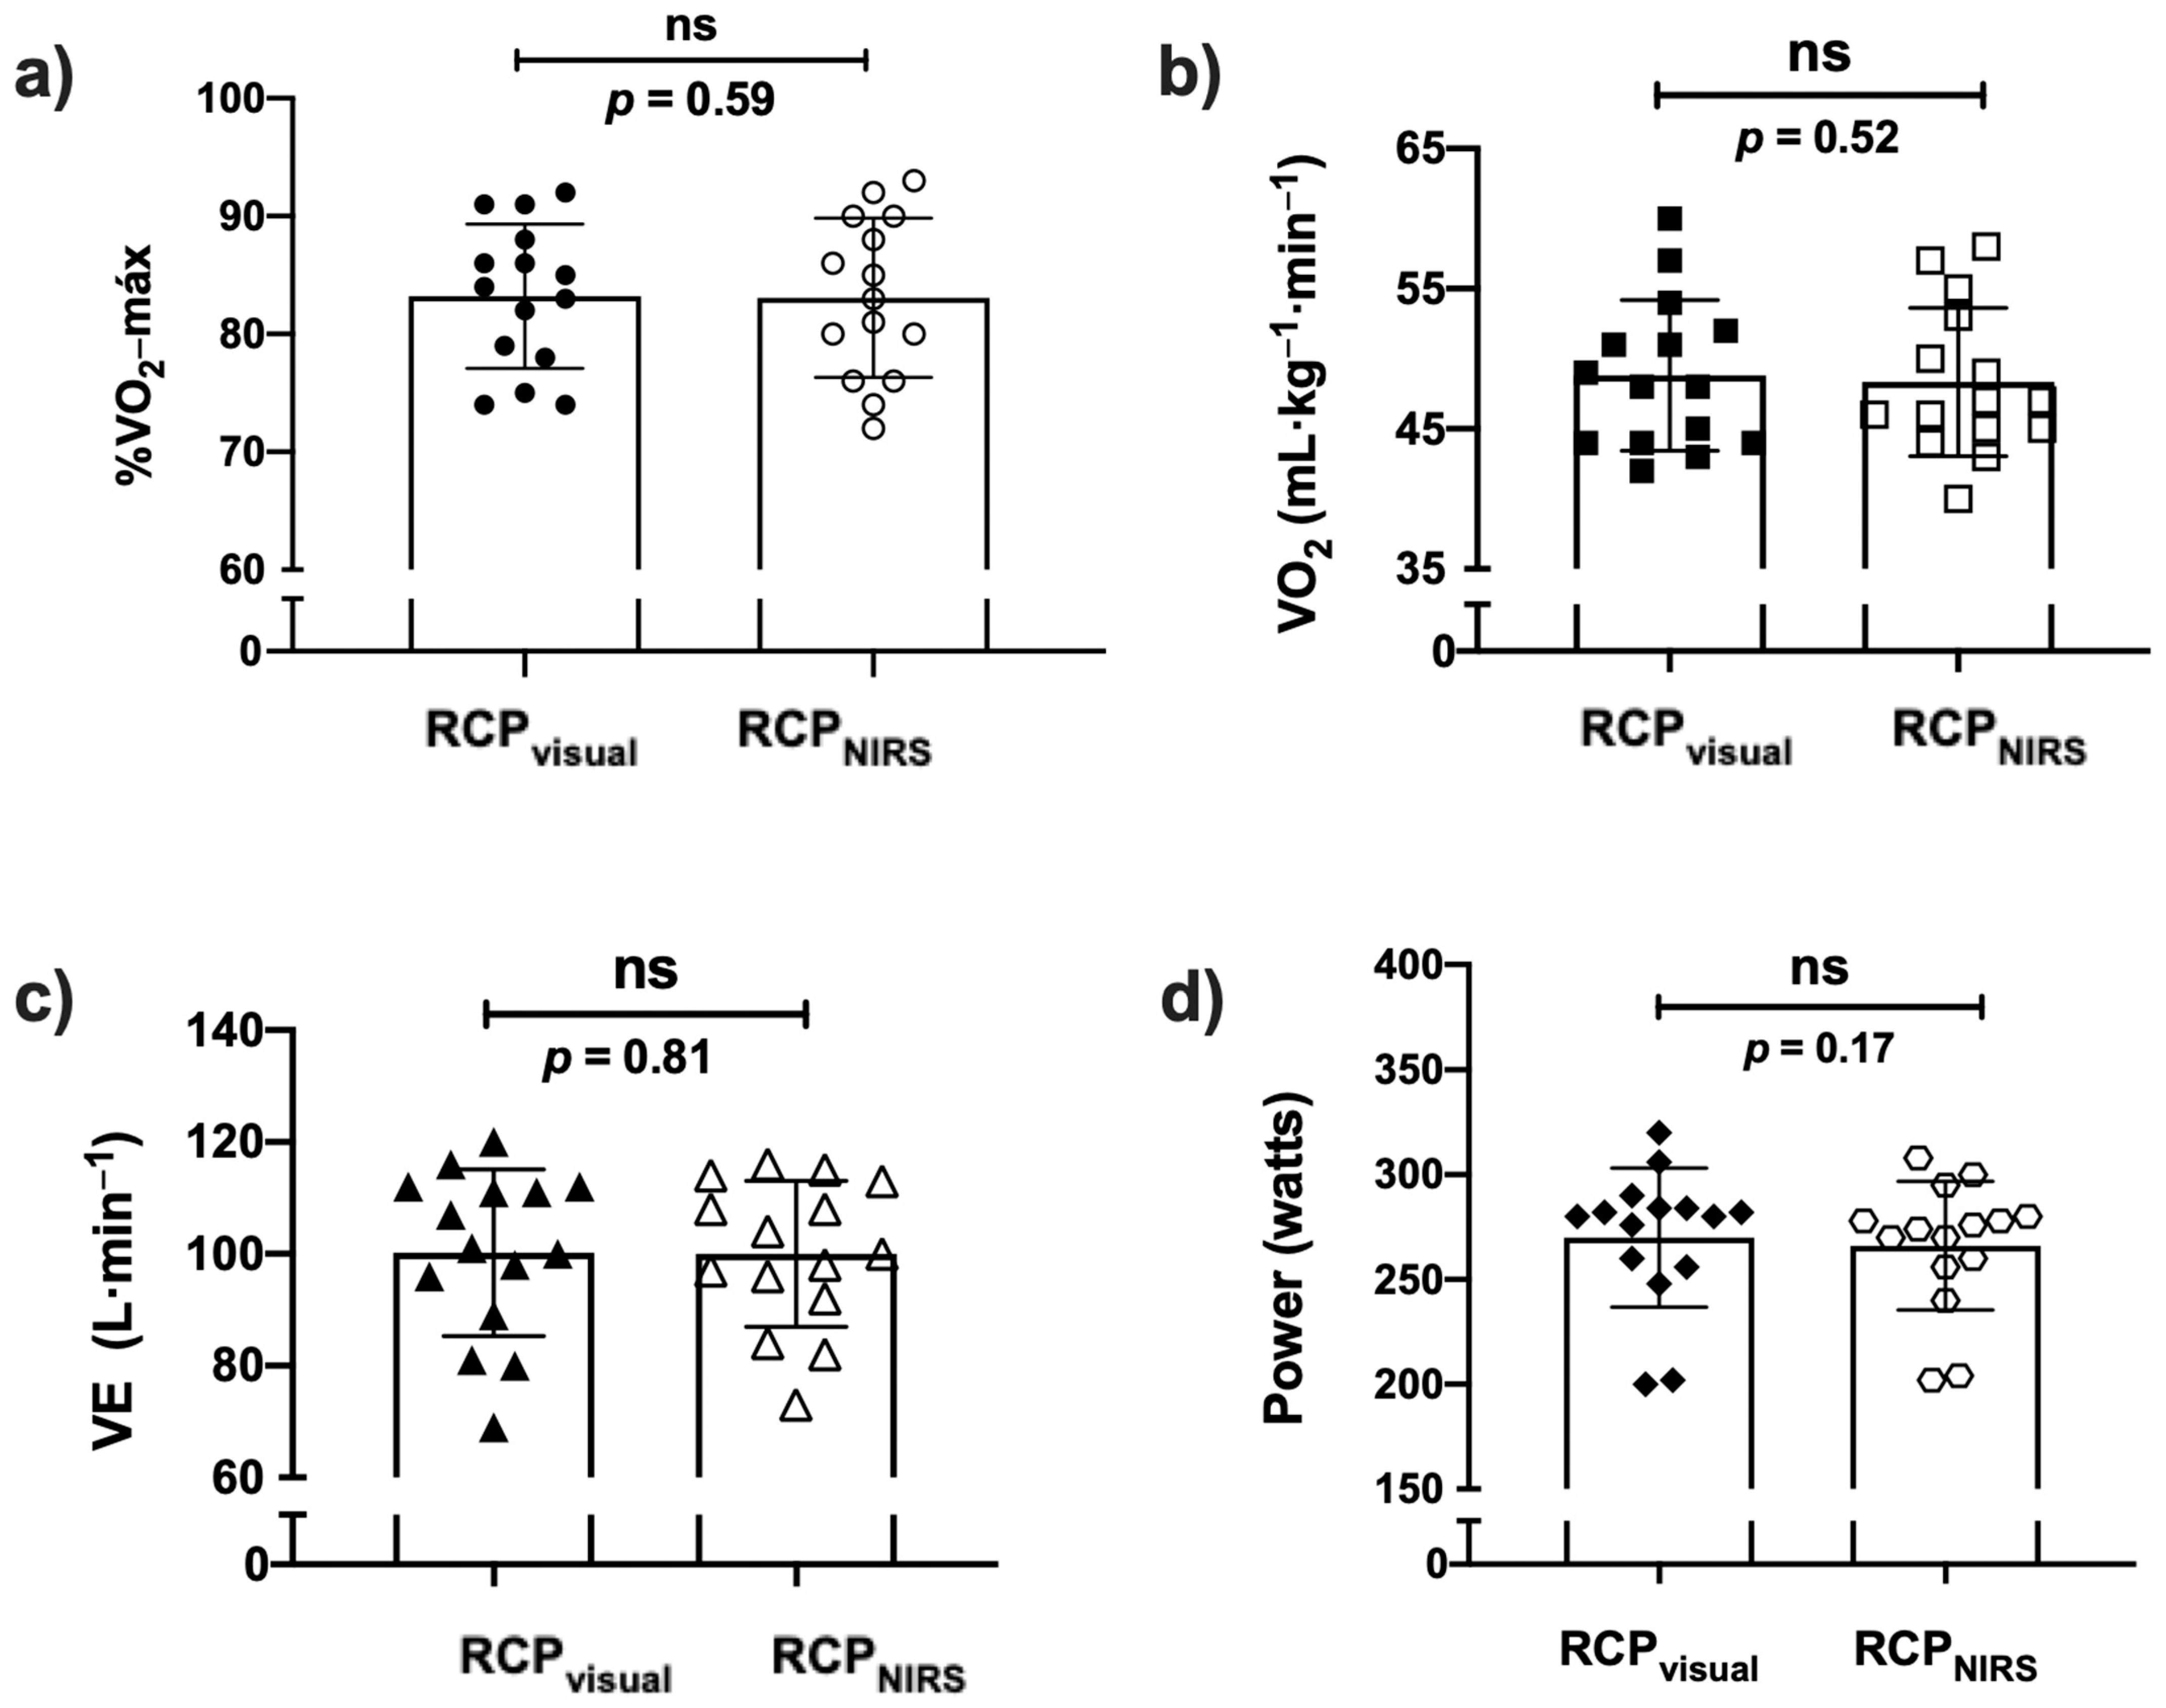
3.1. Comparison between RCPvisual and RCPNIRS
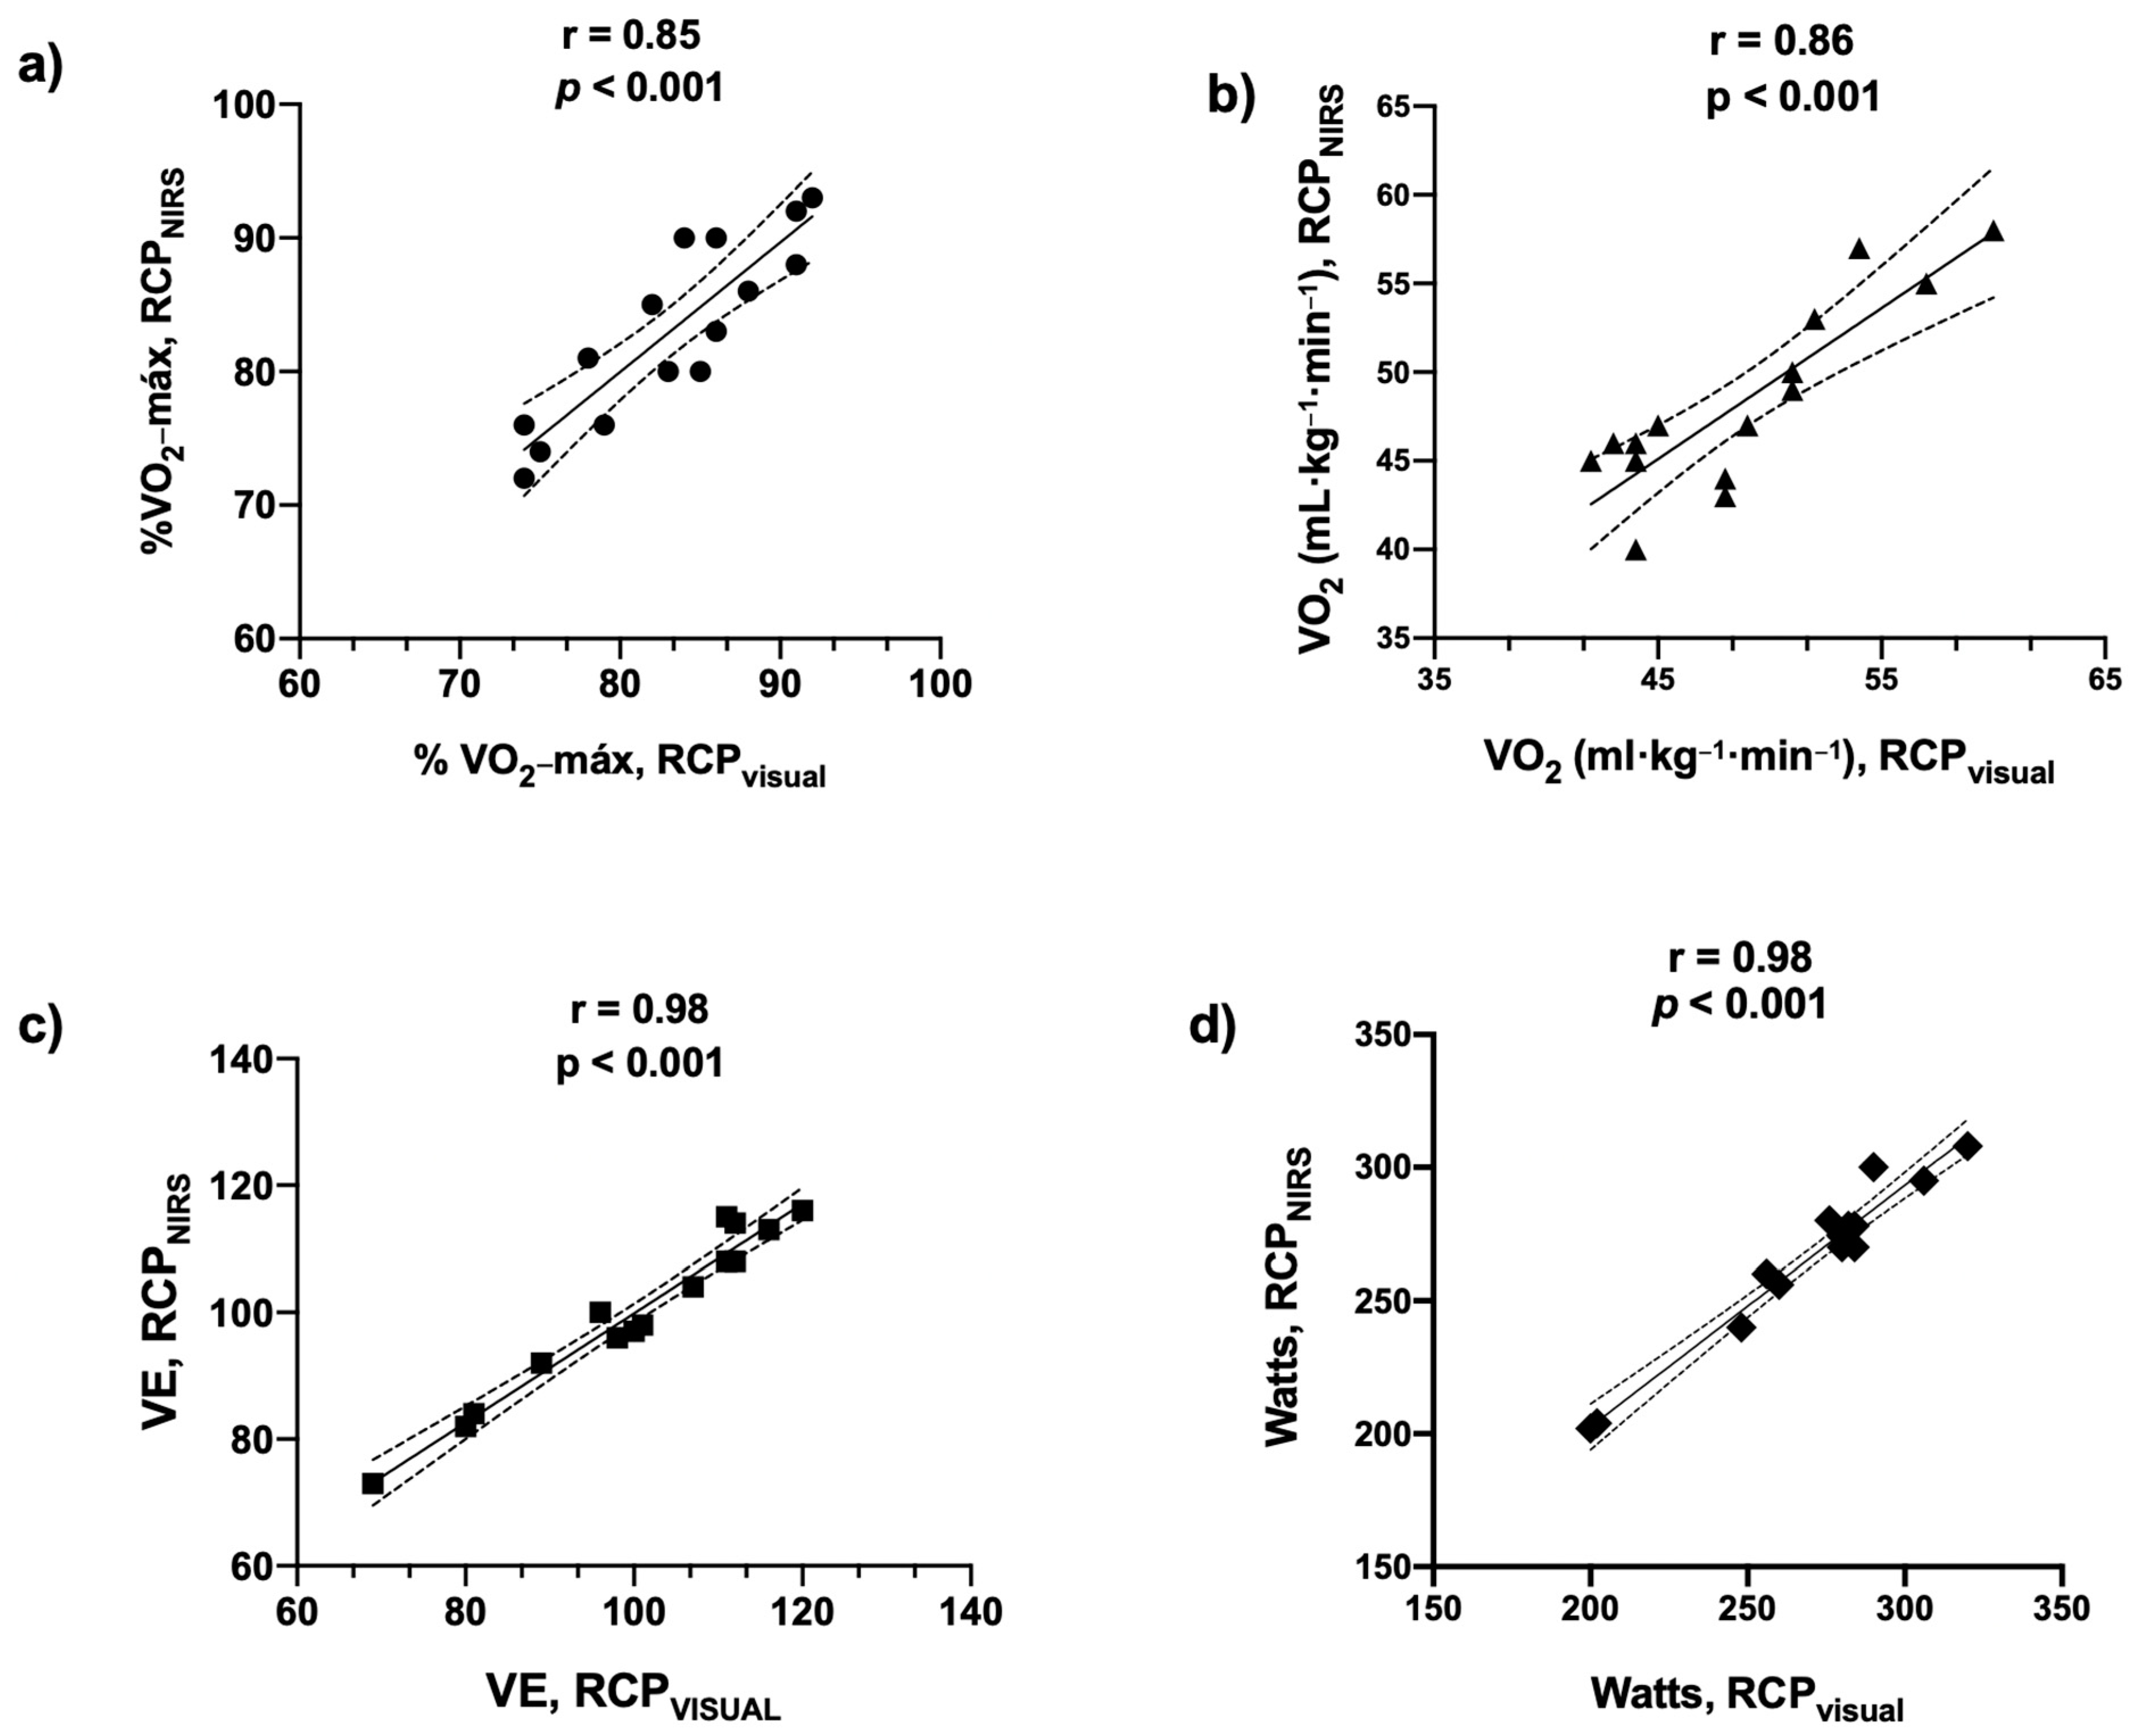
3.2. Correlations
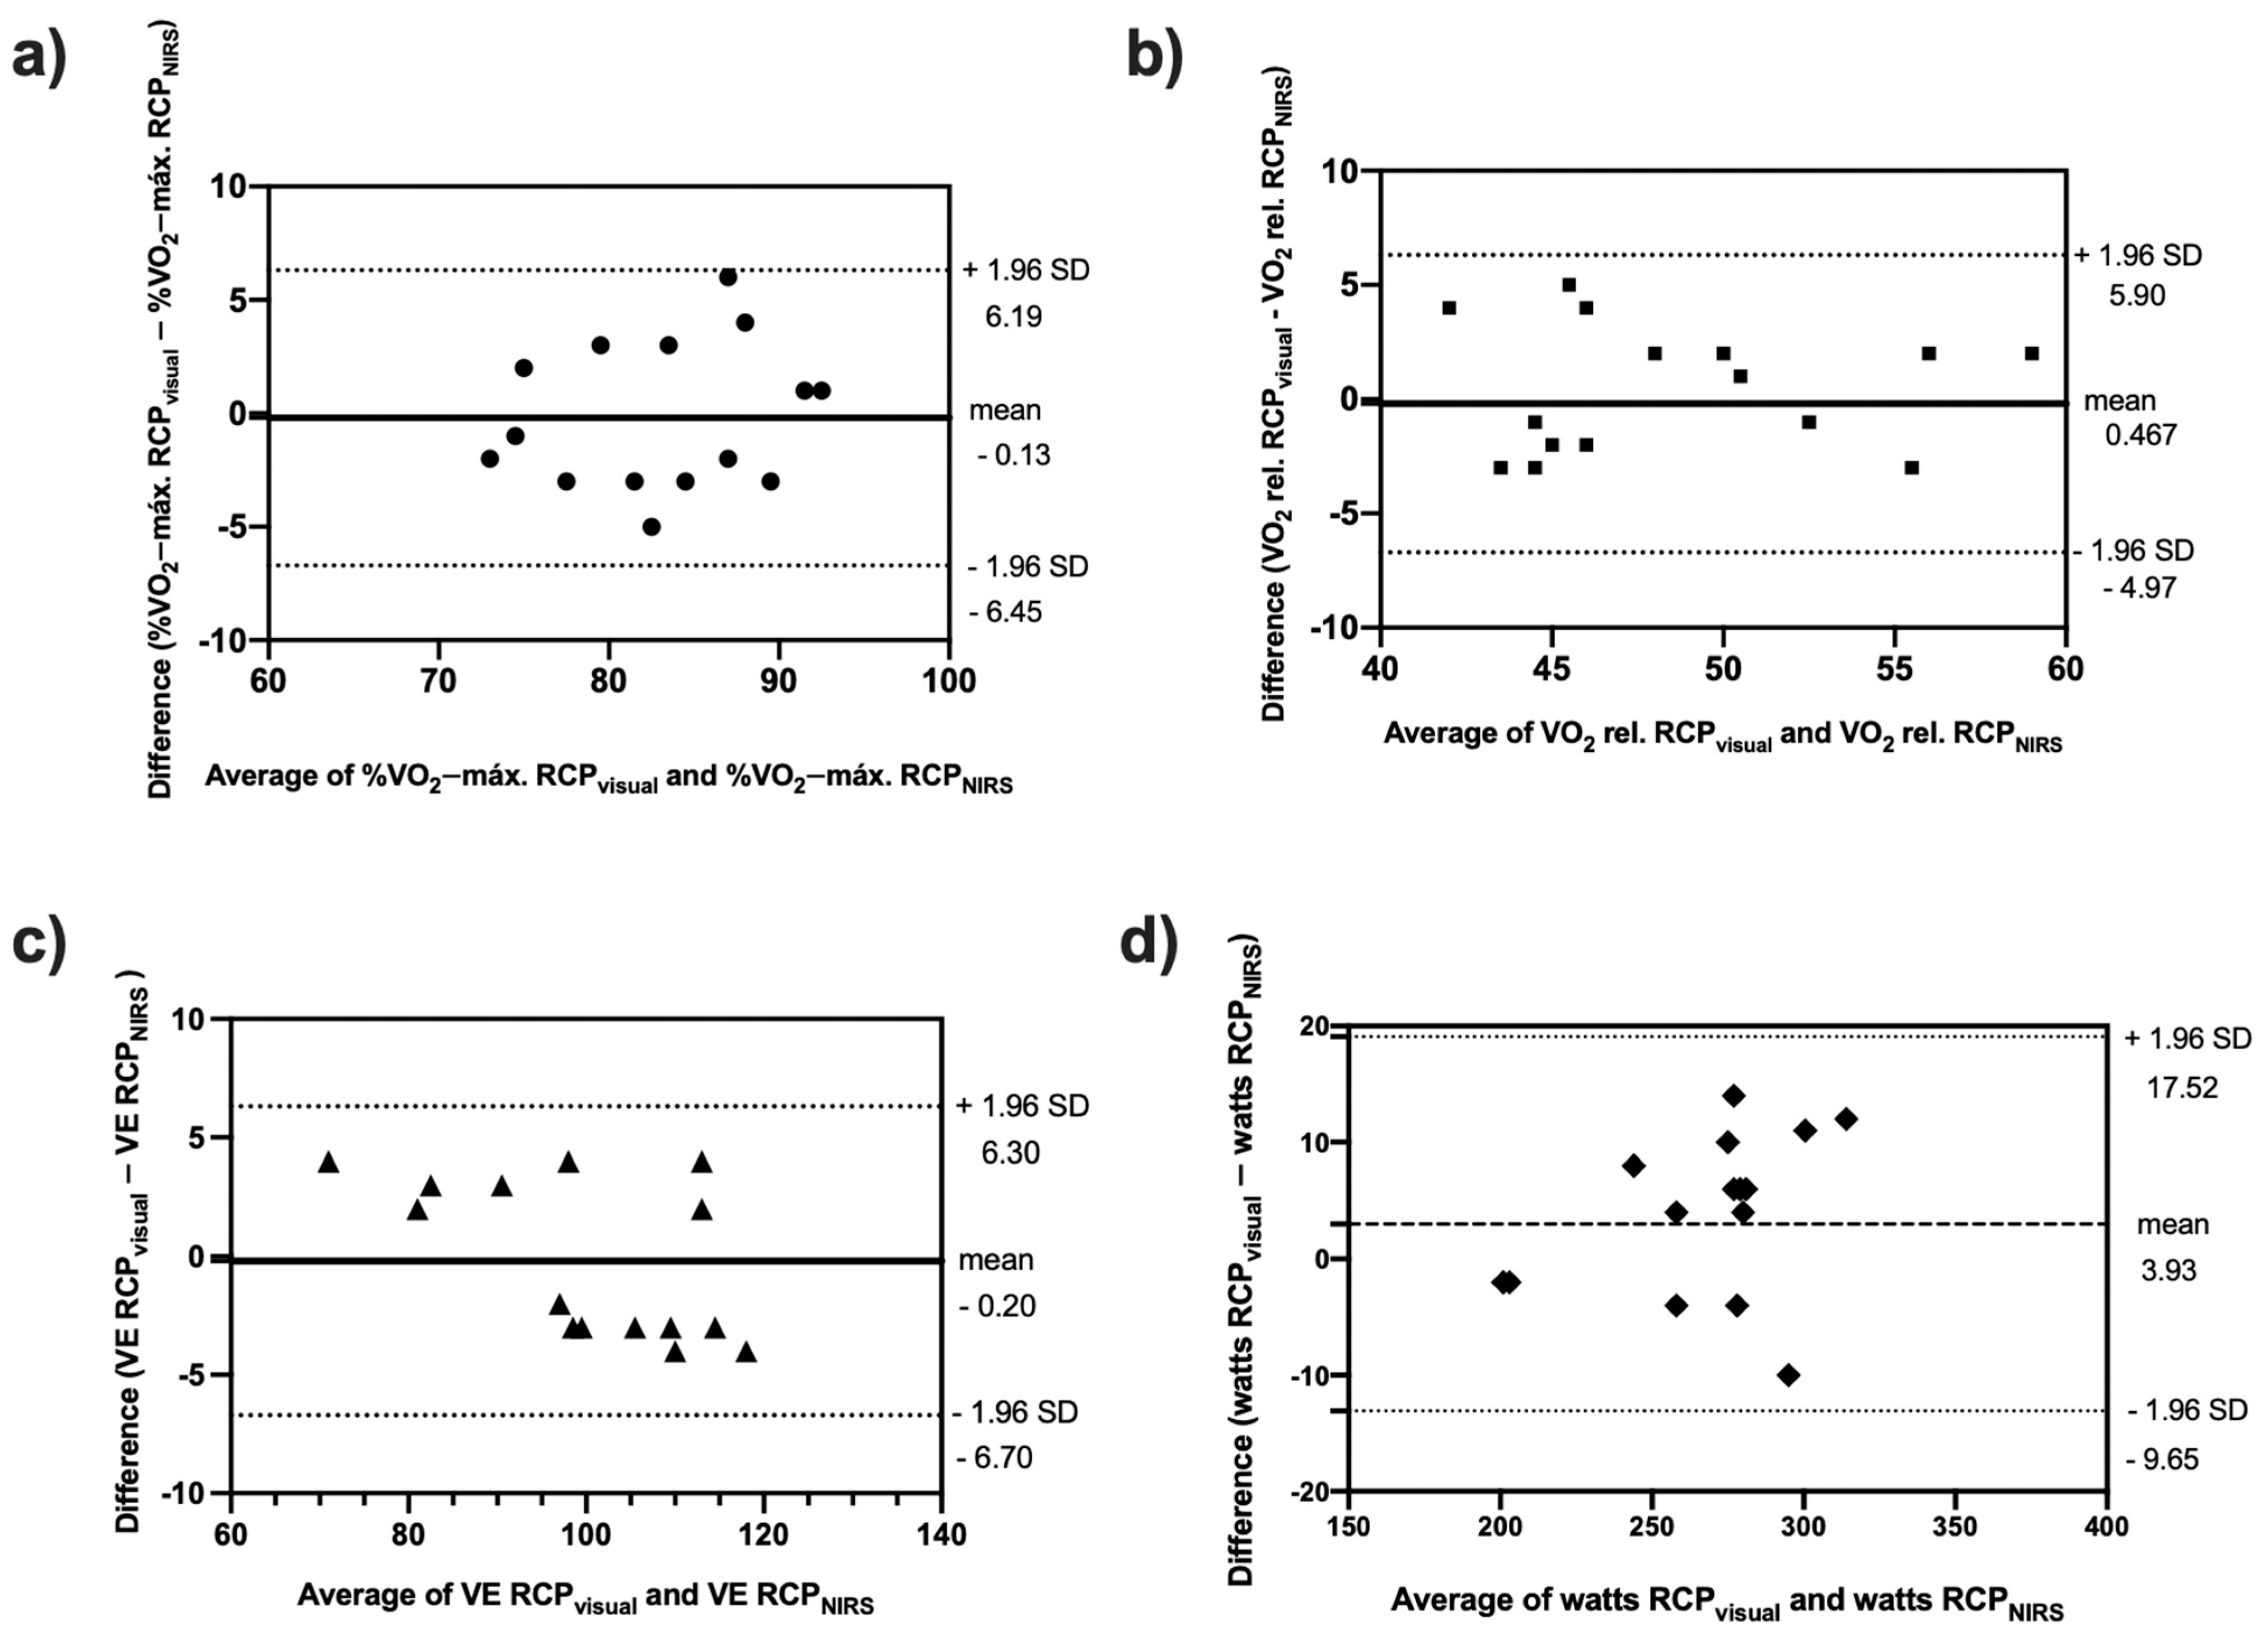
3.3. Agreement
4. Discussion
5. Conclusions
Author Contributions
Funding
Institutional Review Board Statement
Informed Consent Statement
Data Availability Statement
Acknowledgments
Conflicts of Interest
References
- Kubukeli, Z.N.; Noakes, T.D.; Dennis, S.C. Training techniques to improve endurance exercise performances. Sports Med. 2002, 32, 489–509. [Google Scholar] [CrossRef] [PubMed] [Green Version]
- Seiler, K.S.; Kjerland, G.Ø. Quantifying training intensity distribution in elite endurance athletes: Is there evidence for an “optimal” distribution? Scand. J. Med. Sci. Sports 2006, 16, 49–56. [Google Scholar] [CrossRef] [PubMed]
- Seiler, S. What is best practice for training intensity and duration distribution in endurance athletes? Int. J. Sports Physiol. Perform. 2010, 5, 276–291. [Google Scholar] [CrossRef] [PubMed]
- Jamnick, N.A.; Pettitt, R.W.; Granata, C.; Pyne, D.B.; Bishop, D.J. An examination and critique of current methods to determine exercise intensity. Sports Med. 2020, 50, 1729–1756. [Google Scholar] [CrossRef] [PubMed]
- Iannetta, D.; Inglis, E.C.; Mattu, A.T.; Fontana, F.Y.; Pogliaghi, S.; Keir, D.A.; Murias, J.M. A critical evaluation of current methods for exercise prescription in women and men. Med. Sci. Sports Exerc. 2020, 52, 466–473. [Google Scholar] [CrossRef] [PubMed]
- Stöggl, T.L.; Sperlich, B. The training intensity distribution among well-trained and elite endurance athletes. Front. Physiol. 2015, 6, 295. [Google Scholar] [CrossRef] [Green Version]
- Kenneally, M.; Casado, A.; Gomez-Ezeiza, J.; Santos-Concejero, J. Training intensity distribution analysis by race pace vs. physiological approach in world-class middle- and long-distance runners. Eur. J. Sport Sci. 2021, 21, 819–826. [Google Scholar] [CrossRef]
- Bellinger, P.; Arnold, B.; Minahan, C. Quantifying the training-intensity distribution in middle-distance runners: The influence of different methods of training-intensity quantification. Int. J. Sports Physiol. Perform. 2020, 15, 319–323. [Google Scholar] [CrossRef]
- Campos, Y.; Casado, A.; Vieira, J.G.; Guimarães, M.; Sant’Ana, L.; Leitão, L.; Da Silva, S.F.; Silva Marques De Azevedo, P.H.; Vianna, J.; Domínguez, R. Training-intensity distribution on middle- and long-distance runners: A systematic review. Int. J. Sports Med. 2021. [Google Scholar] [CrossRef]
- González-Ravé, J.M.; Hermosilla, F.; González-Mohíno, F.; Casado, A.; Pyne, D.B. Training intensity distribution, training volume, and periodization models in elite swimmers: A systematic review. Int. J. Sports Physiol. Perform. 2021, 16, 913–926. [Google Scholar] [CrossRef]
- Wasserman, K. The anaerobic threshold measurement in exercise testing. Clin. Chest Med. 1984, 5, 77–88. [Google Scholar] [CrossRef]
- Perrey, S.; Ferrari, M. Muscle oximetry in sports science: A systematic review. Sports Med. 2018, 48, 597–616. [Google Scholar] [CrossRef] [PubMed]
- Mancini, D.M.; Bolinger, L.; Li, H.; Kendrick, K.; Chance, B.; Wilson, J.R. Validation of near-infrared spectroscopy in humans. J. Appl. Physiol. 1994, 77, 2740–2747. [Google Scholar] [CrossRef] [PubMed]
- Crum, E.M.; O’Connor, W.J.; Van Loo, L.; Valckx, M.; Stannard, S.R. Validity and reliability of the Moxy oxygen monitor during incremental cycling exercise. Eur. J. Sport Sci. 2017, 17, 1037–1043. [Google Scholar] [CrossRef]
- Thiel, C.; Vogt, L.; Himmelreich, H.; Hübscher, M.; Banzer, W. Reproducibility of muscle oxygen saturation. Int. J. Sports Med. 2011, 32, 277–280. [Google Scholar] [CrossRef]
- Fontana, F.Y.; Keir, D.A.; Bellotti, C.; De Roia, G.F.; Murias, J.M.; Pogliaghi, S. Determination of respiratory point compensation in healthy adults: Can non-invasive near-infrared spectroscopy help? J. Sci. Med. Sport 2015, 18, 590–595. [Google Scholar] [CrossRef]
- Klusiewicz, A.; Rebis, K.; Ozimek, M.; Czaplicki, A. The use of muscle Near-Infrared Spectroscopy (NIRS) to assess the aerobic training loads of world-class rowers. Biol. Sport 2021, 38, 713–719. [Google Scholar] [CrossRef]
- Romer, L.M.; Lovering, A.T.; Haverkamp, H.C.; Pegelow, D.F.; Dempsey, J.A. Effect of inspiratory muscle work on peripheral fatigue of locomotor muscles in healthy humans. J. Physiol. 2006, 571, 425–439. [Google Scholar] [CrossRef]
- Power, G.A.; Handrigan, G.A.; Basset, F.A. Ventilatory response during an incremental exercise test: A mode of testing effect. Eur. J. Sport Sci. 2012, 12, 491–498. [Google Scholar] [CrossRef]
- Legrand, R.; Prieur, F.; Marles, A.; Nourry, C.; Lazzari, S.; Blondel, N.; Mucci, P. Respiratory muscle oxygenation kinetics: Relationships with breathing pattern during exercise. Int. J. Sports Med. 2007, 28, 91–99. [Google Scholar] [CrossRef]
- Contreras-Briceño, F.; Espinosa-Ramírez, M.; Moya-Gallardo, E.; Fuentes-Kloss, R.; Gabrielli, L.; Araneda, O.F.; Viscor, G. Intercostal muscles oxygenation and breathing pattern during exercise in competitive marathon runners. Int. J. Environ. Res. Public Health 2021, 18, 8287. [Google Scholar] [CrossRef] [PubMed]
- Contreras-Briceño, F.; Espinosa-Ramirez, M.; Hevia, G.; Llambias, D.; Carrasco, M.; Cerda, F.; López-Fuenzalida, A.; García, P.; Gabrielli, L.; Viscor, G. Reliability of NIRS portable device for measuring intercostal muscles oxygenation during exercise. J. Sports Sci. 2019, 37, 2653–2659. [Google Scholar] [CrossRef] [PubMed]
- Espinosa-Ramírez, M.; Moya-Gallardo, E.; Araya-Román, F.; Riquelme-Sánchez, S.; Rodriguez-García, G.; Reid, W.D.; Viscor, G.; Araneda, O.F.; Gabrielli, L.; Contreras-Briceño, F. Sex-differences in the oxygenation levels of intercostal and vastus lateralis muscles during incremental exercise. Front. Physiol. 2021, 12, 738063. [Google Scholar] [CrossRef]
- Moalla, W.; Dupont, G.; Berthoin, S.; Ahmaidi, S. Respiratory muscle deoxygenation and ventilatory threshold assessments using near infrared spectroscopy in children. Int. J. Sports Med. 2005, 26, 576–582. [Google Scholar] [CrossRef] [PubMed]
- Rodrigo-Carranza, V.; González-Mohíno, F.; Turner, A.P.; Rodriguez-Barbero, S.; González-Ravé, J.M. Using a portable Near-infrared Spectroscopy device to estimate the second ventilatory threshold. Int. J. Sports Med. 2021, 42, 905–910. [Google Scholar] [CrossRef]
- American Thoracic Society. ATS/ERS Statement on respiratory muscle testing. Am. J. Respir. Crit. Care Med. 2002, 166, 518–624. [Google Scholar] [CrossRef]
- Knudson, R.J.; Slatin, R.C.; Lebowitz, M.D.; Burrows, B. The maximal expiratory flow volume curve. Normal standards, variability, and effects of age. Am. Rev. Respir. Dis. 1976, 113, 587–600. [Google Scholar] [CrossRef]
- Day, J.R.; Rossiter, H.B.; Coats, E.M.; Skasick, A.; Whipp, B.J. The maximally attainable O2 during exercise in humans: The peak vs. maximum issue. J. Appl. Physiol. 2003, 95, 1901–1907. [Google Scholar] [CrossRef] [Green Version]
- Austin, K.G.; Daigle, K.A.; Patterson, P.; Cowman, J.; Chelland, S.; Haymes, E.M. Reliability of near-infrared spectroscopy for determining muscle oxygen saturation during exercise. Res. Q. Exerc. Sport 2005, 76, 440–449. [Google Scholar] [CrossRef]
- McManus, C.J.; Collison, J.; Cooper, C.E. Performance comparison of the MOXY and PortaMon Near-Infrared Spectroscopy muscle oximeters at rest and during exercise. J. Biomed. Opt. 2018, 23, 1. [Google Scholar] [CrossRef]
- Feldmann, A.; Schmitz, R.; Erlacher, D. Near-Infrared Spectroscopy-derived muscle oxygen saturation on a 0% to 100% scale: Reliability and validity of the Moxy Monitor. J. Biomed. Opt. 2019, 24, 1. [Google Scholar] [CrossRef] [PubMed]
- Vainshelboim, B.; Rao, S.; Chan, K.; Lima, R.M.; Ashley, E.A.; Myers, J. Comparaison des méthodes de détermination des seuils ventilatoires: Implications pour la stratification du risque chirurgical. Can. J. Anesth. 2017, 64, 634–642. [Google Scholar] [CrossRef] [PubMed] [Green Version]
- Muggeo, V.M.R. Estimating regression models with unknown break-points. Stat. Med. 2003, 22, 3055–3071. [Google Scholar] [CrossRef] [PubMed]
- Legrand, R.; Marles, A.; Prieur, F.; Lazzari, S.; Blondel, N.; Mucci, P. Related trends in locomotor and respiratory muscle oxygenation during exercise. Med. Sci. Sports Exerc. 2007, 39, 91–100. [Google Scholar] [CrossRef]
- Bhambhani, Y.; Buckley, S.; Susaki, T. Muscle oxygenation trends during constant work rate cycle exercise in men and women. Med. Sci. Sports Exerc. 1999, 31, 90–98. [Google Scholar] [CrossRef]
- Bhambhani, Y.N. Muscle oxygenation trends during dynamic exercise measured by near infrared spectroscopy. Can. J. Appl. Physiol. 2004, 29, 504–523. [Google Scholar] [CrossRef]
- Katayama, K.; Yoshitake, Y.; Watanabe, K.; Akima, H.; Ishida, K. Muscle deoxygenation during sustained and intermittent isometric exercise in hypoxia. Med. Sci. Sports Exerc. 2010, 42, 1269–1278. [Google Scholar] [CrossRef]
- Yoshiko, A.; Katayama, K.; Ishida, K.; Ando, R.; Koike, T.; Oshida, Y.; Akima, H. Muscle deoxygenation and neuromuscular activation in synergistic muscles during intermittent exercise under hypoxic conditions. Sci. Rep. 2020, 10, 295. [Google Scholar] [CrossRef]
- Van Beekvelt, M.C.P.; Borghuis, M.S.; Van Engelen, B.G.M.; Wevers, R.A.; Colier, W.N.J.M. Adipose tissue thickness affects in vivo quantitative near-IR spectroscopy in human skeletal muscle. Clin. Sci. 2001, 101, 21–28. [Google Scholar] [CrossRef]
- Craig, J.C.; Broxterman, R.M.; Wilcox, S.L.; Chen, C.; Barstow, T.J. Effect of adipose tissue thickness, muscle site, and sex on near-infrared spectroscopy derived total-[hemoglobin-myoglobin]. J. Appl. Physiol. 2017, 123, 1571–1578. [Google Scholar] [CrossRef]
- Farzam, P.; Starkweather, Z.; Franceschini, M.A. Validation of a novel wearable, wireless technology to estimate oxygen levels and lactate threshold power in the exercising muscle. Physiol. Rep. 2018, 6, e13664. [Google Scholar] [CrossRef] [PubMed] [Green Version]
- Barstow, T.J. Understanding near infrared spectroscopy and its application to skeletal muscle research. J. Appl. Physiol. 2019, 126, 1360–1376. [Google Scholar] [CrossRef]
- Wasserman, K. The anaerobic threshold: Definition, physiological significance and identification. Adv. Cardiol. 1986, 35, 1–23. [Google Scholar] [CrossRef] [PubMed]
- Schneider, D.A.; Phillips, S.E.; Stoffolano, S. The simplified V-slope method of detecting the gas exchange threshold. Med. Sci. Sports Exerc. 1993, 25, 1180–1184. [Google Scholar] [CrossRef] [PubMed]
- Beaver, W.L.; Wasserman, K.; Whipp, B.J. A new method for detecting anaerobic threshold by gas exchange. J. Appl. Physiol. 1986, 60, 2020–2027. [Google Scholar] [CrossRef]
- Cottin, F.; Médigue, C.; Lopes, P.; Leprêtre, P.M.; Heubert, R.; Billat, V. Ventilatory thresholds assessment from heart rate variability during an incremental exhaustive running test. Int. J. Sports Med. 2007, 28, 287–294. [Google Scholar] [CrossRef] [PubMed]
- Cottin, F.; Leprêtre, P.M.; Lopes, P.; Papelier, Y.; Médigue, C.; Billat, V. Assessment of ventilatory thresholds from heart rate variability in well-trained subjects during cycling. Int. J. Sports Med. 2006, 27, 959–967. [Google Scholar] [CrossRef]
- Ramos-Campo, D.J.; Rubio-Arias, J.A.; Ávila-Gandía, V.; Marín-Pagán, C.; Luque, A.; Alcaraz, P.E. Heart rate variability to assess ventilatory thresholds in professional basketball players. J. Sport Health Sci. 2017, 6, 468–473. [Google Scholar] [CrossRef] [Green Version]
- Mourot, L.; Fabre, N.; Savoldelli, A.; Schena, F. Second ventilatory threshold from heart-rate variability: Valid when the upper body is involved? Int. J. Sports Physiol. Perform. 2014, 9, 695–701. [Google Scholar] [CrossRef]
- Stergiopoulos, D.C.; Kounalakis, S.N.; Miliotis, P.G.; Geladas, N.D. Second ventilatory threshold assessed by heart rate variability in a multiple shuttle run test. Int. J. Sports Med. 2021, 42, 48–55. [Google Scholar] [CrossRef]
- Wasserman, K.; Beaver, W.L.; Whipp, B.J. Gas exchange theory and the lactic acidosis (anaerobic) threshold. Circulation 1990, 81 (Suppl. 1), II14–II30. [Google Scholar] [PubMed]
- Mortola, J.P. How to breathe? Respiratory mechanics and breathing pattern. Respir. Physiol. Neurobiol. 2019, 261, 48–54. [Google Scholar] [CrossRef] [PubMed]
- Vella, C.A.; Marks, D.; Robergs, R.A. Oxygen cost of ventilation during incremental exercise to VO2 max. Respirology 2006, 11, 175–181. [Google Scholar] [CrossRef] [PubMed] [Green Version]
- Coast, J.R.; Rasmussen, S.A.; Krause, K.M.; O’Kroy, J.A.; Loy, R.A.; Rhodes, J. Ventilatory work and oxygen consumption during exercise and hyperventilation. J. Appl. Physiol. 1993, 74, 793–798. [Google Scholar] [CrossRef]
- Aaron, E.A.; Johnson, B.D.; Seow, C.K.; Dempsey, J.A. Oxygen cost of exercise hyperpnea: Measurement. J. Appl. Physiol. 1992, 72, 1810–1817. [Google Scholar] [CrossRef]
- Evison, H.; Cherniack, R.M. Ventilatory cost of exercise in chronic obstructive pulmonary disease. J. Appl. Physiol. 1968, 25, 21–27. [Google Scholar] [CrossRef]
- Katsardis, C.V.; Desmond, K.J.; Coates, A.L. Measuring the oxygen cost of breathing in normal adults and patients with cystic fibrosis. Respir. Physiol. 1986, 65, 257–266. [Google Scholar] [CrossRef]
- Bell, S.C.; Saunders, M.J.; Elborn, J.S.; Shale, D.J. Resting energy expenditure and oxygen cost of breathing in patients with cystic fibrosis. Thorax 1996, 51, 126–131. [Google Scholar] [CrossRef] [Green Version]
- Sheel, A.W.; Richards, J.C.; Foster, G.E.; Guenette, J.A. Sex differences in respiratory exercise physiology. Sports Med. 2004, 34, 567–579. [Google Scholar] [CrossRef]
- Harms, C.A. Breathing in exercise: Battle of the sexes. J. Physiol. 2015, 593, 1763. [Google Scholar] [CrossRef]
- Dominelli, P.B.; Render, J.N.; Molgat-Seon, Y.; Foster, G.E.; Romer, L.M.; Sheel, A.W. Oxygen cost of exercise hyperpnoea is greater in women compared with men. J. Physiol. 2015, 593, 1965–1979. [Google Scholar] [CrossRef] [PubMed] [Green Version]
- Kilbride, E.; McLoughlin, P.; Gallagher, C.G.; Harty, H.R. Do gender differences exist in the ventilatory response to progressive exercise in males and females of average fitness? Eur. J. Appl. Physiol. 2003, 89, 595–602. [Google Scholar] [CrossRef] [PubMed]
- Redman, L.M.; Scroop, G.C.; Norman, R.J. Impact of menstrual cycle phase on the exercise status of young, sedentary women. Eur. J. Appl. Physiol. 2003, 90, 505–513. [Google Scholar] [CrossRef] [PubMed]
- Hayashi, K.; Kawashima, T.; Suzuki, Y. Effect of menstrual cycle phase on the ventilatory response to rising body temperature during exercise. J. Appl. Physiol. 2012, 113, 237–245. [Google Scholar] [CrossRef] [PubMed] [Green Version]
- Oxfeldt, M.; Dalgaard, L.B.; Jørgensen, A.A.; Hansen, M. Hormonal contraceptive use, menstrual dysfunctions, and self-reported side effects in elite athletes in Denmark. Int. J. Sports Physiol. Perform. 2020, 15, 1377–1384. [Google Scholar] [CrossRef] [PubMed]
- Heather, A.K.; Thorpe, H.; Ogilvie, M.; Sims, S.T.; Beable, S.; Milsom, S.; Schofield, K.L.; Coleman, L.; Hamilton, B. Biological and socio-cultural factors have the potential to influence the health and performance of elite female athletes: A cross sectional survey of 219 elite female athletes in Aotearoa New Zealand. Front. Sports Act. Living 2021, 3, 601420. [Google Scholar] [CrossRef]


| Variables | Mean ± Standard Deviation |
|---|---|
| sex (n) | male = 8; female = 7 |
| years | 29.2 ± 6.5 |
| height (cm) | 167.6 ± 25.6 |
| weight (kg) | 69.2 ± 9.4 |
| BMI | 22.6 ± 1.8 |
| Triathlon experience (year) | 8.2 ± 2.3 |
| Training volume (hours·week−1) | 18.0±2.3 |
| FEV1 (L) | 4.28 ± 0.78 |
| FEV1 (% predicted) | 94.0 ± 1.2 |
| FVC (L) | 5.03 ± 1.03 |
| FVC (% predicted) | 111.9 ± 2.5 |
| FEV1 ·FVC−1 (%) | 85.0 ± 7.5 |
| load-máx. (watts) | 318.8 ± 41.0 |
| O2-máx. (mL·kg−1·min−1) | 58.4 ± 8.1 |
| E-máx. (L·min−1) | 168.4 ± 29.3 |
| HR-máx. (bpm) | 184.2 ± 8.6 |
| %HR-máx. (220-age) | 96.0 ± 1.8 |
| RPE | 9.8 ± 0.4 |
Publisher’s Note: MDPI stays neutral with regard to jurisdictional claims in published maps and institutional affiliations. |
© 2022 by the authors. Licensee MDPI, Basel, Switzerland. This article is an open access article distributed under the terms and conditions of the Creative Commons Attribution (CC BY) license (https://creativecommons.org/licenses/by/4.0/).
Share and Cite
Contreras-Briceño, F.; Espinosa-Ramirez, M.; Keim-Bagnara, V.; Carreño-Román, M.; Rodríguez-Villagra, R.; Villegas-Belmar, F.; Viscor, G.; Gabrielli, L.; Andía, M.E.; Araneda, O.F.; et al. Determination of the Respiratory Compensation Point by Detecting Changes in Intercostal Muscles Oxygenation by Using Near-Infrared Spectroscopy. Life 2022, 12, 444. https://doi.org/10.3390/life12030444
Contreras-Briceño F, Espinosa-Ramirez M, Keim-Bagnara V, Carreño-Román M, Rodríguez-Villagra R, Villegas-Belmar F, Viscor G, Gabrielli L, Andía ME, Araneda OF, et al. Determination of the Respiratory Compensation Point by Detecting Changes in Intercostal Muscles Oxygenation by Using Near-Infrared Spectroscopy. Life. 2022; 12(3):444. https://doi.org/10.3390/life12030444
Chicago/Turabian StyleContreras-Briceño, Felipe, Maximiliano Espinosa-Ramirez, Vicente Keim-Bagnara, Matías Carreño-Román, Rafael Rodríguez-Villagra, Fernanda Villegas-Belmar, Ginés Viscor, Luigi Gabrielli, Marcelo E. Andía, Oscar F. Araneda, and et al. 2022. "Determination of the Respiratory Compensation Point by Detecting Changes in Intercostal Muscles Oxygenation by Using Near-Infrared Spectroscopy" Life 12, no. 3: 444. https://doi.org/10.3390/life12030444