
Dosimetric Comparison of Ultra-Hypofractionated and Conventionally Fractionated Radiation Therapy Boosts for Patients with High-Risk Prostate Cancer

 , and
, and
Abstract
:1. Introduction
2. Materials and Methods
2.1. Patient Data
2.2. Treatment Planning and Dose Delivery
2.3. Data Comparison and Statistical Analysis
- (a)
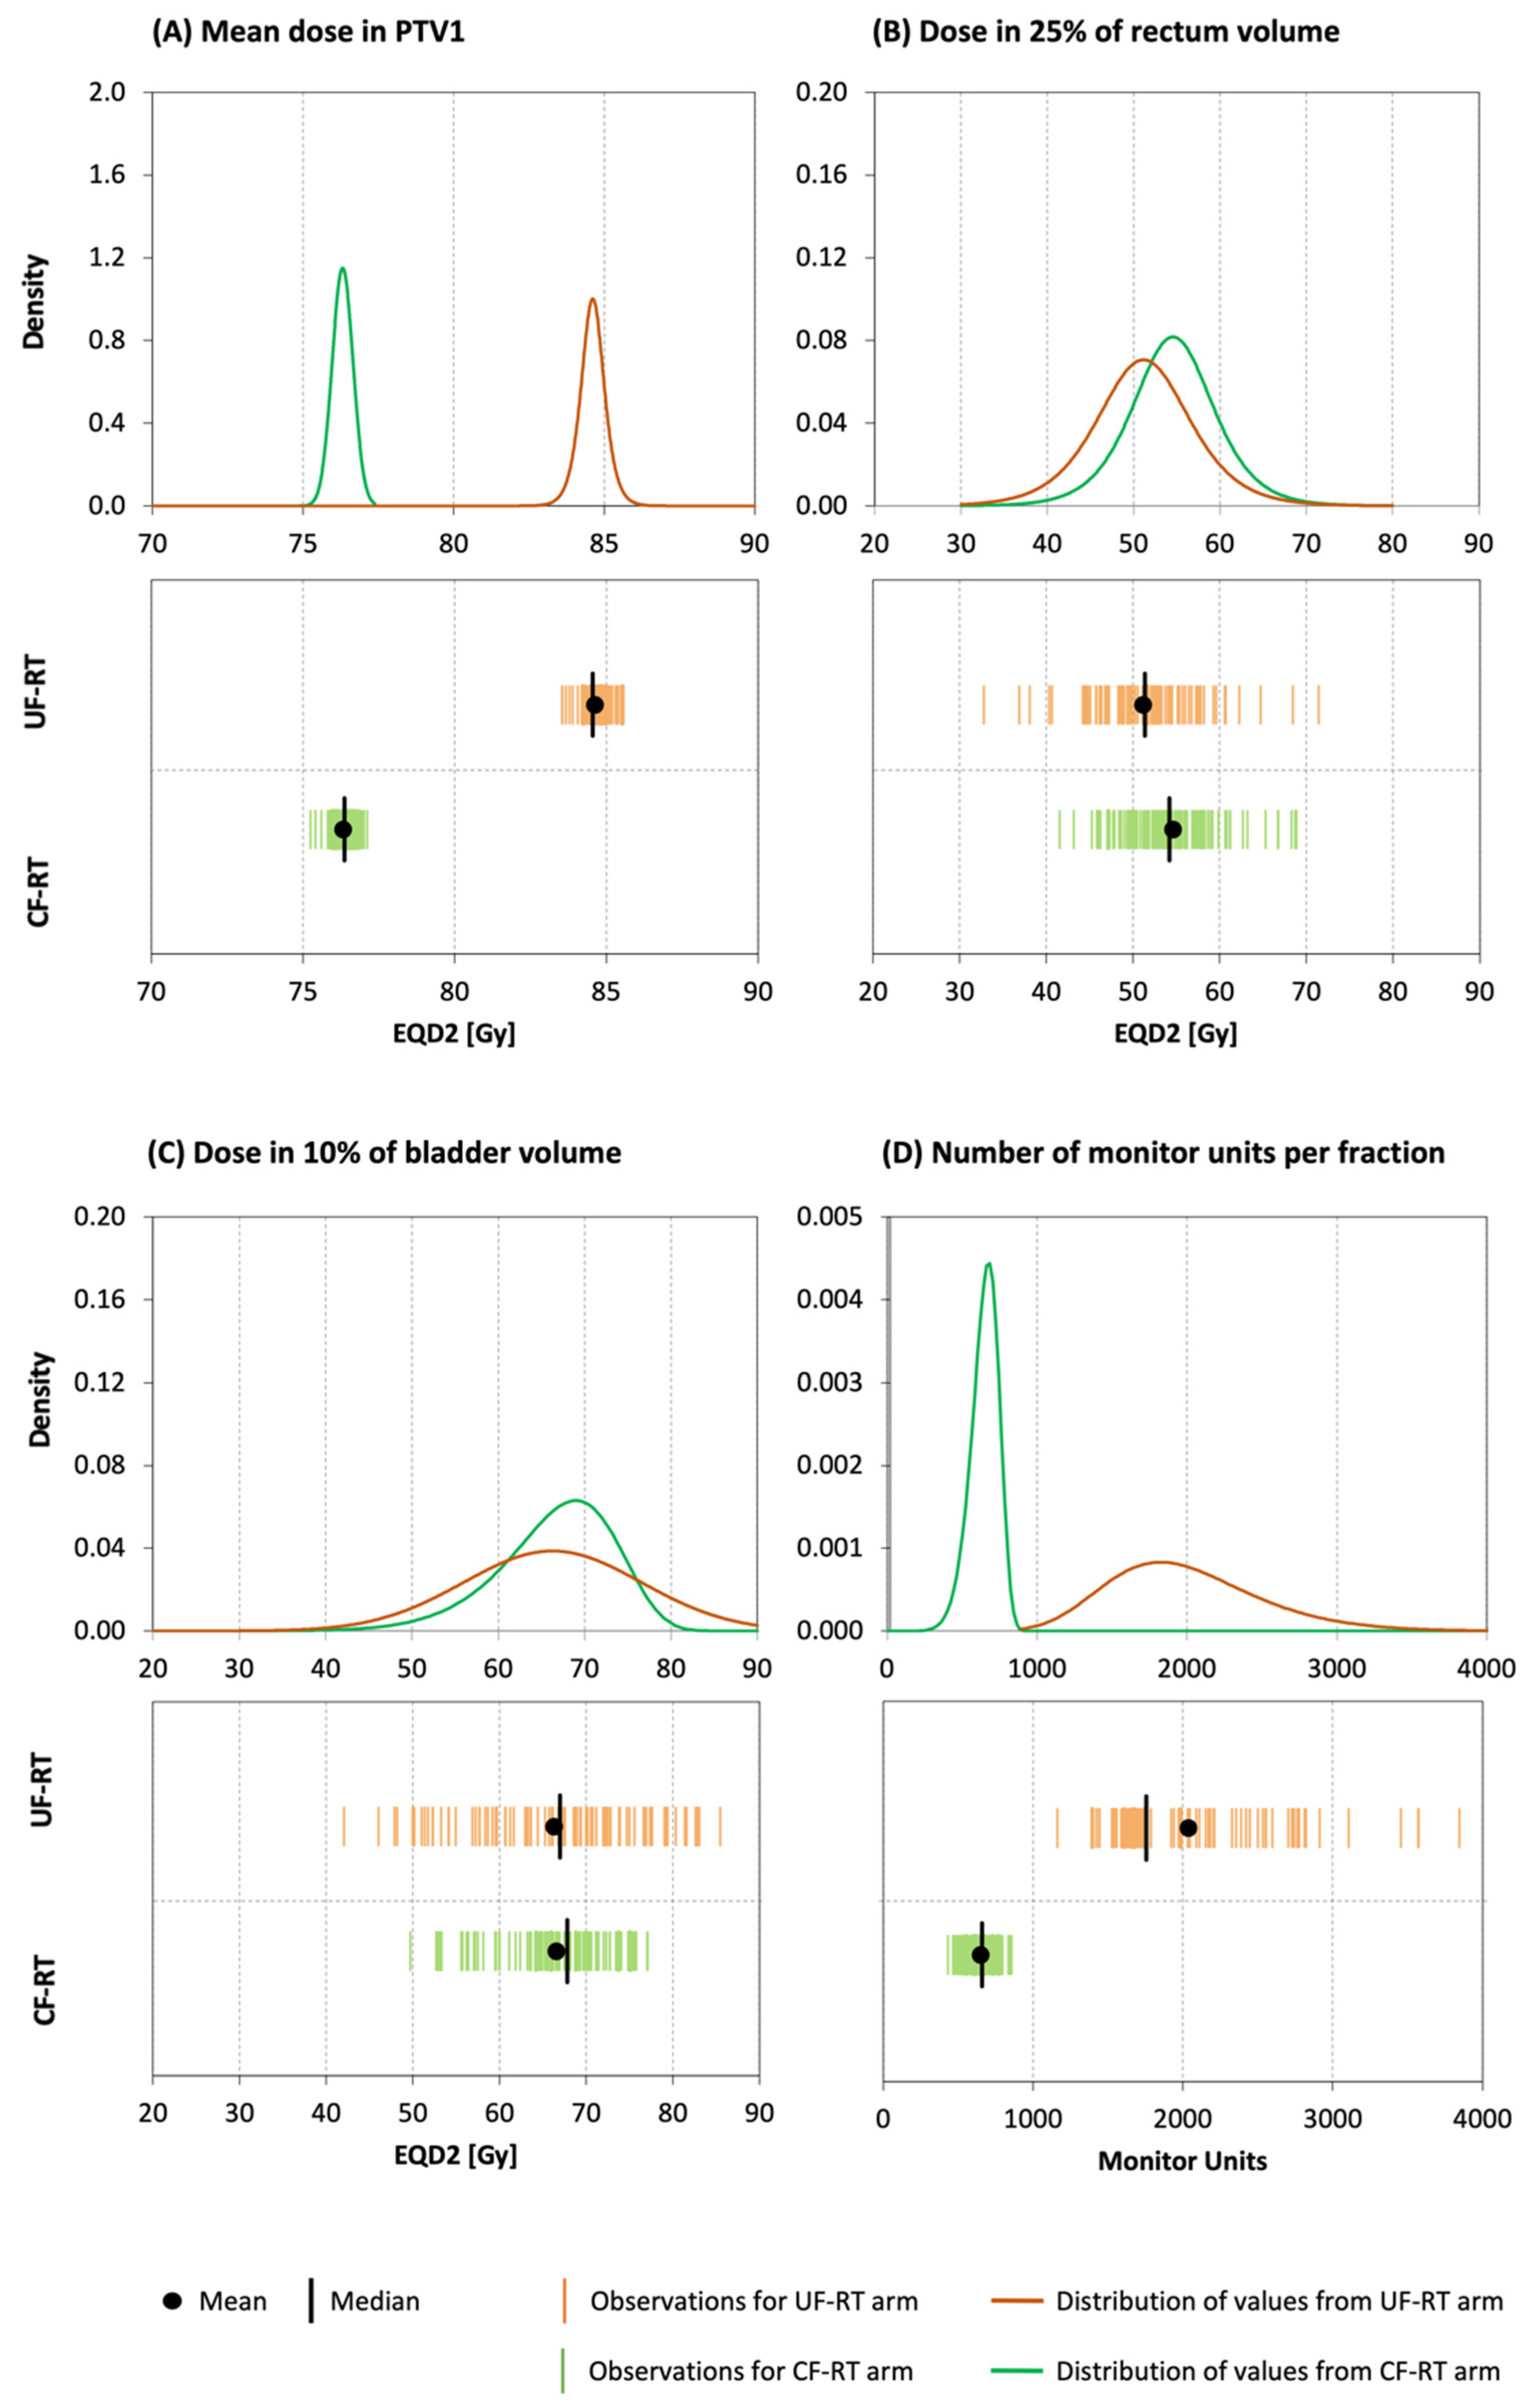
- Dose metrics
- ⇒
- The mean EQD2 [Gy] and the EQD2 related to 2% (D2 [Gy]) and 95% (D95 [Gy]) of the PTV1 (the prostate and the basal volume of seminal vesicles);
- ⇒
- The EQD2 related to 5% (D5 [Gy]), 25% (D25 [Gy]), 30% (D30 [Gy]), and 40% (D40 [Gy]) of the rectum volume;
- ⇒
- The EQD2 related to 10% (D10 [Gy]), 25% (D25 [Gy]), 30% (D30 [Gy]), and 40% (D40 [Gy]) of the bladder volume;
- ⇒
- The EQD2 related to 10% (D10 [Gy]) of the volumes of femoral heads and the bowels.
- (b)
- Complexity of the plans
- ⇒
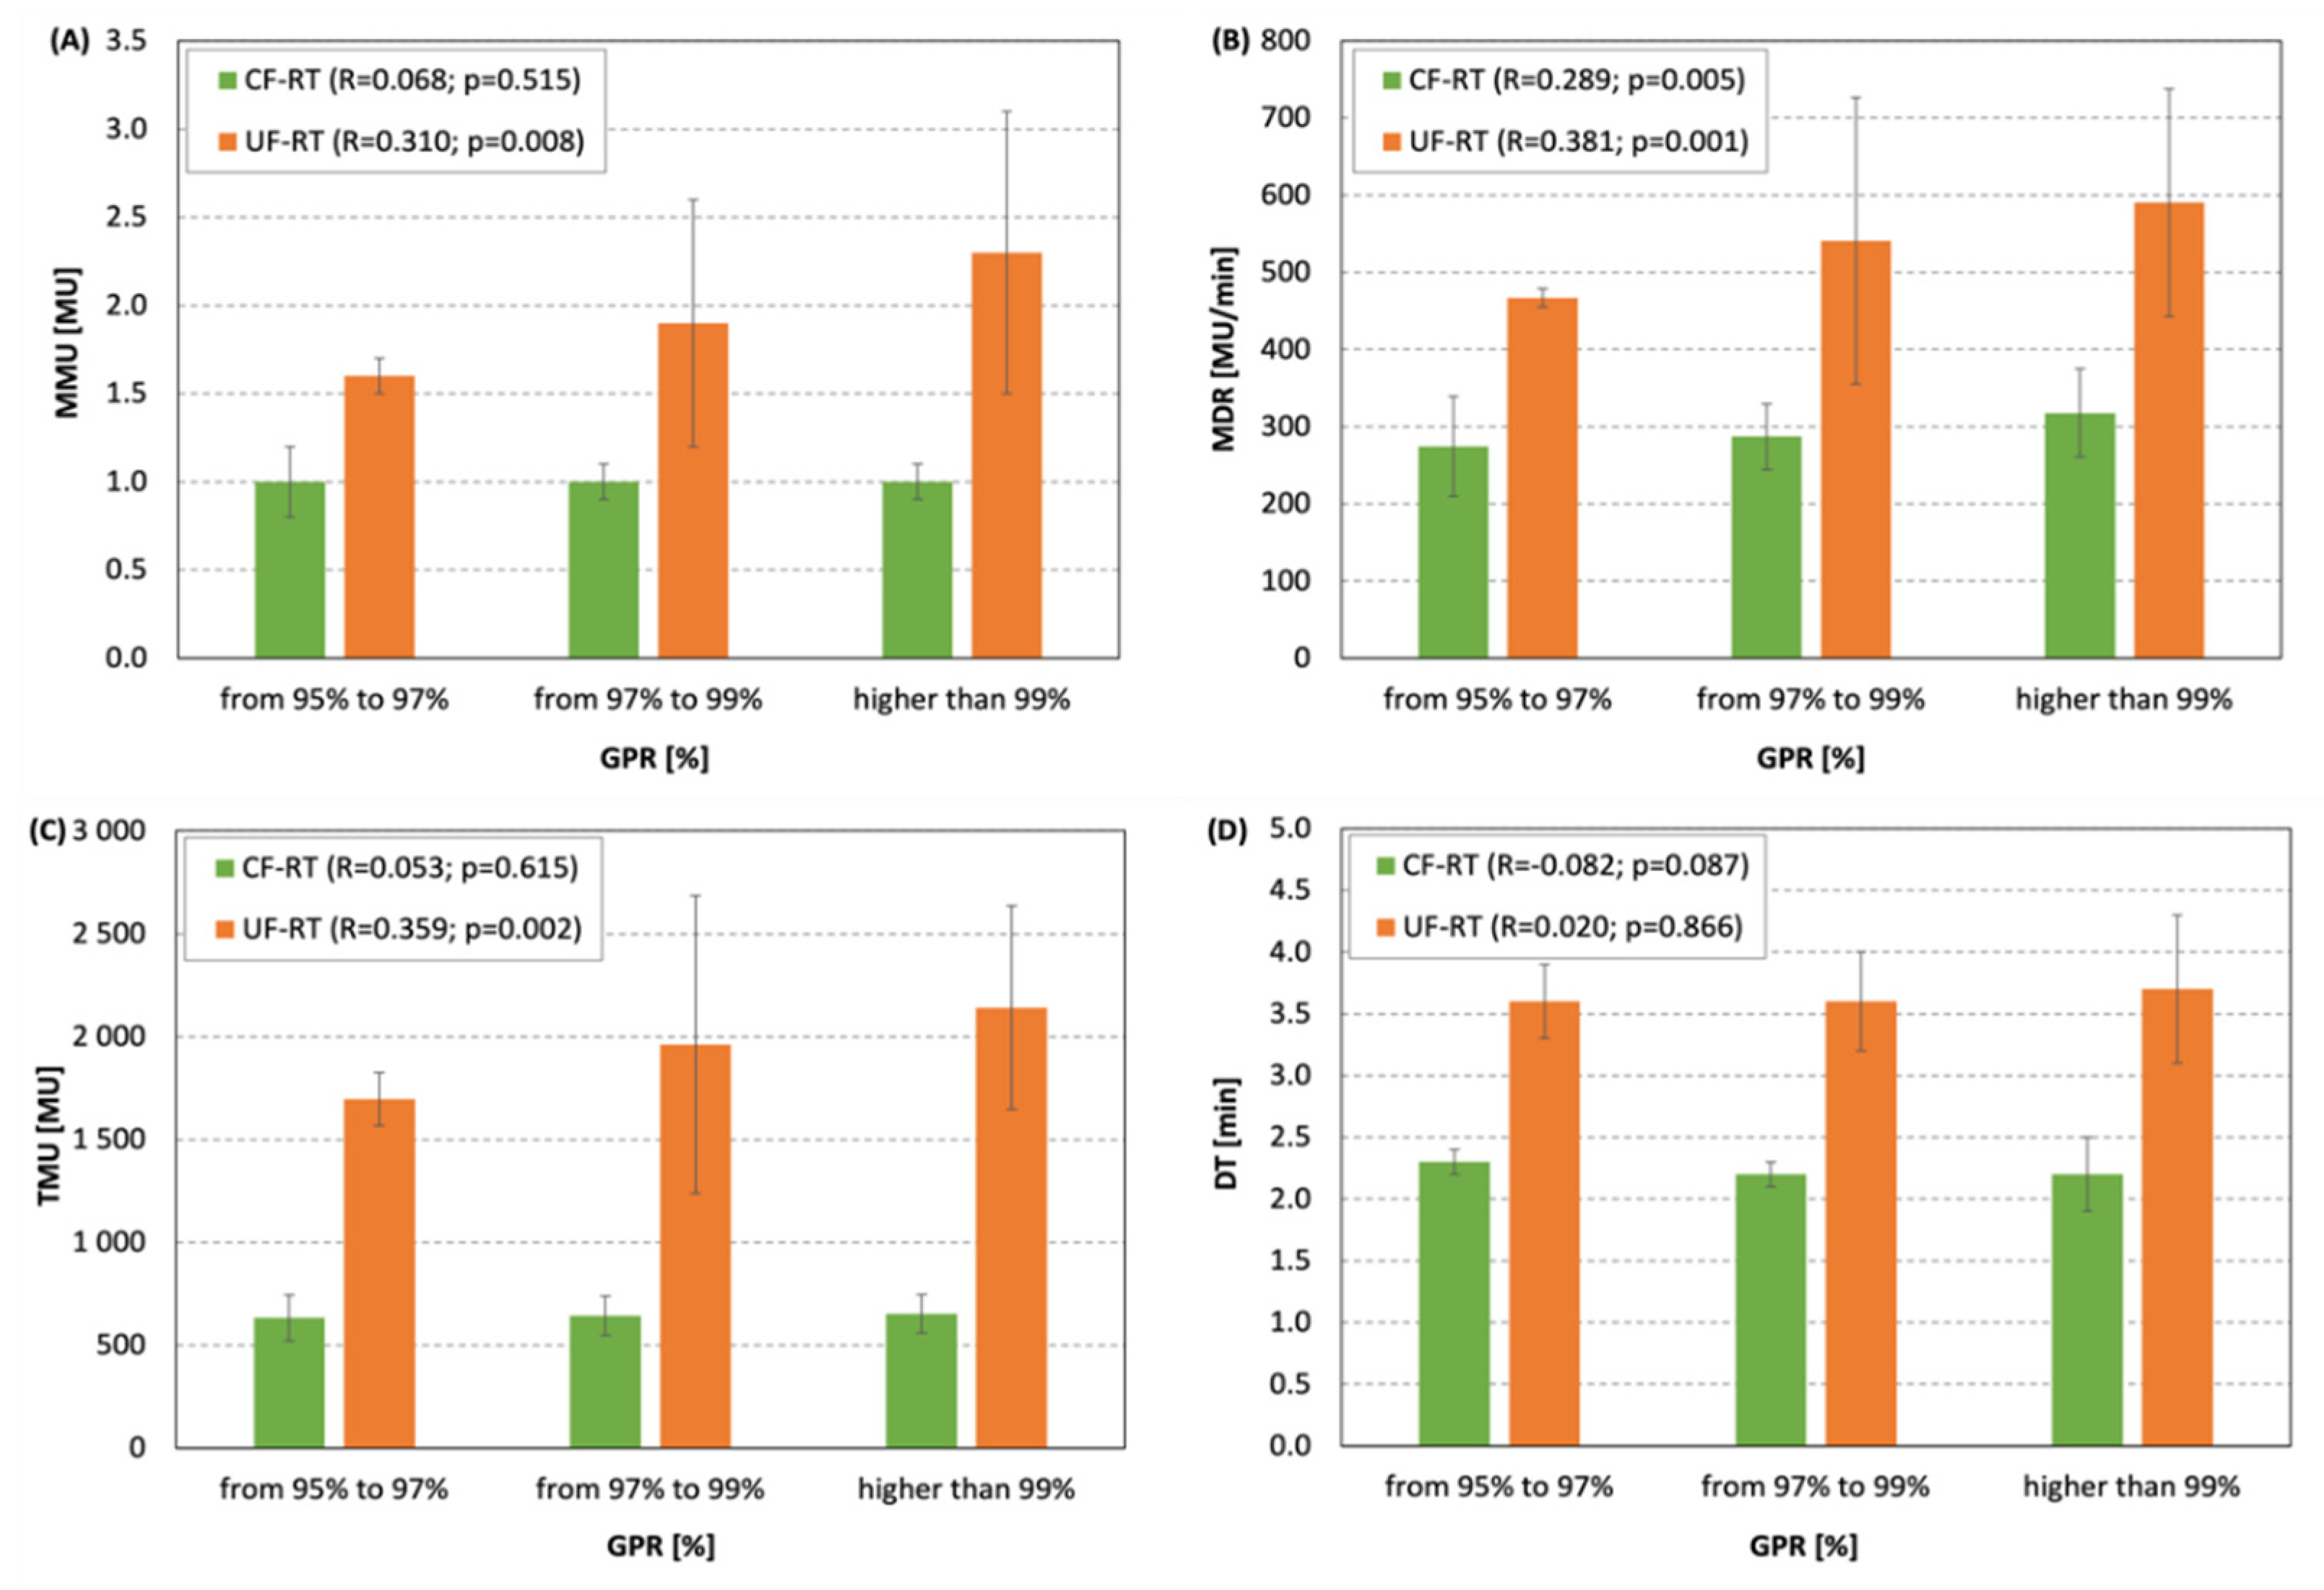
- The mean number of monitor units per control point (MMU [MU]);
- ⇒
- The mean dose rate per control point (MDR [MU/min]);
- ⇒
- Total monitor units per fraction [MU];
- ⇒
- Delivery time per fraction [min].
- (c)
- Agreement between planned and delivered doses
- ⇒
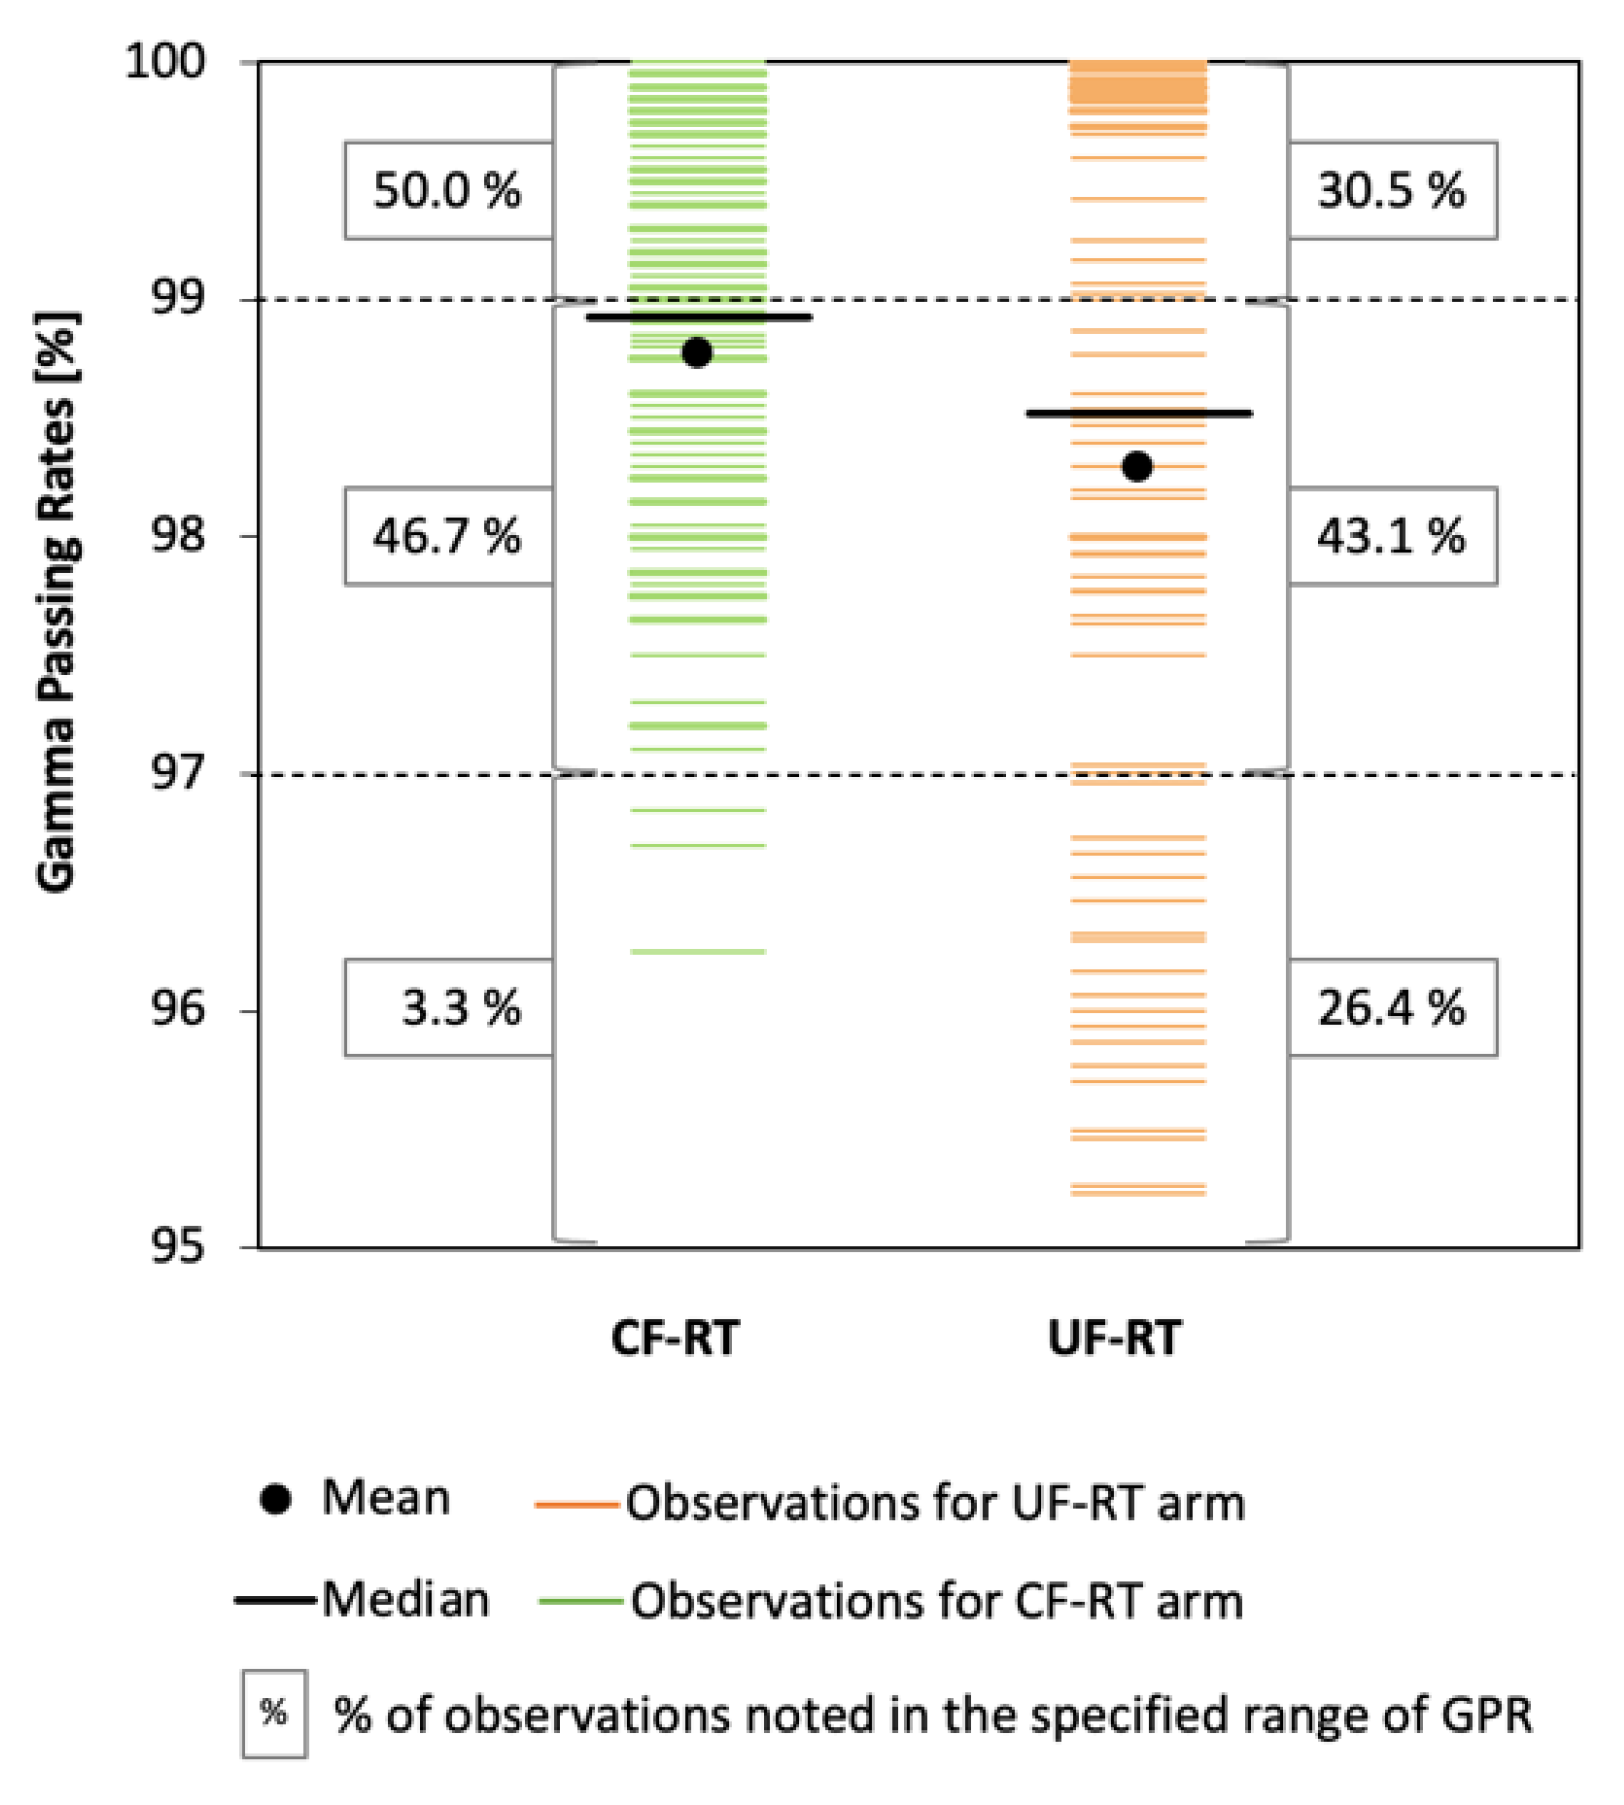
- The score of gamma passing rate in percent (GPR [%]) obtained from gamma analysis performed in a global mode, using a 3%/3 mm γ-index criteria and a 10% threshold.
3. Results
4. Discussion
5. Conclusions
Author Contributions
Funding
Institutional Review Board Statement
Informed Consent Statement
Data Availability Statement
Acknowledgments
Conflicts of Interest
References
- Koontz, B.F.; Hope, T.A. More Answers and More Questions About Radiotherapy for Metastatic Prostate Cancer. JAMA Oncol. 2021, 7, 563. [Google Scholar] [CrossRef]
- Wang, W.; Li, P.; Sheng, Y.; Huang, Z.; Zhao, J.; Hong, Z.; Shahnazi, K.; Jiang, G.-L.; Zhang, Q. Conversion and validation of rectal constraints for prostate carcinoma receiving hypofractionated carbon-ion radiotherapy with a local effect model. Radiat. Oncol. 2021, 16, 72. [Google Scholar] [CrossRef]
- Foerster, R.; Zwahlen, D.; Buchali, A.; Tang, H.; Schroeder, C.; Windisch, P.; Vu, E.; Akbaba, S.; Bostel, T.; Sprave, T.; et al. Stereotactic Body Radiotherapy for High-Risk Prostate Cancer: A Systematic Review. Cancers 2021, 13, 759. [Google Scholar] [CrossRef]
- Litwin, M.S.; Tan, H.-J. The diagnosis and treatment of prostate cancer: A review. JAMA 2017, 317, 2532–2542. [Google Scholar] [CrossRef]
- Maggi, M.; Gentilucci, A.; Salciccia, S.; Gatto, A.; Gentile, V.; Colarieti, A.; Von Heland, M.; Busetto, G.M.; Del Giudice, F.; Sciarra, A. Psychological impact of different primary treatments for prostate cancer: A critical analysis. Andrologia 2019, 51, e13157. [Google Scholar] [CrossRef]
- Muralidhar, V.; Nguyen, P.L. Maximizing resources in the local treatment of prostate cancer: A summary of cost-effectiveness studies. Urol. Oncol. Semin. Orig. Investig. 2017, 35, 76–85. [Google Scholar] [CrossRef] [PubMed]
- Catton, C.N.; Lukka, H.; Gu, C.-S.; Martin, J.M.; Supiot, S.; Chung, P.W.M.; Bauman, G.S.; Bahary, J.-P.; Ahmed, S.; Cheung, P.; et al. Randomized trial of a hypofractionated radiation regimen for the treatment of localized prostate cancer. J. Clin. Oncol. 2017, 35, 1884–1890. [Google Scholar] [CrossRef] [PubMed]
- Mendez, L.C.; Arifin, A.J.; Bauman, G.S.; Velker, V.M.; Ahmad, B.; Lock, M.; Venkatesan, V.M.; Sexton, T.L.; Rodrigues, G.B.; Chen, J.; et al. Is hypofractionated whole pelvis radiotherapy (WPRT) as well tolerated as conventionally fractionated WPRT in prostate cancer patients? The HOPE trial. BMC Cancer 2020, 20, 978. [Google Scholar] [CrossRef] [PubMed]
- Widmark, A.; Gunnlaugsson, A.; Beckman, L.; Thellenberg-Karlsson, C.; Hoyer, M.; Lagerlund, M.; Kindblom, J.; Ginman, C.; Johansson, B.; Björnlinger, K.; et al. Ultra-hypofractionated versus conventionally fractionated radiotherapy for prostate cancer: 5-year outcomes of the HYPO-RT-PC randomised, non-inferiority, phase 3 trial. Lancet 2019, 394, 385–395. [Google Scholar] [CrossRef]
- Tenti, M.V.; Ingrosso, G.; Bini, V.; Mariucci, C.; Saldi, S.; Alì, E.; Zucchetti, C.; Bellavita, R.; Aristei, C. Tomotherapy-based moderate hypofractionation for localized prostate cancer: A mono-institutional analysis. Rep. Pract. Oncol. Radiother. 2022, in press. [CrossRef]
- Morgan, S.; Hoffman, K.; Loblaw, D.A.; Buyyounouski, M.K.; Patton, C.; Barocas, D.; Bentzen, S.M.; Chang, M.; Efstathiou, J.; Greany, P.; et al. Hypofractionated Radiation Therapy for Localized Prostate Cancer: An ASTRO, ASCO, and AUA Evidence-Based Guideline. J. Clin. Oncol. 2018, 36, 3411–3430. [Google Scholar] [CrossRef]
- Milecki, P.; Antczak, A.; Milecki, T.; Gluszak, P.; Piotrowski, T.; Rucinska, A.; Malicki, J. Ultra-hypofractionated versus Conventionally Fractionated Radiation Therapy Boost for Patients with High-Risk, Localized Prostate Cancer: A 5-Year Results from Randomized HYPO-PROST Trial. Int. J. Radiat. Oncol. Biol. Phys. 2020, 108, S62–S63. [Google Scholar] [CrossRef]
- Yartsev, S.; Mackie, T.R. Comment on: “When is better best? A multiobjective perspective” [Med. Phys. 38, 1635-1640 (2011)]. Med. Phys. 2013, 40, 077101. [Google Scholar] [CrossRef] [PubMed]
- Harris, V.A.; Staffurth, J.; Naismith, O.; Esmail, A.; Gulliford, S.; Khoo, V.; Lewis, R.; Littler, J.; McNair, H.; Sadoyze, A.; et al. Consensus Guidelines and Contouring Atlas for Pelvic Node Delineation in Prostate and Pelvic Node Intensity Modulated Radiation Therapy. Int. J. Radiat. Oncol. Biol. Phys. 2015, 92, 874–883. [Google Scholar] [CrossRef] [PubMed]
- Voyant, C.; Julian, D.; Roustit, R.; Biffi, K.; Lantieri, C. Biological effects and equivalent doses in radiotherapy: A software solution. Rep. Pract. Oncol. Radiother. 2014, 19, 47–55. [Google Scholar] [CrossRef] [Green Version]
- Hernández, T.G.; González, A.V.; Peidro, J.P.; Ferrando, J.V.R.; González, L.B.; Cabañero, D.G.; Torrecilla, J.L. Radiobiological comparison of two radiotherapy treatment techniques for high-risk prostate cancer. Rep. Pract. Oncol. Radiother. 2013, 18, 265–271. [Google Scholar] [CrossRef] [Green Version]
- Miralbell, R.; Roberts, S.; Zubizarreta, E.; Hendry, J.H. Dose-fractionation sensitivity of prostate cancer deduced from radiotherapy outcomes of 5,969 patients in seven international institutional datasets: α/β = 1.4 (0.9 − 2.2) Gy. Int. J. Radiat. Oncol. Biol. Phys. 2012, 82, e17–e24. [Google Scholar] [CrossRef]
- International Commission on Radiation Units and Measurements. ICRU report 83: Prescribing, recording, and reporting photon beam intensity-modulated radiation therapy (IMRT). J. ICRU 2010, 10, 1. [Google Scholar] [CrossRef]
- Garibaldi, C.; Essers, M.; Heijmen, B.; Bertholet, J.; Koutsouveli, E.; Maas, A.J.; Moore, M.; Petrovic, B.; Koniarova, I.; Lisbona, A.; et al. Towards an updated ESTRO-EFOMP core curriculum for education and training of medical physics experts in radiotherapy—A survey of current education and training practice in Europe. Phys. Med. 2021, 84, 65–71. [Google Scholar] [CrossRef]
- Giacometti, V.; Hounsell, A.R.; McGarry, C.K. A review of dose calculation approaches with cone beam CT in photon and proton therapy. Phys. Med. 2020, 76, 243–276. [Google Scholar] [CrossRef]
- Irmak, S.; Georg, D.; Lechner, W. Comparison of CBCT conversion methods for dose calculation in the head and neck region. Zeitschrift für Medizinische Physik 2020, 30, 289–299. [Google Scholar] [CrossRef]
- Czajkowski, P.; Piotrowski, T. Evaluation of the accuracy of dose delivery in stereotactic radiotherapy using the Velocity commercial software. Phys. Med. 2022, 95, 133–139. [Google Scholar] [CrossRef] [PubMed]
- Eaton, D.J. Why all radiotherapy planning studies are wrong but some are useful. Med. Dosim. 2021, 46, 209–211. [Google Scholar] [CrossRef] [PubMed]
- Hernandez, V.; Hansen, C.R.; Widesott, L.; Bäck, A.; Canters, R.; Fusella, M.; Götstedt, J.; Jurado-Bruggeman, D.; Mukumoto, N.; Kaplan, L.P.; et al. What is plan quality in radiotherapy? The importance of evaluating dose metrics, complexity, and robustness of treatment plans. Radiother. Oncol. 2020, 153, 26–33. [Google Scholar] [CrossRef] [PubMed]
- Jodda, A.; Piotrowski, T.; Kruszyna-Mochalska, M.; Malicki, J. Impact of different optimization strategies on the compatibility between planned and delivered doses during radiation therapy of cervical cancer. Rep. Pract. Oncol. Radiother. 2020, 25, 412–421. [Google Scholar] [CrossRef]
- Weg, E.S.; Pei, X.; Kollmeier, M.A.; McBride, S.M.; Zelefsky, M.J. Dose-escalated intensity modulated radiation therapy for prostate cancer: 15-year outcomes data. Adv. Radiat. Oncol. 2019, 4, 492–499. [Google Scholar] [CrossRef] [Green Version]


| CF-RT | UF-RT | |||
|---|---|---|---|---|
| Number of patients | 93 | 86 | ||
| Phase of irradiation | 1 | 2 | 1 | 2 |
| Treatment volume | PTV2 (PG + SV + LN) | PTV1 (PG + SVbase) | PTV2 (PG + SV + LN) | PTV1 (PG + SVbase) |
| Physical Dose [Gy] | 46 | 30 | 46 | 15 |
| Number of fractions | 23 | 15 | 23 | 2 |
| EQD2 [Gy] in PTV1 | 76 | 84 | ||
| Fractionation scheme | 5 fractions per week, i.e., one fraction per day with gap on Saturday and Sunday | 2 fractions received within ten days | ||
| Technique, source, and energy | VMAT X 6 MeV | |||
| Number of arcs per plan (% of patients) | 2 (100%) | 2 (7%) | ||
| 3 (83%) | ||||
| 4 (10%) | ||||
| Structure | % of Volume | ||||
|---|---|---|---|---|---|
| 5% | 10% | 25% | 30% | 40% | |
| Dose Constraints [Gy] | |||||
| Rectum | ≤75 | --- | ≤70 | ≤60 | ≤50 |
| Bladder | --- | ≤75 | ≤70 | ≤60 | ≤50 |
| Femoral heads | --- | ≤50 | --- | --- | --- |
| Bowels | --- | ≤40 | --- | --- | --- |
| Structure | Parameter | Scheme | EQD2 [Gy] | Normality | HoV | SoM |
|---|---|---|---|---|---|---|
| Mean (SD) | Shapiro-Wilk Test | Fisher’s F-Test | t-Student (tS) or Mann-Whitney (MW) | |||
| PTV1 | D95 | CF-RT | 74.7 (0.4) | p = 0.988 | p < 0.001 | p < 0.001 (MW) |
| UF-RT | 80.7 (0.7) | p = 0.532 | ||||
| Mean Dose | CF-RT | 76.3 (0.3) | p = 0.092 | p = 0.064 | p < 0.001 (tS) | |
| UF-RT | 84.6 (0.5) | p = 0.098 | ||||
| D2 | CF-RT | 78.3 (0.4) | p = 0.976 | p = 0.090 | p < 0.001 (tS) | |
| UF-RT | 87.9 (0.5) | p = 0.147 | ||||
| Rectum | D5 | CF-RT | 72.4 (2.8) | p = 0.068 | p < 0.001 | p = 0.953 (MW) |
| UF-RT | 71.9 (6.6) | p = 0.170 | ||||
| D25 | CF-RT | 54.6 (5.5) | p = 0.148 | p = 0.177 | p < 0.001 (tS) | |
| UF-RT | 51.2 (6.4) | p = 0.134 | ||||
| D30 | CF-RT | 51.9 (5.3) | p = 0.375 | p = 0.108 | p < 0.001 (tS) | |
| UF-RT | 48.0 (6.3) | p = 0.066 | ||||
| D40 | CF-RT | 47.4 (5.3) | p = 0.364 | p = 0.603 | p < 0.001 (tS) | |
| UF-RT | 43.5 (5.0) | p = 0.072 | ||||
| Bladder | D10 | CF-RT | 66.6 (6.9) | p = 0.165 | p < 0.001 | p = 0.980 (MW) |
| UF-RT | 66.3 (9.3) | p = 0.220 | ||||
| D25 | CF-RT | 50.6 (8.6) | p = 0.153 | p = 0.691 | p = 0.633 (tS) | |
| UF-RT | 50.0 (8.9) | p = 0.085 | ||||
| D30 | CF-RT | 46.8 (8.3) | p = 0.325 | p = 0.582 | p = 0.540 (tS) | |
| UF-RT | 46.0 (8.8) | p = 0.266 | ||||
| D40 | CF-RT | 40.2 (7.8) | p = 0.512 | p = 0.594 | p = 0.501 (tS) | |
| UF-RT | 39.4 (8.2) | p = 0.295 | ||||
| Left FH | D10 | CF-RT | 38.9 (3.8) | p = 0.571 | p = 0.865 | p < 0.001 (tS) |
| UF-RT | 34.6 (3.7) | p = 0.257 | ||||
| Right FH | D10 | CF-RT | 38.5 (4.2) | p = 0.426 | p = 0.529 | p < 0.001 (tS) |
| UF-RT | 34.5 (3.9) | p = 0.616 | ||||
| Bowels | D10 | CF-RT | 36.9 (5.4) | p = 0.166 | p = 0.750 | p = 0.659 (tS) |
| UF-RT | 37.3 (5.3) | p = 0.054 |
| Parameter | Scheme | Mean (SD) | Normality | HoV | SoM |
|---|---|---|---|---|---|
| (Shapiro-Wilk Test) | (Fisher’s F-Test) | (Mann-Whitney Test) | |||
| Mean monitor units per control point [MU] | CF-RT | 1.0 (0.1) | p = 0.495 | p < 0.001 | p < 0.001 |
| UF-RT | 2.1 (0.7) | p < 0.001 | |||
| Mean dose rate per control point [MU/min] | CF-RT | 300.7 (52.6) | p = 0.222 | p < 0.001 | p < 0.001 |
| UF-RT | 570.6 (171.9) | p < 0.001 | |||
| Total monitor units per fraction [MU] | CF-RT | 647.3 (94.0) | p = 0.225 | p < 0.001 | p < 0.001 |
| UF-RT | 2034.3 (570.3) | p < 0.001 | |||
| Delivery time per fraction [min] | CF-RT | 2.2 (0.2) | p < 0.001 | p < 0.001 | p < 0.001 |
| UF-RT | 3.6 (0.5) | p = 0.002 | |||
| Gamma passing rate [%] | CF-RT | 98.8 (0.9) | p = 0.001 | p < 0.001 | p = 0.219 |
| UF-RT | 98.3 (1.5) | p < 0.001 |
Publisher’s Note: MDPI stays neutral with regard to jurisdictional claims in published maps and institutional affiliations. |
© 2022 by the authors. Licensee MDPI, Basel, Switzerland. This article is an open access article distributed under the terms and conditions of the Creative Commons Attribution (CC BY) license (https://creativecommons.org/licenses/by/4.0/).
Share and Cite
Piotrowski, T.; Yartsev, S.; Krawczyk, J.; Adamczyk, M.; Jodda, A.; Malicki, J.; Milecki, P. Dosimetric Comparison of Ultra-Hypofractionated and Conventionally Fractionated Radiation Therapy Boosts for Patients with High-Risk Prostate Cancer. Life 2022, 12, 394. https://doi.org/10.3390/life12030394
Piotrowski T, Yartsev S, Krawczyk J, Adamczyk M, Jodda A, Malicki J, Milecki P. Dosimetric Comparison of Ultra-Hypofractionated and Conventionally Fractionated Radiation Therapy Boosts for Patients with High-Risk Prostate Cancer. Life. 2022; 12(3):394. https://doi.org/10.3390/life12030394
Chicago/Turabian StylePiotrowski, Tomasz, Slav Yartsev, Jaroslaw Krawczyk, Marta Adamczyk, Agata Jodda, Julian Malicki, and Piotr Milecki. 2022. "Dosimetric Comparison of Ultra-Hypofractionated and Conventionally Fractionated Radiation Therapy Boosts for Patients with High-Risk Prostate Cancer" Life 12, no. 3: 394. https://doi.org/10.3390/life12030394