
Soluble ST2 as a Potential Biomarker for Risk Assessment of Pulmonary Hypertension in Patients Undergoing TAVR?

 , , ,
, , ,
Abstract
:1. Introduction
2. Methods
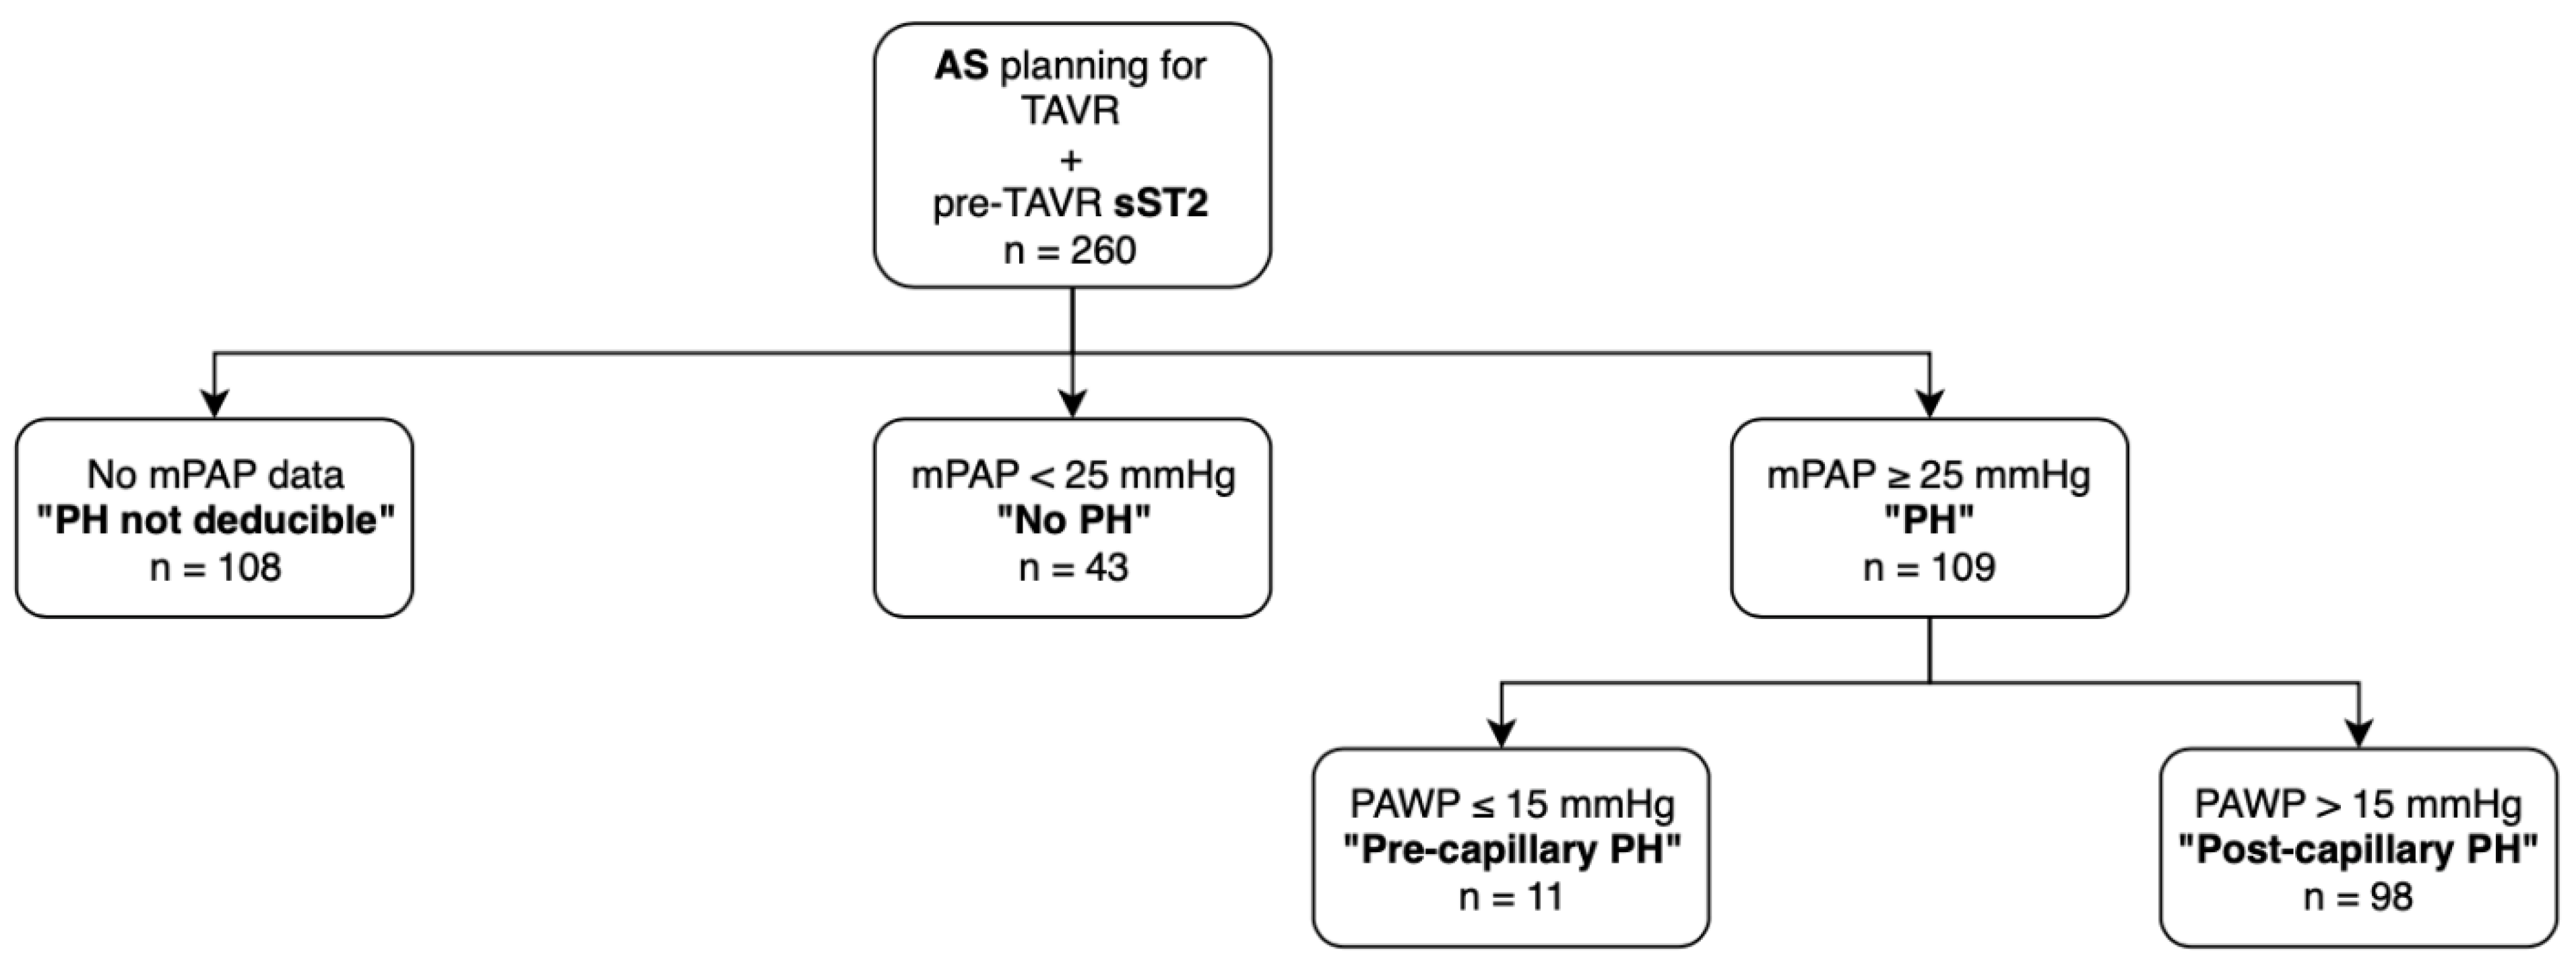
2.1. Patient Population
2.2. Transthoracic Echocardiography
2.3. Right Heart Catheterization (RHC) Procedure
2.4. Hemodynamic Criterions of PH
2.5. Analysis of sST2 by Enzyme-Linked Immunosorbent Assay
2.6. TAVR Procedure
2.7. Statistical Analysis
3. Result
3.1. Study Cohort
3.2. Baseline Characteristic of Study Participants
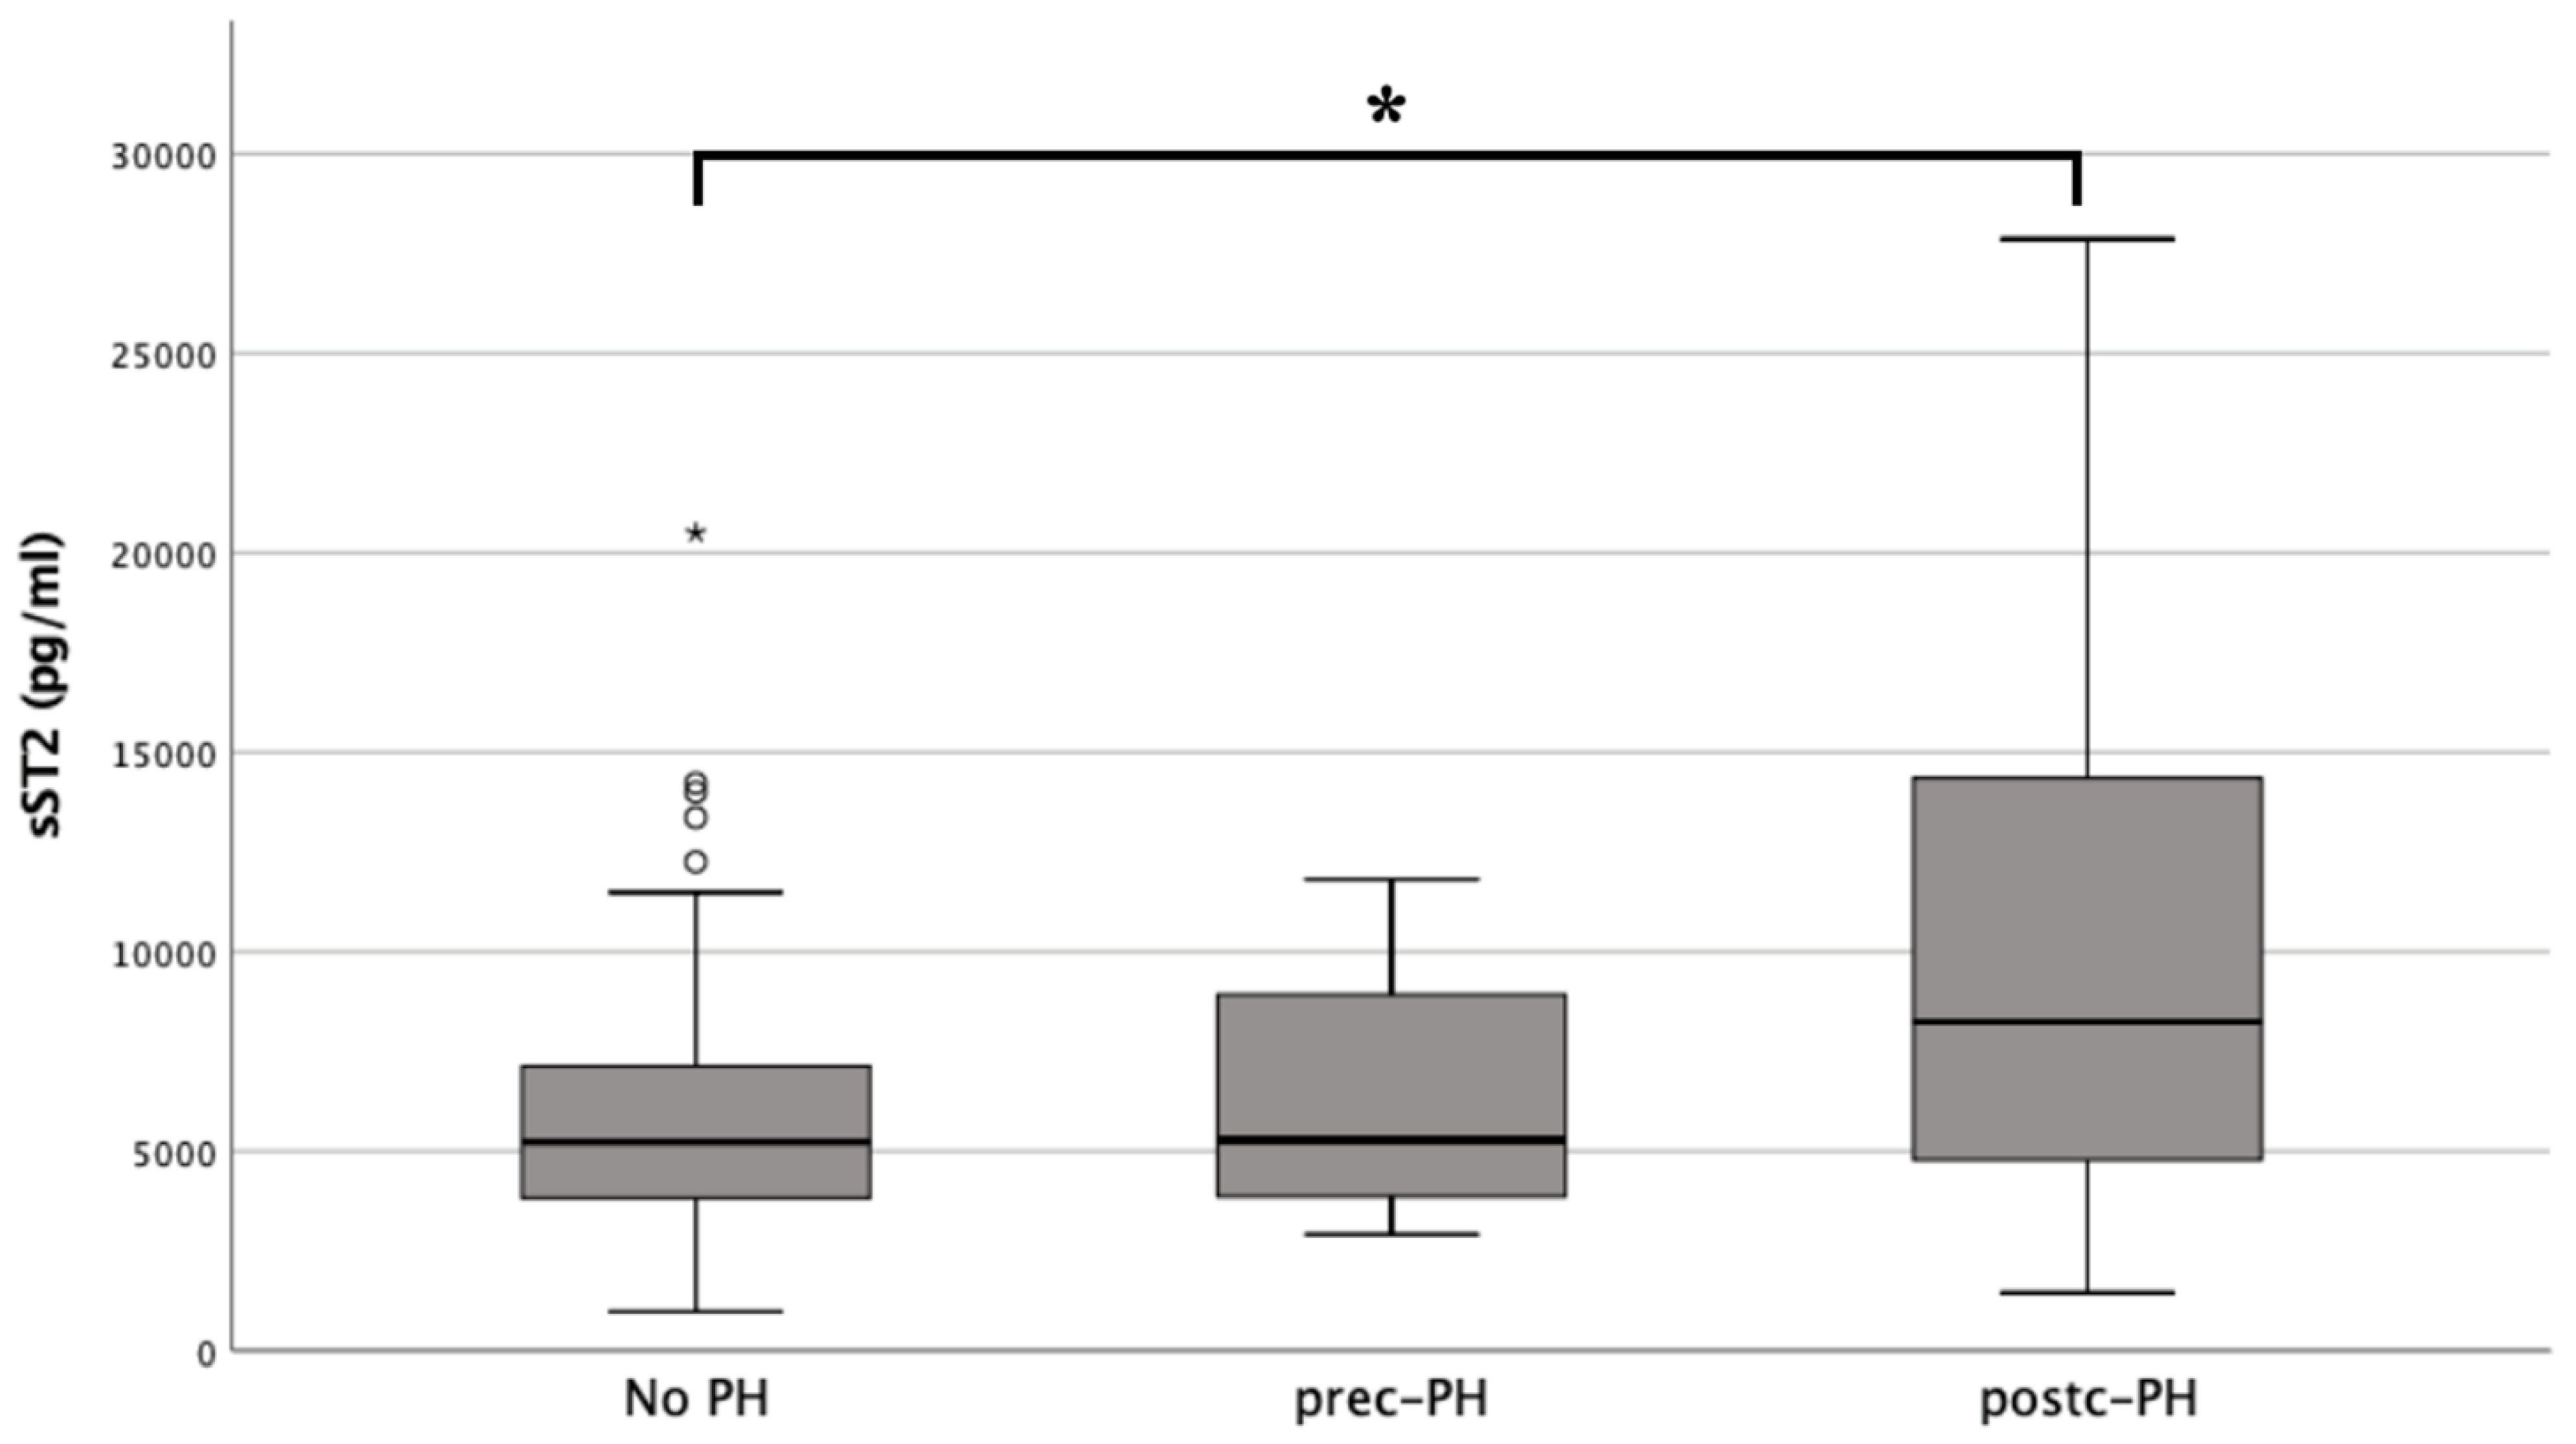
3.3. Biomarker Concentrations
3.4. Binary, Logistic Regression Analysis
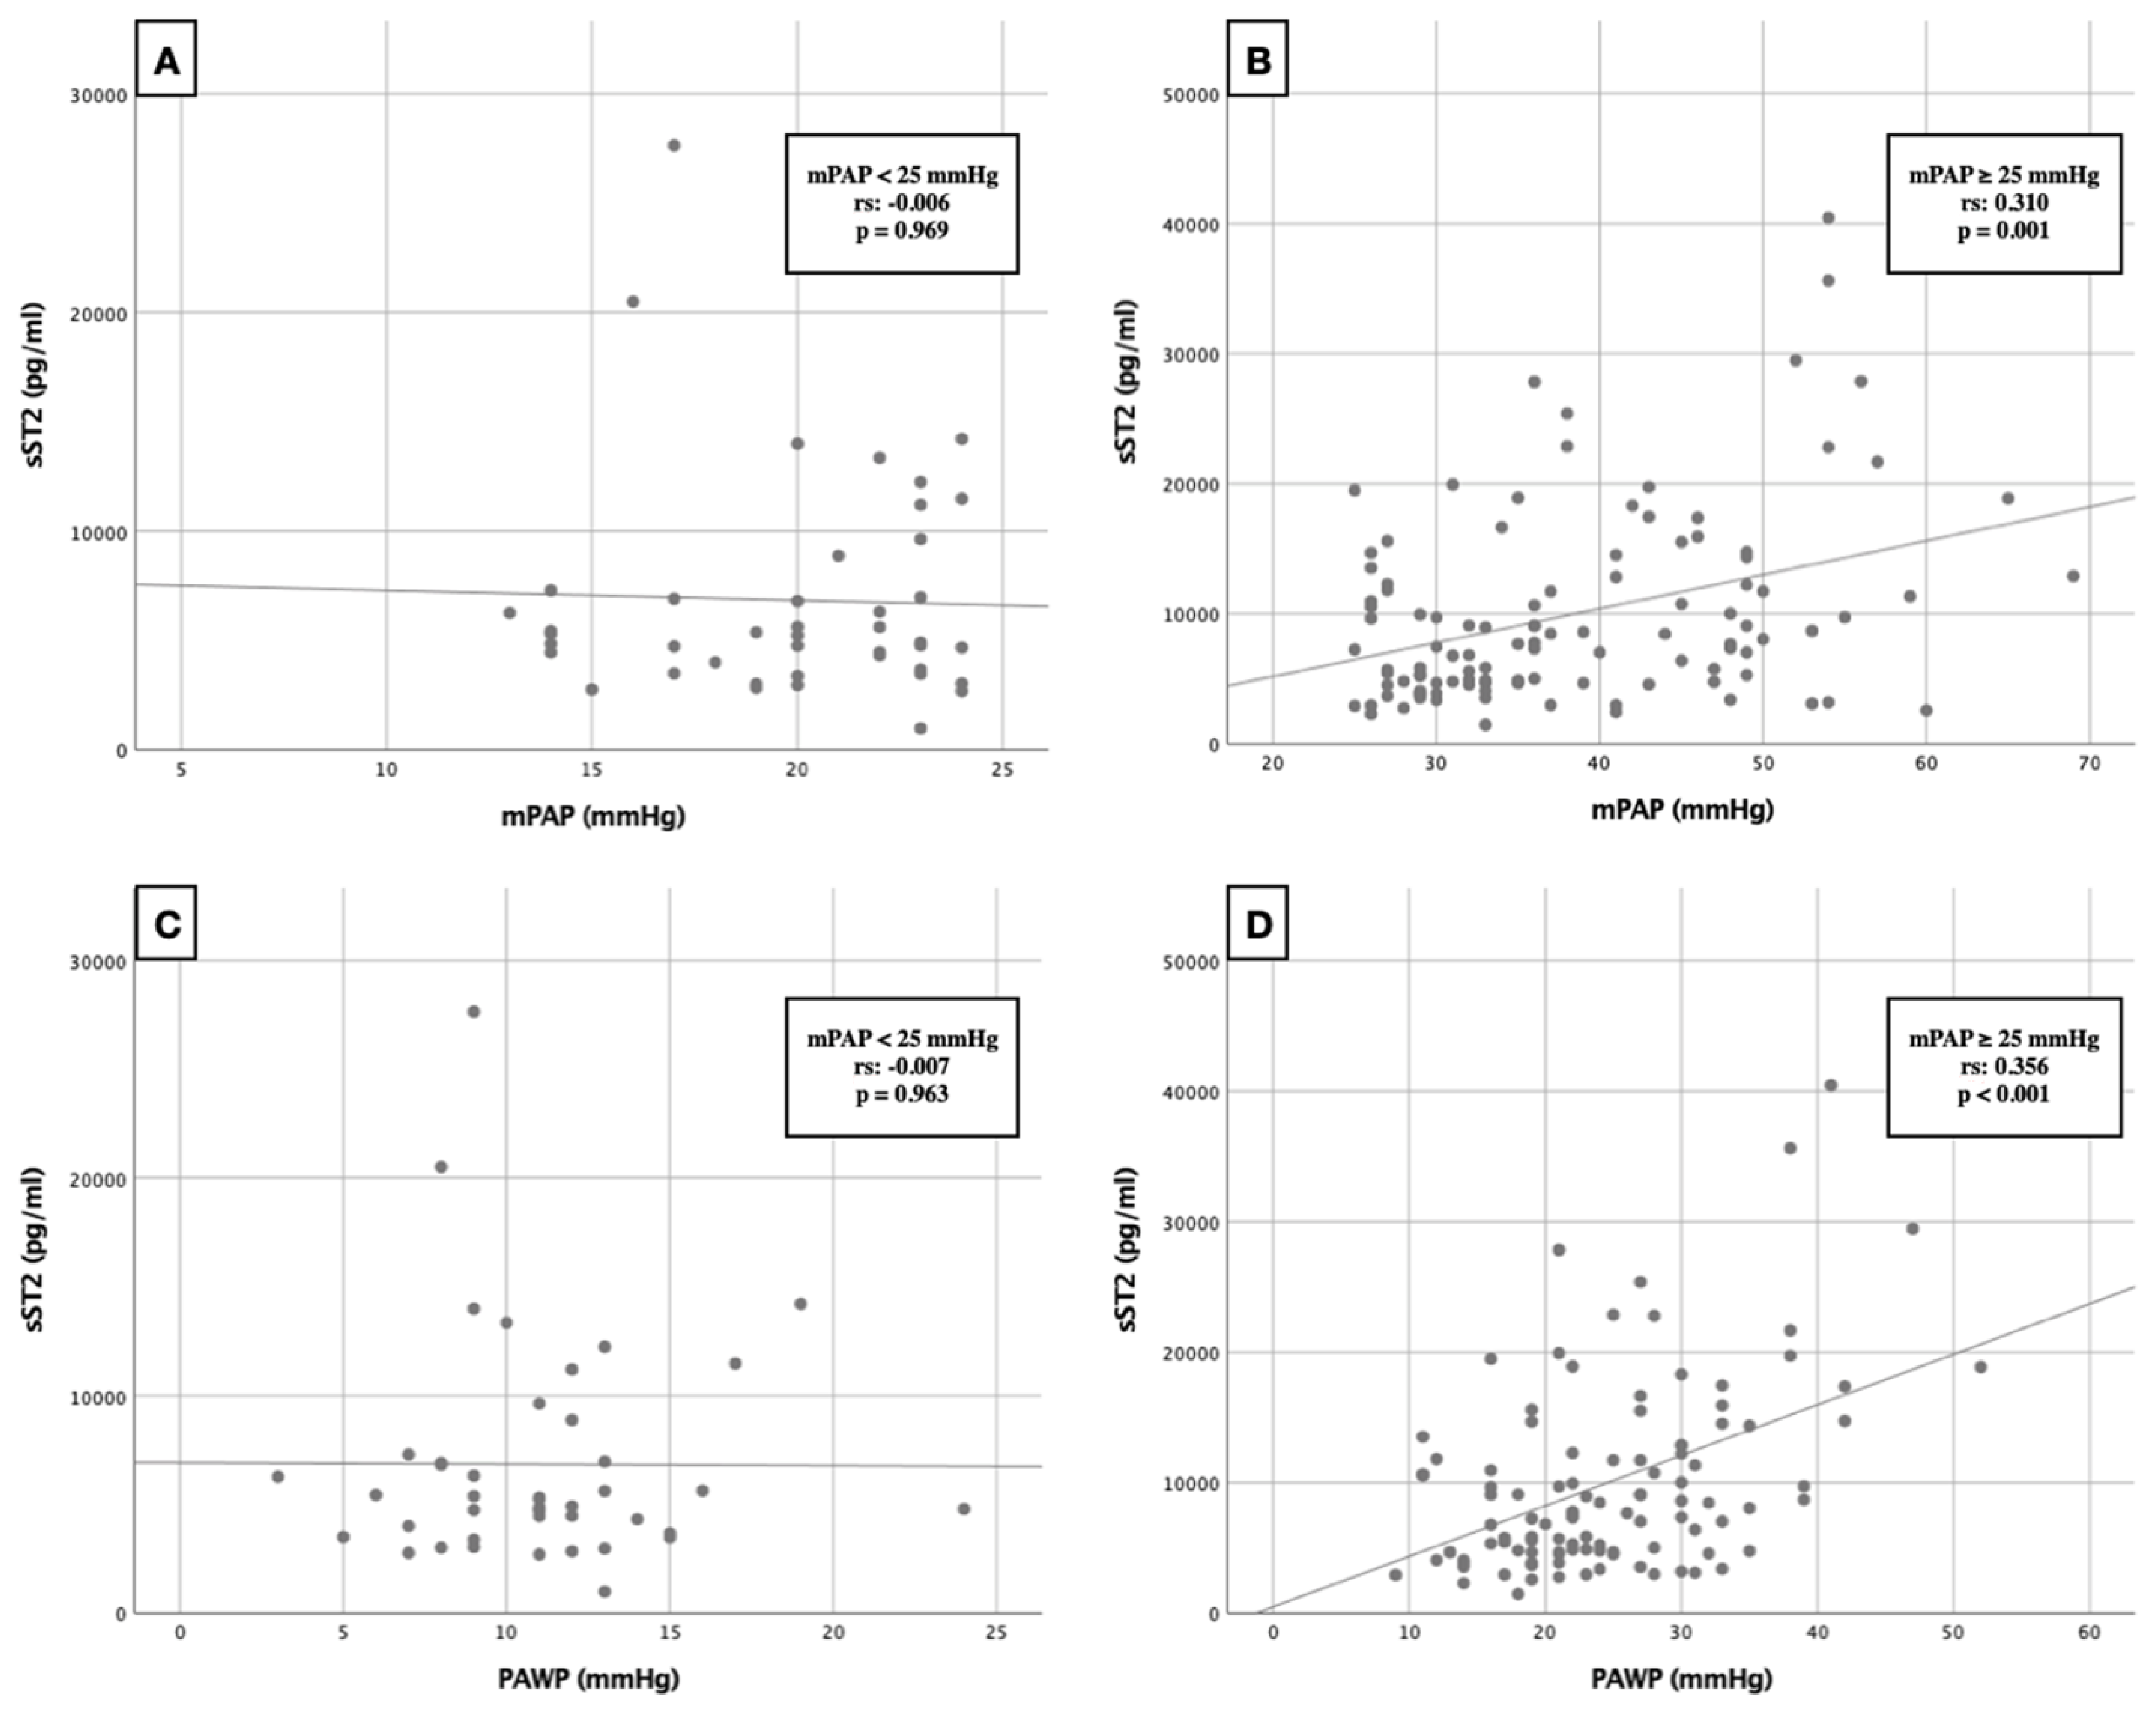
3.5. Correlation Analysis
3.6. Cox Proportional Hazard Regression
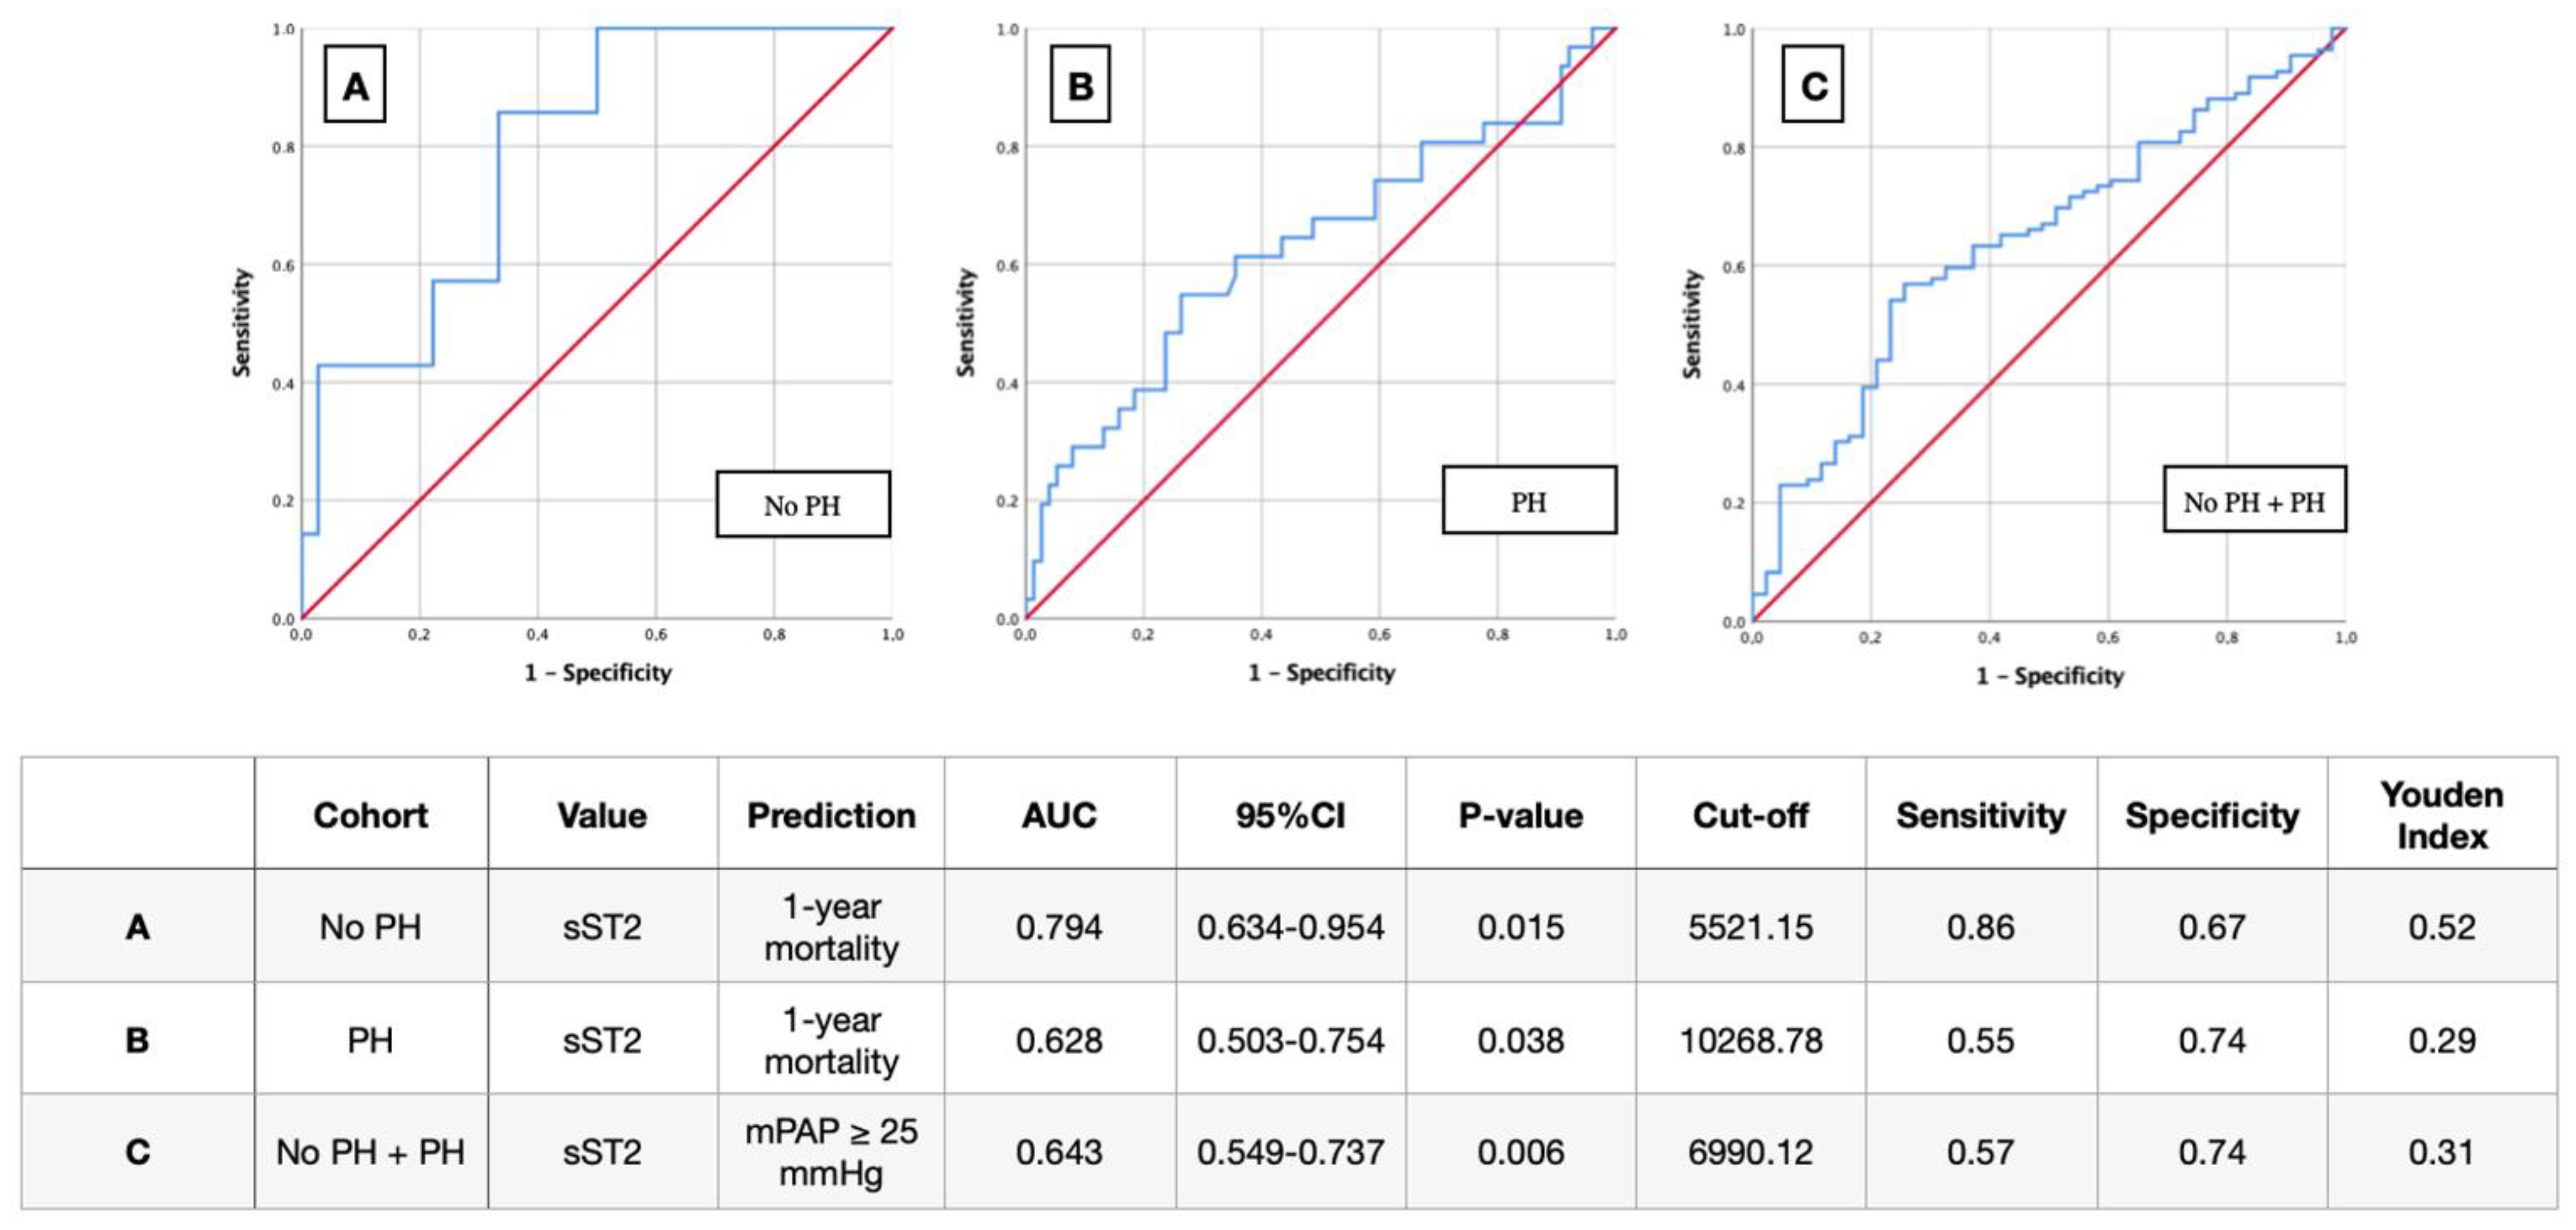
3.7. AUROC Results
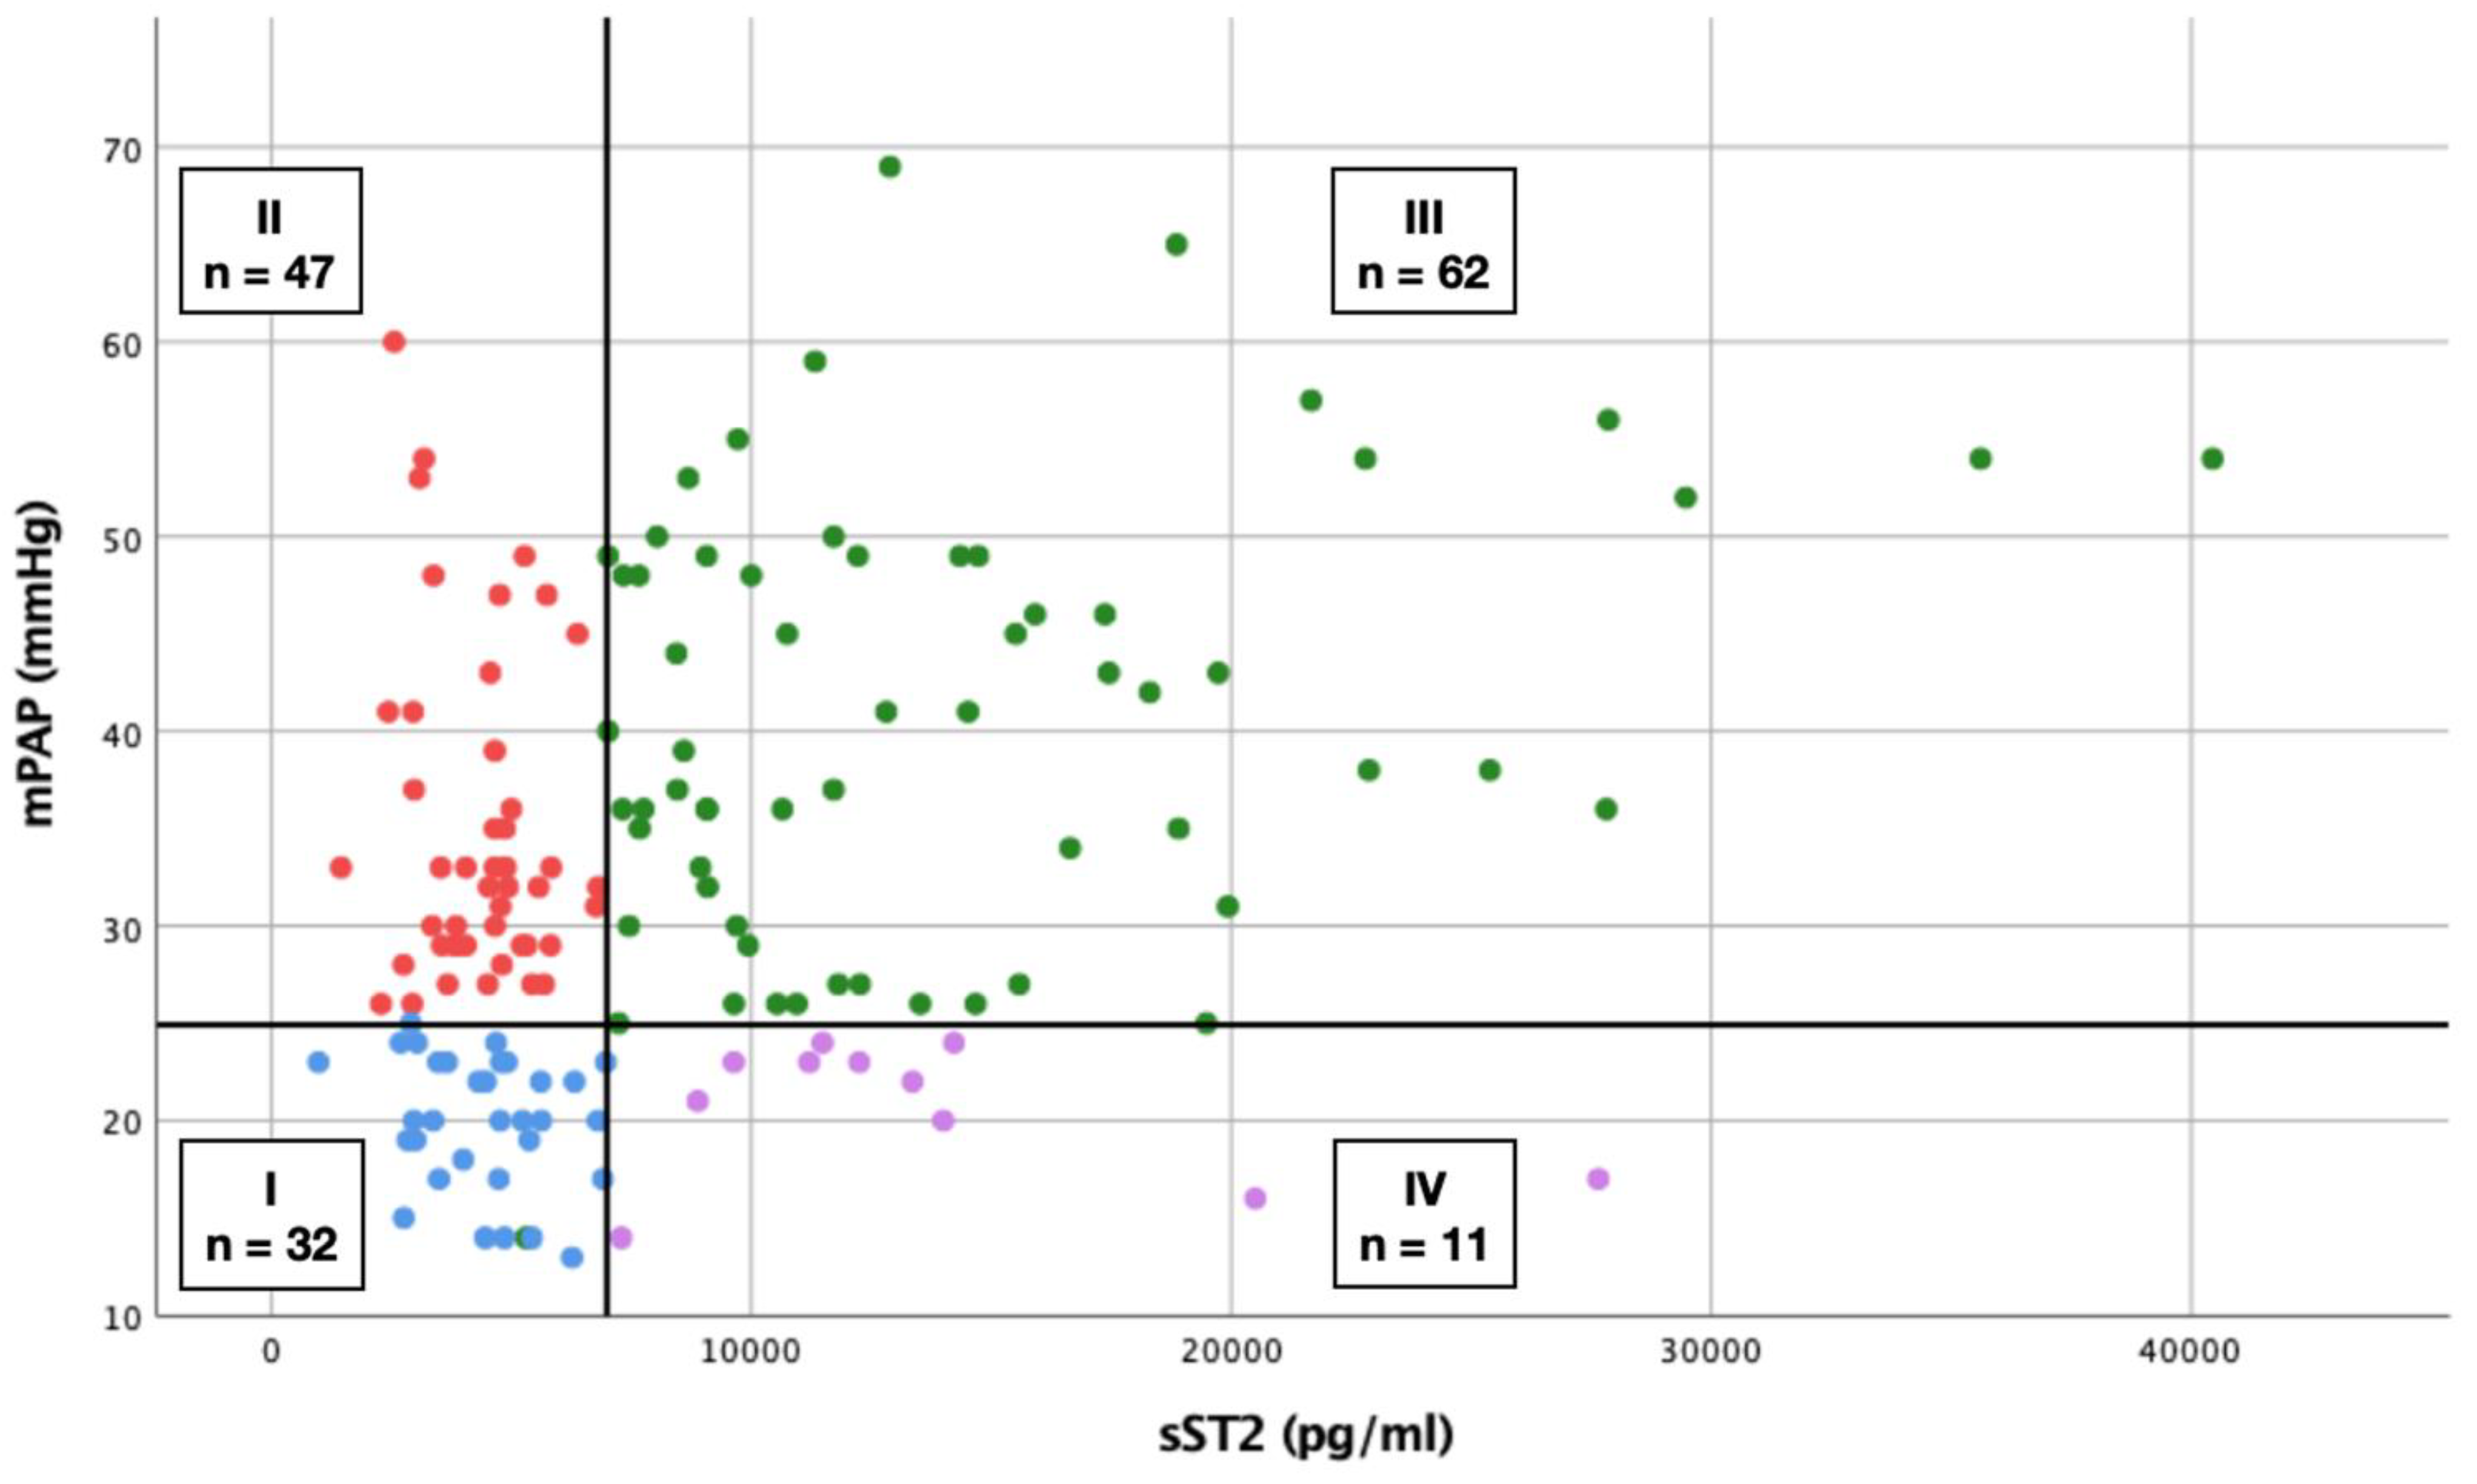
3.8. Scatterplot
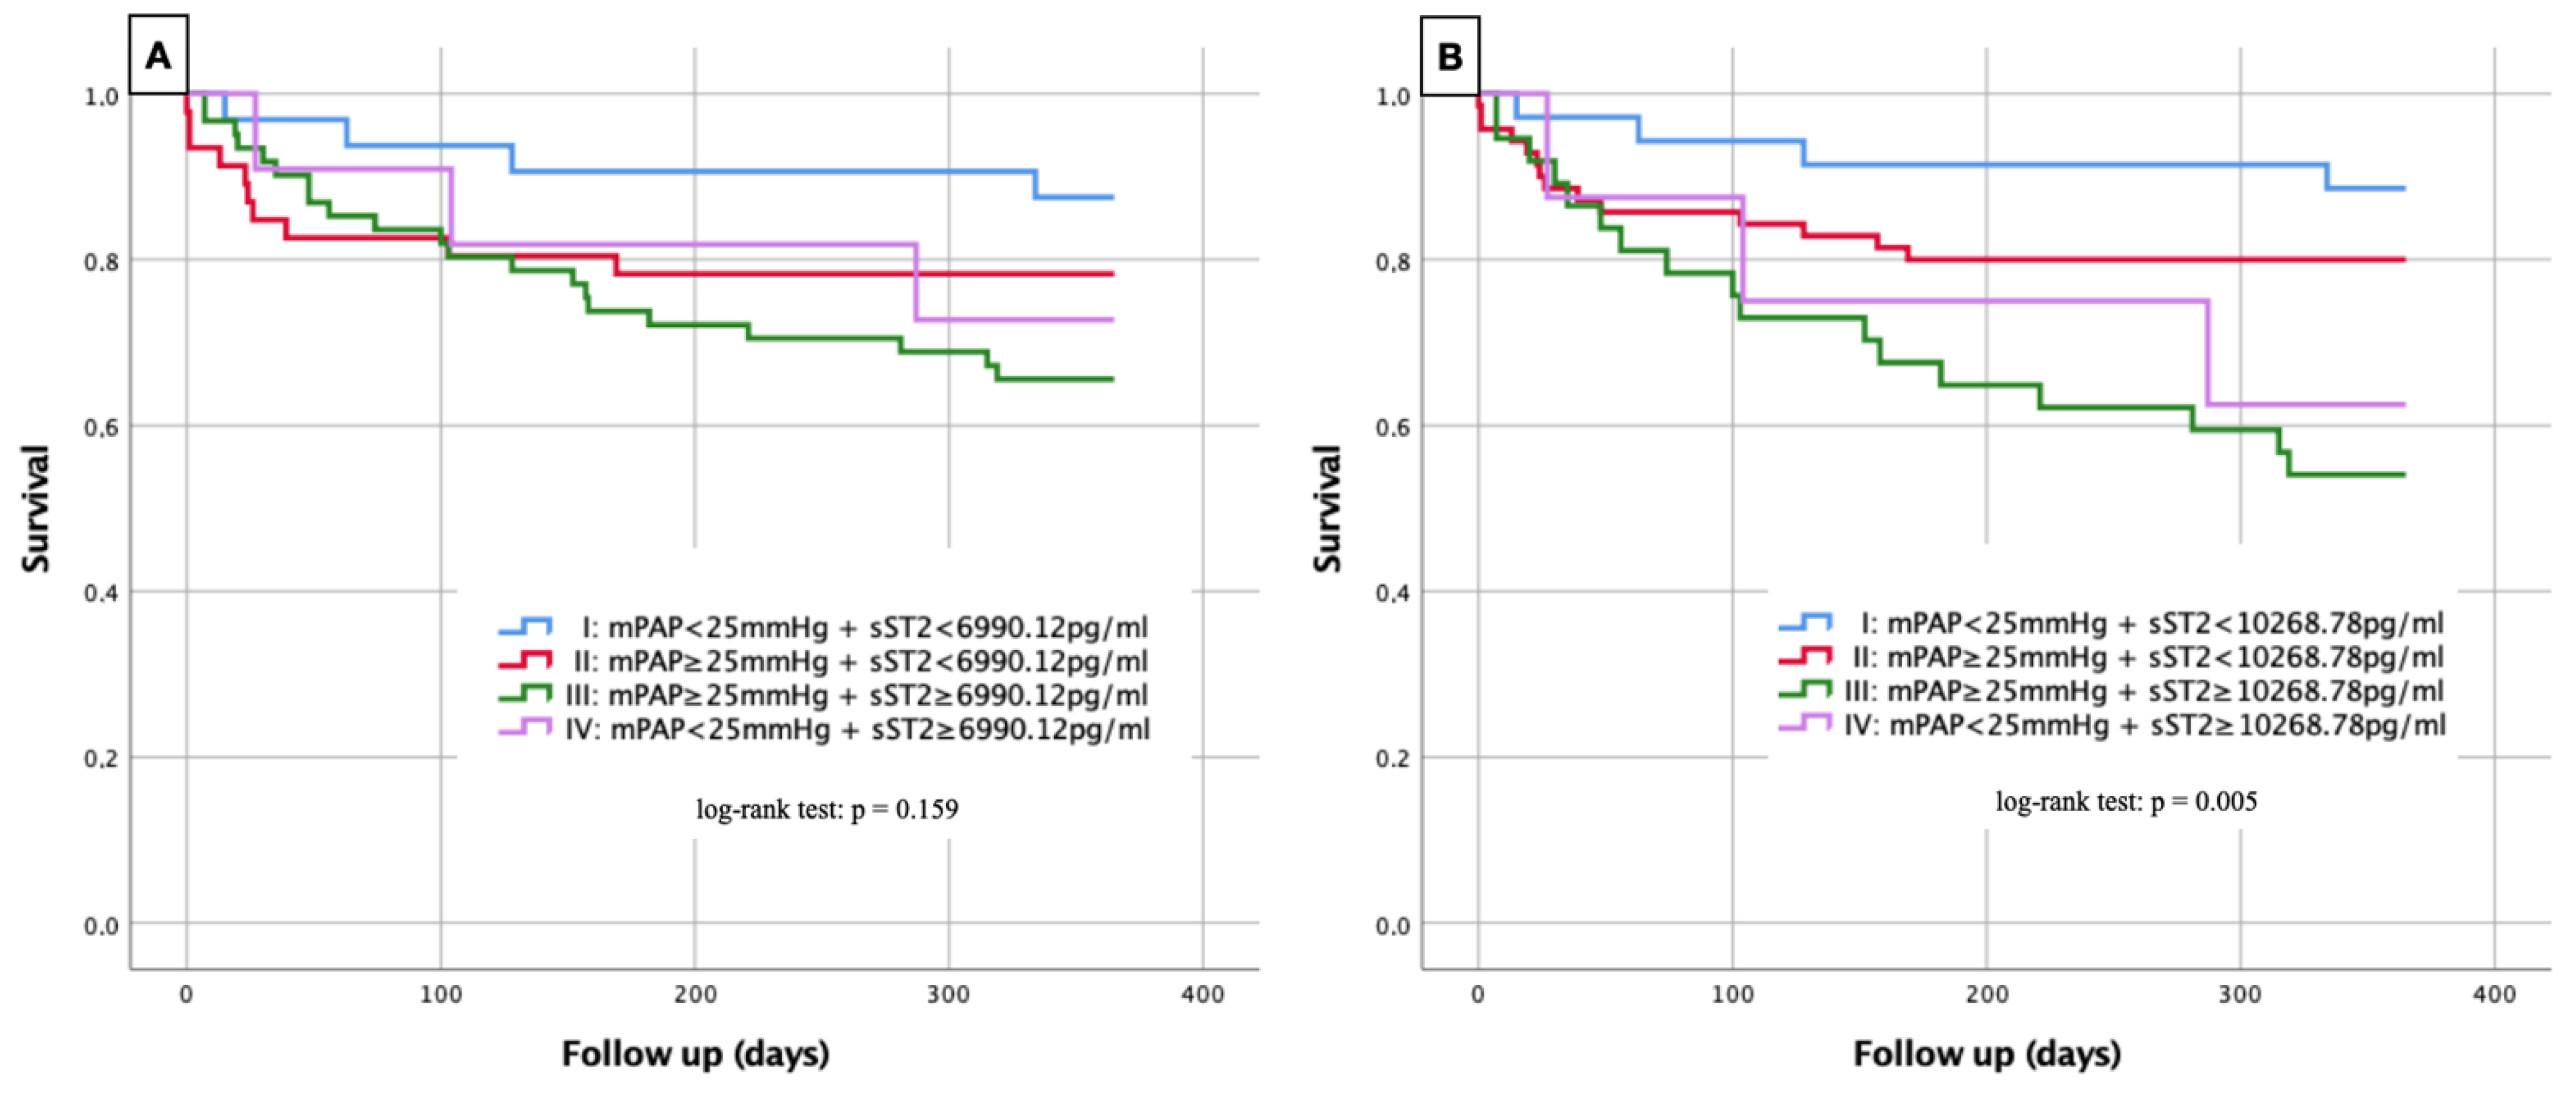
3.9. Kaplan–Meier Curves
3.10. Sensitivity and Specificity of sST2 in Prediction of PH
4. Discussion
4.1. Double “Stress” for the Heart in AS with PH?
4.2. Can sST2 as a Biomarker Predict or Even Replace RHC Measurements?
4.3. High sST2 in AS Equivalent to PH and Increased Mortality?
5. Conclusions
6. Limitation
Author Contributions
Funding
Institutional Review Board Statement
Informed Consent Statement
Data Availability Statement
Acknowledgments
Conflicts of Interest
References
- Osnabrugge, R.L.; Mylotte, D.; Head, S.J.; Van Mieghem, N.M.; Nkomo, V.T.; LeReun, C.M.; Bogers, A.J.; Piazza, N.; Kappetein, A.P. Aortic Stenosis in the Elderly: Disease Prevalence and Number of Candidates for Transcatheter Aortic Valve Replacement: A Meta-Analysis and Modeling Study. J. Am. Coll. Cardiol. 2013, 62, 1002–1012. [Google Scholar] [CrossRef] [PubMed] [Green Version]
- Cribier, A.; Eltchaninoff, H.; Bash, A.; Borenstein, N.; Tron, C.; Bauer, F.; Derumeaux, G.; Anselme, F.; Laborde, F.; Leon, M.B. Percutaneous Transcatheter Implantation of an Aortic Valve Prosthesis for Calcific Aortic Stenosis. Circulation 2002, 106, 3006–3008. [Google Scholar] [CrossRef] [PubMed]
- Rodés-Cabau, J.; Webb, J.G.; Cheung, A.; Ye, J.; Dumont, E.; Feindel, C.M.; Osten, M.; Natarajan, M.K.; Velianou, J.L.; Martucci, G.; et al. Transcatheter Aortic Valve Implantation for the Treatment of Severe Symptomatic Aortic Stenosis in Patients at Very High or Prohibitive Surgical Risk: Acute and Late Outcomes of the Multicenter Canadian Experience. J. Am. Coll. Cardiol. 2010, 55, 1080–1090. [Google Scholar] [CrossRef] [PubMed] [Green Version]
- Zelis, J.M.; Veer, M.V.T.; Houterman, S.; Pijls, N.H.; Tonino, P.A. Survival and quality of life after transcatheter aortic valve implantation relative to the general population. IJC Heart Vasc. 2020, 28, 100536. [Google Scholar] [CrossRef] [PubMed]
- Sultan, I.; Fukui, M.; Bianco, V.; Brown, J.A.; Kliner, D.E.; Hickey, G.; Thoma, F.W.; Lee, J.S.; Schindler, J.T.; Kilic, A.; et al. Impact of Combined Pre and Postcapillary Pulmonary Hypertension on Survival after Transcatheter Aortic Valve Implantation. Am. J. Cardiol. 2020, 131, 60–66. [Google Scholar] [CrossRef]
- Weber, L.; Rickli, H.; Haager, P.K.; Joerg, L.; Weilenmann, D.; Brenner, R.; Taramasso, M.; Baier, P.; Maisano, F.; Maeder, M.T. Haemodynamic mechanisms and long-term prognostic impact of pulmonary hypertension in patients with severe aortic stenosis undergoing valve replacement. Eur. J. Heart Fail. 2019, 21, 172–181. [Google Scholar] [CrossRef] [Green Version]
- Melby, S.J.; Moon, M.R.; Lindman, B.; Bailey, M.S.; Hill, L.L.; Damiano, R.J. Impact of pulmonary hypertension on outcomes after aortic valve replacement for aortic valve stenosis. J. Thorac. Cardiovasc. Surg. 2011, 141, 1424–1430. [Google Scholar] [CrossRef] [Green Version]
- Schewel, J.; Schmidt, T.; Kuck, K.-H.; Frerker, C.; Schewel, D. Impact of Pulmonary Hypertension Hemodynamic Status on Long-Term Outcome after Transcatheter Aortic Valve Replacement. JACC Cardiovasc. Interv. 2019, 12, 2155–2168. [Google Scholar] [CrossRef]
- Galiè, N.; Humbert, M.; Vachiery, J.-L.; Gibbs, S.; Lang, I.; Torbicki, A.; Simonneau, G.; Peacock, A.; Vonk Noordegraaf, A.; Beghetti, M.; et al. 2015 ESC/ERS Guidelines for the diagnosis and treatment of pulmonary hypertension: The Joint Task Force for the Diagnosis and Treatment of Pulmonary Hypertension of the European Society of Cardiology (ESC) and the European Respiratory Society (ERS): Endorsed by: Association for European Paediatric and Congenital Cardiology (AEPC), International Society for Heart and Lung Transplantation (ISHLT). Eur. Heart J. 2016, 37, 67–119. [Google Scholar] [CrossRef]
- Maisel, A.S.; Di Somma, S. Do we need another heart failure biomarker: Focus on soluble suppression of tumorigenicity 2 (sST2). Eur. Heart J. 2016, 38, 2325–2333. [Google Scholar] [CrossRef] [Green Version]
- Januzzi, J.L. ST2 as a Cardiovascular Risk Biomarker: From the Bench to the Bedside. J. Cardiovasc. Transl. Res. 2013, 6, 493–500. [Google Scholar] [CrossRef] [PubMed]
- Mirna, M.; Wernly, B.; Paar, V.; Jung, C.; Jirak, P.; Figulla, H.-R.; Kretzschmar, D.; Franz, M.; Hoppe, U.C.; Lichtenauer, M.; et al. Multi-biomarker analysis in patients after transcatheter aortic valve implantation (TAVI). Biomarkers 2018, 23, 773–780. [Google Scholar] [CrossRef] [PubMed]
- Aleksova, A.; Paldino, A.; Beltrami, A.P.; Padoan, L.; Iacoviello, M.; Sinagra, G.; Emdin, M.; Maisel, A.S. Cardiac Biomarkers in the Emergency Department: The Role of Soluble ST2 (sST2) in Acute Heart Failure and Acute Coronary Syndrome—There is Meat on the Bone. J. Clin. Med. 2019, 8, 270. [Google Scholar] [CrossRef] [PubMed] [Green Version]
- Miller, A.M.; Liew, F.Y. The IL-33/ST2 pathway—A new therapeutic target in cardiovascular disease. Pharmacol. Ther. 2011, 131, 179–186. [Google Scholar] [CrossRef] [PubMed]
- Crnko, S.; Printezi, M.I.; Jansen, T.P.; Leiteris, L.; Van Der Meer, M.G.; Schutte, H.; Van Faassen, M.; Du Pré, B.C.; De Jonge, N.; Asselbergs, F.; et al. Prognostic biomarker soluble ST2 exhibits diurnal variation in chronic heart failure patients. ESC Heart Fail. 2020, 7, 1224–1233. [Google Scholar] [CrossRef] [PubMed]
- Lotierzo, M.; Dupuy, A.M.; Kalmanovich, E.; Roubille, F.; Cristol, J.P. sST2 as a value-added biomarker in heart failure. Clin. Chim. Acta 2020, 501, 120–130. [Google Scholar] [CrossRef]
- van der Velde, A.R.; Lexis, C.P.; Meijers, W.C.; van der Horst, I.C.; Lipsic, E.; Dokter, M.M.; van Veldhuisen, D.J.; van der Harst, P.; de Boer, R.A. Galectin-3 and sST2 in prediction of left ventricular ejection fraction after myocardial infarction. Clin. Chim. Acta 2016, 452, 50–57. [Google Scholar] [CrossRef]
- Pfetsch, V.; Sanin, V.; Jaensch, A.; Dallmeier, D.; Mons, U.; Brenner, H.; Koenig, W.; Rothenbacher, D. Increased Plasma Concentrations of Soluble ST2 Independently Predict Mortality but not Cardiovascular Events in Stable Coronary Heart Disease Patients: 13-Year Follow-up of the KAROLA Study. Cardiovasc. Drugs Ther. 2017, 31, 167–177. [Google Scholar] [CrossRef]
- Bäz, L.; Dannberg, G.; Grün, K.; Westphal, J.; Möbius-Winkler, S.; Jung, C.; Pfeil, A.; Schulze, P.; Franz, M. Serum Biomarkers of Cardiovascular Remodelling Reflect Extra-Valvular Cardiac Damage in Patients with Severe Aortic Stenosis. Int. J. Mol. Sci. 2020, 21, 4174. [Google Scholar] [CrossRef]
- Ruparelia, N.; Prendergast, B.D. TAVI in 2015: Who, where and how? Heart 2015, 101, 1422–1431. [Google Scholar] [CrossRef]
- Yancy, C.W.; Jessup, M.; Bozkurt, B.; Butler, J.; Casey, D.E., Jr.; Drazner, M.H.; Fonarow, G.C.; Geraci, S.A.; Horwich, T.; Januzzi, J.L.; et al. 2013 ACCF/AHA guideline for the management of heart failure: A report of the American College of Cardiology Foundation/American Heart Association Task Force on Practice Guidelines. J. Am. Coll. Cardiol. 2013, 62, e147–e239. [Google Scholar] [CrossRef] [PubMed] [Green Version]
- Geenen, L.; Baggen, V.J.M.; Bosch, A.E.V.D.; Eindhoven, J.A.; Cuypers, J.A.A.E.; Witsenburg, M.; Boersma, E.; Roos-Hesselink, J.W. Prognostic value of soluble ST2 in adults with congenital heart disease. Heart 2019, 105, 999–1006. [Google Scholar] [CrossRef] [PubMed]
- Zhang, T.; Xu, C.; Zhao, R.; Cao, Z. Diagnostic Value of sST2 in Cardiovascular Diseases: A Systematic Review and Meta-Analysis. Front. Cardiovasc. Med. 2021, 8, 697837. [Google Scholar] [CrossRef] [PubMed]
- Park, S.; Kim, I.-C.; Kim, H.; Cho, Y.-K.; Lee, C.H.; Hur, S.-H. Ability of soluble ST2 to predict left ventricular remodeling in patients with acute coronary syndrome. Heart Vessel. 2021, 37, 173–183. [Google Scholar] [CrossRef]
- Ip, C.; Luk, K.S.; Yuen, V.L.C.; Chiang, L.; Chan, C.K.; Ho, K.; Gong, M.; Lee, T.T.L.; Leung, K.S.K.; Roever, L.; et al. Soluble suppression of tumorigenicity 2 (sST2) for predicting disease severity or mortality outcomes in cardiovascular diseases: A systematic review and meta-analysis. IJC Heart Vasc. 2021, 37, 100887. [Google Scholar] [CrossRef]
- Stundl, A.; Lünstedt, N.-S.; Courtz, F.; Freitag-Wolf, S.; Frey, N.; Holdenrieder, S.; Zur, B.; Grube, E.; Nickenig, G.; Werner, N.; et al. Soluble ST2 for Risk Stratification and the Prediction of Mortality in Patients Undergoing Transcatheter Aortic Valve Implantation. Am. J. Cardiol. 2017, 120, 986–993. [Google Scholar] [CrossRef]
- Wernly, B.; Lichtenauer, M.; Jirak, P.; Eder, S.; Reiter, C.; Kammler, J.; Kypta, A.; Jung, C.; Franz, M.; Hoppe, U.C.; et al. Soluble ST2 predicts 1-year outcome in patients undergoing transcatheter aortic valve implantation. Eur. J. Clin. Investig. 2016, 47, 149–157. [Google Scholar] [CrossRef]
- Zheng, Y.-G.; Yang, T.; He, J.-G.; Chen, G.; Liu, Z.-H.; Xiong, C.-M.; Gu, Q.; Ni, X.-H.; Zhao, Z.-H. Plasma Soluble ST2 Levels Correlate with Disease Severity and Predict Clinical Worsening in Patients With Pulmonary Arterial Hypertension. Clin. Cardiol. 2014, 37, 365–370. [Google Scholar] [CrossRef]
- Sun, Y.; Wang, L.; Meng, X.; Gong, S.; Zhao, Q.; Shi, L.; Jiang, R.; He, J.; Wu, W.; Li, Y.; et al. Soluble ST2 and mixed venous oxygen saturation for prediction of mortality in patients with pulmonary hypertension. J. Thorac. Dis. 2021, 13, 3478–3488. [Google Scholar] [CrossRef]
- Shao, D.; Perros, F.; Humbert, M.; Caramori, G.; Price, L.; Addcock, I.; Wort, S. S154 Is there a role for IL-33 in the pathogenesis of pulmonary arterial hypertension? Thorax 2010, 65, A70. [Google Scholar] [CrossRef] [Green Version]
- Mahmood, A.; McSharry, C.; Xu, D.; Peacock, A.J.; Welsh, D.J. S155 the role of ST2 in a model of pulmonary hypertension. Thorax 2010, 65, A70–A71. [Google Scholar] [CrossRef] [Green Version]
- O’Sullivan, C.J.; Wenaweser, P.; Ceylan, O.; Rat-Wirtzler, J.; Stortecky, S.; Heg, D.; Spitzer, E.; Zanchin, T.; Praz, F.; Tüller, D.; et al. Effect of Pulmonary Hypertension Hemodynamic Presentation on Clinical Outcomes in Patients with Severe Symptomatic Aortic Valve Stenosis Undergoing Transcatheter Aortic Valve Implantation: Insights from the New Proposed Pulmonary Hypertension Classification. Circ. Cardiovasc. Interv. 2015, 8, e002358. [Google Scholar] [CrossRef] [PubMed] [Green Version]
- Lancellotti, P.; Dulgheru, R.; Magne, J.; Henri, C.; Servais, L.; Bouznad, N.; Ancion, A.; Martinez, C.; Davin, L.; Le Goff, C.; et al. Elevated Plasma Soluble ST2 Is Associated with Heart Failure Symptoms and Outcome in Aortic Stenosis. PLoS ONE 2015, 10, e0138940. [Google Scholar] [CrossRef] [PubMed]
- Binas, D.; Daniel, H.; Richter, A.; Ruppert, V.; Schlüter, K.-D.; Schieffer, B.; Pankuweit, S. The prognostic value of sST2 and galectin-3 considering different aetiologies in non-ischaemic heart failure. Open Heart 2018, 5, e000750. [Google Scholar] [CrossRef]
- Shah, R.V.; Chen-Tournoux, A.A.; Picard, M.H.; van Kimmenade, R.R.; Januzzi, J.L. Serum Levels of the Interleukin-1 Receptor Family Member ST2, Cardiac Structure and Function, and Long-Term Mortality in Patients with Acute Dyspnea. Circ. Heart Fail. 2009, 2, 311–319. [Google Scholar] [CrossRef] [PubMed] [Green Version]
- Lessana, A.; Mascolo, E.; Di Serio, F.; Marraudino, N.; Laborde, F.; Paparella, D.; Galeone, A. Interleukin-1 Receptor-Related Protein ST2 and Mitral Valve Repair Outcome in Patients with Chronic Degenerative Mitral Regurgitation. Thorac. Cardiovasc. Surg. 2013, 62, 047–051. [Google Scholar] [CrossRef] [PubMed]
- Banaszkiewicz, M.; Pietrasik, A.; Florczyk, M.; Kędzierski, P.; Piłka, M.; Mańczak, R.; Kochman, J.; Opolski, G.; Torbicki, A.; Kurzyna, M.; et al. Soluble ST2 as a Biomarker for Early Complications in Patients with Chronic Thromboembolic Pulmonary Hypertension Treated with Balloon Pulmonary Angioplasty. Diagnostics 2021, 11, 133. [Google Scholar] [CrossRef]
- Banaszkiewicz, M.; Pietrasik, A.; Darocha, S.; Piłka, M.; Florczyk, M.; Dobosiewicz, A.; Kędzierski, P.; Pędzich-Placha, E.; Kochman, J.; Opolski, G.; et al. Soluble ST2 protein as a new biomarker in patientswith precapillary pulmonary hypertension. Arch. Med. Sci. 2020, 16, 1–10. [Google Scholar] [CrossRef]
- Schmid, J.; Stojakovic, T.; Zweiker, D.; Scharnagl, H.; Maderthaner, R.D.; Scherr, D.; Maier, R.; Schmidt, A.; März, W.; Binder, J.S.; et al. ST2 predicts survival in patients undergoing transcatheter aortic valve implantation. Int. J. Cardiol. 2017, 244, 87–92. [Google Scholar] [CrossRef]
- Gül, İ.; Yücel, O.; Zararsız, A.; Demirpençe, Ö.; Yücel, H.; Zorlu, A.; Yılmaz, M.B. Prognostic role of soluble suppression of tumorigenicity-2 on cardiovascular mortality in outpatients with heart failure. Anatol. J. Cardiol. 2017, 18, 200–205. [Google Scholar] [CrossRef]


| PH Not Deducible (No mPAP Data) n = 108 | No PH (mPAP < 25 mmHg) n = 43 | PH (mPAP ≥ 25 mmHg) n = 109 | All Groups | No PH vs. PH | ||||
|---|---|---|---|---|---|---|---|---|
| Clinical data | mean | SD | mean | SD | mean | SD | p-value * | p-value ** |
| Age (years) | 80.49 | 6.46 | 80.91 | 6.87 | 81.05 | 7.6 | 0.924 | 0.917 |
| Weight (kg) | 75.06 | 15.25 | 72.79 | 13.45 | 76 | 13.35 | 0.056 | 0.185 |
| Height (cm) | 164.77 | 9.28 | 163.14 | 9.82 | 165.52 | 8.5 | 0.119 | 0.139 |
| BMI (kg/m2) | 27.63 | 5.2 | 27.32 | 4.21 | 27.74 | 4.47 | 0.356 | 0.597 |
| NYHA | 3.11 | 0.61 | 2.88 | 0.64 | 3.15 | 0.56 | 0.028 | 0.019 |
| STSScore | 2.1 | 2.22 | 3.73 | 2.44 | 4.08 | 2.49 | 0.08 | 0.439 |
| EuroScore | 27.12 | 17.04 | 21.05 | 13.54 | 26.14 | 14.3 | 0.686 | 0.055 |
| Concomitant Disease | % | % | % | |||||
| Diabetes mellitus | 63.3 | 55.8 | 60.6 | 0.374 | 0.593 | |||
| Arterial Hypertension | 91.1 | 90.7 | 94.5 | 0.896 | 0.395 | |||
| CVD-1 vessel | 18.9 | 18.6 | 27.5 | 0.665 | 0.253 | |||
| CVD-2 vessels | 9.2 | 9.3 | 10.1 | 0.251 | 0.883 | |||
| CVD-3 vessels | 18.5 | 14 | 17.4 | 0.355 | 0.602 | |||
| COPD | 23.1 | 18.6 | 26.6 | 0.181 | 0.301 | |||
| Myocardial infarction | 13 | 14 | 14.8 | 0.273 | 0.892 | |||
| Stroke | 15.1 | 9.3 | 15.6 | 0.801 | 0.311 | |||
| Echocardiography | mean | SD | mean | SD | mean | SD | ||
| LVEF (%) | 54.02 | 17.55 | 60.71 | 16.68 | 56.17 | 18.08 | 0.025 | 0.161 |
| LVEDD (mm) | 49.04 | 8.31 | 47.79 | 8.2 | 49.18 | 7.59 | 0.082 | 0.328 |
| LVESD (mm) | 33.27 | 9.54 | 30.06 | 10.21 | 32.26 | 9.29 | 0.054 | 0.253 |
| sPAP (mmHg) | 29.52 | 6.45 | 33.43 | 7.77 | 45.23 | 14.55 | <0.001 | <0.001 |
| AVA (cm2) | 0.66 | 0.2 | 0.66 | 0.22 | 0.65 | 0.17 | 0.424 | 0.784 |
| AV Vmax (m/s) | 4.24 | 0.7 | 5.41 | 6.14 | 4.16 | 0.68 | 0.01 | 0.189 |
| AV dPmean (mmHg) | 43.85 | 15.9 | 50.92 | 16.73 | 44.85 | 16.66 | 0.012 | 0.048 |
| AV dPmax (mmHg) | 73.09 | 23.87 | 82.39 | 23.1 | 74.03 | 25.74 | 0.022 | 0.067 |
| TAPSE (mm) | 22.2 | 5.7 | 21.3 | 5.2 | 17.7 | 4.4 | 0.098 | 0.072 |
| RHC & LHC data | mean | SD | mean | SD | mean | SD | ||
| RA (mmHg) | 5.95 | 2.79 | 12.72 | 6.59 | <0.001 | |||
| RV (mmHg) | 4.93 | 3.84 | 11.42 | 7.15 | <0.001 | |||
| sPAP (mmHg) | 34.02 | 6.87 | 59.95 | 16.6 | <0.001 | |||
| mPAP (mmHg) | 19.88 | 3.43 | 38.35 | 10.27 | <0.001 | |||
| dPAP (mmHg) | 9.91 | 3.5 | 22.61 | 7.7 | <0.001 | |||
| PAWP (mmHg) | 11 | 3.77 | 24.68 | 8.24 | <0.001 | |||
| LVEDP (mmHg) | 21.54 | 7.04 | 19.79 | 6.06 | 21.77 | 7.74 | 0.218 | 0.163 |
| Laboratory data | median | IQR | median | IQR | median | IQR | ||
| Creatinine (µmol/L) | 111.5 | 64.75 | 87 | 36 | 102 | 65.25 | 0.051 | 0.309 |
| CRP (mg/L) | 7.35 | 20.5 | 3.1 | 7.5 | 7.3 | 18.1 | <0.001 | 0.001 |
| Hb (mmol/L) | 7.75 | 1.53 | 7.7 | 1.4 | 7.55 | 1.47 | 0.559 | 0.205 |
| sST2 (pg/mL) | 5639.73 | 5521.99 | 5233.95 | 3631.56 | 8239.14 | 8187 | 0.002 | 0.006 |
| BNP (pg/mL) | 444.5 | 892.75 | 660 | 2029.5 | 854 | 2682.75 | 0.151 | 0.577 |
| Procedural data | % | % | % | |||||
| Transfemoral | 72.6 | 74.4 | 77.1 | 0.787 | 0.73 | |||
| Edwards | 70.3 | 65.1 | 63.3 | 0.016 | 0.834 | |||
| CoreValve | 14.3 | 11.6 | 20 | 0.056 | 0.157 | |||
| JenaValve | 10 | 23.3 | 16.7 | 0.195 | 0.347 | |||
| Vascular Complications | 8.9 | 9.3 | 10.1 | 0.71 | 0.883 | |||
| mPAP ≥ 25 mmHg Binary Logistic Regression | Univariate | Multivariate | ||
|---|---|---|---|---|
| Hazard Ratio (95% CI) | p-Value | Hazard Ratio (95% CI) | p-Value | |
| Age | 1.018 (0.735–1.410) | 0.916 | ||
| Weight | 1.301 (0.882–1.919) | 0.185 | ||
| BMI | 1.113 (0.750–1.654) | 0.595 | ||
| Diabetes mellitus | 0.823 (0.403–1.681) | 0.593 | ||
| Arterial Hypertension | 0.568 (0.152–2.121) | 0.400 | ||
| Cardiovascular Disease (all) | 0.701 (0.334–1.475) | 0.349 | ||
| CVD-2 vessels | 0.914 (0.274–3.043) | 0.883 | ||
| CVD-3 vessels | 0.768 (0.284–2.076) | 0.603 | ||
| COPD | 0.631 (0.262–1.517) | 0.303 | ||
| Myocardial infarction | 0.932 (0.339–2.567) | 0.892 | ||
| Stroke | 0.555 (0.175–1.756) | 0.316 | ||
| LVEF | 0.762 (0.520–1.115) | 0.162 | ||
| LVEDD | 1.201 (0.832–1.734) | 0.327 | ||
| LVESD | 1.274 (0.841–1.928) | 0.253 | ||
| AVA | 0.942 (0.647–1.372) | 0.756 | ||
| AV Vmax | 0.136 (0.029–0.650) | 0.012 | 0.258 (0.044–1.497) | 0.131 |
| AV dpmean | 0.707 (0.500–1.002) | 0.051 | 1.452 (0.414–5.086) | 0.560 |
| AV dpmax | 0.726 (0.511–1.031) | 0.073 | 0.744 (0.447–1.238) | 0.255 |
| Mitral insufficiency ≥ II° | 0.468 (0.223–0.979) | 0.044 | 1.161 (0.493–2.735) | 0.733 |
| Tricuspid insufficiency ≥ II° | 0.471 (0.223–0.996) | 0.049 | 0.540 (0.241–1.207) | 0.133 |
| Creatinine | 1.214 (0.786–1.875) | 0.383 | ||
| Hb | 0.801 (0.555–1.155) | 0.235 | ||
| sST2 | 1.748 (1.107–2.760) | 0.017 | 1.697 (1.040–2.768) | 0.034 |
| Overall Cohort mPAP + No mPAP Data | sST2—No PH mPAP < 25 mmHg | sST2—PH mPAP ≥ 25 mmHg | ||||
|---|---|---|---|---|---|---|
| rs | p | rs | p | rs | p | |
| Age | 0.006 | 0.923 | 0.152 | 0.329 | −0.101 | 0.294 |
| Weight | 0.116 | 0.063 | 0.114 | 0.467 | 0.054 | 0.575 |
| Height | 0.229 | <0.001 | 0.259 | 0.094 | 0.232 | 0.015 |
| BMI | −0.044 | 0.476 | −0.075 | 0.631 | −0.07 | 0.471 |
| Survival time (1 year) | −0.233 | <0.001 | −0.379 | 0.012 | −0.165 | 0.089 |
| NYHA ≥ III° | 0.17 | 0.007 | 0.056 | 0.729 | 0.21 | 0.03 |
| STSScore | −0.019 | 0.815 | 0.08 | 0.611 | −0.078 | 0.421 |
| EuroScore | −0.045 | 0.044 | 0.083 | 0.612 | −0.256 | 0.01 |
| Diabetes mellitus | 0.019 | 0.757 | 0.279 | 0.07 | −0.088 | 0.363 |
| Arterial Hypertension | −0.076 | 0.225 | −0.155 | 0.321 | −0.093 | 0.334 |
| Cardiovascular Disease (all) | 0.008 | 0.899 | 0.256 | 0.098 | −0.079 | 0.412 |
| CVD-2 vessel | −0.008 | 0.897 | 0.09 | 0.565 | −0.009 | 0.928 |
| CVD-3 vessel | 0.047 | 0.447 | 0.168 | 0.283 | 0.136 | 0.158 |
| COPD | 0.171 | 0.006 | 0.144 | 0.355 | 0.092 | 0.339 |
| Myocardial infarction | 0.101 | 0.104 | 0.297 | 0.053 | 0.165 | 0.088 |
| Stroke | 0.009 | 0.884 | 0.135 | 0.386 | 0.055 | 0.572 |
| LVEF | −0.217 | 0.001 | 0.019 | 0.903 | −0.374 | <0.001 |
| LVEDD | 0.265 | <0.001 | 0.323 | 0.034 | 0.403 | <0.001 |
| LVESD | 0.251 | 0.001 | 0.266 | 0.117 | 0.302 | 0.006 |
| sPAP (echocardiography) | 0.274 | <0.001 | 0.112 | 0.508 | 0.175 | 0.098 |
| AVA | −0.071 | 0.281 | 0.222 | 0.162 | −0.134 | 0.181 |
| AV Vmax | −0.075 | 0.252 | −0.152 | 0.329 | −0.185 | 0.059 |
| AV dPmean | −0.029 | 0.65 | −0.151 | 0.332 | −0.171 | 0.082 |
| TAPSE | −0.102 | 0.108 | −0.072 | 0.644 | −0.194 | 0.058 |
| Mitral insufficiency ≥ II° | 0.175 | 0.006 | 0.33 | 0.033 | 0.063 | 0.521 |
| Tricuspid insufficiency ≥ II° | 0.211 | 0.001 | 0.455 | 0.003 | 0.074 | 0.469 |
| RA | 0.431 | <0.001 | 0.401 | 0.008 | 0.38 | <0.001 |
| RV | 0.276 | 0.001 | 0.222 | 0.158 | 0.221 | 0.027 |
| sPAP (RHC) | 0.312 | <0.001 | −0.008 | 0.959 | 0.282 | 0.003 |
| mPAP | 0.332 | <0.001 | −0.006 | 0.969 | 0.31 | 0.001 |
| dPAP | 0.342 | <0.001 | −0.182 | 0.244 | 0.347 | <0.001 |
| PAWP | 0.358 | <0.001 | −0.007 | 0.963 | 0.356 | <0.001 |
| LVEDP | 0.148 | 0.031 | −0.028 | 0.867 | 0.286 | 0.007 |
| Creatinine | 0.235 | <0.001 | 0.42 | 0.007 | 0.131 | 0.187 |
| CRP | 0.385 | <0.001 | 0.272 | 0.094 | 0.299 | 0.003 |
| Hb | −0.137 | 0.038 | −0.23 | 0.158 | 0.058 | 0.574 |
| BNP | 0.033 | 0.79 | 0.147 | 0.587 | 0.133 | 0.68 |
| 1-Year Mortality Cox Regression Analysis | Univariate | Multivariate | ||
|---|---|---|---|---|
| Hazard Ratio (95% CI) | p-Value | Hazard Ratio (95% CI) | p-Value | |
| Age | 1.003 (0.739–1.361) | 0.985 | - | |
| Weight | 0.859 (0.609–1.211) | 0.386 | ||
| BMI | 0.688 (0.463–1.023) | 0.065 | 0.790 (0.516–1.211) | 0.280 |
| NYHA ≥ III | 0.657 (0.233–1.852) | 0.427 | ||
| STS-Score | 1.395 (1.123–1.733) | 0.003 | 1.397 (1.073–1.821) | 0.013 |
| EuroScore | 0.923 (0.652–1.306) | 0.650 | ||
| Diabetes mellitus | 0.547 (0.271–1.103) | 0.092 | 0.304 (0.119–0.778) | 0.013 |
| Arterial Hypertension | 0.345 (0.047–2.516) | 0.294 | ||
| Cardiovascular Disease (all) | 0.891 (0.442–1.796) | 0.746 | ||
| CVD-2 vessels | 1.345 (0.414–4.374) | 0.622 | ||
| CVD-3 vessels | 1.494 (0.685–3.259) | 0.313 | ||
| COPD | 0.651 (0.328–1.290) | 0.218 | ||
| Myocardial infarction | 0.476 (0.225–1.006) | 0.052 | 0.904 (0.443–1.842) | 0.780 |
| LVEF | 0.770 (0.570–1.039) | 0.088 | 1.573 (0.891–2.777) | 0.118 |
| LVEDD | 1.485 (1.163–1.896) | 0.002 | 1.659 (1.158–2.377) | 0.006 |
| sPAP (echocardiography) | 1.474 (1.105–1.967) | 0.008 | 0.772 (0.412–1.446) | 0.419 |
| AVA | 0.885 (0.618–1.268) | 0.505 | ||
| AV Vmax | 0.394 (0.105–1.483) | 0.168 | ||
| AV dpmean | 0.778 (0.550–1.101) | 0.157 | ||
| Mitral insufficiency ≥ II° | 0.514 (0.265–1.000) | 0.050 | 1.627 (0.674–3.932) | 0.279 |
| Tricuspid insufficiency ≥ II° | 0.408 (0.195–0.855) | 0.017 | 0.677 (0.228–2.011) | 0.483 |
| RA | 1.318 (1.061–1.637) | 0.013 | 1.151 (0.602–2.200) | 0.670 |
| RV | 1.636 (1.187–2.255) | 0.003 | 0.888 (0.444–1.773) | 0.736 |
| sPAP (RHC) | 1.697 (1.276–2.257) | <0.001 | 0.404 (0.099–1.650) | 0.207 |
| mPAP | 1.832 (1.353–2.479) | <0.001 | 17.365 (5.757–52.381) | <0.001 |
| dPAP | 1.565 (1.157–2.116) | 0.004 | 0.140 (0.048–0.407) | <0.001 |
| PAWP | 1.359 (1.021–1.810) | 0.036 | 0.480 (0.251–0.916) | 0.026 |
| LVEDP | 1.045 (0.719–1.519) | 0.818 | ||
| Creatinine | 1.083 (0.852–1.375) | 0.515 | ||
| CRP | 1.242 (1.014–1.521) | 0.036 | 1.266 (0.816–1.965) | 0.293 |
| Hb | 0.942 (0.691–1.285) | 0.708 | ||
| BNP | 1.935 (0.825–4.540) | 0.129 | ||
| sST2 | 1.501 (1.214–1.855) | <0.001 | 1.914 (1.209–3.032) | 0.006 |
Publisher’s Note: MDPI stays neutral with regard to jurisdictional claims in published maps and institutional affiliations. |
© 2022 by the authors. Licensee MDPI, Basel, Switzerland. This article is an open access article distributed under the terms and conditions of the Creative Commons Attribution (CC BY) license (https://creativecommons.org/licenses/by/4.0/).
Share and Cite
Boxhammer, E.; Mirna, M.; Bäz, L.; Bacher, N.; Topf, A.; Sipos, B.; Franz, M.; Kretzschmar, D.; Hoppe, U.C.; Lauten, A.; et al. Soluble ST2 as a Potential Biomarker for Risk Assessment of Pulmonary Hypertension in Patients Undergoing TAVR? Life 2022, 12, 389. https://doi.org/10.3390/life12030389
Boxhammer E, Mirna M, Bäz L, Bacher N, Topf A, Sipos B, Franz M, Kretzschmar D, Hoppe UC, Lauten A, et al. Soluble ST2 as a Potential Biomarker for Risk Assessment of Pulmonary Hypertension in Patients Undergoing TAVR? Life. 2022; 12(3):389. https://doi.org/10.3390/life12030389
Chicago/Turabian StyleBoxhammer, Elke, Moritz Mirna, Laura Bäz, Nina Bacher, Albert Topf, Brigitte Sipos, Marcus Franz, Daniel Kretzschmar, Uta C. Hoppe, Alexander Lauten, and et al. 2022. "Soluble ST2 as a Potential Biomarker for Risk Assessment of Pulmonary Hypertension in Patients Undergoing TAVR?" Life 12, no. 3: 389. https://doi.org/10.3390/life12030389