
Using Non-Pharmaceutical Interventions and High Isolation of Asymptomatic Carriers to Contain the Spread of SARS-CoV-2 in Nursing Homes


Abstract
:1. Introduction
2. Materials and Methods
2.1. Mathematical Model
2.2. Baseline Scenario
2.2.1. NPI Categories 1–2
2.2.2. NPI Categories 3–4
2.2.3. NPI Category 5
2.3. Solving the Model
2.4. Sensitivity Analysis
3. Results
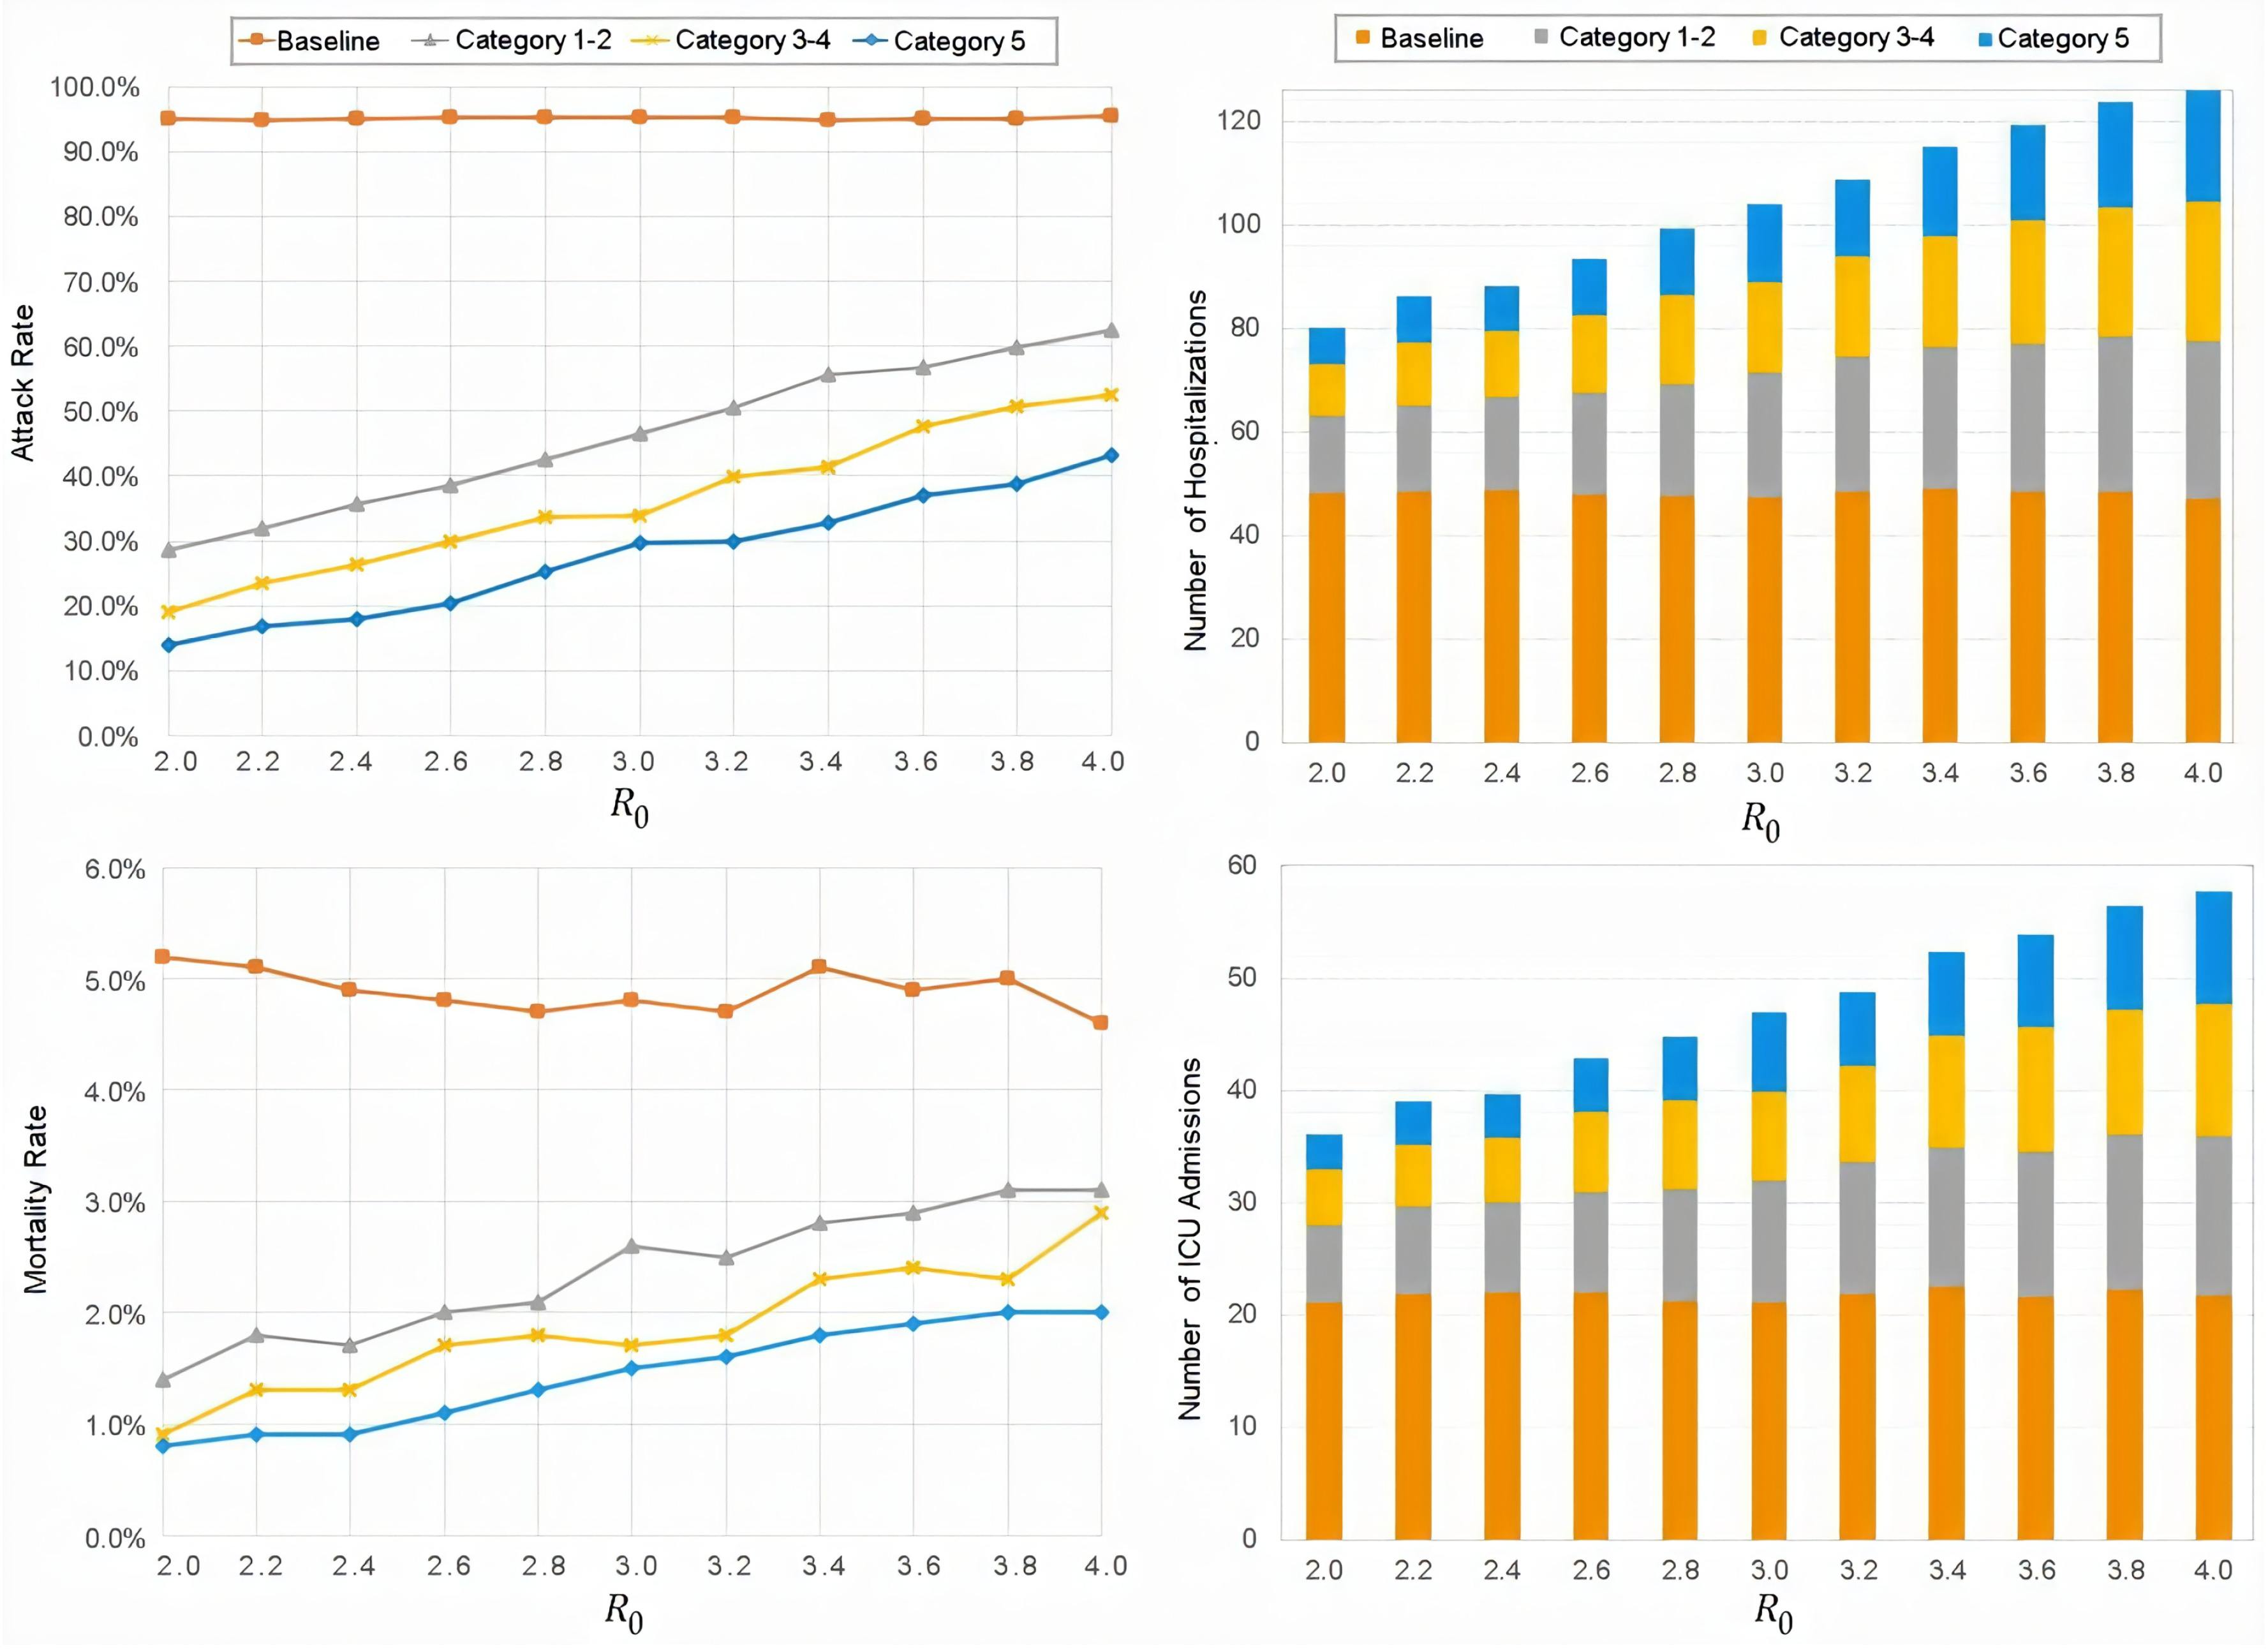
3.1. Attack Rate
3.2. Peak Infections and Peak Times
3.3. Sensitivity Analysis
4. Discussion
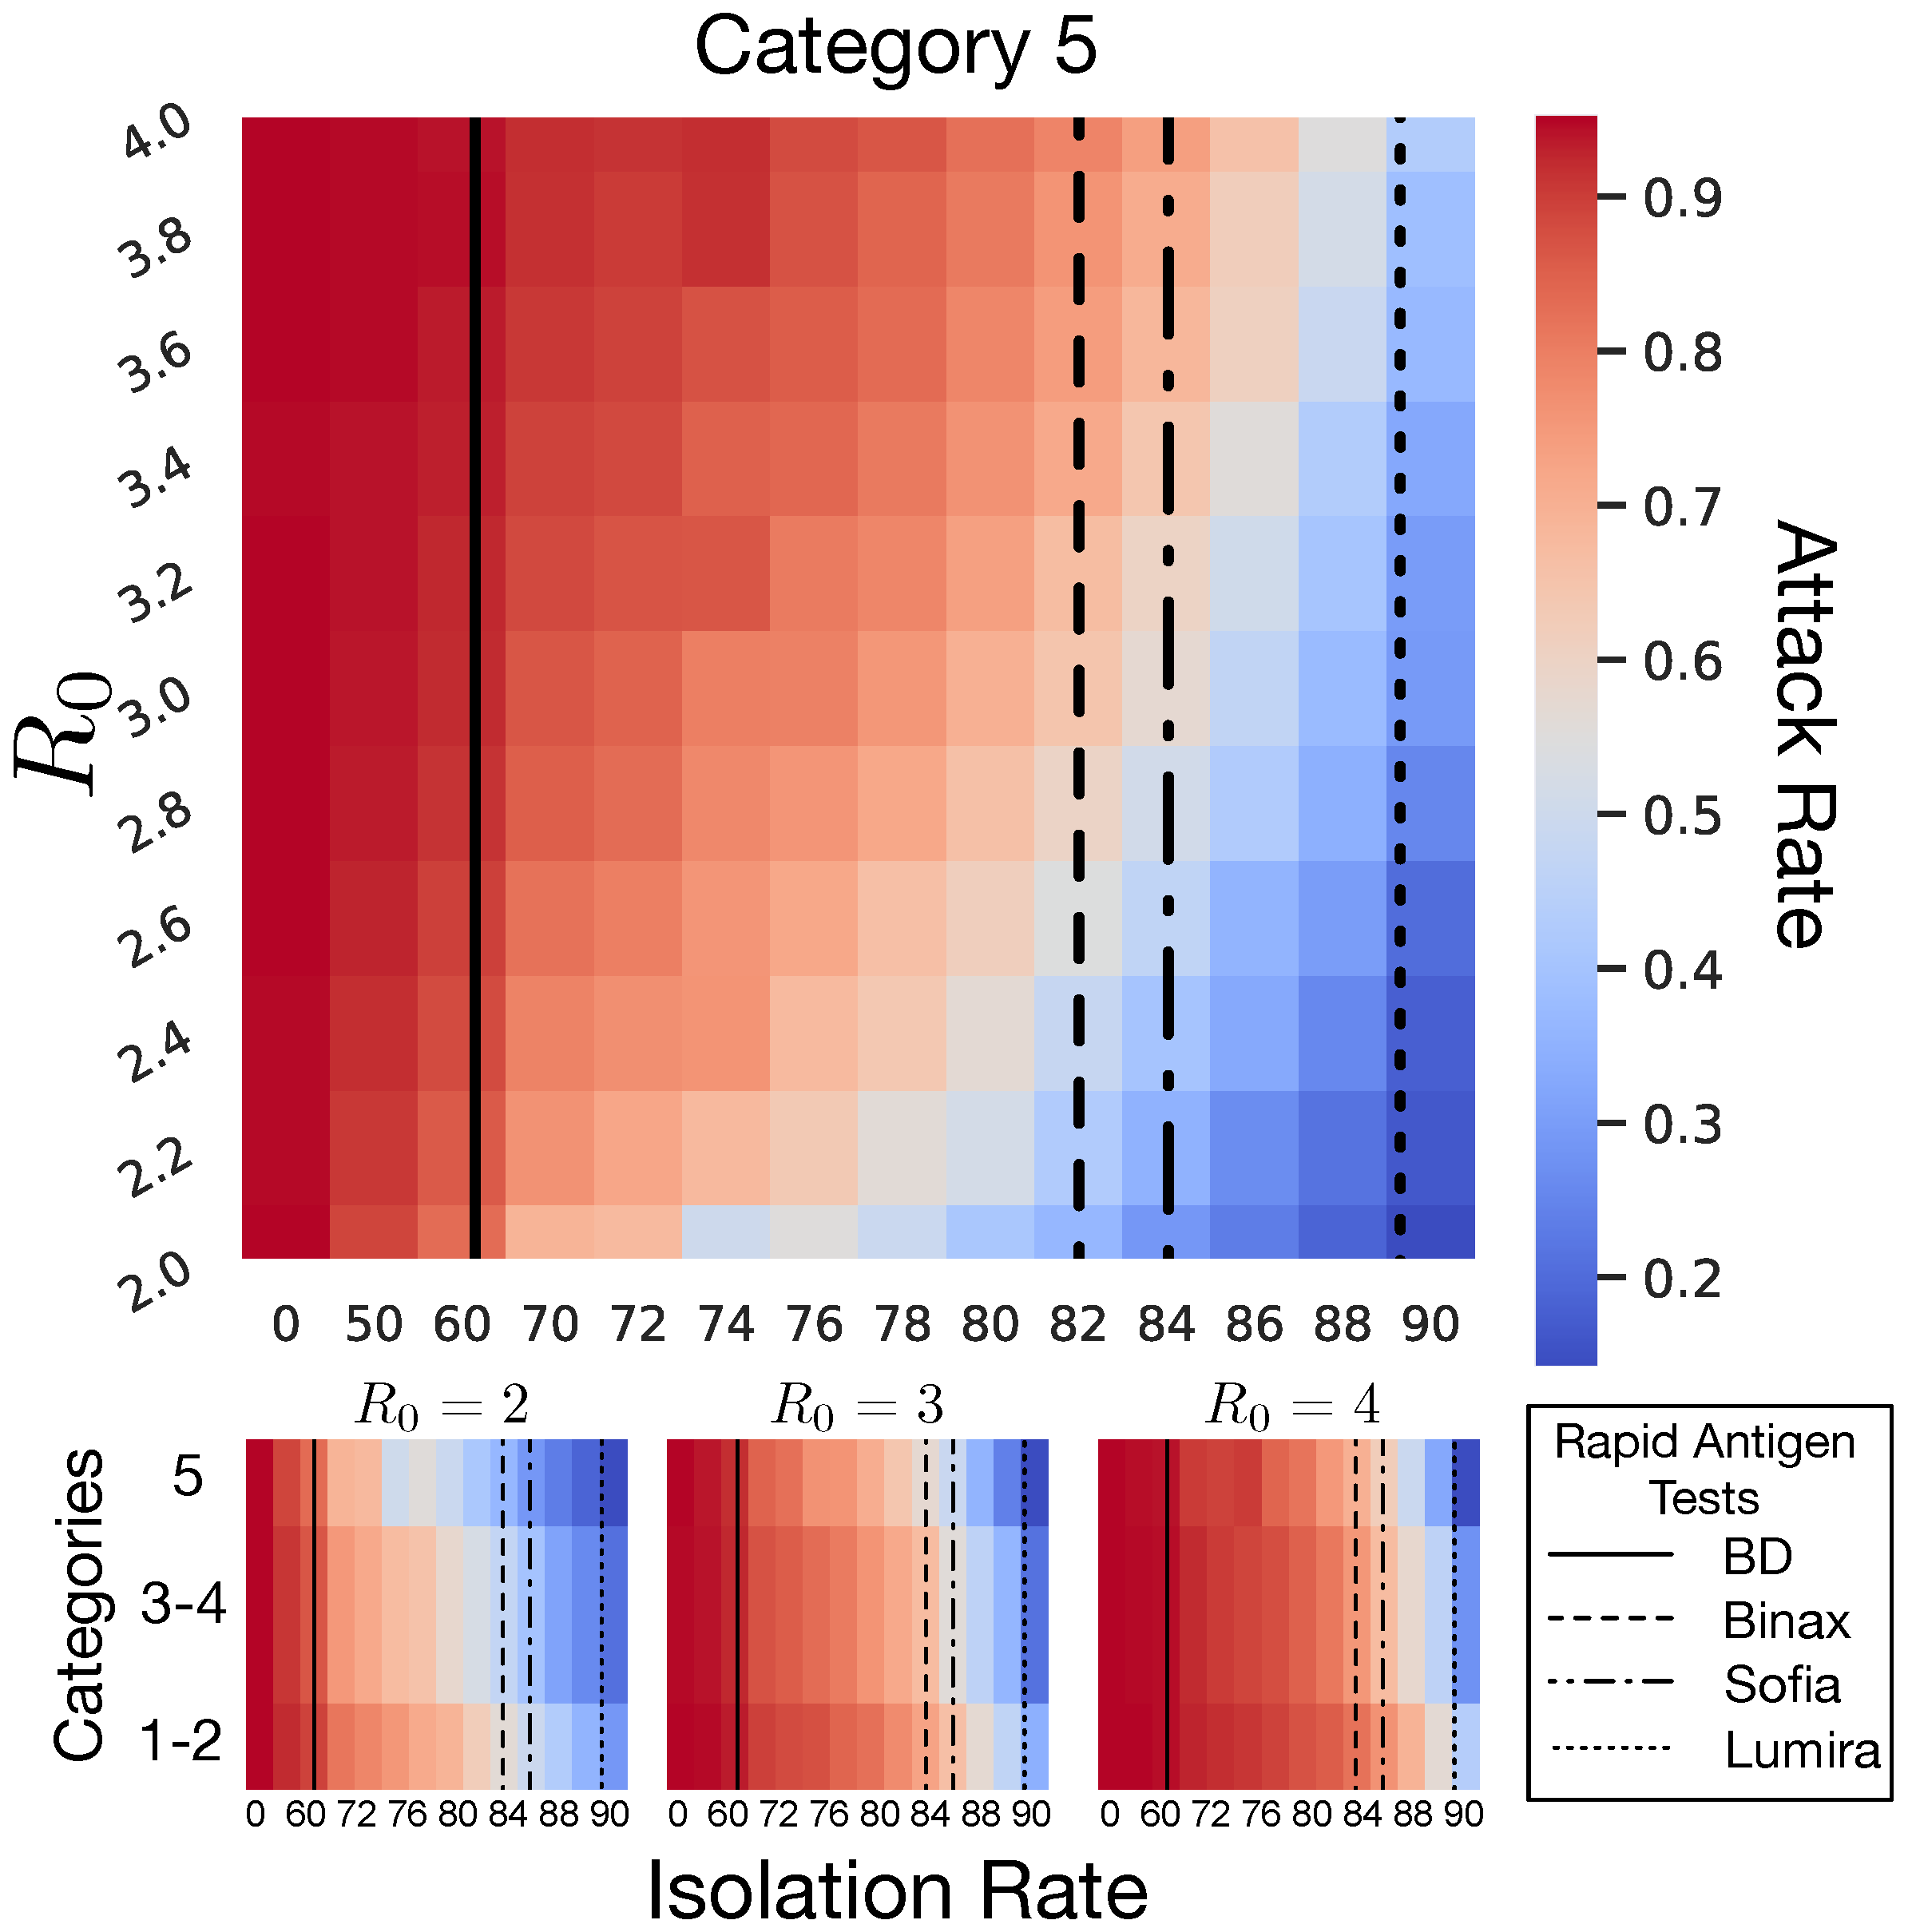
4.1. Isolation Rate and Rapid Antigen Tests
4.2. Conclusions
4.3. Limitations
Supplementary Materials
Author Contributions
Funding
Institutional Review Board Statement
Informed Consent Statement
Data Availability Statement
Acknowledgments
Conflicts of Interest
Abbreviations
| LTCF | long-term care facilities |
| NPI | non-pharmaceutical intervention |
| ICU | intensive care unit |
| WHO | World Health Organization |
| SARS | Severe Acute Respiratory Syndrome |
| MERS | Middle East Respiratory Syndrome |
| COVID-19 | Coronavirus Disease 2019 |
| SEIR | Susceptible-Exposed-Infected-Recovered |
| PPE | personal protective equipment |
References
- Surveillance of COVID-19 in Long-Term Care Facilities in the EU/EEA; Technical Report; European Centre for Disease Prevention and Control: Stockholm, Sweden, November 2021.
- Lee, J.; Shin, J.H.; Lee, K.H.; Harrington, C.A.; Jung, S.O. Staffing Levels and COVID-19 Infections and Deaths in Korean Nursing Homes. Policy Politics Nurs. Pract. 2021, 34939511. [Google Scholar] [CrossRef]
- Petriceks, A.H.; Olivas, J.C.; Srivastava, S. Trends in geriatrics graduate medical education programs and positions, 2001 to 2018. Gerontol. Geriatr. Med. 2018, 4, 2333721418777659. [Google Scholar] [CrossRef] [Green Version]
- Health Resources and Services Administration. National Center for Health Workforce Analysis (2017) National and Regional Projections of Supply and Demand for Geriatricians: 2013–2025; Health Resources and Services Administration (USDHHS): Rockville, MD, USA, 2016.
- Harris-Kojetin, L.D.; Sengupta, M.; Lendon, J.P.; Rome, V.; Valverde, R.; Caffrey, C. Long-term care providers and services users in the United States, 2015–2016; U.S. Department of Health and Human Services, Centers for Disease Control and Prevention, National Center for Health Statistics: Hyattsville, MD, USA, 2019.
- Society, A.G. American Geriatrics Society Policy Brief: COVID-19 and Nursing Homes. J. Am. Geriatr. Soc. 2020, 68, 908–911. [Google Scholar] [CrossRef]
- Barnett, M.L.; Grabowski, D.C. Nursing homes are ground zero for COVID-19 pandemic. JAMA Health Forum. Am. Med Assoc. 2020, 1, e200369. [Google Scholar] [CrossRef]
- McMichael, T.M. COVID-19 in a Long-Term Care Facility—King County, Washington, 27 February–9 March 2020. MMWR Morb. Mortal. Wkly. Rep. 2020, 69, 339. [Google Scholar] [CrossRef] [Green Version]
- Zhou, F.; Yu, T.; Du, R.; Fan, G.; Liu, Y.; Liu, Z.; Xiang, J.; Wang, Y.; Song, B.; Gu, X.; et al. Clinical course and risk factors for mortality of adult inpatients with COVID-19 in Wuhan, China: A retrospective cohort study. Lancet 2020, 395, 1054–1062. [Google Scholar] [CrossRef]
- Richardson, S.; Hirsch, J.S.; Narasimhan, M.; Crawford, J.M.; McGinn, T.; Davidson, K.W.; Barnaby, D.P.; Becker, L.B.; Chelico, J.D.; Cohen, S.L.; et al. Presenting characteristics, comorbidities, and outcomes among 5700 patients hospitalized with COVID-19 in the New York City area. JAMA 2020, 323, 2052–2059. [Google Scholar] [CrossRef]
- Garg, S. Hospitalization rates and characteristics of patients hospitalized with laboratory-confirmed coronavirus disease 2019—COVID-NET, 14 States, March 1–30, 2020. MMWR Morb. Mortal. Wkly. Rep. 2020, 69, 458. [Google Scholar] [CrossRef]
- Center for Diseases Control and Prevention. CDC COVID Data Tracker. 2020. Available online: https://www.cdc.gov/coronavirus/2019-ncov/cases-updates/cases-in-us.html (accessed on 25 May 2020).
- National Center for Health Statistics, Centers for Disease Control and Prevention. Weekly Updates by Select Demographic and Georgraphic Characteristics: Provisional Death Counts for Coronavirus Disease (COVID-19). 2020. Available online: https://www.cdc.gov/nchs/nvss/vsrr/covid_weekly/index.htm (accessed on 15 May 2020).
- Fineberg, H.V. Pandemic preparedness and response—Lessons from the H1N1 influenza of 2009. N. Engl. J. Med. 2014, 370, 1335–1342. [Google Scholar] [CrossRef] [Green Version]
- Qualls, N.; Levitt, A.; Kanade, N.; Wright-Jegede, N.; Dopson, S.; Biggerstaff, M.; Reed, C.; Uzicanin, A.; Group, C.C.M.G.W.; Group, C.C.M.G.W.; et al. Community mitigation guidelines to prevent pandemic influenza—United States, 2017. MMWR Recomm. Rep. 2017, 66, 1. [Google Scholar] [CrossRef]
- Jester, B.J.; Uyeki, T.M.; Patel, A.; Koonin, L.; Jernigan, D.B. 100 Years of medical countermeasures and pandemic influenza preparedness. Am. J. Public Health 2018, 108, 1469–1472. [Google Scholar] [CrossRef] [PubMed]
- Cox, N.J.; Trock, S.C.; Burke, S.A. Pandemic preparedness and the influenza risk assessment tool (IRAT). In Influenza Pathogenesis and Control-Volume I; Springer: Berlin/Heidelberg, Germany, 2014; pp. 119–136. [Google Scholar]
- Eccleston-Turner, M.; Phelan, A.; Katz, R. Preparing for the Next Pandemic-The WHO’s Global Influenza Strategy. N. Engl. J. Med. 2019, 381, 2192. [Google Scholar] [CrossRef] [PubMed]
- Mody, L.; Cinti, S. Pandemic influenza planning in nursing homes: Are we prepared? J. Am. Geriatr. Soc. 2007, 55, 1431–1437. [Google Scholar] [CrossRef] [PubMed]
- Smith, P.W.; Shostrom, V.; Al Smith, M.K.; Mody, L. Preparedness for pandemic influenza in nursing homes: A 2-state survey. JAMA 2008, 300, 392. [Google Scholar] [CrossRef]
- Lum, H.D.; Mody, L.; Levy, C.R.; Ginde, A.A. Pandemic influenza plans in residential care facilities. J. Am. Geriatr. Soc. 2014, 62, 1310–1316. [Google Scholar] [CrossRef] [Green Version]
- Nuño, M.; Reichert, T.A.; Chowell, G.; Gumel, A.B. Protecting residential care facilities from pandemic influenza. Proc. Natl. Acad. Sci. USA 2008, 105, 10625–10630. [Google Scholar] [CrossRef] [Green Version]
- Lauer, S.A.; Grantz, K.H.; Bi, Q.; Jones, F.K.; Zheng, Q.; Meredith, H.R.; Azman, A.S.; Reich, N.G.; Lessler, J. The incubation period of coronavirus disease 2019 (COVID-19) from publicly reported confirmed cases: Estimation and application. Ann. Intern. Med. 2020, 172, 577–582. [Google Scholar] [CrossRef] [Green Version]
- Linton, N.M.; Kobayashi, T.; Yang, Y.; Hayashi, K.; Akhmetzhanov, A.R.; Jung, S.m.; Yuan, B.; Kinoshita, R.; Nishiura, H. Incubation period and other epidemiological characteristics of 2019 novel coronavirus infections with right truncation: A statistical analysis of publicly available case data. J. Clin. Med. 2020, 9, 538. [Google Scholar] [CrossRef] [Green Version]
- Deng, Y.; You, C.; Liu, Y.; Qin, J.; Zhou, X.H. Estimation of incubation period and generation time based on observed length-biased epidemic cohort with censoring for COVID-19 outbreak in China. Biometrics 2020, 77, 929–941. [Google Scholar] [CrossRef]
- Li, Q.; Guan, X.; Wu, P.; Wang, X.; Zhou, L.; Tong, Y.; Ren, R.; Leung, K.S.; Lau, E.H.; Wong, J.Y.; et al. Early transmission dynamics in Wuhan, China, of novel coronavirus–infected pneumonia. N. Engl. J. Med. 2020. [Google Scholar] [CrossRef]
- Backer, J.A.; Klinkenberg, D.; Wallinga, J. Incubation period of 2019 novel coronavirus (2019-nCoV) infections among travellers from Wuhan, China, 20–28 January 2020. Eurosurveillance 2020, 25, 2000062. [Google Scholar] [CrossRef] [PubMed] [Green Version]
- Scopetti, M.; Santurro, A.; Tartaglia, R.; Frati, P.; Fineschi, V. Expanding frontiers of risk management: Care safety in nursing home during COVID-19 pandemic. Int. J. Qual. Health Care 2020, 33, mzaa085. [Google Scholar] [CrossRef] [PubMed]
- Tindale, L.C.; Stockdale, J.E.; Coombe, M.; Garlock, E.S.; Lau, W.Y.V.; Saraswat, M.; Zhang, L.; Chen, D.; Wallinga, J.; Colijn, C. Evidence for transmission of COVID-19 prior to symptom onset. Elife 2020, 9, e57149. [Google Scholar] [CrossRef] [PubMed]
- Du, Z.; Xu, X.; Wu, Y.; Wang, L.; Cowling, B.J.; Meyers, L.A. Serial interval of COVID-19 among publicly reported confirmed cases. Emerg. Infect. Dis. 2020, 26, 1341. [Google Scholar] [CrossRef] [PubMed]
- Ali, S.T.; Wang, L.; Lau, E.H.; Xu, X.K.; Du, Z.; Wu, Y.; Leung, G.M.; Cowling, B.J. Serial interval of SARS-CoV-2 was shortened over time by nonpharmaceutical interventions. Science 2020, 6507, 1106–1109. [Google Scholar] [CrossRef] [PubMed]
- Nishiura, H.; Linton, N.M.; Akhmetzhanov, A.R. Serial interval of novel coronavirus (COVID-19) infections. Int. J. Infect. Dis. 2020, 93, 284–286. [Google Scholar] [CrossRef] [PubMed]
- Arons, M.M.; Hatfield, K.M.; Reddy, S.C.; Kimball, A.; James, A.; Jacobs, J.R.; Taylor, J.; Spicer, K.; Bardossy, A.C.; Oakley, L.P.; et al. Presymptomatic SARS-CoV-2 infections and transmission in a skilled nursing facility. N. Engl. J. Med. 2020, 382, 2081–2090. [Google Scholar] [CrossRef]
- Blackman, C.; Farber, S.; Feifer, R.A.; Mor, V.; White, E.M. An Illustration of SARS-CoV-2 Dissemination Within a Skilled Nursing Facility Using Heat Maps. J. Am. Geriatr. Soc. 2020, 68, 2174–2178. [Google Scholar] [CrossRef] [PubMed]
- Goldberg, S.A.; Lennerz, J.; Klompas, M.; Mark, E.; Pierce, V.M.; Thompson, R.W.; Pu, C.T.; Ritterhouse, L.L.; Dighe, A.; Rosenberg, E.S.; et al. Presymptomatic transmission of SARS-CoV-2 amongst residents and staff at a skilled nursing facility: Results of real-time PCR and serologic testing. Clin. Infect. Dis. 2020. [Google Scholar] [CrossRef]
- Feaster, M.; Goh, Y.Y. High Proportion of Asymptomatic SARS-CoV-2 Infections in 9 Long-Term Care Facilities, Pasadena, California, USA, April 2020. Available online: https://wwwnc.cdc.gov/eid/article/26/10/20-2694_article?deliveryName=USCDC_333-DM32345 (accessed on 10 October 2020).
- Kimball, A.; Hatfield, K.M.; Arons, M.; James, A.; Taylor, J.; Spicer, K.; Bardossy, A.C.; Oakley, L.P.; Tanwar, S.; Chisty, Z.; et al. Asymptomatic and presymptomatic SARS-CoV-2 infections in residents of a long-term care skilled nursing facility—King County, Washington, March 2020. Morb. Mortal. Wkly. Rep. 2020, 69, 377. [Google Scholar] [CrossRef] [Green Version]
- Prem, K.; Liu, Y.; Russell, T.W.; Kucharski, A.J.; Eggo, R.M.; Davies, N.; Flasche, S.; Clifford, S.; Pearson, C.A.; Munday, J.D.; et al. The effect of control strategies to reduce social mixing on outcomes of the COVID-19 epidemic in Wuhan, China: A modelling study. Lancet Public Health 2020, 5, e261–e270. [Google Scholar] [CrossRef] [Green Version]
- Liu, Y.; Gayle, A.A.; Wilder-Smith, A.; Rocklöv, J. The reproductive number of COVID-19 is higher compared to SARS coronavirus. J. Travel Med. 2020, 1–4. [Google Scholar] [CrossRef] [Green Version]
- Centers for Disease Control and Prevention. Interim Clinical Guidance for Management of Patients with Confirmed Coronavirus Disease (COVID-19). 2020. Available online: https://www.cdc.gov/coronavirus/2019-ncov/hcp/clinical-guidance-management-patients.html#Sepsis (accessed on 10 October 2020).
- Wiersinga, W.J.; Rhodes, A.; Cheng, A.C.; Peacock, S.J.; Prescott, H.C. Pathophysiology, Transmission, Diagnosis, and Treatment of Coronavirus Disease 2019 (COVID-19): A Review. JAMA 2020, 324, 782–793. [Google Scholar] [CrossRef]
- Saey, T.H. Coronavirus Is Most Contagious before and during the First Week of Symptoms. Available online: https://www.sciencenews.org/article/coronavirus-most-contagious-before-during-first-week-symptoms/ (accessed on 10 October 2020).
- McIntosh, K.; Hirsch, M.; Bloom, A. Coronavirus Disease 2019 (COVID-19): Epidemiology, Virology, and Prevention; UpToDate: Waltham, MA, USA, 2020; Volume 15. [Google Scholar]
- Chu, D.; Akl, E.; El-Harakeh, A.; Bognanni, A.; Lotf, T.; Loeb, M.; Hajizadeh, A.; Bak, A.; Izcovich, A.; Cuello-Garcia, C.A.; et al. Physical Distancing, Face Masks, and Eye Protection to Prevent Person-Person COVID-19 Transmission: A Systematic Review and Meta-Analysis. Lancet 2020, 395, 1973–1987. [Google Scholar] [CrossRef]
- Ngonghala, C.N.; Iboi, E.; Eikenberry, S.; Scotch, M.; MacIntyre, C.R.; Bonds, M.H.; Gumel, A.B. Mathematical assessment of the impact of non-pharmaceutical interventions on curtailing the 2019 novel Coronavirus. Math. Biosci. 2020, 325, 108364. [Google Scholar] [CrossRef]
- van der Sande, M.; Teunis, P.; Sabel, R. Professional and home-made face masks reduce exposure to respiratory infections among the general population. PLoS ONE 2008, 3, e2618. [Google Scholar] [CrossRef] [Green Version]
- Li, T.; Liu, Y.; Li, M.; Qian, X.; Dai, S.Y. Mask or no mask for COVID-19: A public health and market study. PLoS ONE 2020, 15, e0237691. [Google Scholar] [CrossRef]
- Li, R.; Pei, S.; Chen, B.; Song, Y.; Zhang, T.; Yang, W.; Shaman, J. Substantial undocumented infection facilitates the rapid dissemination of novel coronavirus (SARS-CoV-2). Science 2020, 368, 489–493. [Google Scholar] [CrossRef] [Green Version]
- Yang, R.; Gui, X.; Xiong, Y. Comparison of clinical characteristics of patients with asymptomatic vs symptomatic coronavirus disease 2019 in Wuhan, China. JAMA Netw. Open 2020, 3, e2010182. [Google Scholar] [CrossRef]
- Moghadas, S.M.; Fitzpatrick, M.C.; Sah, P.; Pandey, A.; Shoukat, A.; Singer, B.H.; Galvani, A.P. The implications of silent transmission for the control of COVID-19 outbreaks. Proc. Natl. Acad. Sci. USA 2020, 117, 17513–17515. [Google Scholar] [CrossRef] [PubMed]
- Yin, G.; Jin, H. Comparison of transmissibility of coronavirus between symptomatic and asymptomatic patients: Reanalysis of the Ningbo Covid-19 data. JMIR Public Health Surveill. 2020, 6, e19464. [Google Scholar] [CrossRef] [PubMed]
- Hellewell, J.; Abbott, S.; Gimma, A.; Bosse, N.I.; Jarvis, C.I.; Russell, T.W.; Munday, J.D.; Kucharski, A.J.; Edmunds, W.J.; Sun, F.; et al. Feasibility of controlling COVID-19 outbreaks by isolation of cases and contacts. Lancet Glob. Health 2020, 8, e488–e496. [Google Scholar] [CrossRef] [Green Version]
- Gustafsson, L. Poisson simulation—A method for generating stochastic variations in continuous system simulation. Simulation 2000, 74, 264–274. [Google Scholar] [CrossRef]
- Wu, J.; Dhingra, R.; Gambhir, M.; Remais, J.V. Sensitivity analysis of infectious disease models: Methods, advances and their application. J. R. Soc. Interface 2013, 10, 20121018. [Google Scholar] [CrossRef] [Green Version]
- Matrajt, L.; Leung, T. Evaluating the effectiveness of social distancing interventions to delay or flatten the epidemic curve of coronavirus disease. Emerg. Infect. Dis. 2020, 26, 1740. [Google Scholar] [CrossRef] [PubMed]
- Miller, I.F.; Becker, A.D.; Grenfell, B.T.; Metcalf, C.J.E. Disease and healthcare burden of COVID-19 in the United States. Nat. Med. 2020, 26, 1212–1217. [Google Scholar] [CrossRef]
- Davies, N.G.; Kucharski, A.J.; Eggo, R.M.; Gimma, A.; Edmunds, W.J.; Jombart, T.; O’Reilly, K.; Endo, A.; Hellewell, J.; Nightingale, E.S.; et al. Effects of non-pharmaceutical interventions on COVID-19 cases, deaths, and demand for hospital services in the UK: A modelling study. Lancet Public Health 2020, 5, e375–e385. [Google Scholar] [CrossRef]
- Dora, A.V.; Winnett, A.; Jatt, L.P.; Davar, K.; Watanabe, M.; Sohn, L.; Kern, H.S.; Graber, C.J.; Goetz, M.B. Universal and serial laboratory testing for SARS-CoV-2 at a long-term care skilled nursing facility for veterans—Los Angeles, California, 2020. Morb. Mortal. Wkly. Rep. 2020, 69, 651. [Google Scholar] [CrossRef]
- Diez Flecha, C.; Rivero Rodríguez, A.; Fernández-Villa, T.; Fernández García, P.; Ferreira de Jesús, J.; Sánchez Antolín, G. Equipo Covid-19 de la Gerencia de Atención Primaria de León. Internal validity of a rapid test for COVID-19 antigens in a nursing home. Semergen 2021, 47, 332–336. [Google Scholar] [CrossRef]
- Song, R.; Kim, H.S.; Yoo, S.J.; Lee, K.; Park, J.H.; Jang, J.H.; Ahn, G.S.; Kim, J.N. COVID-19 in Nursing Facilities: Experience in Republic of Korea. Onsong Public Health Res. Perspect. 2020, 11, 164–169. [Google Scholar] [CrossRef]
- Kim, J.H.; Ah-Reum An, J.; Min, P.k.; Bitton, A.; Gawande, A.A. How South Korea Responded to the Covid-19 Outbreak in Daegu. NEJM Catalyst 2020, 1, 1–14. [Google Scholar] [CrossRef]
- Sarabia-Cobo, C.; Pérez, V.; de Lorena, P.; Hermosilla-Grijalbo, C.; Sáenz-Jalón, M.; Fernández-Rodríguez, A.; Alconero-Camarero, A.R. Experiences of geriatric nurses in nursing home settings across four countries in the facce of the COVID-19 pandemic. J. Adv. Nurs. 2021, 2, 869–878. [Google Scholar] [CrossRef] [PubMed]


| Variables | Parameters | Values | References |
|---|---|---|---|
| Basic reproduction number | 2.0–4.0 | [39] | |
| Average latency period | 5.0 days | [23,40,41] | |
| Average recovery period for asymptomatic/symptomatic | 14 days | [42,43] | |
| Transmission reduction for social use of face mask | (1–0.146) | [44,45,46,47] | |
| Rate at which a symptomatic person requires hospitalization | 0.16/4 | [40,41] | |
| Rate at which a hospitalized person requires an ICU | 0.32/4 | [40,41] | |
| Average number of days a person remains hospitalized (in ward) | 1/11 | [40,41] | |
| Average days that a person stays in ICU | 1/12 | [40,41] | |
| Mortality rate in hospitalization | 0.15/11 | [40,41] | |
| ICU mortality rate | 0.33/12 | [40,41] | |
| Estimated | |||
| m | Fraction of exposed that progress to infection | 0.667 | |
| Probability of having asymptomatic escape monitoring efforts | 1 | ||
| Transmission rate | |||
| Proportion of people who do not isolate themselves and continue to contribute to new infections | |||
| Epidemiological Classes | Initial Population Size | ||
| ; ; ; ; ; | 50,000; 200; 27; 13; 8; 75 | ||
| ; ; | 1; 0; 1; 0; 1; 0 | ||
| 1; 0; 1; 0; 1;0 | |||
| 0; 0 | |||
| 0; 0; | |||
| The subscripts C, S, and V are for general community, staff and visitors. | |||
| and correspond to staff and visitors inside the facility. | |||
| and are for Staff and visitors outside the nursing home (in the community). | |||
| Baseline | Category 1–2 | |||||||||
|---|---|---|---|---|---|---|---|---|---|---|
| Epidemic Size | Hospitalization | ICU | Death | Staff | Epidemic Size | Hospitalization | ICU | Death | Staff | |
| 2.0 | (188, 190, 196) | (45, 48, 61) | (18, 21, 30) | (8, 10, 17) | (25, 28, 36) | (48, 57, 81) | (11, 15, 24) | (5, 7, 13) | (2, 3, 6) | (25, 28, 36) |
| 2.2 | (187, 190, 196) | (44, 48, 64) | (19, 22, 31) | (8, 10,18) | (25, 29, 36) | (54, 64, 86) | (13, 17 25) | (6, 8, 15) | (2, 4, 7) | (26, 28, 37) |
| 2.4 | (188, 190, 196) | (44, 49, 62) | (19, 22, 30) | (8, 10, 16) | (26, 28, 36) | (61, 71, 96) | (14, 18, 28) | (6, 8, 15) | (2, 3, 8) | (25, 28, 36) |
| 2.6 | (189, 190, 195) | (44, 48, 58) | (19, 22, 31) | (8, 10, 14) | (25, 29, 39) | (69, 77, 102) | (16, 20, 32) | (6, 9, 16) | (2, 4, 9) | (26, 28, 37) |
| 2.8 | (189, 191, 195) | (43, 47, 59) | (18, 21, 30) | (7, 9, 16) | (25, 28, 38) | (77, 85, 109) | (18, 22, 33) | (7, 10, 18) | (3, 4, 10) | (25, 28, 38) |
| 3.0 | (189, 190, 196) | (44, 47, 57) | (18, 21, 33) | (8, 10, 16) | (26, 28, 36) | (82, 93, 122) | (20, 24, 34) | (8, 11, 18) | ( 4, 5, 10) | (25, 28, 35) |
| 3.2 | (189, 191, 196) | (45, 48, 63) | (19, 22, 31) | (8, 9, 15) | (26, 29, 37) | (92, 101, 129) | (23, 26, 39) | (9, 12, 20) | (4, 5, 10) | (25, 28, 36) |
| 3.4 | (187, 190, 196) | (45, 49, 61) | (20, 22, 34) | (8, 10, 17) | (26, 29, 36) | (102, 111, 140) | (24, 28, 38) | (10, 12, 19) | (4, 6, 11) | (26, 29, 39) |
| 3.6 | (188, 190, 195) | (45, 48, 62) | (19, 22, 30) | (7, 10, 17) | (25, 28, 37) | (105, 113, 137) | (25, 29, 41) | (10, 13, 20) | (4, 6, 11) | (26, 29, 38) |
| 3.8 | (188, 190, 195) | (45, 49, 60) | (19, 22, 30) | (8, 10, 16) | (25, 28, 37) | (112, 120, 141) | (26, 30, 41) | (11, 14, 21) | (4, 6, 12) | (26, 29, 37) |
| 4.0 | (189, 191, 195) | (42, 47, 57) | (19, 22, 29) | (7, 9, 15) | (26, 29, 39) | (117, 125, 150) | (26, 31, 42) | (12, 14, 21) | (4, 6, 12) | (26, 29, 35) |
| Category 3–4 | Category 5 | |||||||||
| Epidemic Size | Hospitalization | ICU | Death | Staff | Epidemic Size | Hosp | ICU | Death | Staff | |
| 2.0 | (30, 38, 62) | (7, 10, 17) | (3, 5, 10) | (1, 2, 5) | (40, 43, 54) | (22, 28, 46) | (5, 7, 13) | (2, 3, 7) | (1, 2, 4) | (39, 42, 50) |
| 2.2 | (38, 47, 71) | (9, 12, 21) | (4, 6, 12) | (1, 3, 6) | (39, 42, 49) | (24, 34, 58) | (6, 9, 18) | (2, 4, 9) | (1, 2, 5) | (39, 42, 52) |
| 2.4 | (44, 53, 84) | (10, 13, 21) | (4, 6, 11) | (1, 3, 6) | ( 40, 42, 52) | (27, 36, 54) | (6, 9, 17) | (2, 4, 10) | (1, 2, 6) | (39, 42, 51) |
| 2.6 | (50, 60, 87) | (12, 15, 24) | (5, 7, 14) | (2, 3, 8) | ( 40, 43, 50) | (32, 41, 71) | (8, 11, 20) | (3, 5, 10) | (1, 2, 6) | (38, 42, 51) |
| 2.8 | (57, 67, 96) | (14, 17, 27) | (5, 8, 15) | (2, 4, 9) | (40, 43, 51) | (39, 51, 80) | (8, 13, 25) | (3, 6, 14) | (1, 3, 7) | (39, 43, 51) |
| 3.0 | (58, 68, 98) | (14, 18, 28) | (6, 8, 14) | (2, 3, 8) | (40, 42, 52) | (48, 59, 97) | (11, 15, 26) | (5, 7, 15) | (2, 3, 9) | (39, 42, 51) |
| 3.2 | (69, 80, 110) | (16, 19, 30) | (7, 9, 14) | (2, 4, 8) | ( 40, 43, 51) | (49, 60, 97) | (10, 15, 25) | (5, 7, 12) | (2, 3, 7) | (39, 42, 52) |
| 3.4 | (73, 83, 112) | (17, 21, 35) | (7, 10, 19) | (3, 5, 10) | (39, 43, 51) | (50, 66, 100) | (13, 17, 28) | (5, 7, 15) | (2, 4, 8) | (39, 43, 55) |
| 3.6 | (83, 95, 130) | (20, 24, 35) | (9, 11, 18) | (3, 5, 9) | (40, 43, 51) | (63, 74.2, 111) | (15, 18, 30) | (6, 8, 15) | (2, 4, 8) | (40, 43, 52) |
| 3.8 | (86, 102, 142) | (21, 25, 36) | (9, 11, 19) | (3, 5, 11) | (39, 43, 52) | (68, 78, 110) | (16, 20, 35) | (7, 9, 16) | (3, 4, 10) | (40, 42, 51) |
| 4.0 | (97, 105, 134) | (24, 27, 40) | (10, 12, 18) | (4, 6, 11) | (40, 43, 52) | (77, 86, 118) | (17, 21, 36) | (7, 10, 18) | (2, 4, 8) | (40, 43, 52) |
Publisher’s Note: MDPI stays neutral with regard to jurisdictional claims in published maps and institutional affiliations. |
© 2022 by the authors. Licensee MDPI, Basel, Switzerland. This article is an open access article distributed under the terms and conditions of the Creative Commons Attribution (CC BY) license (https://creativecommons.org/licenses/by/4.0/).
Share and Cite
Schmidt, A.J.; García, Y.; Pinheiro, D.; Reichert, T.A.; Nuño, M. Using Non-Pharmaceutical Interventions and High Isolation of Asymptomatic Carriers to Contain the Spread of SARS-CoV-2 in Nursing Homes. Life 2022, 12, 180. https://doi.org/10.3390/life12020180
Schmidt AJ, García Y, Pinheiro D, Reichert TA, Nuño M. Using Non-Pharmaceutical Interventions and High Isolation of Asymptomatic Carriers to Contain the Spread of SARS-CoV-2 in Nursing Homes. Life. 2022; 12(2):180. https://doi.org/10.3390/life12020180
Chicago/Turabian StyleSchmidt, Alec J., Yury García, Diego Pinheiro, Thomas A. Reichert, and Miriam Nuño. 2022. "Using Non-Pharmaceutical Interventions and High Isolation of Asymptomatic Carriers to Contain the Spread of SARS-CoV-2 in Nursing Homes" Life 12, no. 2: 180. https://doi.org/10.3390/life12020180