
Hyperoxia Inhibits Proliferation of Retinal Endothelial Cells in a Myc-Dependent Manner

 , and
, and 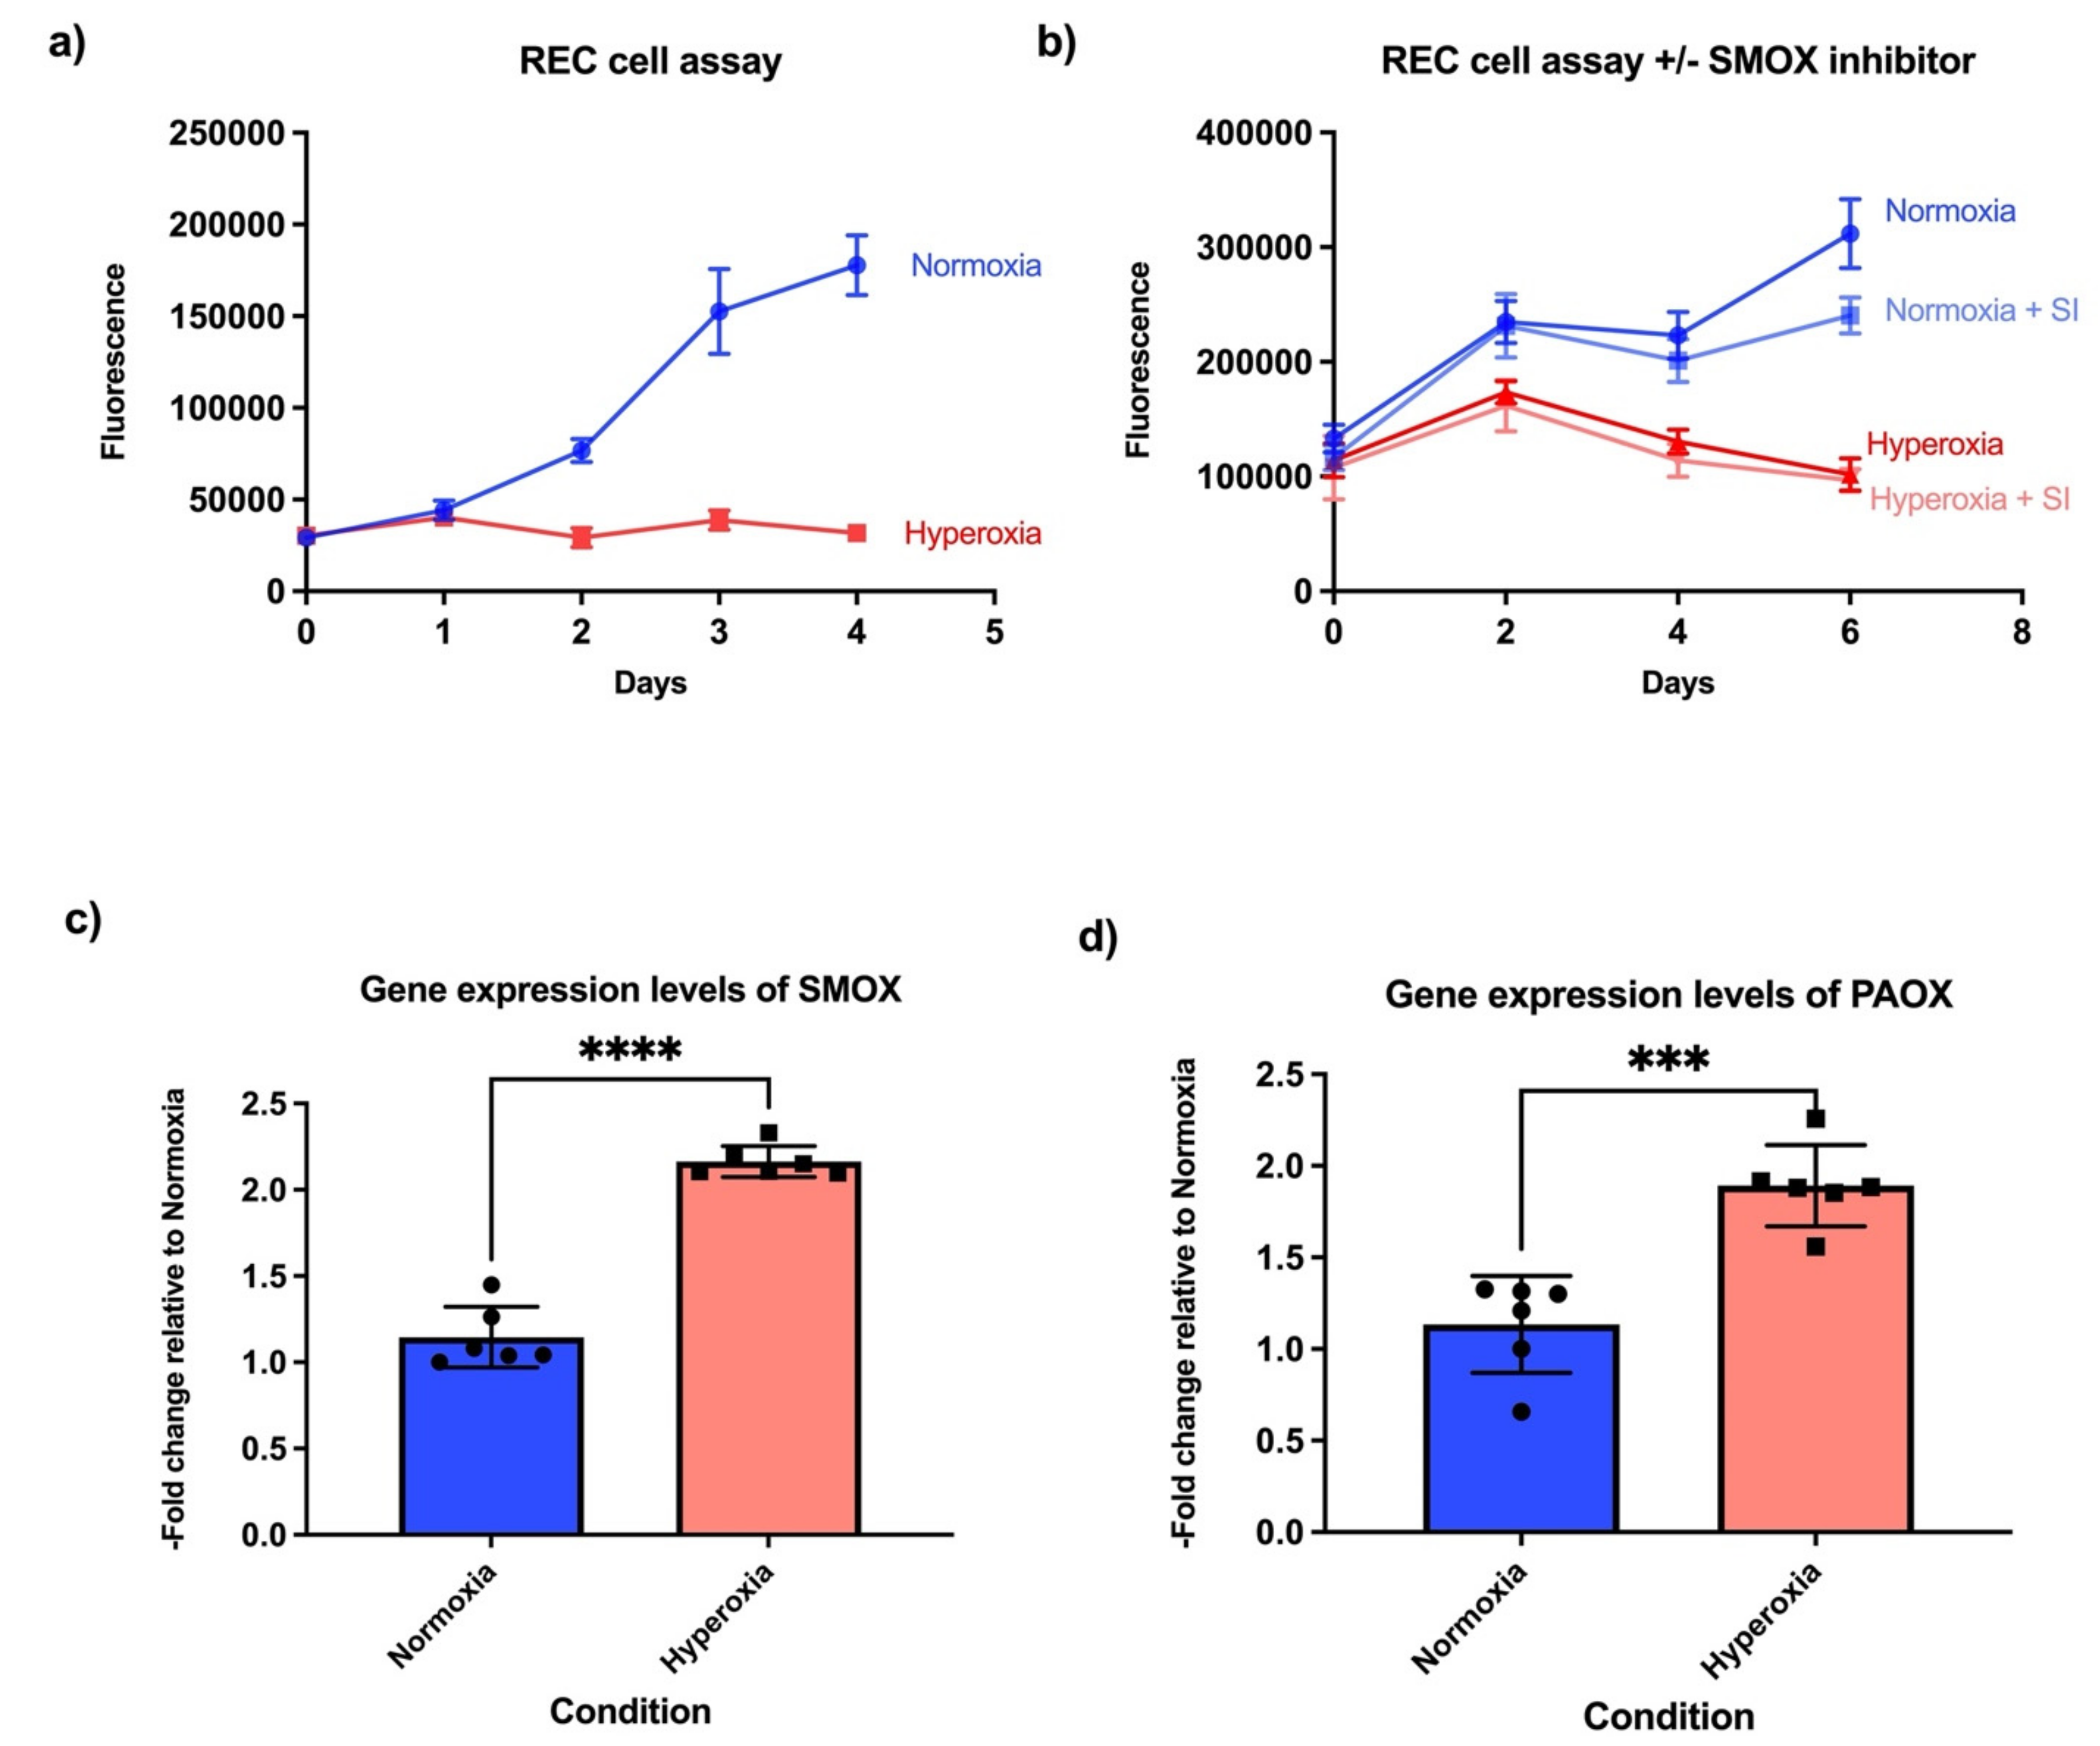
Abstract
:1. Introduction
2. Results
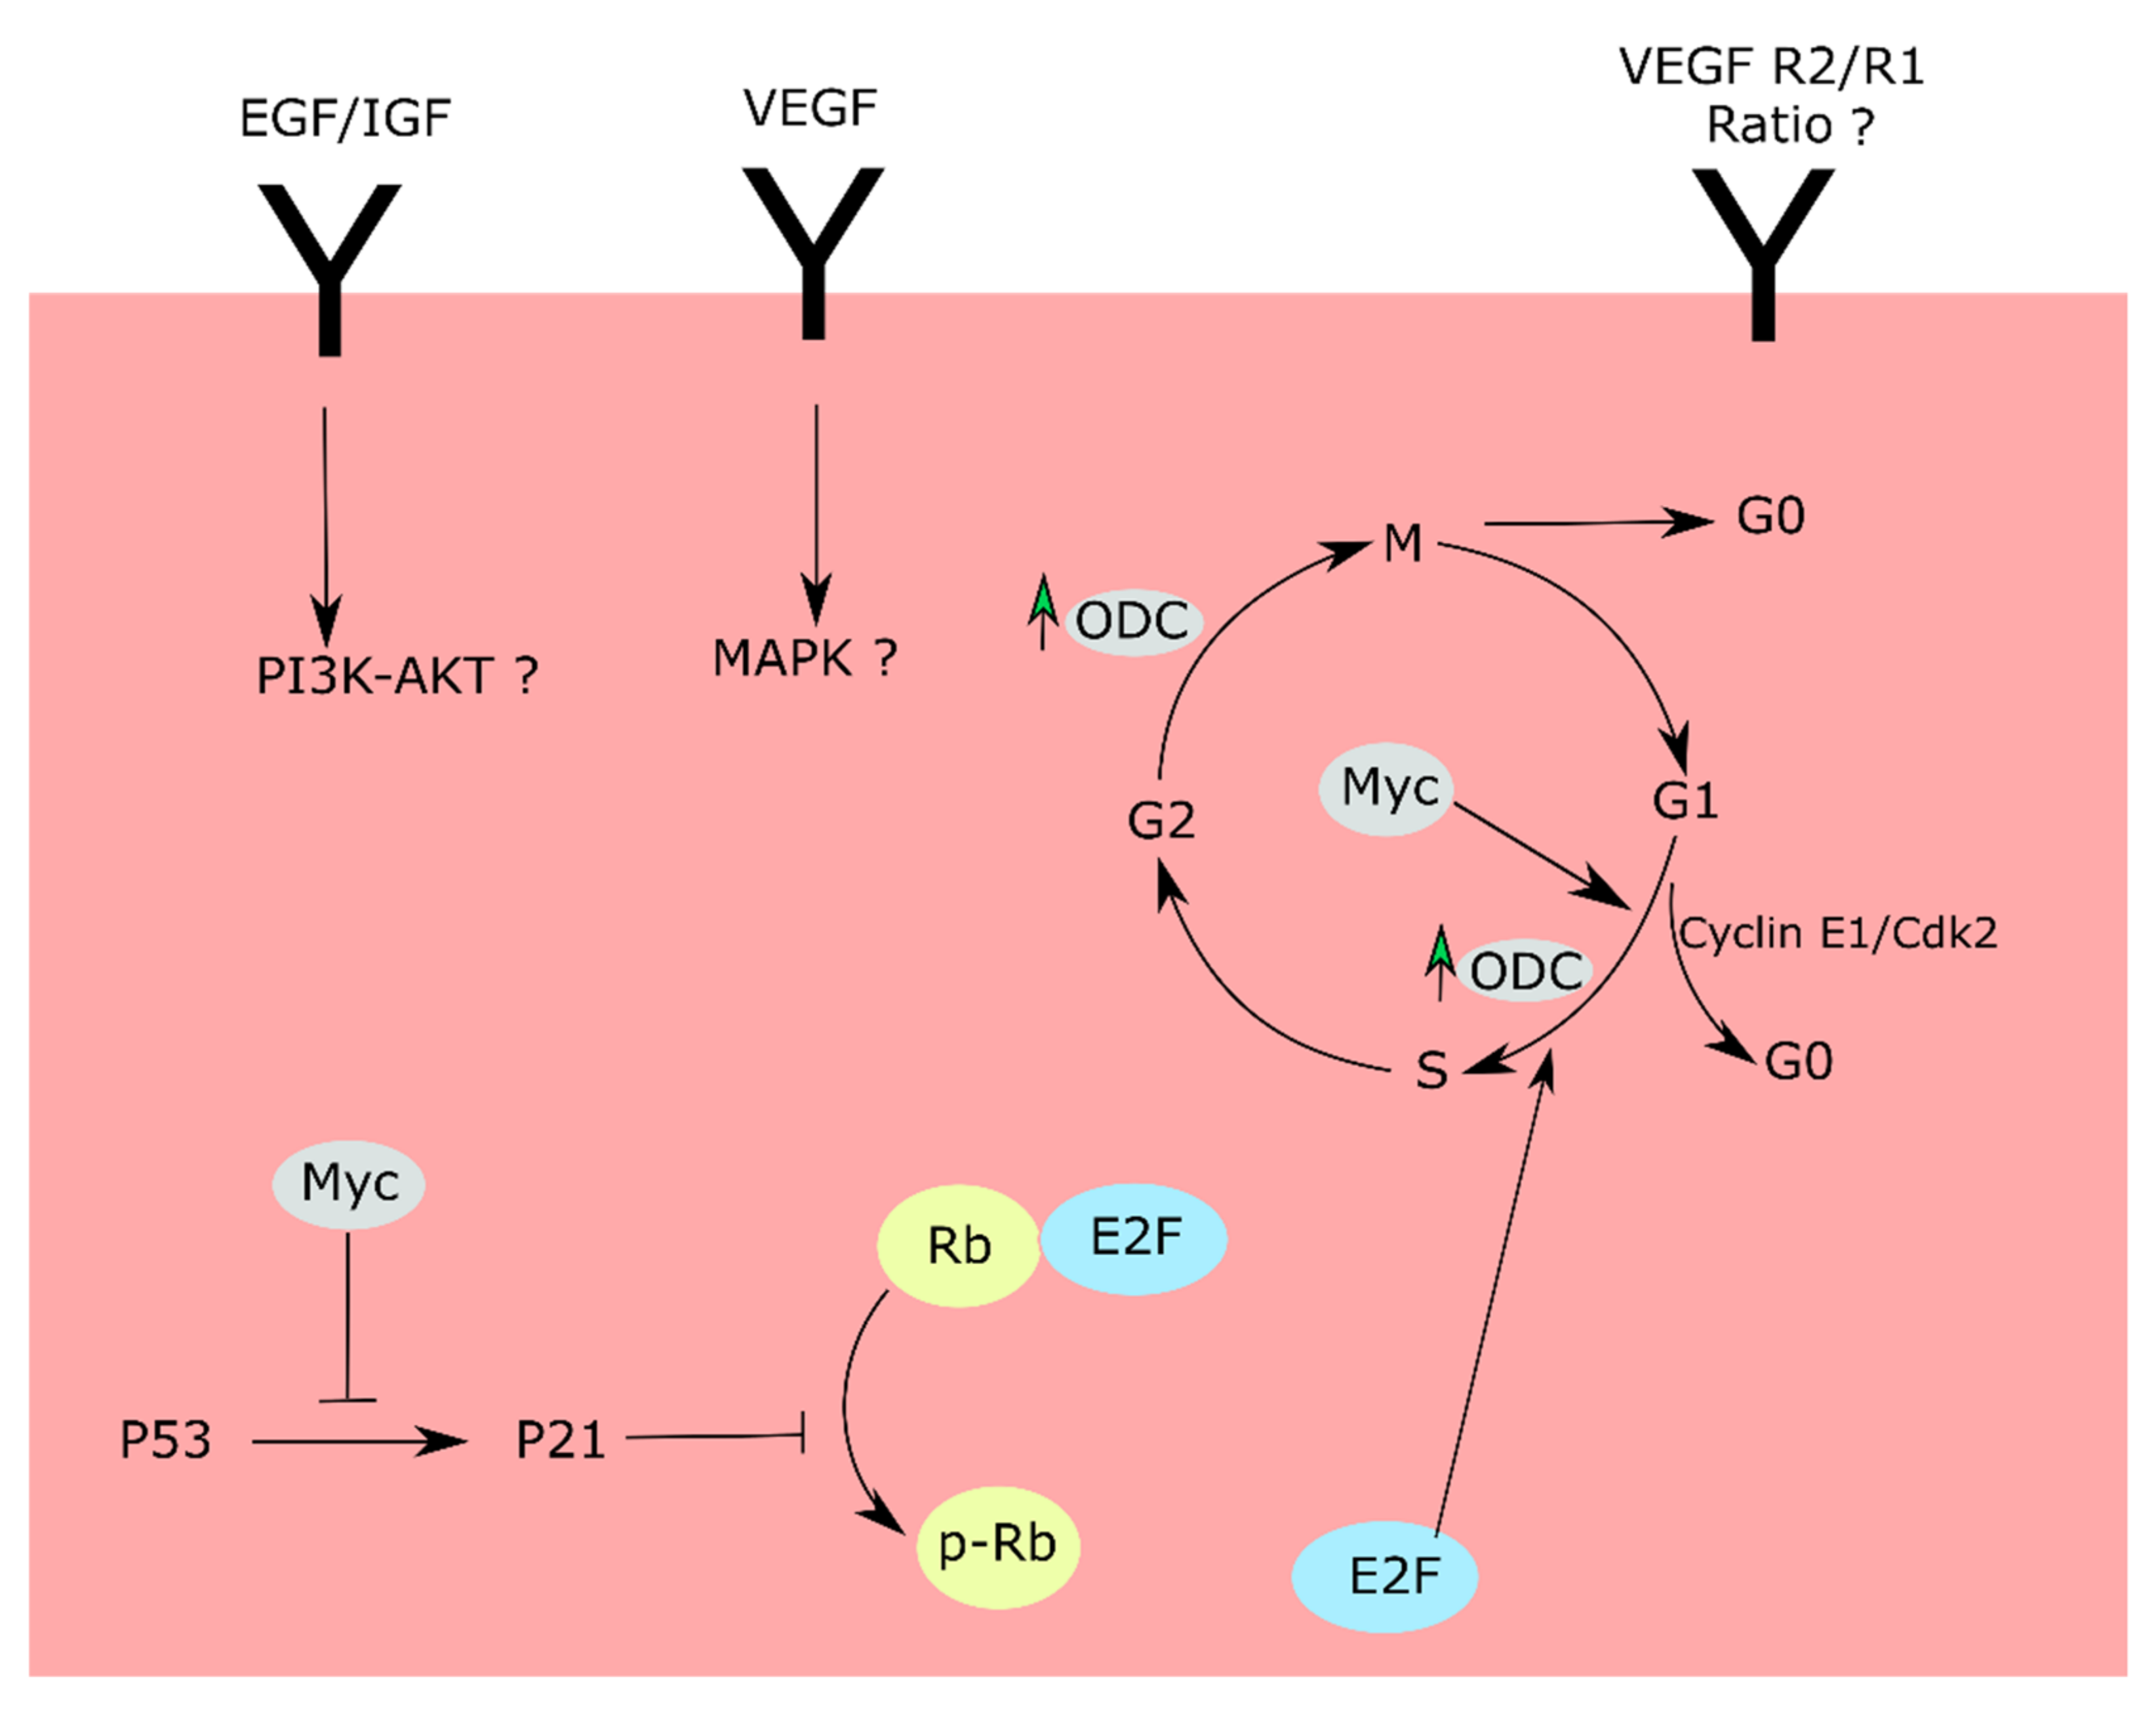
3. Discussion
4. Materials and Methods
4.1. Cell Proliferation Assay
4.2. Edu and Hoechst Staining
4.3. Protein Extraction from Cultured Cells
4.4. SDS-PAGE and Western Blotting
- (1)
- c-Myc (D84C12) Rabbit mAb catalog # 5605
- (2)
- Phospho-Rb (Ser 807/811) (D20B12) XP® Rabbit mAb catalog # 8516
- (3)
- Phospho-Rb (Ser 795) Rabbit antibody catalog # 9301
- (4)
- p21 Waf1/Cip1 (12D1) Rabbit mAb catalog # 2947
- (5)
- p53 Rabbit antibody catalog # 9282
- (6)
- βactin (8H10D10) Mouse mAb catalog # 3700
- (1)
- IRDye® 800CW Donkey (polyclonal) anti-Rabbit IgG (H+L), catalog number 925-32213 from LI-COR (Lincoln, NE, USA).
- (2)
- IRDye® 680RD Donkey (polyclonal) anti-mouse IgG (H+L), catalog number 925-68072 from LI-COR (Lincoln, NE, USA).
4.5. RNA Extraction and Quantitative RT-PCR
| SMOX Fwd 5′-TCAAAGACAGCGCCCAT-3′ | SMOX Rev 5′-CCGTGGGTGGTGGAATAGTA-3′ |
| PAOX Fwd 5′-ACTAGGGGGTCCTACAGCTA-3′ | PAOX Rev 5‘-CGTGGAGTAAAACGTGCGAT-3′ |
4.6. Metabolite Extraction
4.7. Statistical Analysis
Supplementary Materials
Author Contributions
Funding
Institutional Review Board Statement
Conflicts of Interest
References
- Sears, J.E.; Hoppe, G.; Ebrahem, Q.; Anand-Apte, B. Prolyl hydroxylase inhibition during hyperoxia prevents oxygen-induced retinopathy. Proc. Natl. Acad. Sci. USA 2008, 105, 19898–19903. [Google Scholar] [CrossRef] [Green Version]
- Hoppe, G.; Yoon, S.; Gopalan, B.; Savage, A.R.; Brown, R.; Case, K.; Vasanji, A.; Chan, E.R.; Silver, R.B.; Sears, J.E. Comparative systems pharmacology of HIF stabilization in the prevention of retinopathy of prematurity. Proc. Natl. Acad. Sci. USA 2016, 113, E2516–E2525. [Google Scholar] [CrossRef] [PubMed] [Green Version]
- Blencowe, H.; Lawn, J.E.; Vazquez, T.; Fielder, A.; Gilbert, C. Preterm-associated visual impairment and estimates of retinopathy of prematurity at regional and global levels for 2010. Pediatr. Res. 2013, 74, 35–49. [Google Scholar] [CrossRef] [Green Version]
- Kim, S.J.; Port, A.D.; Swan, R.; Campbell, J.P.; Chan, R.V.P.; Chiang, M.F. Retinopathy of prematurity: A review of risk factors and their clinical significance. Surv. Ophthalmol. 2018, 63, 618–637. [Google Scholar] [CrossRef] [PubMed]
- Narayanan, S.P.; Xu, Z.; Putluri, N.; Sreekumar, A.; Lemtalsi, T.; Caldwell, R.W.; Caldwell, R.B. Arginase 2 deficiency reduces hyperoxia-mediated retinal neurodegeneration through the regulation of poly-amine metabolism. Cell Death Dis. 2014, 5, e1075. [Google Scholar] [CrossRef] [Green Version]
- Chen, J.; Smith, L.E. Retinopathy of prematurity. Angiogenesis 2007, 10, 133–140. [Google Scholar] [CrossRef] [Green Version]
- Hartnett, M.E.; Penn, J.S. Mechanisms and Management of Retinopathy of Prematurity. N. Engl. J. Med. 2012, 367, 2515–2526. [Google Scholar] [CrossRef] [Green Version]
- Smith, L.E.; Wesolowski, E.; McLellan, A.; Kostyk, S.K.; D’amato, R.; Sullivan, R.; D’Amore, P.A. Oxygen-induced retinopathy in the mouse. Investig. Ophthalmol. Vis. Sci. 1994, 35, 101–111. [Google Scholar]
- Barnett, J.M.; Yanni, S.E.; Penn, J.S. The development of the rat model of retinopathy of prematurity. Doc. Ophthalmol. 2009, 120, 3–12. [Google Scholar] [CrossRef] [Green Version]
- Zou, D.; Li, J.; Fan, Q.; Zheng, X.; Deng, J.; Wang, S. Reactive oxygen and nitrogen species induce cell apoptosis via a mitochondria-dependent pathway in hyperoxia lung injury. J. Cell. Biochem. 2019, 120, 4837–4850. [Google Scholar] [CrossRef]
- Auten, R.L.; Davis, J.M. Oxygen Toxicity and Reactive Oxygen Species: The Devil Is in the Details. Pediatr. Res. 2009, 66, 121–127. [Google Scholar] [CrossRef] [Green Version]
- Yiş, U.; Kurul, S.H.; Kumral, A.; Cilaker, S.; Tuğyan, K.; Genç, Ş.; Yılmaz, O.; Yilmaz, O. Hyperoxic exposure leads to cell death in the developing brain. Brain Dev. 2008, 30, 556–562. [Google Scholar] [CrossRef]
- Taglialatela, G.; Perez-Polo, J.; Rassin, D.K. Induction of apoptosis in the CNS during development by the combination of hyperoxia and inhibition of glutathione synthesis. Free Radic. Biol. Med. 1998, 25, 936–942. [Google Scholar] [CrossRef]
- Terraneo, L.; Paroni, R.; Bianciardi, P.; Giallongo, T.; Carelli, S.; Gorio, A.; Samaja, M. Brain adaptation to hypoxia and hyperoxia in mice. Redox Biol. 2017, 11, 12–20. [Google Scholar] [CrossRef] [PubMed] [Green Version]
- Felderhoff-Mueser, U.; Bittigau, P.; Sifringer, M.; Jarosz, B.; Korobowicz, E.; Mahler, L.; Piening, T.; Moysich, A.; Grune, T.; Thor, F.; et al. Oxygen causes cell death in the developing brain. Neurobiol. Dis. 2004, 17, 273–282. [Google Scholar] [CrossRef]
- Ikonomidou, C. Triggers of apoptosis in the immature brain. Brain Dev. 2009, 31, 488–492. [Google Scholar] [CrossRef]
- Linke, S.P.; Clarkin, K.C.; Di Leonardo, A.; Tsou, A.; Wahl, G.M. A reversible, p53-dependent G0/G1 cell cycle arrest induced by ribonucleotide depletion in the absence of detectable DNA damage. Genes Dev. 1996, 10, 934–947. [Google Scholar] [CrossRef] [PubMed] [Green Version]
- Foster, D.A.; Yellen, P.; Xu, L.; Saqcena, M. Regulation of G1 Cell Cycle Progression: Distinguishing the Restriction Point from a Nutrient-Sensing Cell Growth Checkpoint(s). Genes Cancer 2010, 1, 1124–1131. [Google Scholar] [CrossRef]
- Puente, B.N.; Kimura, W.; Muralidhar, S.A.; Moon, J.; Amatruda, J.F.; Phelps, K.L.; Grinsfelder, D.; Rothermel, B.A.; Chen, R.; Garcia, J.A.; et al. The Oxygen-Rich Postnatal Environment Induces Cardiomyocyte Cell-Cycle Arrest through DNA Damage Response. Cell 2014, 157, 565–579. [Google Scholar] [CrossRef] [Green Version]
- D’Amore, P.A.; Sweet, E. Effects of hyperoxia on microvascular cells in vitro. In Vitro Cell. Dev. Biol.-Anim. 1987, 23, 123–128. [Google Scholar] [CrossRef]
- Uno, K.; Merges, C.A.; Grebe, R.; Lutty, G.A.; Prow, T.W. Hyperoxia inhibits several critical aspects of vascular development. Dev. Dyn. Off. Publ. Am. Assoc. Anatomists 2007, 236, 981–990. [Google Scholar] [CrossRef] [Green Version]
- Bretones, G.; Delgado, M.D.; León, J. Myc and cell cycle control. Biochim. Biophys. Acta (BBA)-Bioenerg. 2015, 1849, 506–516. [Google Scholar] [CrossRef]
- Wise, D.R.; Ward, P.S.; Shay, J.E.; Cross, J.R.; Gruber, J.J.; Sachdeva, U.M.; Platt, J.M.; DeMatteo, R.G.; Simon, M.C.; Thompson, C.B. Hypoxia promotes isocitrate dehydrogenase-dependent carboxylation of α-ketoglutarate to citrate to support cell growth and viability. Proc. Natl. Acad. Sci. USA 2011, 108, 19611–19616. [Google Scholar] [CrossRef] [PubMed] [Green Version]
- Sun, R.C.; Denko, N.C. Hypoxic Regulation of Glutamine Metabolism through HIF1 and SIAH2 Supports Lipid Synthesis that Is Necessary for Tumor Growth. Cell Metab. 2014, 19, 285–292. [Google Scholar] [CrossRef] [Green Version]
- Okuyama, H.; Endo, H.; Akashika, T.; Kato, K.; Inoue, M. Downregulation of c-MYC Protein Levels Contributes to Cancer Cell Survival under Dual Deficiency of Oxygen and Glucose. Cancer Res. 2010, 70, 10213–10223. [Google Scholar] [CrossRef] [PubMed] [Green Version]
- Bachmann, A.S.; Geerts, D. Polyamine synthesis as a target of MYC oncogenes. J. Biol. Chem. 2018, 293, 18757–18769. [Google Scholar] [CrossRef] [Green Version]
- Li, L.; Li, J.; Rao, J.N.; Li, M.; Bass, B.L.; Wang, J.-Y. Inhibition of polyamine synthesis induces p53 gene expression but not apoptosis. Am. J. Physiol. Content 1999, 276, C946–C954. [Google Scholar] [CrossRef] [PubMed]
- Tabor, C.W.; Tabor, H. Polyamines. Annu. Rev. Biochem. 1984, 53, 749–790. [Google Scholar] [CrossRef] [PubMed]
- Grinberg, A.V.; Hu, C.-D.; Kerppola, T.K. Visualization of Myc/Max/Mad Family Dimers and the Competition for Dimerization in Living Cells. Mol. Cell. Biol. 2004, 24, 4294–4308. [Google Scholar] [CrossRef] [PubMed] [Green Version]
- Eilers, M.; Eisenman, R.N. Myc’s broad reach. Genes Dev. 2008, 22, 2755–2766. [Google Scholar] [CrossRef] [PubMed] [Green Version]
- Igarashi, K.; Kashiwagi, K. Polyamines: Mysterious Modulators of Cellular Functions. Biochem. Biophys. Res. Commun. 2000, 271, 559–564. [Google Scholar] [CrossRef]
- Yamashita, T.; Nishimura, K.; Saiki, R.; Okudaira, H.; Tome, M.; Higashi, K.; Nakamura, M.; Terui, Y.; Fujiwara, K.; Kashiwagi, K.; et al. Role of polyamines at the G1/S boundary and G2/M phase of the cell cycle. Int. J. Biochem. Cell Biol. 2013, 45, 1042–1050. [Google Scholar] [CrossRef] [PubMed]
- Nakayama, K. Cip/Kip cyclin-dependent kinase inhibitors: Brakes of the cell cycle engine during development. BioEssays 1998, 20, 1020–1029. [Google Scholar] [CrossRef]
- Schindelin, J.; Arganda-Carreras, I.; Frise, E.; Kaynig, V.; Longair, M.; Pietzsch, T.; Preibisch, S.; Rueden, C.; Saalfeld, S.; Schmid, B.; et al. Fiji: An open-source platform for biological-image analysis. Nat. Methods 2012, 9, 676–682. [Google Scholar] [CrossRef] [Green Version]
- Schneider, C.A.; Rasband, W.S.; Eliceiri, K.W. NIH Image to Image: 25 years of image analysis. Nat. Methods 2012, 9, 671–675. [Google Scholar] [CrossRef] [PubMed]
- Kastenhuber, E.R.; Lowe, S.W. Putting p53 in Context. Cell 2017, 170, 1062–1078. [Google Scholar] [CrossRef] [PubMed] [Green Version]
- Hafner, A.; Bulyk, M.L.; Jambhekar, A.; Lahav, G. The multiple mechanisms that regulate p53 activity and cell fate. Nat. Rev. Mol. Cell Biol. 2019, 20, 199–210. [Google Scholar] [CrossRef]
- Knudsen, E.S.; Wang, J.Y. Dual mechanisms for the inhibition of E2F binding to RB by cyclin-dependent kinase-mediated RB phosphorylation. Mol. Cell. Biol. 1997, 17, 5771–5783. [Google Scholar] [CrossRef] [Green Version]
- Consortium, T.U. UniProt: A worldwide hub of protein knowledge. Nucleic Acids Res. 2018, 47, D506–D515. [Google Scholar] [CrossRef] [PubMed] [Green Version]
- Rubin, S.M.; Gall, A.-L.; Zheng, N.; Pavletich, N.P. Structure of the Rb C-Terminal Domain Bound to E2F1-DP1: A Mechanism for Phosphorylation-Induced E2F Release. Cell 2005, 123, 1093–1106. [Google Scholar] [CrossRef] [Green Version]
- Peukert, K.; Staller, P.; Schneider, A.; Carmichael, G.; Hänel, F.; Eilers, M. An alternative pathway for gene regulation by Myc. EMBO J. 1997, 16, 5672–5686. [Google Scholar] [CrossRef]
- Seoane, J.; Le, H.-V.; Massague, J. Myc suppression of the p21Cip1 Cdk inhibitor influences the outcome of the p53 response to DNA damage. Nat. Cell Biol. 2002, 419, 729–734. [Google Scholar] [CrossRef]
- Stine, Z.E.; Walton, Z.E.; Altman, B.J.; Hsieh, A.L.; Dang, C.V. MYC, Metabolism, and Cancer. Cancer Discov. 2015, 5, 1024–1039. [Google Scholar] [CrossRef] [PubMed] [Green Version]
- Singh, C.; Hoppe, G.; Tran, V.; Mccollum, L.; Bolok, Y.; Song, W.; Sharma, A.; Brunengraber, H.; Sears, J.E. Serine and 1-carbon metabolism are required for HIF-mediated protection against retinopathy of prematurity. JCI Insight 2019, 4. [Google Scholar] [CrossRef]
- Singh, C.; Sharma, A.; Hoppe, G.; Song, W.; Bolok, Y.; Sears, J.E. 3-Hydroxypyruvate Destabilizes Hypoxia Inducible Factor and Induces Angiostasis. Investig. Opthalmol. Vis. Sci. 2018, 59, 3440–3448. [Google Scholar] [CrossRef] [PubMed]
- Singh, C.; Tran, V.; Mccollum, L.; Bolok, Y.; Allan, K.; Yuan, A.; Hoppe, G.; Brunengraber, H.; Sears, J.E. Hyperoxia induces glutamine-fuelled anaplerosis in retinal Müller cells. Nat. Commun. 2020, 11, 1–11. [Google Scholar] [CrossRef] [PubMed] [Green Version]
- Tibbitts, D.C.; Escamilla-Powers, J.R.; Zhang, X.; Sears, R.C. Studying c-Myc serine 62 phosphorylation in leukemia cells: Concern over antibody cross-reactivity. Blood 2012, 119, 5334–5335. [Google Scholar] [CrossRef] [PubMed]


Publisher’s Note: MDPI stays neutral with regard to jurisdictional claims in published maps and institutional affiliations. |
© 2021 by the authors. Licensee MDPI, Basel, Switzerland. This article is an open access article distributed under the terms and conditions of the Creative Commons Attribution (CC BY) license (https://creativecommons.org/licenses/by/4.0/).
Share and Cite
Singh, C.; Benos, A.; Grenell, A.; Rao, S.; Anand-Apte, B.; Sears, J.E. Hyperoxia Inhibits Proliferation of Retinal Endothelial Cells in a Myc-Dependent Manner. Life 2021, 11, 614. https://doi.org/10.3390/life11070614
Singh C, Benos A, Grenell A, Rao S, Anand-Apte B, Sears JE. Hyperoxia Inhibits Proliferation of Retinal Endothelial Cells in a Myc-Dependent Manner. Life. 2021; 11(7):614. https://doi.org/10.3390/life11070614
Chicago/Turabian StyleSingh, Charandeep, Andrew Benos, Allison Grenell, Sujata Rao, Bela Anand-Apte, and Jonathan E. Sears. 2021. "Hyperoxia Inhibits Proliferation of Retinal Endothelial Cells in a Myc-Dependent Manner" Life 11, no. 7: 614. https://doi.org/10.3390/life11070614