Article

UPLC-MS-Based Metabolomics Profiling for α-Glucosidase Inhibiting Property of Parkia speciosa Pods

by
Mohammed S. M. Saleh
1,
Juriyati Jalil
2,
Nor Hidayah Mustafa
2,
Fitri Fareez Ramli
1,
Ahmad Yusof Asmadi
3 and
Yusof Kamisah
1,*
1
Department of Pharmacology, Faculty of Medicine, Universiti Kebangsaan Malaysia, Cheras, Kuala Lumpur 56000, Malaysia
2
Drug and Herbal Research Centre, Faculty of Pharmacy, Universiti Kebangsaan Malaysia, Kuala Lumpur 50300, Malaysia
3
Unit of Pharmacology, Faculty of Medicine and Defence Health, Universiti Pertahanan Nasional Malaysia, Kem Sungai Besi, Kuala Lumpur 57000, Malaysia
*
Author to whom correspondence should be addressed.
Life 2021, 11(2), 78; https://doi.org/10.3390/life11020078
Submission received: 5 January 2021 / Revised: 19 January 2021 / Accepted: 19 January 2021 / Published: 22 January 2021

Abstract

:
Parkia speciosa is a food plant that grows indigenously in Southeast Asia. A great deal of interest has been paid to this plant due to its traditional uses in the treatment of several diseases. The pods contain many beneficial secondary metabolites with potential applications in medicine and cosmetics. However, studies on their phytochemical properties are still lacking. Therefore, the present study was undertaken to profile the bioactive compounds of P. speciosa pods collected from six different regions of Malaysia through ultra-high-performance liquid chromatography-quadrupole time-of-flight mass spectrometry (UHPLC-QTOF-MS) and α-glucosidase inhibitory potential. This study applied metabolomics to elucidate the differences between P. speciosa populations found naturally in the different locations and to characterize potential α-glucosidase inhibitors from P. speciosa pods. P. speciosa collected from different regions of Malaysia showed good α-glucosidase inhibitory activity, with a median inhibitory concentration (IC50) of 0.45–0.76 μg/mL. The samples from the northern and northeastern parts of Peninsular Malaysia showed the highest activity. Using UHPLC-QTOF-MS/MS analysis, 25 metabolites were identified in the pods of P. speciosa. The findings unveiled that the pods of P. speciosa collected from different locations exhibit different levels of α-glucosidase inhibitory activity. The pods are a natural source of potent antidiabetic bioactive compounds.

1. Introduction

Type 2 diabetes mellitus (T2DM) is a condition that is characterized by a high fasting plasma glucose level more than 7 mmol/L. It affects a large percentage of the population, with a global mortality rate of up to 4.9 million [1]. It often results in complications affecting the kidney, nervous system, vision, and heart [2]. T2DM is treated pharmacologically by using various drugs including α-glucosidase inhibitors such as acarbose, voglibose and miglitol [3]. α-Glucosidase is an enzyme that converts complex carbohydrate into digestible monosaccharides [4].
T2DM occurs due to pancreatic β-cells dysfunction, leading to insulin deficiency [5]. It is believed that reactive oxygen species (ROS) contribute to the loss of pancreatic β-cell function and survival [6,7]. Therefore, it is anticipated that natural bioactive products with antioxidant properties will decrease the detrimental effects of ROS on pancreatic β-cells, and improve diabetes mellitus. Many studies have shown the hypoglycemic effects of natural products on T2DM, one of which is Parkia speciosa Hassk extract [8]. In these studies, α-glucosidase was employed as the target enzyme [4,9]. A great deal of attention has been directed towards medicinal plants with antioxidant or enzyme inhibiting properties for their potential uses as safer alternatives for disease treatment [10].
P. speciosa, a rainforest tree, belongs to the family Fabaceae [11]. The plant thrives on podzolic sandy loam and in areas nearby riverbanks in primary lowland rainforests in Southeast Asia. It is a perennial plant that grows up to 40 m tall and 1 m in stem circumference. Its leaves are bipinnate and alternate. It starts to flower and produce fruit at the age of seven years. It usually flowers in January to March and August to October each year. The flowers are bulb-shaped and droop at the stalk ends, while the fruits are green, flat and oblong pods of 35–55 cm in length and 3–5 cm in width, beetling in bunches of 6–10. Each pod contains 10–18 bright green almond-shaped seeds [12]. Each tree can produce an average of 250–300 pods per season [13]. Its seeds are consumed with or without the pods, either raw or cooked. The plant has been used as a traditional medicine in several parts of Southeast and South Asia to treat dermatitis, toothache, kidney disorder, diabetes, hypertension, malaria, skin problems, and diarrhea [13]. The pods possess anti-inflammatory, anticancer, antimicrobial, antioxidant, and antidiabetic properties [14]. These activities have been linked to the presence of various secondary metabolites in this perennial plant, including phenolic acids, tannins, flavonoids, triterpenes, and polysaccharides [11,15,16]. With the identification of several bioactive compounds in P. speciosa, the plant has a high value for development as a nutraceutical. Previous studies have reported the profiles and compositions of metabolites that are present in the pods [10,15]. It is known that different geographical regions could affect the composition and quality of the plants [17]. Therefore, the aim of this study was to characterize P. speciosa pod profiles, sampled from different regions in Malaysia using a highly sensitive metabolomics-based ultra-high-performance liquid chromatography-quadrupole time of flight/tandem mass spectrometry (UPLC-ESI-QTOF/MS) and α-glucosidase assay.

2. Materials and Methods

2.1. Chemical and Reagents

α-Glucosidase from Saccharomyces cerevisiae (lyophilized powder), p-nitrophenyl-α-D-glucopyranoside (p-NPG, ≥98%.), chromatographic-grade formic acid and methanol were purchased from Fisher Scientific (Waltham, MA, USA). Other analytical grade chemicals used were purchased from Merck (Darmstadt, Germany).

2.2. Plant Collection

P. speciosa pods were collected from six different locations (Figure 1) of Peninsular Malaysia—Terengganu (TER; eastern part), Johor (JOH; southern part), Kelantan (KEL; northeastern part), Malacca (MAL; southwestern part), Perak (PER; western part), and Kedah (KED; northern part) in February 2020. The collected plants were identified, and a voucher specimen (ID009/2020) was deposited at the Universiti Kebangsaan Malaysia Herbarium.

2.3. Sample Drying and Extraction

Fresh P. speciosa deseeded pods were rinsed with water and cleaned with tissue paper. The pods were peeled, cut into small pieces, and placed at −80 °C to prevent degradation or loss of secondary metabolites before being subjected to freeze-drying for 5 days. Then, the samples were ground finely and sieved to 60 mesh size particles. The resultant powder was stored in an airtight bag at −80 °C. A volume of 200 mL of ethanol was added to 20 g of the powder and subjected to extraction by sonication (320 W, 30 °C, 1 h). The solution was centrifuged for 5 min at 10,000 rpm and passed through a Whatman filter paper to obtain the supernatant. The remaining ethanol was removed with a rotary vacuum evaporator at 40 °C. Finally, the extracts were dried in a freeze-dryer and kept at −80 °C until further use.

2.4. Estimation of α-Glucosidase Inhibitory Activity

α-Glucosidase inhibitory activity of P. speciosa extracts was examined following a previously described method with a slight modification [18]. A stock solution of the substrate p-NPG (0.3 mg/mL) was prepared in 50 mM phosphate buffer (pH 6.5). Equal volumes (10 µL) of diluted crude extracts in various concentrations (0.2–2.0 mg/mL) and α-glucosidase (2 U/µL in 50 mM phosphate buffer) were added into 100 μL of phosphate buffer (30 mM) in a 96-well plate. The mixture was incubated for 5 min at room temperature, after which 75 μL of p-NPG solution was added. The mixture was then incubated for 30 min before termination of reaction by the addition of 50 μL of glycine solution (2 M), and the absorbance was measured at 405 nm. The activity determination in the samples was carried out six times for each extract. The median inhibitory concentration (IC50) for each extract was obtained. Quercetin was used as the standard α-glucosidase inhibitor [19].

2.5. UHPLC-QTOF-MS

The analyses of bioactive compounds present in P. speciosa extracts were performed using Agilent 1290 Infinity II UHPLC System (Santa Clara, CA, USA) and 6550 iFunnel Q-TOF LC/MS system (Agilent Technologies, Santa Clara, CA, USA). Separation was carried out using a C18 column (100 mm × 2.1 mm I.D.; 3 μm particle size) (Agilent Technologies, Santa Clara, CA, USA). The mobile phase consisted of 0.1% formic acid in water (solvent A) and methanol (solvent B) at a flow rate of 0.4 mL/min at 25 °C. The elution conditions were: 0 min, 85% A; 2–10 min, 50% A; 15 min, 30% A; 20 min, 15% A; 22–23 min, 0% A; 26 min, 85% A. MS detection was carried out in negative ion mode using a mass range of 100–1200 m/z. The negative ion mode was chosen because it appeared more selective and more sensitive for further LC-MS analysis of flavonoids and phenolics in plants. The extracted samples were dissolved in methanol, thoroughly mixed, filtered with a nylon filter of 0.45 μm and analyzed.

2.6. Multivariate Data Analysis

Multivariate data analysis (MVDA) was conducted according to the method by Abd Ghafar et al. [20] with a slight modification. UHPLC-QTOF-MS chromatograms in negative ion mode were used for untargeted analysis. The raw data acquired by Xcalibur 2.2 (Thermo Fisher Scientific, Waltham, MA, USA) were first converted into mzXML files using the MSConvert software [21], subsequently, the data were pre-treated using MZmine [22]. The software allowed noise from LC-QTOF-MS profiles to be removed (Noise level 5.0 E3), and data points under this intensity to be excluded from analysis. A number of 1993 peak mass signals were identified. The processed data were exported as a .cvs file (table format). The peak areas derived from LC-QTOF-MS analysis were further analyzed using principal components analysis (PCA) with UV scaling applied via SIMCA® P+ software 14.0 (Umetrix AB, Umea Sweden), prior to MVDA to normalize the data. Partial least squares (PLS) regression was employed to study the relationship between the two data sets by performing discriminant classification of different types of samples. Numeric values (+2, +1, −1 or −2) were assigned to four classes, followed by targeted analysis. To prepare the data matrix, raw data extracted from UHPLC-QTOF-MS were used to prepare a table containing the areas obtained from each sample. The dataset table obtained showed the area of each marker compound in the rows, and the different samples in the columns for the variables and observations, respectively. This was used as the X component. The data matrix table included data on α-glucosidase inhibitory activity, retrieved from the test results and expressed as IC50. This was used as the Y component to perform PCA as an investigatory analysis and PLS. The results provided insight into correlations between the dataset and α-glucosidase inhibition activities.

2.7. Statistical Analysis

The data were reported as means ± standard deviation of six biological replicates. Statistical analysis was performed via a one-way ANOVA followed by Tukey post hoc test with Minitab 17 (Minitab Inc., State Collage, PA, USA). Significant differences were considered at 95% confidence level.

3. Results

3.1. α-Glucosidase Inhibitory Activity

The yields of P. speciosa pod extracts sampled from different locations were similar. The extracts effectively inhibited α-glucosidase activity with IC50 values ranging from 0.443 to 0.707 µg/mL, which were more potent than the quercetin (3.550 μg/mL) (Table 1). P. speciosa extracts presented over 95% α-glucosidase inhibition at 2 μg/mL concentration in a dose-dependent manner (data not shown). The extracts of KEL had the highest inhibitory activity, followed by KED, PER, MAL, TER, and JOH being the lowest.

3.2. UHPLC-QTOF-MS/MS Identification

Comparisons based on available databases, including the Human Metabolome Database (HMDB), Metlin, KnaPSacK, MassBank, Kyoto Encyclopedia of Genes and Genomes (KEGG), and PlantCyc resulted in the tentative identification of 25 metabolites in the extracts based on the retention times. Mass, fragmentation pathways and MS/MS spectral data were compared against the reference database (Supplementary Table S1). Total ion chromatogram (TIC) data were also obtained during the analysis (Figure 2). There was a marked intensity variation between the samples collected from TER and JOH with those from other locations, particularly in flavonoids. Table 2 shows the predicted identities of the compounds in the extracts from different locations. Retention time, molecular ion and fragmentation data of each compound were also reported. Some of the compounds had been reported in previous studies, new compounds were also identified including gallocatechin-(4α→8)-epigallocatechin, epigallocatechin, theasinensin A, epigallocatechin gallate (three isomers), gossypetin 8-glucoside, gossypetin 8-rhamnoside (4 isomers), myricitrin, eucommin A, 6-c-galactosylluteolin (two isomers), curcumin monoglucoside, herbacetin, tremulacin, 2-phenylethanol glucuronide, and embelin. However, some of these metabolites were absent in some of the locations, for example, theasinensin A and theaflavin-3-gallate were absent from the samples collected from JOH, while samples obtained from KEL lacked 6-c-galactosylluteolin. MS/MS analysis of the extracts indicated that herbacetin and 2-phenylethanol glucuronide were only present in the JOH samples, while epigallocatechin and curcumin monoglucoside were only found in the TER samples.

3.3. Multivariate data analysis (MVDA)

The 1993 mass signals extracted from the UHPLC-QTOF-MS results were analyzed using MVDA and organized as a score plot and a loading plot for principal component 1 (PC1) and 2 (PC2) (Figure 3). This model can be explained by six PC. The score plot, PC1 and PC2 showed total variance of 47.8% with PC1 38.5%, and PC2 9.3%, separating the six different locations (TER, KED, PER, MAL, JOH, and KEL). The PCA score plot showed the separation of four different clusters (Figure 3A). The location of P. speciosa sampling was the main factor for the separation of the principal components. Meanwhile, the loading plot allowed for us to identify metabolites in P. speciosa from different locations by observing the mass signals.
The loading plot (Figure 3B) showed the effect of different locations of P. speciosa on the composition of metabolites, including gallic acid, gallocatechin-(4α→8)-epigallocatechin, theaflavin-3-gallate isomers, epigallocatechin, theasinensin A, epigallocatechin gallate isomers, gossypetin 8-glucoside isomers, gossypetin 8-rhamnoside isomers, myricitrin, eucommin A, 6-c-galactosylluteolin, curcumin monoglucoside, herbacetin, tremulacin, and embelin. The loading plot showed that the metabolite contents were higher in the samples attained from the JOH and TER.

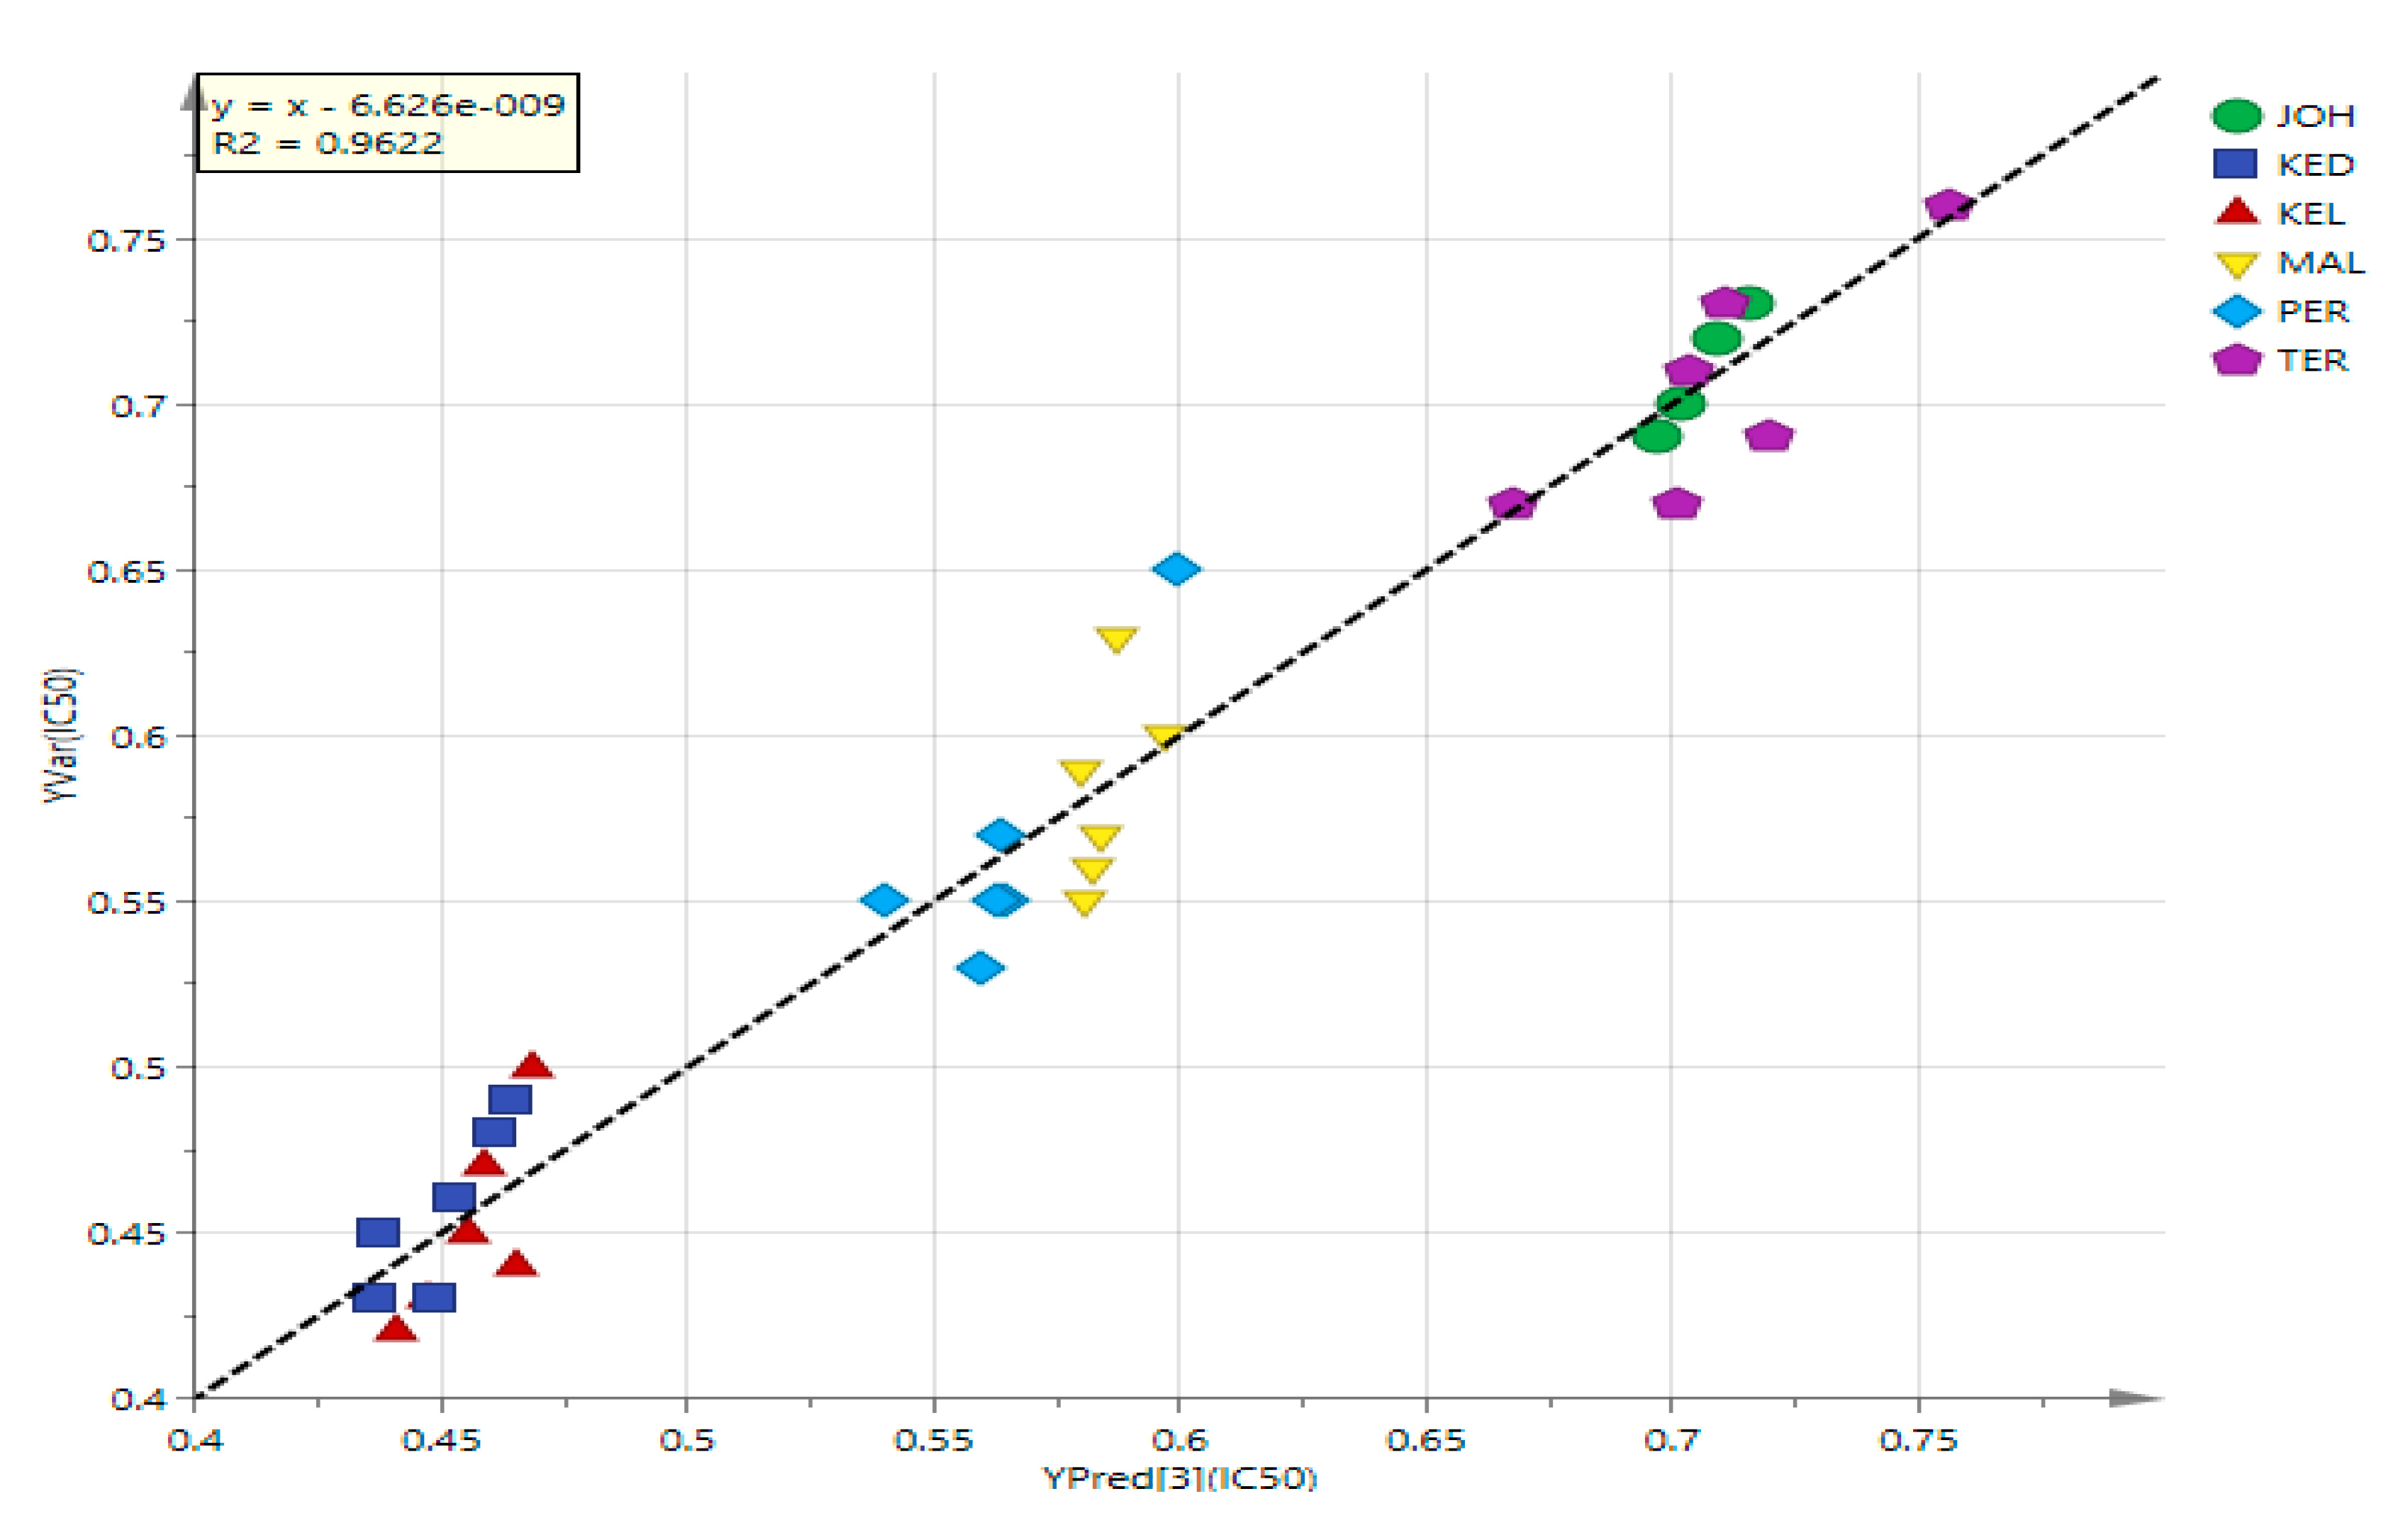
3.4. PLS Analysis of UHPLC-MS Data

PLS analysis was performed on MS and α-glucosidase inhibitory data to determine the relationship between the two variables (X and Y) (Figure 4A), to see the closeness of the extracts on the plot area, as well as to identify variables with the highest effects on the α-glucosidase inhibitory activity. Similar to the PCA loading plot, the contents of metabolites from the JOH and TER were bigger than from other locations (Figure 4B). This model plot showed an R2 of 0.9622, which indicated that the model functioned considerably well (Figure 5). The heatmap, an unsupervised clustering, was constructed based on the identified 25 biomarkers. The heatmap showed that the metabolites had a differential distribution between the six locations (Figure 6).

4. Discussion

In the current study, P. speciosa was investigated for its ethnomedicinal use as a glucose-lowering agent. The plant contains metabolites including phenols, fatty acids, alkaloids and steroids that confer various biological activities [23]. The most common and important compounds found in the plant are polyphenols, in particular, flavonoids [16,24,25]. Dietary intake of polyphenols, including flavonoids, is reported to be beneficial in terms of conferring insulin resistance and is associated with a lower risk of T2DM in humans [26,27]. Additionally, the flavonoid glycosides, flavone and phenolic acid, were demonstrated to exhibit various pharmacological activities including anticancer, antioxidant, anti-inflammatory, and cardioprotective activities [28,29].
This is the first study to report on the phytochemical profiles and screening of α-glucosidase-inhibiting compounds in P. speciosa pods using UPLC-QTOF-MS/MS. A total of 25 compounds were identified comprising 19 flavonoids, three phenolic acids and three other compounds. Eight flavonoid glycosides and 11 flavanols were identified in the extracts. A total of 24 metabolites were reported for the first time in P. speciosa pods. However, epigallocatechin and epigallocatechin gallate were reported in different species of Parkia [13], while gallic acid was previously identified in the pods of P. speciosa [14].
Most of these compounds have been reported for their ability to inhibit α-glucosidase activity [30]. These metabolites are most likely to be responsible for the α-glucosidase inhibitory activity of the plant. Moreover, the flavanol compounds (epigallocatechin, epigallocatechin gallate isomers, theasinensin A, theaflavin-3-gallate isomers, gallocatechin-(4α→8)-epigallocatechin and herbacetin) identified in P. speciosa most likely have a major role in the α-glucosidase inhibitory activity due to the structural configuration of double bonds conjugated to 4-oxo and hydroxyl groups [30]. It is quite hard to specifically pinpoint the most likely metabolites that were responsible for the high α-glucosidase-inhibiting property in the samples attained from KED and KEL, since almost all metabolites present in the pods from the locations were also detected in other locations. It is possible that samples originating from both KED and KEL had higher concentrations of the α-glucosidase-inhibiting compounds. However, this could not be confirmed since the metabolites were only analyzed qualitatively. Even though the JOH and TER samples contained more metabolites, their α-glucosidase-inhibiting activities were lower compared to the other four locations, suggesting that not all metabolites present in these samples (JOH and TER) contributed to the activity. While the pods from KEL had the least flavonoid contents—theaflavin-3-gallate, theasinensin A, epigallocatechin gallate and gossypetin 8-rhamnoside—compared to other locations but were better in inhibiting α-glucosidase. However, the activities in samples from the six locations were significantly more potent than that of quercetin, the positive control. These findings are consistent with the PLS regression results, suggesting that these metabolites may assist the clustering of metabolites and could be responsible for the α-glucosidase inhibitory activities of the pods.
A previous study reported that myricitrin had a significantly higher α-glucosidase inhibitory activity (IC50 = 8.65 μg/mL) than quercetin [31], suggestive that the substitution of sugar units or hydroxyl group with galloyl increased the efficacy of flavonoids against α-glucosidase. Our results are in accordance with previous studies reporting high α-glucosidase inhibitory activity in plant extracts such as Phyllanthus acidus [32], Potentilla inclinata [33], Tetracera macrophylla [34], Ligustrum vulgare L [35] and Tetracera indica [36] owing to the presence of phenolic acids and flavonoids. The findings obtained in the current study suggested that P. speciosa pod extracts could be used to alleviate postprandial hyperglycemia.
Metabolomics profiling of P. speciosa samples collected from the six different regions of Malaysia showed a significant difference between the samples in terms of the total content of investigated compounds. The data expressed by PCA and those proposed by the loading plot are interrelated and complementary to each other. On the one hand, this result clearly indicates that this separation is the result of the dissimilarity in phytochemical contents between the six extracts, and on the other hand, it reveals that the phytochemical contents of MAL, KED and PER are very similar, due to the existence of the same metabolites with different magnitudes. Samples collected from the JOH and TER regions indicated the lowest flavonoid contents. Many climatic or abiotic factors such as temperature, rainfall, humidity, as well as solar radiation can affect the biosynthesis of secondary metabolites in plants [27]. The age of the plants, watering patterns and types of soil could also influence the phytochemical content and composition. Unfortunately, these factors could not be ascertained in the current study since the samples were not collected from cultivated plants, but from plants that grew in the wild. A recent study on some plant extracts also demonstrated that geographical location had a significant effect on the composition and content of secondary metabolites [17,27]. This could explain the differences noted on the metabolites detected in pod samples collected from different locations in the current study and their intensities that are shown in the heatmap. Herbacetin and 2-phenylethanol glucuronide were unique to samples from JOH, which lacked theaflavin-3-gallate, epigallocathechin, gallocatechin-(4α→8)-epigallocatechin, and theasinensin A. These metabolites (herbacetin and 2-phenylethanol glucuronide) could be chemical markers for pods obtained from JOH, while epigallocatechin and curcumin monoglucoside could be markers for pods found in TER. The phytoconstituents of the pods from KEL and KED should be investigated further to better understand their α-glucosidase inhibitory activity. These findings are suggestive that the pods from both locations are better natural sources to isolate potential α-glucosidase inhibitors.

5. Conclusions

P. speciosa pods sampled from different parts of Malaysia displayed dissimilar α-glucosidase inhibitory activities which correlated with their metabolites, which were characterized by UHPLC-QTOF chemical profiling indicating the presence of flavonoids and phenolic compounds in the pod extracts. Hence, P. speciosa pods have the potential to be developed as an α-glucosidase inhibitor.

Supplementary Materials

The following are available online at https://www.mdpi.com/2075-1729/11/2/78/s1, Figure S1. MS/MS fragmentations spectra of Gossypetin 8-rhamnoside, Eucommin A, E mbelin, and gallic acid.

Author Contributions

M.S.M.S., J.J. and Y.K. designed the study, M.S.M.S. wrote the manuscript draft, conducted the experiment and software analyses, and validation, Y.K. supervised and obtained funding, F.F.R., N.H.M. and A.Y.A. conducted visualization. All authors have read and agreed to the published version of the manuscript.

Funding

The study was funded by the Faculty of Medicine Fundamental Grant, Universiti Kebangsaan Malaysia (FF-2020-387).

Institutional Review Board Statement

Not applicable.

Informed Consent Statement

Not applicable.

Data Availability Statement

The data presented in this study are available on request from the corresponding author.

Conflicts of Interest

The authors have no conflict of interest regarding the content of this paper.

References

  1. WHO. Definition and Diagnoses of Diabetes Mellitus and Intermediate Hyperglycaemia. Report of a WHO/IDF Consultation; WHO Press: Geneva, Switzerland, 2006. [Google Scholar]
  2. WHO. Diabetes. Available online: https://www.who.int/news-room/fact-sheets/detail/diabetes (accessed on 30 November 2020).
  3. Hedrington, M.S.; Davis, S.N. Considerations when using alpha-glucosidase inhibitors in the treatment of type 2 diabetes. Expert Opin. Pharmacother. 2019, 20, 2229–2235. [Google Scholar] [CrossRef]
  4. Vinholes, J.; Vizzotto, M. Synergisms in alpha-glucosidase inhibition and antioxidant activity of Camellia sinensis L. Kuntze and Eugenia uniflora L. Ethanolic Extracts. Pharmacogn. Res. 2017, 9, 101–107. [Google Scholar] [CrossRef] [Green Version]
  5. Chatterjee, S.; Khunti, K.; Davies, M.J. Type 2 diabetes. Lancet 2017, 389, 2239–2251. [Google Scholar] [CrossRef]
  6. Gerber, P.A.; Rutter, G.A. The role of oxidative stress and hypoxia in pancreatic beta-cell dysfunction in diabetes mellitus. Antioxidants Redox Signal. 2017, 26, 501–518. [Google Scholar] [CrossRef] [PubMed] [Green Version]
  7. Saleh, M.S.M.; Siddiqui, M.J.; Mediani, A.; Ahmed, Q.U.; So’ad, S.Z.M.; Saidi-Besbes, S.; Elnaem, M.H.; Othman, H.A.; Ismail, N.H. Modulation of metabolic alterations of obese diabetic rats upon treatment with Salacca zalacca fruits extract using 1H NMR-based metabolomics. Food Res. Int. 2020, 137, 109547. [Google Scholar] [CrossRef] [PubMed]
  8. Jamaluddin, F.; Mohameda, S.; Lajis, M.N. Hypoglycaemic effect of stigmast-4-en-3-one, from Parkia speciosa empty pods. Food Chem. 1995, 54, 9–13. [Google Scholar] [CrossRef]
  9. Trinh, P.T.N.; Giang, B.L.; Tuan, N.T.; Hang, H.T.T.; Thuy, N.T.L.; Tuan, N.N.; Dung, L.T. Alfa glucosidase inhibitory, anti inflammatory activities and a new furanocoumarin derivative of Ruellia tuberosa. Nat. Prod. Res. 2019, 1–8. [Google Scholar] [CrossRef] [PubMed]
  10. Tran, N.; Pham, B.; Le, L. Bioactive compounds in anti-diabetic plants: From herbal medicine to modern drug discovery. Biology 2020, 9, 252. [Google Scholar] [CrossRef] [PubMed]
  11. Kamisah, Y.; Zuhair, J.S.F.; Juliana, A.H.; Jaarin, K. Parkia speciosa empty pod prevents hypertension and cardiac damage in rats given N(G)-nitro-L-arginine methyl ester. Biomed. Pharmacother. 2017, 96, 291–298. [Google Scholar] [CrossRef]
  12. Lim, T.K. Parkia speciosa . In Edible Medicinal And Non-Medicinal Plants; Springer: Berlin/Heidelberg, Germany, 2012; pp. 798–803. [Google Scholar]
  13. Saleh, M.S.M.; Jalil, J.; Zainalabidin, S.; Asmadi, A.Y.; Mustafa, N.H.; Kamisah, Y. Genus Parkia: Phytochemical, medicinal Uses, and pharmacological properties. Int. J. Mol. Sci. Rev. 2021, 22, 618. [Google Scholar] [CrossRef]
  14. Kamisah, Y.; Othman, F.; Qodriyah, H.M.S.; Jaarin, K. Parkia speciosa Hassk.: A potential phytomedicine. Evid. Based Complement. Altern. Med. 2013, 2013, 709028. [Google Scholar] [CrossRef] [PubMed] [Green Version]
  15. Ghasemzadeh, A.; Jaafar, H.Z.E.; Bukhori, M.F.M.; Rahmat, M.H.; Rahmat, A. Assessment and comparison of phytochemical constituents and biological activities of bitter bean (Parkia speciosa Hassk.) collected from different locations in Malaysia. Chem. Cent. J. 2018, 12, 1–9. [Google Scholar] [CrossRef] [PubMed] [Green Version]
  16. Ko, H.J.; Ang, L.H.; Ng, L.T. Antioxidant activities and polyphenolic constituents of bitter bean Parkia speciosa. Int. J. Food Prop. 2014, 17, 1977–1986. [Google Scholar] [CrossRef] [Green Version]
  17. Parizad, S.; Dizadji, A.; Habibi, M.K.; Winter, S.; Kalantari, S.; Movi, S.; Lorenzo Tendero, C.; Alonso, G.L.; Moratalla-Lopez, N. The effects of geographical origin and virus infection on the saffron (Crocus sativus L.) quality. Food Chem. 2019, 295, 387–394. [Google Scholar] [CrossRef]
  18. Saleh, M.S.M.; Siddiqui, M.J.; Mat So’ad, S.Z.; Roheem, F.O.; Saidi-Besbes, S.; Khatib, A. Correlation of FT-IR fingerprint and α-glucosidase inhibitory activity of salak (Salacca zalacca) fruit extracts utilizing orthogonal partial least square. Molecules 2018, 23, 1434. [Google Scholar] [CrossRef] [Green Version]
  19. Murugesu, S.; Perumal, V.; Balan, T.; Fatinanthan, S.; Khatib, A.; Arifin, N.J.; Shukri, N.S.S.M.; Saleh, M.S.M.; Hin, W.L. The investigation of antioxidant and antidiabetic activities of Christia vespertilionis leaves extracts. South Afr. J. Bot. 2020, 133, 227–235. [Google Scholar] [CrossRef]
  20. Abd Ghafar, S.Z.; Mediani, A.; Maulidiani, M.; Rudiyanto, R.; Mohd Ghazali, H.; Ramli, N.S.; Abas, F. Complementary NMR- and MS-based metabolomics approaches reveal the correlations of phytochemicals and biological activities in Phyllanthus acidus leaf extracts. Food Res. Int. 2020, 136, 109312. [Google Scholar] [CrossRef] [PubMed]
  21. Chambers, M.C.; Maclean, B.; Burke, R.; Amodei, D.; Ruderman, D.L.; Neumann, S.; Gatto, L.; Fischer, B.; Pratt, B.; Egertson, J.; et al. A cross-platform toolkit for mass spectrometry and proteomics. Nat. Biotechnol. 2012, 30, 918–920. [Google Scholar] [CrossRef] [PubMed]
  22. Pluskal, T.; Castillo, S.; Villar-Briones, A.; Orešič, M. MZmine 2: Modular framework for processing, visualizing, and analyzing mass spectrometry-based molecular profile data. BMC Bioinform. 2010, 11, 395. [Google Scholar] [CrossRef] [Green Version]
  23. Mariod, A.A. Wild Fruits: Composition, Nutritional Value and Products; Springer Nature: Berlin/Heidelberg, Germany, 2019; ISBN 9783030318840. [Google Scholar]
  24. Meng, Y.; Su, A.; Yuan, S.; Zhao, H.; Tan, S.; Hu, C.; Deng, H.; Guo, Y. Evaluation of total flavonoids, myricetin, and quercetin from Hovenia dulcis Thunb. As inhibitors of α-amylase and α-glucosidase. Plant Foods Hum. Nutr. 2016, 71, 444–449. [Google Scholar] [CrossRef]
  25. Adisakwattana, S.; Lerdsuwankij, O.; Poputtachai, U.; Minipun, A.; Suparpprom, C. Inhibitory activity of cinnamon bark species and their combination effect with acarbose against intestinal α-glucosidase and pancreatic α-amylase. Plant Foods Hum. Nutr. 2011, 66, 143–148. [Google Scholar] [CrossRef] [PubMed]
  26. Guasch-Ferré, M.; Merino, J.; Sun, Q.; Fitó, M.; Salas-Salvadó, J.; Fern, D.; Mielgo-ayuso, J.; Arora, I.; Sharma, M.; Tollefsbol, T.O.; et al. Dietary polyphenols, Mediterranean diet, prediabetes, and type 2 diabetes: A narrative review of the evidence. Oxidative Med. Cell. Longev. 2017, 2017, 1–16. [Google Scholar] [CrossRef] [PubMed]
  27. Sampaio, B.L.; Edrada-Ebel, R.; Da Costa, F.B. Effect of the environment on the secondary metabolic profile of Tithonia diversifolia: A model for environmental metabolomics of plants. Sci. Rep. 2016, 6, 1–11. [Google Scholar] [CrossRef] [Green Version]
  28. Stobiecki, M. Application of mass spectrometry for identification and structural studies of flavonoid glycosides. Phytochemistry 2000, 54, 237–256. [Google Scholar] [CrossRef]
  29. Xiao, J. Dietary flavonoid aglycones and their glycosides: Which show better biological significance? Crit. Rev. Food Sci. Nutr. 2017, 57, 1874–1905. [Google Scholar] [CrossRef]
  30. Tadera, K.; Minami, Y.; Takamatsu, K.; Matsuoka, T. Inhibition of α-glucosidase and α-amylase by flavonoids. J. Nutr. Sci. Vitaminol. 2006, 52, 149–153. [Google Scholar] [CrossRef] [Green Version]
  31. Cai, Y.; Wu, L.; Lin, X.; Hu, X.; Wang, L. Phenolic profiles and screening of potential α-glucosidase inhibitors from Polygonum aviculare L. leaves using ultra-filtration combined with HPLC-ESI-qTOF-MS/MS and molecular docking analysis. Ind. Crop. Prod. 2020, 154, 112673. [Google Scholar] [CrossRef]
  32. Abd Ghafar, S.Z.; Mediani, A.; Maulidiani; Ramli, N.S.; Abas, F. Antioxidant, α-glucosidase, and nitric oxide inhibitory activities of Phyllanthus acidus and LC–MS/MS profile of the active extract. Food Biosci. 2018, 25, 134–140. [Google Scholar] [CrossRef]
  33. Şöhretoğlu, D.; Sari, S.; Šoral, M.; Barut, B.; Özel, A.; Liptaj, T. Potential of Potentilla inclinata and its polyphenolic compounds in α-glucosidase inhibition: Kinetics and interaction mechanism merged with docking simulations. Int. J. Biol. Macromol. 2018, 108, 81–87. [Google Scholar] [CrossRef]
  34. Roheem, F.O.; Ahmed, Q.U.; So, S.Z.M.; Shah, S.A.A.; Latip, J.; Alhassan, A.M.; Mohammad, S.N.A.S. Assessment of Free radical scavenging and digestive enzyme inhibitory activities of extract, fractions and isolated compounds from Tetracera macrophylla leaves. J. Herb. Med. 2020, 22, 100351. [Google Scholar] [CrossRef]
  35. Rocchetti, G.; Senizza, B.; Zengin, G.; Senkardes, I.; Bibi Sadeer, N.; Fawzi Mahomoodally, M.; Lucini, L. Metabolomics-based profiling with chemometric approach to delineate the bio-pharmaceutical properties of fruit extracts from Ligustrum vulgare L. Ind. Crop. Prod. 2019, 140, 111635. [Google Scholar] [CrossRef]
  36. Alhassan, A.M.; Ahmed, Q.U.; Latip, J.; Adnan, S.; Shah, A. A new sulphated flavone and other phytoconstituents from the leaves of Tetracera indica Merr. and their alpha-glucosidase inhibitory activity. Nat. Prod. Res. 2018, 33, 1–8. [Google Scholar] [CrossRef] [PubMed]
Figure 1. Location map showing the plant collection sites.
Life 11 00078 g001
Figure 2. Total ion chromatogram of P. speciosa pod extracts collected from different locations in Malaysia: (A) TER, Terengganu; (B) JOH, Johor; (C) KEL, Kelantan; (D) MAL, Malacca; (E) PER, Perak; (F) KED, Kedah.
Life 11 00078 g002
Figure 3. The principal components analysis (PCA) score plot (A) and the loading plot (B) of the MS data in the pods of P. speciosa collected from different locations in Malaysia. 1. gallic acid; 2. gallocatechin-(4α→8)-epigallocatechin; 3. theaflavin-3-gallate; 4. epigallocatechin; 5. theasinensin A; 6. epigallocatechin gallate isomers; 7. 2-phenylethanol glucuronide; 8. gossypetin 8-glucoside isomers; 9. gossypetin 8-rhamnoside isomers; 10. myricitrin; 11. eucommin A; 12. 6-c-galactosylluteolin; 13. curcumin monoglucoside; 14. herbacetin; 15. tremulacin; 16. embelin.
Life 11 00078 g003
Figure 4. The partial least squares (PLS) regression score plot (A) and the loading plot (B) of the MS data in the P. peciosa pods obtained from different locations in Malaysia. 1. gallic acid; 2. gallocatechin-(4α→8)-epigallocatechin; 3. theaflavin-3-gallate; 4. epigallocatechin; 5. theasinensin A; 6. epigallocatechin gallate isomers; 7. 2-phenylethanol glucuronide; 8. gossypetin 8-glucoside isomers; 9. gossypetin 8-rhamnoside isomers; 10. myricitrin; 11. eucommin A; 12. 6-c-galactosylluteolin; 13. curcumin monoglucoside; 14. herbacetin; 15. tremulacin; 16. embelin.
Life 11 00078 g004
Figure 5. Partial least squares (PLS) regression plot line loading of P. speciosa pod extracts.
Life 11 00078 g005
Figure 6. Heatmap of identified bioactive compounds of P. speciosa pods. Color indicates metabolites expression value: absent (blue) to present (brown).
Life 11 00078 g006
Table 1. Yield and α-glucosidase inhibitory activity of P. speciosa pods collected from different locations of Peninsular Malaysia.
LocationYield (%)α-Glucosidase Inhibitory Activity (IC50) (µg/mL)
TER16.497 ± 0.702 a0.705 ± 0.036 b
JOH17.393 ± 0.632 a0.707 ± 0.016 b
KEL16.833 ± 1.048 a0.443 ± 0.036 d
MAL16.700 ± 0.605 a0.583 ± 0.029 c
PER16.087 ± 0.784 a0.567 ± 0.043 c
KED16.875 ± 0.996 a0.457 ± 0.025 d
Quercetin-3.550 ± 0.130 a
Values represent mean ± SD (n = 6). The values that do not share a same letter (a–d) are significantly different (p < 0.05). Abbreviations: Terengganu (TER; eastern part), Johor (JOH; southern part), Kelantan (KEL; northeastern part), Malacca (MAL; southwestern part), Perak (PER; western part), and Kedah (KED; northern part).
Table 2. Metabolites identified from P. speciosa pods sampled from six different locations by ultra-high-performance liquid chromatography-quadrupole time-of-flight mass spectrometry (UPLC-QTOF-MS/MS).
No.RT (min)[M–H] (m/z)m/zMWFormulaMS/MSppmTentative IdentificationTERJOHKELMALPERKED
11.196169.0142170.0219170.1200C7 H6 O5125.0245, 107.0132−2.23Gallic acid++---+
21.705609.1249610.1295 C30 H26 O14483.0907, 441.0813, 423.0708, 305.0658, 303.0506, 273.0417, 177.0192, 137.0258, 125.0244, 137.0258−0.52Gallocatechin-(4α→8)- epigallocatechin+--+++
32.298760.6424716.1379716.6040C36 H28 O16609.1227,591.1129, 423.0714, 305.0657−2.2Theaflavin-3-gallate isomers---+++
2.705 1.67+-++++
2.891−2.18---+++
5.246−1.93+-++++
43.419457.0785458.372458.3720C15 H14 O7331.0458, 305.0666, 287.0561, 269.0463, 193.0146, 169.0152, 125.0254−1.72Epigallocatechin+-----
53.594912.6556914.1546914.7000C44 H34 O22761.1333, 743.1231, 591.1131M 573.1024, 423.0714, 177.0198−0.02Theasinensin A+-++++
64.017457.0778458.0841458.3720C22 H18 O11331.0458, 305.0665, 287.0558, 269.0471, 193.0144, 169.0148, 125.0255−1.48Epigallocatechin gallate isomers+--+++
4.305 −2.96--++++
4.505−3.18++-+++
74.139343.1032 + (HCOO)-298.29298.1050C14H18O7253.073, 223.0601, 208.0385, 206.021, 195.0657181.0497, 177.02 2-Phenylethanol glucuronide-+----
86.836479.0814480.0946480.4000C21H20O13461.0666, 316.0213, 287.0178, 271.0245, 243.0276, 214.0279, 179.0002, 151.0034, 124.01711.65Gossypetin 8-glucoside++---+
96.748463.0857464.096464.4000C21 H20 O12343.0425, 301.0335, 271.0243, 255.0283, 243.0261, 178.9978, 151.0021.14Gossypetin 8-rhamnoside isomers++---+
7.104 0.67++--++
7.040.64++-+-+
7.6880.49++++++
107.955463.0882464.0961464.3700C21 H20 O12445.0769, 445.0769, 343.0423, 300.0274, 271.0243, 255.0298, 243.0298, 178.9985, 151.0045−1.24Myricitrin++----
118.345595.2027 + (HCOO)-550.6020550.6000C27 H34 O12595.2022, 475.1579, 431.1332, 369.114, 329.1004, 311.0916, 205.0503, 190.02831.16Eucommin A-+-+++
128.408448.1012447.0940447.4000C21 H20 O11301.0349, 272.0317, 255.0297, 243.0291, 227.0349, 151.0058, 105.02030.566-c-Galactosylluteolin isomers+-----
8.76
−0.7-+-+++
1310.06875.1763 + (M + HCOO)530.1778530.5000C27 H30 O11559.1445, 279.9182, 170.83361.92Curcumin monoglucoside+-----
1410.088301.0351302.0426302.23OOC15H10O7273.0399, 257.0437, 245.0428, 192.0079, 178.9975, 164.0087, 151.0037, 121.0286, 107.01430.19Herbacetin-+----
1511.042573.1608 + (M + HCOO)528.1632528.5000C27 H28 O11409.0912, 325.0684, 307.0597, 283.0623, 117.03641.92Tremulacin+--++-
1613.858293.1753294.1828294.4000C17 H26 O4263.1631, 257.1775, 237.1073, 235.1324, 221.1541, 190.10010.16Embelin-+--++
Abbreviations: TER: Terengganu; JOH: Johor; KEL: Kelantan; MAL: Malacca; PER: Perak; KED: Kedah; +: present; -: absent.
Publisher’s Note: MDPI stays neutral with regard to jurisdictional claims in published maps and institutional affiliations.

