
Intake of Vitamin D in Patients with Multiple Sclerosis in the Valencian Region and Its Possible Relationship with the Pathogenesis of the Disease

 , , , , and
Abstract
:1. Introduction
2. Materials and Methods
2.1. Sample
2.2. Statistical Analysis
2.3. Measurements
2.4. Ethical Concerns
3. Results
4. Discussion
5. Conclusions
Author Contributions
Funding
Institutional Review Board Statement
Informed Consent Statement
Acknowledgments
Conflicts of Interest
References
- Constantinescu, C.S.; Gran, B. Multiple sclerosis: Autoimmune associations in multiple sclerosis. Nat. Rev. Neurol. 2010, 6, 591–592. [Google Scholar] [CrossRef] [PubMed]
- Stelmasiak, Z.; Kozioł-Montewka, M.; Dobosz, B.; Rejdak, K.; Bartosik-Psujek, H.; Mitosek-Szewczyk, K.; Belniak-Legieć, E. Interleukin-6 concentration in serum and cerebrospinal fluid in multiple sclerosis patients. Med. Sci. Monit. 2000, 6, 1104–1108. [Google Scholar]
- Bongioanni, P.; Mosti, S.; Romano, M.R.; Lombardo, F.; Moscato, G.; Meucci, G. Increased T-lymphocyte interleukin-6 binding in patients with multiple sclerosis. Eur. J. Neurol. 2000, 7, 291–297. [Google Scholar] [CrossRef]
- Sassi, F.; Tamone, C.; D’Amelio, P. Vitamin D: Nutrient, Hormone, and Immunomodulator. Nutrients 2018, 10, 1656. [Google Scholar] [CrossRef] [Green Version]
- Milo, R.; Kahana, E. Multiple sclerosis: Geoepidemiology, genetics and the environment. Autoimmun. Rev. 2010, 9, A387–A394. [Google Scholar] [CrossRef] [PubMed]
- Pierrot-Deseilligny, C. Clinical implications of a possible role of vitamin D in multiple sclerosis. J. Neurol. 2009, 256, 1468–1479. [Google Scholar] [CrossRef] [PubMed] [Green Version]
- Farsani, Z.S.; Behmanesh, M.; Sahraian, M.A. Interleukin-10 but not transforming growth factor-β1 gene expression is up-regulated by vitamin D treatment in multiple sclerosis patients. J. Neurol. Sci. 2015, 350, 18–23. [Google Scholar] [CrossRef] [PubMed]
- Silberstein, M. Correlation between premorbid IL-6 levels and COVID-19 mortality: Potential role for Vitamin D. Int. Immunopharmacol. 2020, 88, 106995. [Google Scholar] [CrossRef]
- Naghavi Gargari, B.; Behmanesh, M.; Shirvani Farsani, Z.; Pahlevan Kakhki, M.; Azimi, A.R. Vitamin D supplementation up-regulates IL-6 and IL-17A gene expression in multiple sclerosis patients. Int. Immunopharmacol. 2015, 28, 414–419. [Google Scholar] [CrossRef] [PubMed]
- Boletín Mensual de Estadística: Temperaturas Medias, Horas de Sol y Precipitación Acuosa; Instituto Nacional de Estadística: Madrid, Spain, 2016.
- González-Molero, I.; Morcillo, S.; Valdés, S.; Pérez-Valero, V.; Botas, P.; Delgado, E.; Hernández, D.; Olveira, G.; Rojo, G.; Gutierrez-Repiso, C.; et al. Vitamin D deficiency in Spain: A population-based cohort study. Eur. J. Clin. Nutr. 2011, 65, 321–328. [Google Scholar] [CrossRef] [Green Version]
- Togo, A.; Maciá, D.E.; Blanes Segura, S.; Díaz, N.S.; Villalba-Martínez, C. Is There Vitamin D Deficiency in Children in a Sunny Mediterranean City? Anales de Pediatría: Publicación Oficial de la Asociación Española de Pediatría (AEP); 2016; Volume 84, pp. 63–169. Available online: https://dialnet.unirioja.es/servlet/articulo?codigo=6721583 (accessed on 7 December 2021).
- Suárez-Varela, M.M.M.; Reguera-Leal, P.; Grant, W.B.; Rubio-López, N.; Llopis-González, A. Vitamin D and Psoriasis Pathology in the Mediterranean Region, Valencia (Spain). Int. J. Environ. Res. Public Health 2014, 11, 12108–12117. [Google Scholar] [CrossRef] [Green Version]
- Sintzel, M.B.; Rametta, M.; Reder, A.T. Vitamin D and Multiple Sclerosis: A Comprehensive Review. Neurology 2017, 7, 59–85. [Google Scholar] [CrossRef] [PubMed] [Green Version]
- Pilz, S.; März, W.; Cashman, K.D.; Kiely, M.E.; Whiting, S.J.; Holick, M.F.; Grant, W.B.; Pludowski, P.; Hiligsmann, M.; Trummer, C.; et al. Rationale and Plan for Vitamin D Food Fortification: A Review and Guidance Paper. Front. Endocrinol. 2018, 9, 373. [Google Scholar] [CrossRef] [PubMed]
- Bahr, L.S.; Bock, M.; Liebscher, D.; Bellmann-Strobl, J.; Franz, L.; Prüß, A.; Schumann, D.; Piper, S.K.; Kessler, C.S.; Steckhan, N.; et al. Ketogenic diet and fasting diet as Nutritional Approaches in Multiple Sclerosis (NAMS): Protocol of a randomized controlled study. Trials 2020, 21, 3. [Google Scholar] [CrossRef] [Green Version]
- Riccio, P.; Rossano, R. Diet, Gut Microbiota, and Vitamins D + A in Multiple Sclerosis. Neurotherapeutics 2018, 15, 75–91. [Google Scholar] [CrossRef] [Green Version]
- Penesová, A.; Dean, Z.; Kollár, B.; Havranová, A.; Imrich, R.; Vlček, M.; Rádiková, Ž. Nutritional intervention as an essential part of multiple sclerosis treatment? Physiol. Res. 2018, 67, 521–533. [Google Scholar] [CrossRef]
- Dawson-Hughes, B.; Harris, S.S.; Lichtenstein, A.H.; Dolnikowski, G.; Palermo, N.J.; Rasmussen, H. Dietary Fat Increases Vitamin D-3 Absorption. J. Acad. Nutr. Diet. 2015, 115, 225–230. [Google Scholar] [CrossRef] [PubMed]
- Park, C.Y.; Shin, Y.; Kim, J.-H.; Zhu, S.; Jung, Y.S.; Han, S.N. Effects of high fat diet-induced obesity on vitamin D metabolism and tissue distribution in vitamin D deficient or supplemented mice. Nutr. Metab. 2020, 17, 44. [Google Scholar] [CrossRef] [PubMed]
- Hadgkiss, E.J.; Jelinek, G.A.; Weiland, T.J.; Pereira, N.G.; Marck, C.; Van Der Meer, D.M. The association of diet with quality of life, disability, and relapse rate in an international sample of people with multiple sclerosis. Nutr. Neurosci. 2015, 18, 125–136. [Google Scholar] [CrossRef] [PubMed] [Green Version]
- McCambridge, G.; Agrawal, M.; Keady, A.; Kern, P.A.; Hasturk, H.; Nikolajczyk, B.S.; Bharath, L.P. Saturated Fatty Acid Activates T Cell Inflammation Through a Nicotinamide Nucleotide Transhydrogenase (NNT)-Dependent Mechanism. Biomolecules 2019, 9, 79. [Google Scholar] [CrossRef] [Green Version]
- Mu, L.; Mukamal, K.J.; Naqvi, A.Z. Erythrocyte saturated fatty acids and systemic inflammation in adults. Nutrition 2014, 30, 1404–1408. [Google Scholar] [CrossRef] [Green Version]
- McDonald, W.I.; Compston, A.; Edan, G.; Goodkin, D.; Hartung, H.-P.; Lublin, F.D.; McFarland, H.F.; Paty, D.W.; Polman, C.H.; Reingold, S.C.; et al. Recommended diagnostic criteria for multiple sclerosis: Guidelines from the international panel on the diagnosis of multiple sclerosis. Ann. Neurol. 2001, 50, 121–127. [Google Scholar] [CrossRef]
- Lublin, F.D.; Reingold, S.C.; Cohen, J.A.; Cutter, G.R.; Sørensen, P.S.; Thompson, A.J.; Wolinsky, J.S.; Balcer, L.J.; Banwell, B.; Barkhof, F.; et al. Defining the clinical course of multiple sclerosis: The 2013 revisions. Neurology 2014, 83, 278–286. [Google Scholar] [CrossRef] [PubMed] [Green Version]
- Rodríguez, I.T.; Ballart, J.F.; Pastor, G.C.; Jorda, E.B.; Val, V.A. Validation of a short questionnaire on frequency of dietary intake: Repro-ducibility and validity. Nutr. Hosp. 2008, 23, 242–252. [Google Scholar] [PubMed]
- Dhir, S.; Tarasenko, M.; Napoli, E.; Giulivi, C. Neurological, Psychiatric, and Biochemical Aspects of Thiamine Deficiency in Children and Adults. Front. Psychiatry 2019, 10, 207. [Google Scholar] [CrossRef] [Green Version]
- Cuervo, M.; Abete, I.; Baladia, E.; Corbalan, M.; Manera, M.; Basulto, J. Propuesta de ingestas dietéticas de referencia (IDR) para la población española. En Federación Española de Sociedades de Nutrición. Act. Diet. 2010, 14, 196–197. [Google Scholar]
- Aranceta, J.; Serra, L. Objetivos nutricionales para la población española. Consenso de la Sociedad Española de Nutrición Comunitaria. Rev. Esp. Nutr. Comunitaria 2011, 17, 178–199. [Google Scholar]
- Fernández-Juan, A.; Ramírez-Gil, C.; van der Werf, L. La valoración antropométrica en el contexto de la escuela como medida para detectar y prevenir efectos a largo plazo de la obesidad y del sobrepeso en niños en edad escolar. Rev. Colomb. Cardiol. 2016, 23, 435–442. [Google Scholar] [CrossRef] [Green Version]
- Kurtzke, J.F. Rating neurologic impairment in multiple sclerosis: An expanded disability status scale (EDSS). Neurology 1983, 33, 1444–1452. [Google Scholar] [CrossRef] [PubMed] [Green Version]
- World Medical Association. World Medical Association Declaration of Helsinki: Ethical principles for medical research involving human subjects. JAMA 2013, 310, 2191–2194. [Google Scholar] [CrossRef] [Green Version]
- Amirinejad, R.; Shirvani-Farsani, Z.; Gargari, B.N.; Sahraian, M.A.; Soltani, B.M.; Behmanesh, M. Vitamin D changes expression of DNA repair genes in the patients with multiple sclerosis. Gene 2021, 781, 145488. [Google Scholar] [CrossRef]
- Calton, E.K.; Keane, K.N.; Newsholme, P.; Soares, M.J. The Impact of Vitamin D Levels on Inflammatory Status: A Systematic Review of Immune Cell Studies. PLoS ONE 2015, 10, e0141770. [Google Scholar] [CrossRef]
- Berridge, M.J. Vitamin D deficiency accelerates ageing and age-related diseases: A novel hypothesis. J. Physiol. 2017, 595, 6825–6836. [Google Scholar] [CrossRef] [PubMed]
- Lu, M.; McComish, B.J.; Burdon, K.P.; Taylor, B.V.; Körner, H. The Association Between Vitamin D and Multiple Sclerosis Risk: 1,25(OH)2D3 Induces Super-Enhancers Bound by VDR. Front. Immunol. 2019, 10, 488. [Google Scholar] [CrossRef]
- Platero, J.L.; Cuerda-Ballester, M.; Ibáñez, V.; Sancho, D.; Lopez-Rodríguez, M.M.; Drehmer, E.; Ortí, J.E.D.L.R. The Impact of Coconut Oil and Epigallocatechin Gallate on the Levels of IL-6, Anxiety and Disability in Multiple Sclerosis Patients. Nutrients 2020, 12, 305. [Google Scholar] [CrossRef] [PubMed] [Green Version]
- Zupo, R.; Lampignano, L.; Lattanzio, A.; Mariano, F.; Osella, A.R.; Bonfiglio, C.; Giannelli, G.; De Pergola, G. Association between adherence to the Mediterranean Diet and circulating Vitamin D levels. Int. J. Food Sci. Nutr. 2020, 71, 884–890. [Google Scholar] [CrossRef]
- Dalamaga, M.; Muscogiuri, G.; Paganitsa, G.; Parvouleskou, G.; Syriou, V.; Karagkoynis, P.; Stratigou, T.; Vallianou, N.; Christodoulatos, G.S.; Karampela, I.; et al. Adherence to the Mediterranean diet is an independent predictor of circulating vitamin D levels in normal weight and non-smoker adults: An observational cross-sectional study. Int. J. Food Sci. Nutr. 2021, 72, 848–860. [Google Scholar] [CrossRef] [PubMed]
- Weinstock-Guttman, B.; Baier, M.; Park, Y.; Feichter, J.; Lee-Kwen, P.; Gallagher, E.; Venkatraman, J.; Meksawan, K.; Deinehert, S.; Pendergast, D.; et al. Low fat dietary intervention with omega-3 fatty acid supplementation in multiple sclerosis patients. Prostaglandins Leukot. Essent. Fat Acids 2005, 73, 397–404. [Google Scholar] [CrossRef]
- Bujtor, M.; Turner, A.I.; Torres, S.J.; Esteban-Gonzalo, L.; Pariante, C.; Borsini, A. Associations of Dietary Intake on Biological Markers of Inflammation in Children and Adolescents: A Systematic Review. Nutrients 2021, 13, 356. [Google Scholar] [CrossRef]
- Hart, M.J.; Torres, S.J.; McNaughton, S.A.; Milte, C.M. Dietary patterns and associations with biomarkers of inflammation in adults: A systematic review of observational studies. Nutr. J. 2021, 20, 24. [Google Scholar] [CrossRef]
- Ciubotaru, I.; Lee, Y.-S.; Wander, R.C. Dietary fish oil decreases C-reactive protein, interleukin-6, and triacylglycerol to HDL-cholesterol ratio in postmenopausal women on HRT. J. Nutr. Biochem. 2003, 14, 513–521. [Google Scholar] [CrossRef]
- Hruby, A.; Jacques, P.F. Dietary Protein and Changes in Biomarkers of Inflammation and Oxidative Stress in the Fram-ingham Heart Study Offspring Cohort. Curr. Dev. Nutr. 2019, 3, nzz019. [Google Scholar] [CrossRef] [PubMed] [Green Version]
- Niramitmahapanya, S.; Harris, S.S.; Dawson-Hughes, B. Type of Dietary Fat Is Associated with the 25-Hydroxyvitamin D3 Increment in Response to Vitamin D Supplementation. J. Clin. Endocrinol. Metab. 2011, 96, 3170–3174. [Google Scholar] [CrossRef] [Green Version]
- da Costa Louzada, M.L.; Martins, A.P.B.; Canella, D.S.; Baraldi, L.G.; Levy, R.B.; Claro, R.M.; Moubarac, J.C.; Cannon, G.; Monteiro, C.A. Impact of ultra-processed foods on micronutrient content in the Brazilian diet. Rev. Saude Publica 2015, 49, 45. [Google Scholar]
- Baer, D.J.; Judd, J.T.; Clevidence, B.A.; Tracy, R.P. Dietary fatty acids affect plasma markers of inflammation in healthy men fed controlled diets: A randomized crossover study. Am. J. Clin. Nutr. 2004, 79, 969–973. [Google Scholar] [CrossRef] [PubMed] [Green Version]
- Food and Agriculture Organization of the United Nations (Ed.) Fats and Fatty Acids in Human Nutrition: Report of an Expert Consultation; Food and Agriculture Organization of the United Nations: Geneva, Switzerland; Rome, Italy, 2010. [Google Scholar]


| Median (IQR) | |
|---|---|
| Age (y) | 47 (15) |
| EDSS | 3.5 (3.9) |
| BMI (kg/m2) | 23.88 (6.9) |
| Time from MS diagnosis (m) | 12 (14) |
| b | t | p-Value | VIF | |
|---|---|---|---|---|
| Constant | 9.447 | 2.482 | 0.025 | |
| Age (y) | 0.01 | 0.261 | 0.798 | 1.155 |
| MS type | −1.907 | −1.986 | 0.064 | 1.633 |
| EDSS | 0.181 | 0.932 | 0.365 | 1.471 |
| BMI (kg/m2) | −0.063 | −0.868 | 0.398 | 1.385 |
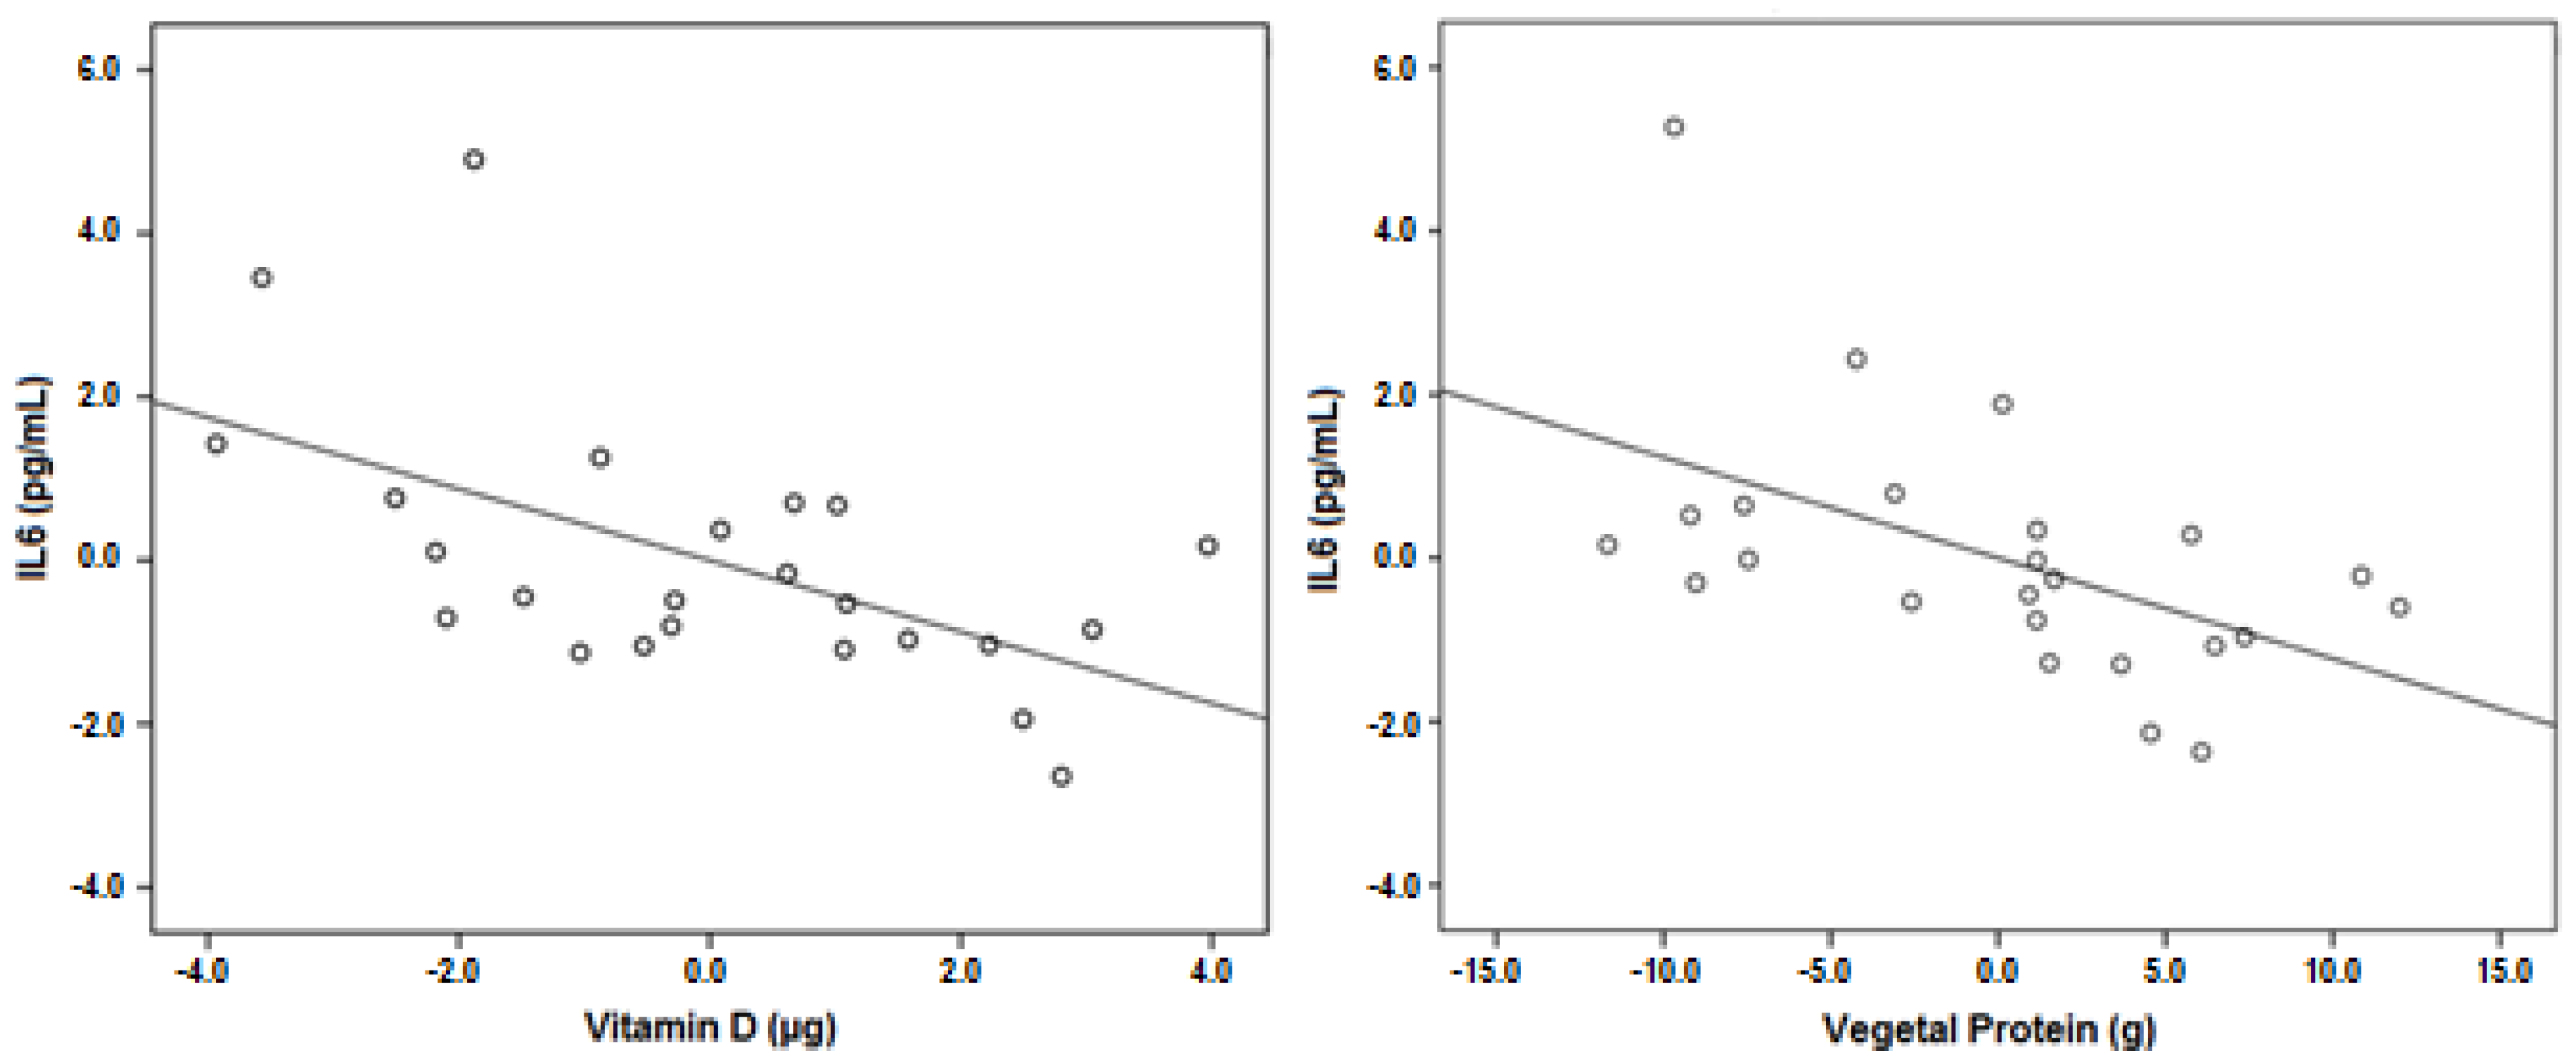
| Vitamin D (µg) | −0.437 | −2.774 | 0.014 | 1.473 |
| Animal Protein (g) | 0.031 | 1.297 | 0.213 | 1.478 |
| Vegetable Protein (g) | −0.123 | −2.462 | 0.026 | 1.307 |
Publisher’s Note: MDPI stays neutral with regard to jurisdictional claims in published maps and institutional affiliations. |
© 2021 by the authors. Licensee MDPI, Basel, Switzerland. This article is an open access article distributed under the terms and conditions of the Creative Commons Attribution (CC BY) license (https://creativecommons.org/licenses/by/4.0/).
Share and Cite
de la Rubia Ortí, J.E.; García, M.F.; Drehmer, E.; Navarro-Illana, E.; Casani-Cubel, J.; Proaño, B.; Sanchis-Sanchis, C.E.; Escrivá, J.D. Intake of Vitamin D in Patients with Multiple Sclerosis in the Valencian Region and Its Possible Relationship with the Pathogenesis of the Disease. Life 2021, 11, 1380. https://doi.org/10.3390/life11121380
de la Rubia Ortí JE, García MF, Drehmer E, Navarro-Illana E, Casani-Cubel J, Proaño B, Sanchis-Sanchis CE, Escrivá JD. Intake of Vitamin D in Patients with Multiple Sclerosis in the Valencian Region and Its Possible Relationship with the Pathogenesis of the Disease. Life. 2021; 11(12):1380. https://doi.org/10.3390/life11121380
Chicago/Turabian Stylede la Rubia Ortí, Jose Enrique, María Faus García, Eraci Drehmer, Esther Navarro-Illana, Julia Casani-Cubel, Belén Proaño, Claudia Emmanuela Sanchis-Sanchis, and Juan Doménech Escrivá. 2021. "Intake of Vitamin D in Patients with Multiple Sclerosis in the Valencian Region and Its Possible Relationship with the Pathogenesis of the Disease" Life 11, no. 12: 1380. https://doi.org/10.3390/life11121380