Article

Health-Related Quality of Life and Frailty in Chronic Liver Diseases

1
Department of Internal Medicine, Division of Gastroenterology and Hepatology, Hyogo College of Medicine, Nishinomiya, Hyogo 663-8501, Japan
2
Center for Clinical Research and Education, Hyogo College of Medicine, Nishinomiya, Hyogo 663-8501, Japan
3
Kano General Hospital, Osaka 531-0041, Japan
*
Author to whom correspondence should be addressed.
These authors equally contributed to the current work.
Life 2020, 10(5), 76; https://doi.org/10.3390/life10050076
Submission received: 3 May 2020 / Revised: 22 May 2020 / Accepted: 22 May 2020 / Published: 24 May 2020
(This article belongs to the Section Medical Research)

Abstract

:
We sought to examine the relationship between frailty and health-related quality of life as evaluated using the 36-item Short-Form Health Survey (SF-36) questionnaire in Japanese chronic liver disease (CLD) patients (n = 341, 122 liver cirrhosis cases, median age = 66 years). Frailty was defined as a clinical syndrome in which three or more of the following criteria were met (frailty score 3, 4, or 5): unintentional body weight loss, self-reported exhaustion, muscle weakness (grip strength: <26 kg in men and <18 kg in women), slow walking speed (<1.0 m/s), and low physical activity. Robust (frailty score 0), prefrail (frailty score 1 or 2), and frailty were found in 108 (31.7%), 187 (54.8%), and 46 (13.5%) patients, respectively. In all eight scales of the SF-36 (physical functioning, role physical, bodily pain, general health perception, vitality, social functioning, role emotion, and mental health), and the physical component summary score and mental component summary score, each score was well stratified according to the frailty status (all p < 0.0001). In the multivariate analysis, age (p = 0.0126), physical functioning (p = 0.0005), and vitality (p = 0.0246) were independent predictors linked to the presence of frailty. In conclusion, Japanese CLD patients with frailty displayed poorer conditions, both physically and mentally.

1. Introduction

Health-related quality of life (Hr-QoL) is a globally used patient-reported clinical outcome for patients with various diseases and the number of pivotal clinical trials with Hr-QOL as additional study endpoints (most of them are secondary endpoints) has been increasing [1,2,3,4,5,6]. In particular, chronic liver diseases (CLDs) can significantly influence Hr-QOL [7,8,9,10,11,12,13]. Ameliorating Hr-QoL in patients with CLDs should be a pivotal treatment goal because of their unfavorable clinical and patient-reported outcomes and economic burdens [7,8,9,10,11,12,14,15]. The 36-item Short-Form Health Survey (SF-36) is one of the most extensively used modalities for assessing Hr-QoL [16,17,18,19,20].
Frailty is a condition in which physical and mental vitality (motor function, cognitive function, etc.) declines with age, living functions are impaired, and mental and/or physical fragility appears because of the coexistence of multiple chronic diseases [21,22,23]. With appropriate interventions, it is possible to maintain and improve living functions [21,22,23]. Frailty is a condition between a healthy condition and a nursing condition that requires support in daily life [21,22,23]. Recently, the concept of frailty has been enlarged to CLDs as clinical symptoms of impaired global physical function [14,24]. In patients with decreased liver function, frailty can occur regardless of age [25,26]. The median age of liver cirrhosis (LC) patients with frailty was reported to be 59 years [26]. Thus, disease-specific frailty can be a point of focus.
A previous meta-analysis reported that patients with frailty had significantly lower mental and physical QOL scores as assessed by the SF-36 than those with robust, community-dwelling older people [27]. In patients with end-stage liver disease referred for liver transplantation, a decreased Hr-QoL was negatively associated with frailty with statistical significance and not with the Model for End-Stage Liver Disease score [28]. Nixon et al. reported that frailty is independently associated with worse Hr-QoL in patients with severe chronic kidney injuries [29]. Frailty can thus be associated with Hr-QoL in various diseases. However, as far as we know, few data regarding the relevance between Hr-QoL and frailty in Japanese CLD patients are currently available. In this study, we sought to examine the relationship between frailty and Hr-QoL as evaluated by the SF-36 questionnaire in Japanese CLD patients.

2. Patients and Methods

2.1. Patients

A total of 341 CLD patients who visited our hospital between July 2015 and October 2019 were analyzed. All of these patients had data for frailty and SF-36. A case with CLD was a case confirmed to be accompanied by inflammation of the liver that had continued for 6 months or more at the time of the visit or in the past. LC was determined via histological findings, imaging studies, and/or laboratory data. Frailty was defined as a clinical syndrome in which three or more of the following criteria were met (i.e., frailty score 3, 4, or 5): unintentional body weight (BW) loss (2 kg, 3 kg, or more BW loss within the past 6 months), self-reported exhaustion, muscle weakness (grip strength (GS): < 26 kg in men and < 18 kg in women), slow walking speed (WS, < 1.0 m/s), and low physical activity (doing light exercise or not), while prefrail was defined as patients with one or two above-mentioned phenotypes (i.e., frailty score 1 or 2). Patients with none of five phenotypes were regarded as having a robust status (frailty score 0) [30,31]. These criteria are reported by Satake and Arai as the Japanese version of Cardiovascular Health Study (CHS) criteria [30]. GS was measured according to the current guidelines [32]. In all analyzed subjects, a six-meter walking test was done. The six-meter walking test was done twice in all subjects and the WS (m/s) was defined as the mean value of them. The assessment of frailty and the questionnaire using SF-36 in each patient were done on the same day. Patients with large ascites or overt hepatic encephalopathy who are potentially involved in frailty were excluded due to unreliable self-reporting.

2.2. Questionnaire

Our patients were requested to fill out the Japanese version of the SF-36 (self-reported questionnaire). The SF-36 consists of 36 items that are classified into multiple scales (a total of eight scales): physical functioning, role physical, bodily pain, general health perception, vitality, social functioning, role emotion, and mental health [33,34,35,36]. Each scale is scored from 0 to 100 points, and a higher score on the scale indicates a better health status [33,34,35,36]. The physical component summary score (PCS) and the mental component summary score (MCS) were additionally calculated and examined.

2.3. Our Study

We retrospectively examined the relationship between the frailty status and the values of the eight scales of SF-36, the PCS, and the MCS. Ethical approval was obtained from the ethics committee of our hospital. The protocol in the study rigorously observed all regulations of the Declaration of Helsinki.

2.4. Statistical Considerations

JMP 14 software (SAS Institute Inc., Cary, NC, USA) was used to perform the statistical analysis. For the numerical variables, Student’s t-test, the Mann–Whitney U-test, analysis of variance, or the Kruskal–Wallis test was used to assess group characteristics when appropriate. Numerical data were expressed as the median value (interquartile range (IQR)). Baseline significant items in our univariate analysis were subject to the multivariate logistic regression analysis to select candidate parameters. The statistical significance level was set at p < 0.05.

3. Results

3.1. Patient Baseline Data

The baseline data in this study (n = 341, 164 men and 177 women, median age = 66.0 years) are indicated in Table 1. LC was identified at baseline in 122 cases (35.8%). Of these, there were 85 patients with Child–Pugh A, 33 with Child–Pugh B, and 4 with Child–Pugh C. ALBI (albumin-bilirubin) grade 1 was found in 256 patients (75.1%), grade 2 in 78 (22.9%), and grade 3 in 7 (2.1%). The ALBI grade means a grading system with a combined serum albumin level and bilirubin level in patients with liver diseases; it has been introduced as a prognostic system alternative to the Child–Pugh classification system [37]. Non-B, non-C related CLDs included: alcoholic liver injury in 6, autoimmune liver disease in 32; fatty liver or non-alcoholic steatohepatitis in 17; and others, including unknown etiology after sufficient screening, in 44. The median (IQR) WS was 1.30 (1.10, 1.44) m/s. Fifty-one patients (15.0%) displayed a WS decrease (i.e., <1.0 m/s). One-hundred-and-sixty-eight patients (49.3%) reported exhaustion. Fifteen patients (4.4%) reported BW loss. Ninety patients (26.4%) reported low physical activity. The frailty score ranged from 0 to 5 (median, 1). Robust (frailty score 0), prefrail (frailty score 1 or 2), and frailty (frailty score 3 or more) were identified in 108 (31.7%), 187 (54.8%), and 46 (13.5%) patients, respectively. The median (IQR) age in patients with robust, prefrail, and frailty for all cases were 61 (50.25, 68) years, 66 (56, 73) years, and 73 (68, 75.25) years (overall p-value < 0.0001). The median (IQR) scores of the eight scales of SF-36 were: 90 (80, 95) in physical function, 100 (75, 100) in role physical, 74 (52, 100) in bodily pain, 55 (45, 71) in general health perception, 68.8 (56.2, 81.3) in vitality, 100 (75, 100) in social functioning, 100 (75, 100) in role emotion, and 80 (65, 90) in mental health (Figure 1). The median (IQR) PCS and MCS were 51.1 (41.2, 54.3) and 53.6 (46.0, 59.2).

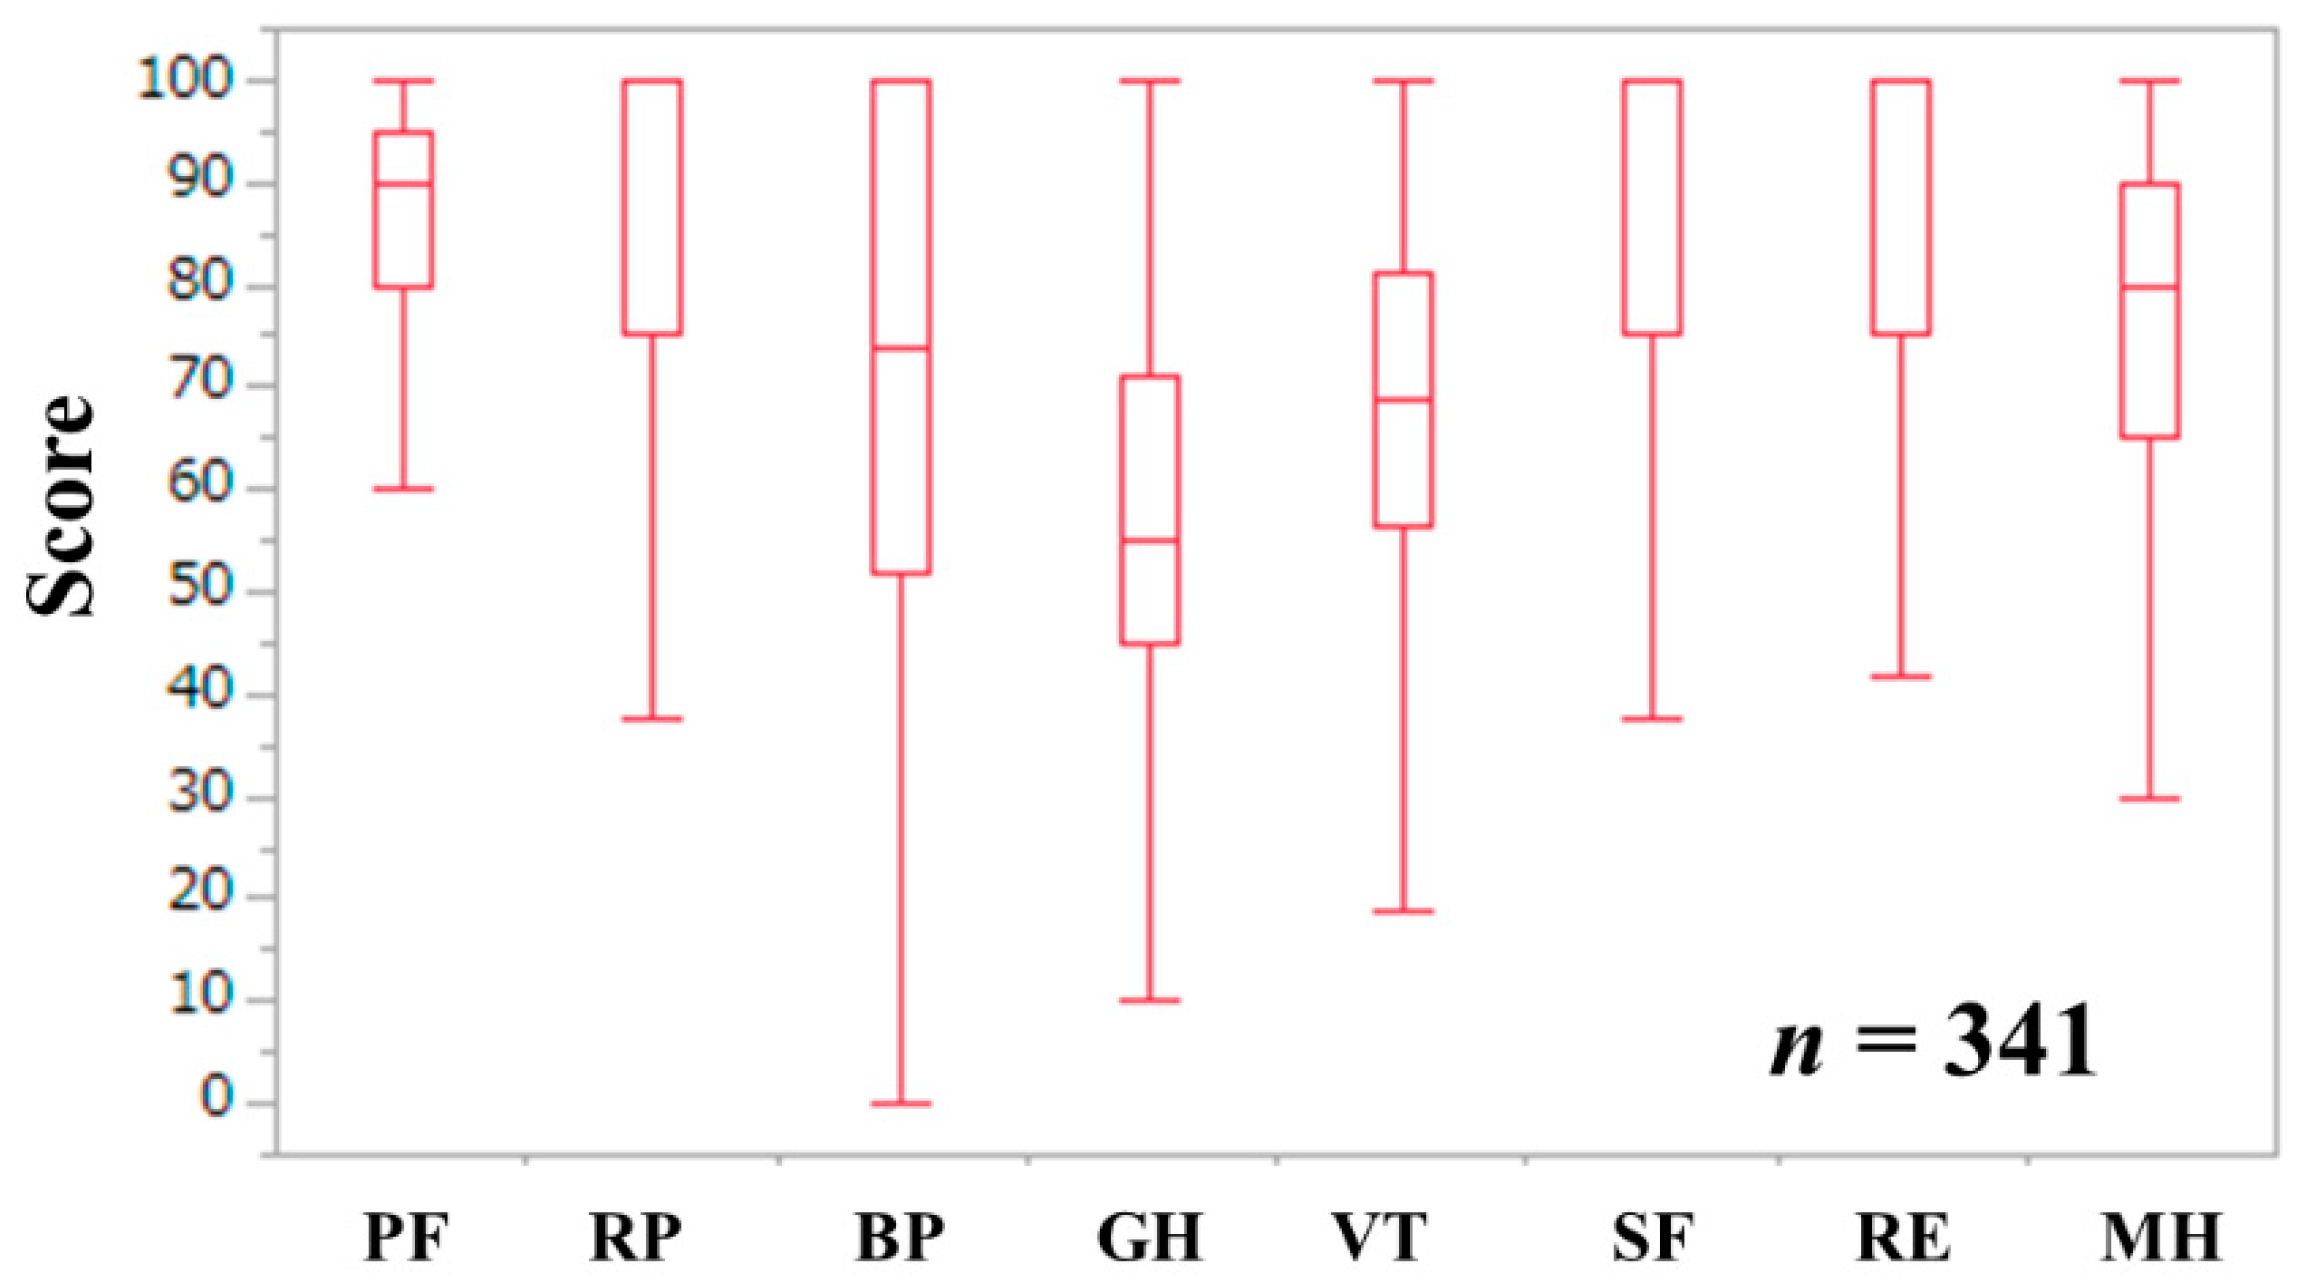
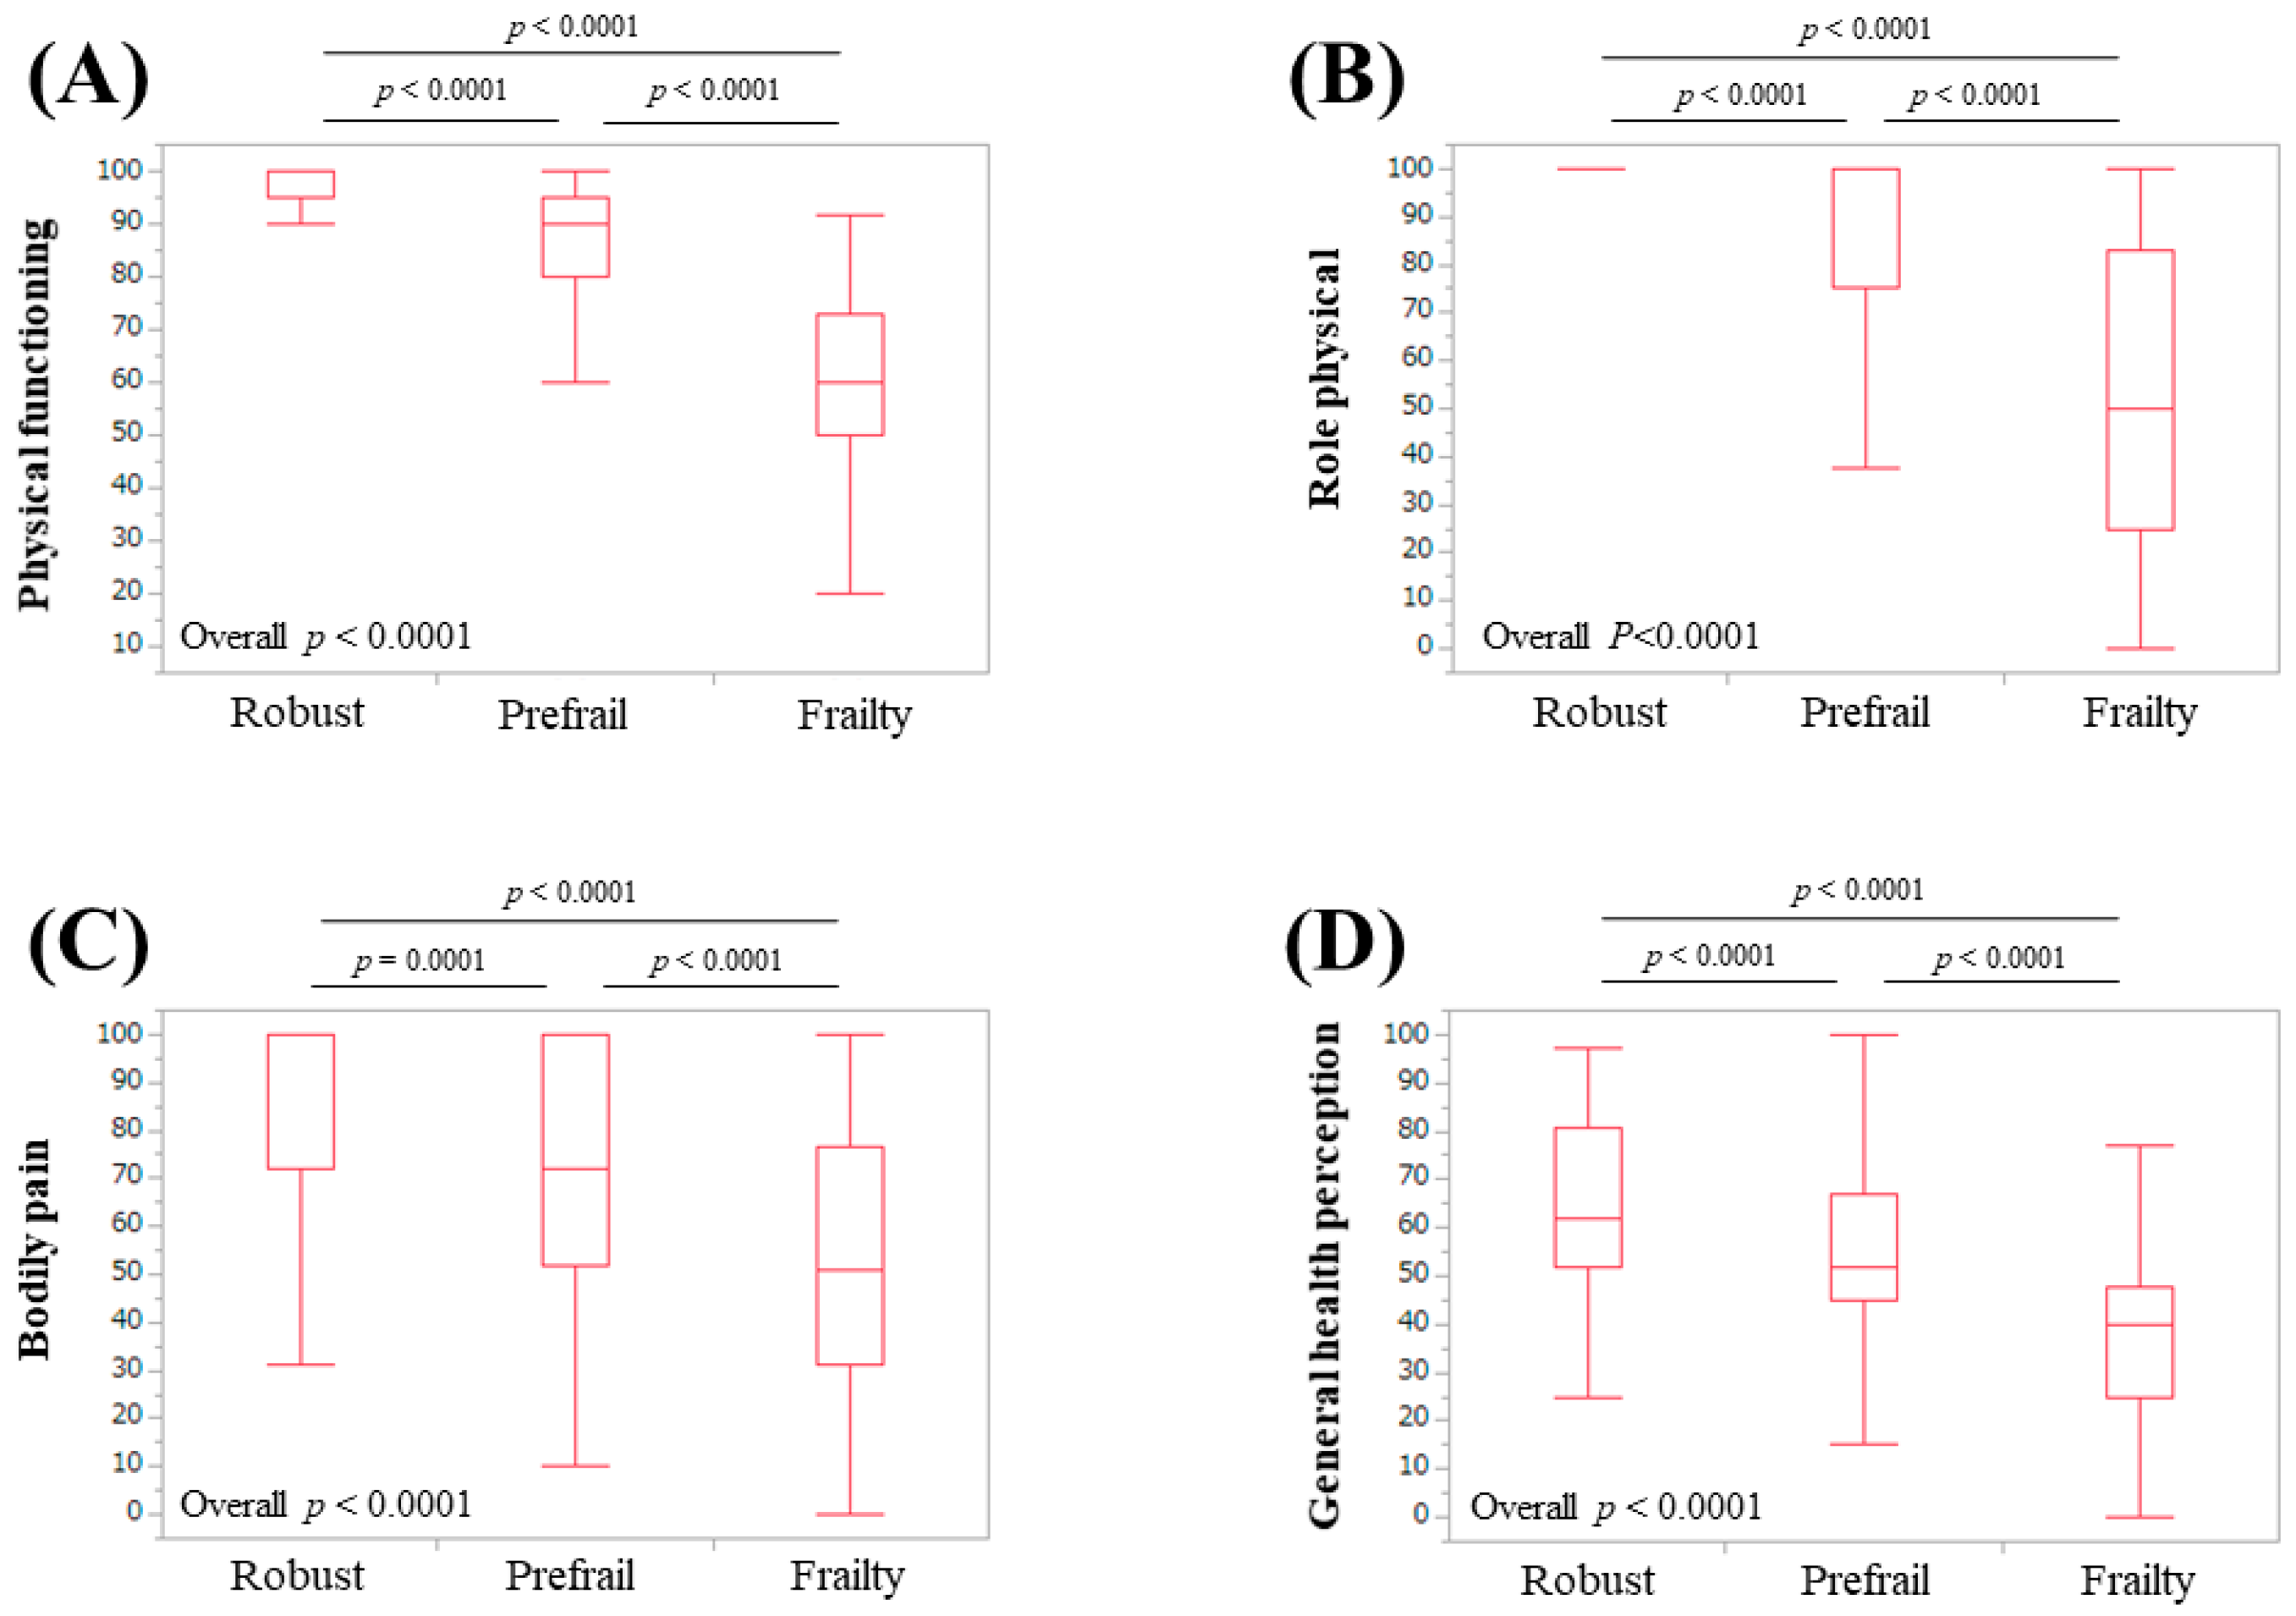
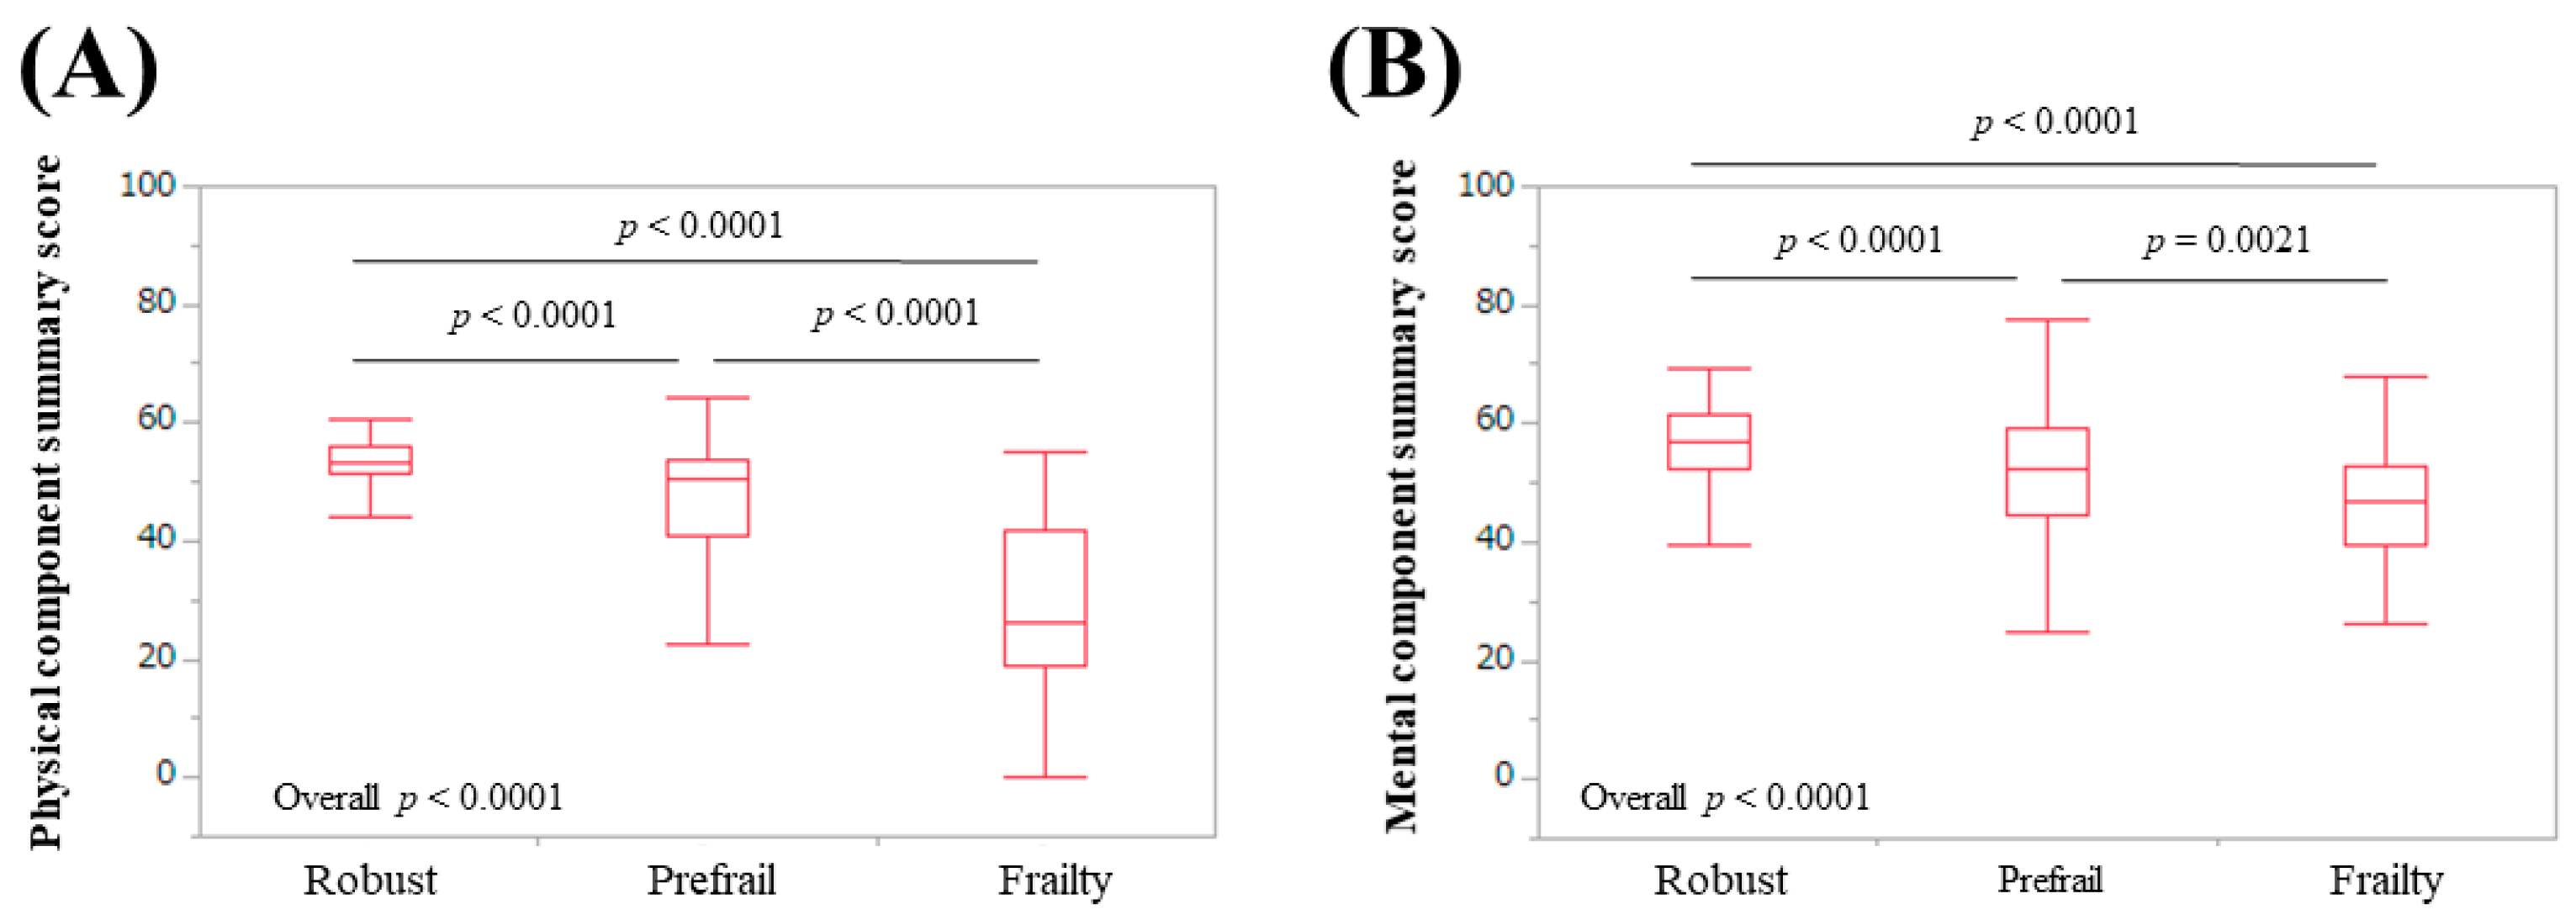
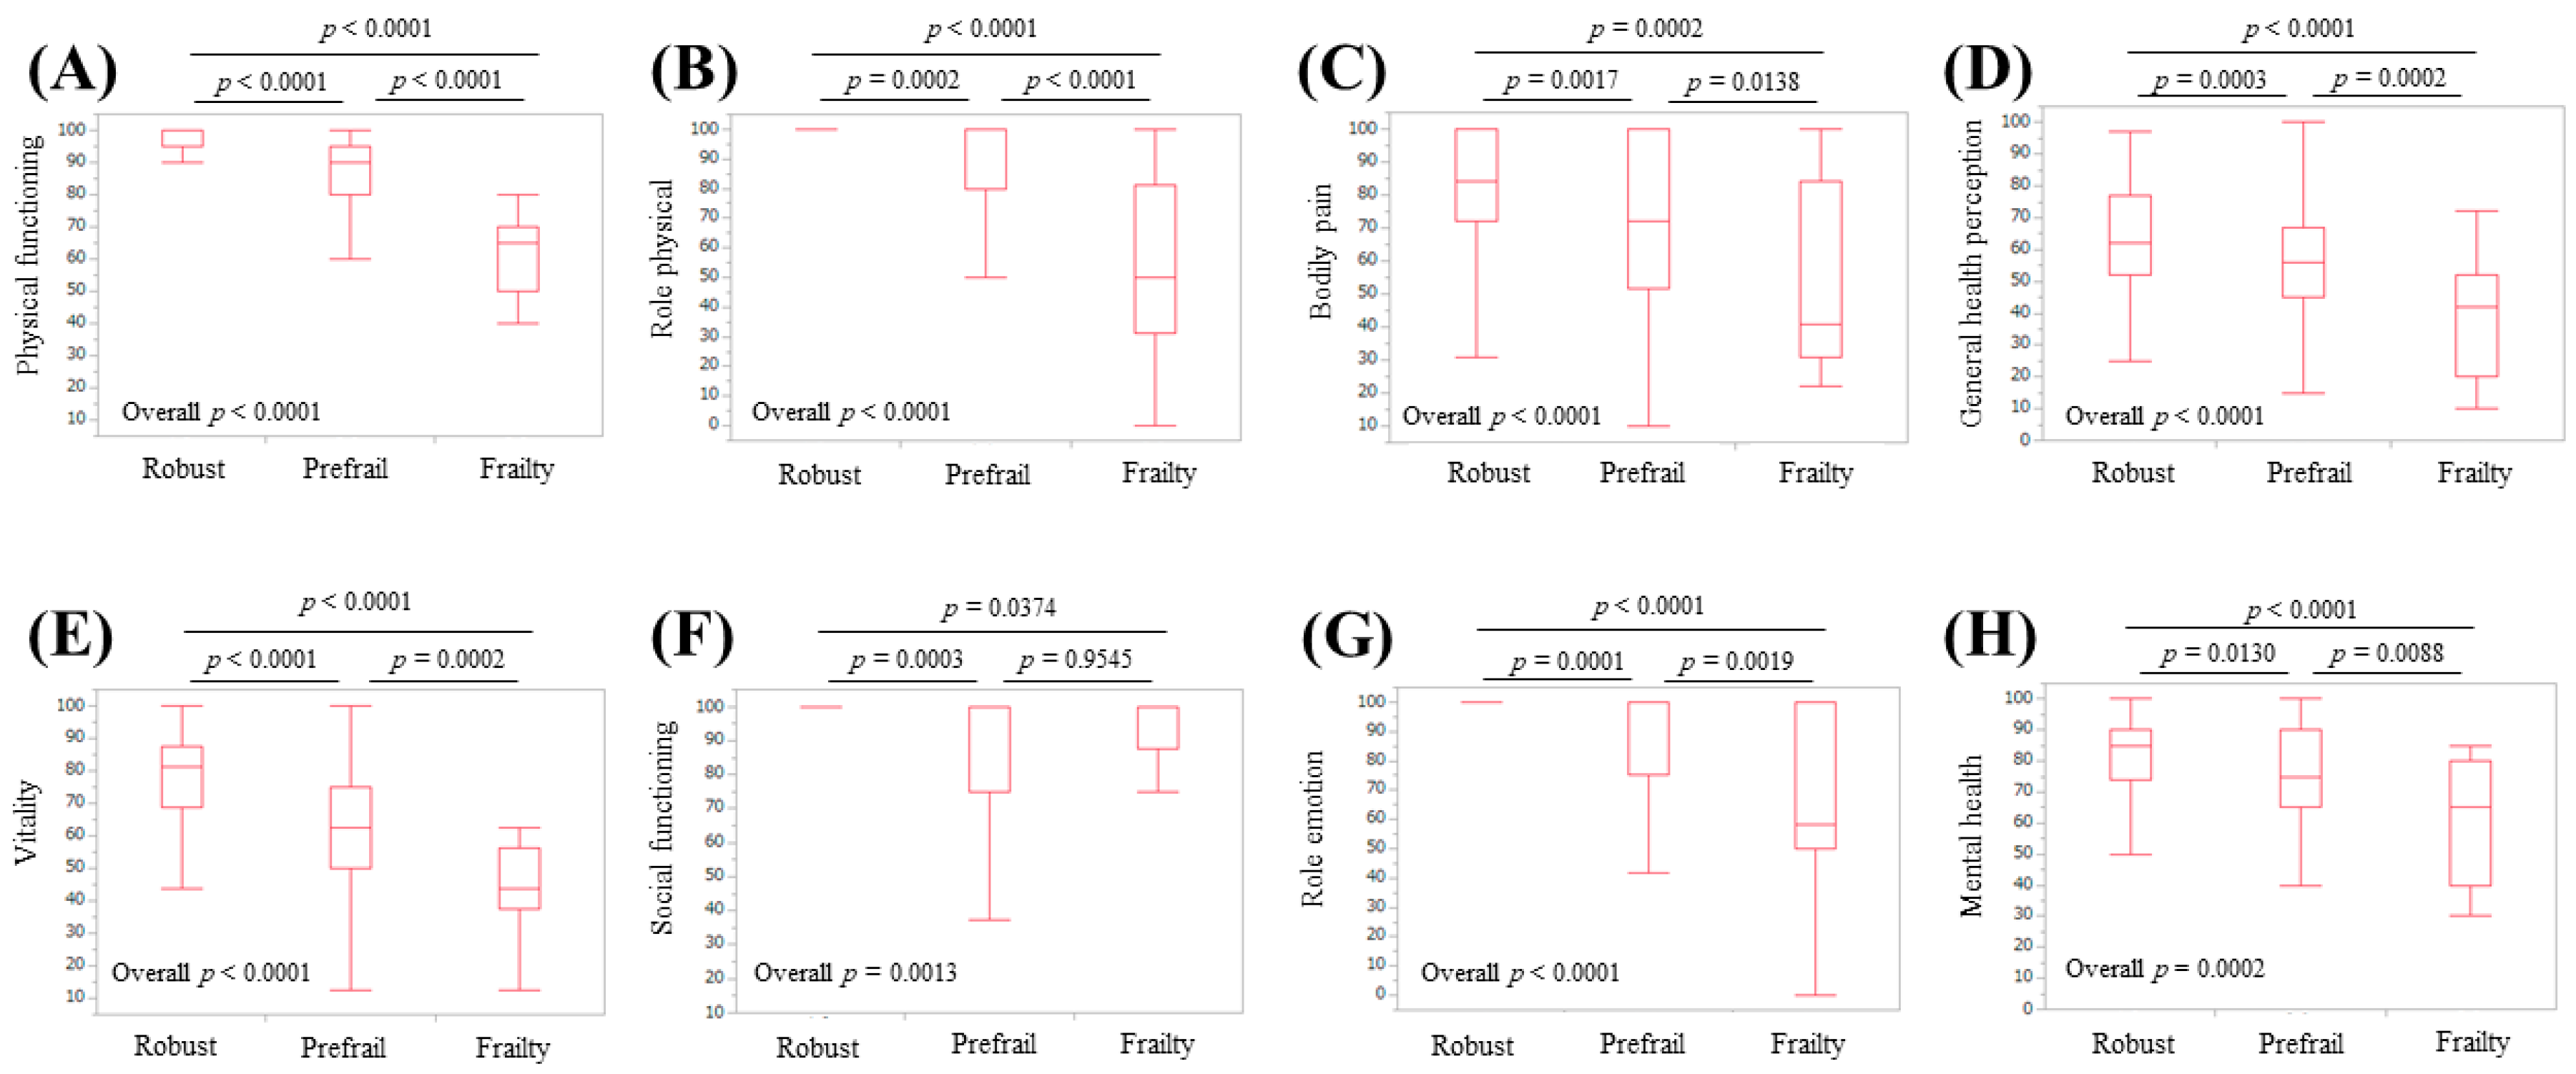
3.2. Scores of the Eight Scales of the SF-36, the PCS, and the MCS Relative to the Frailty Status

The median (IQR) physical functioning scores in patients classified as robust, prefrail, and frail were 95 (95,100), 90 (80, 95), and 60 (50, 72.9), respectively (p-values: robust vs. prefrail, p < 0.0001; prefrail vs. frail, p < 0.0001; frail vs. robust, p < 0.0001; overall p < 0.0001) (Figure 2A). The median (IQR) role physical scores in patients classified as robust, prefrail, and frail were 100 (100, 100), 100 (75, 100), and 50 (25, 82.85), respectively (p-values: robust vs. prefrail, p < 0.0001; prefrail vs. frail, p < 0.0001; frail vs. robust, p < 0.0001; overall p < 0.0001) (Figure 2B). The median (IQR) bodily pain scores in patients classified as robust, prefrail, and frail were 100 (72, 100), 72 (52, 100), and 51 (31, 76.5), respectively (p-values: robust vs. prefrail, p = 0.0001; prefrail vs. frail, p < 0.0001; frail vs. robust, p < 0.0001; overall p < 0.0001) (Figure 2C). The median (IQR) general health perception scores in patients classified as robust, prefrail, and frail were 62 (52, 80.75), 52 (45, 67), and 40 (25, 47.75), respectively (p-values: robust vs. prefrail, p < 0.0001; prefrail vs. frail, p < 0.0001; frail vs. robust, p < 0.0001; overall p < 0.0001) (Figure 2D). The median (IQR) vitality scores in patients classified as robust, prefrail, and frail were 81.3 (68.8, 87.5), 62.5 (50, 75), and 43.8 (25, 57.85), respectively (p-values: robust vs. prefrail, p < 0.0001; prefrail vs. frail, p < 0.0001; frail vs. robust, p < 0.0001; overall p < 0.0001) (Figure 3A). The median (IQR) social functioning scores in patients classified as robust, prefrail, and frail were 100 (100, 100), 100 (75, 100), and 87.5 (50, 100), respectively (p-values: robust vs. prefrail, p < 0.0001; prefrail vs. frail, p = 0.0047; frail vs. robust, p < 0.0001; overall p < 0.0001) (Figure 3B). The median (IQR) role emotion scores in patients classified as robust, prefrail, and frail were 100 (100, 100), 100 (75, 100), and 50 (31.225, 83.3), respectively (p-values: robust vs. prefrail, p < 0.0001; prefrail vs. frail, p < 0.0001; frail vs. robust, p < 0.0001; overall p < 0.0001) (Figure 3C). The median (IQR) mental health scores in patients classified as robust, prefrail, and frail were 85 (75, 95), 75 (60, 90), and 62.5 (43.75, 76.25), respectively (p-values: robust vs. prefrail, p = 0.0002; prefrail vs. frail, p < 0.0001; frail vs. robust, p < 0.0001; overall p < 0.0001) (Figure 3D). The median (IQR) PCS in patients classified as robust, prefrail, and frail were 53.3 (51.2, 56), 50.5 (41.05, 53.53), and 26.3 (19.1, 42), respectively (p-values: robust vs. prefrail, p < 0.0001; prefrail vs. frail, p < 0.0001; frail vs. robust, p < 0.0001; overall p < 0.0001) (Figure 4A). The median (IQR) MCS in patients classified as robust, prefrail, and frail were 56.7 (52.2, 61.3), 52.25 (44.48, 59), and 46.7 (39.7, 52.8), respectively (p-values: robust vs. prefrail, p < 0.0001; prefrail vs. frail, p = 0.0021; frail vs. robust, p < 0.0001; overall p < 0.0001) (Figure 4B).

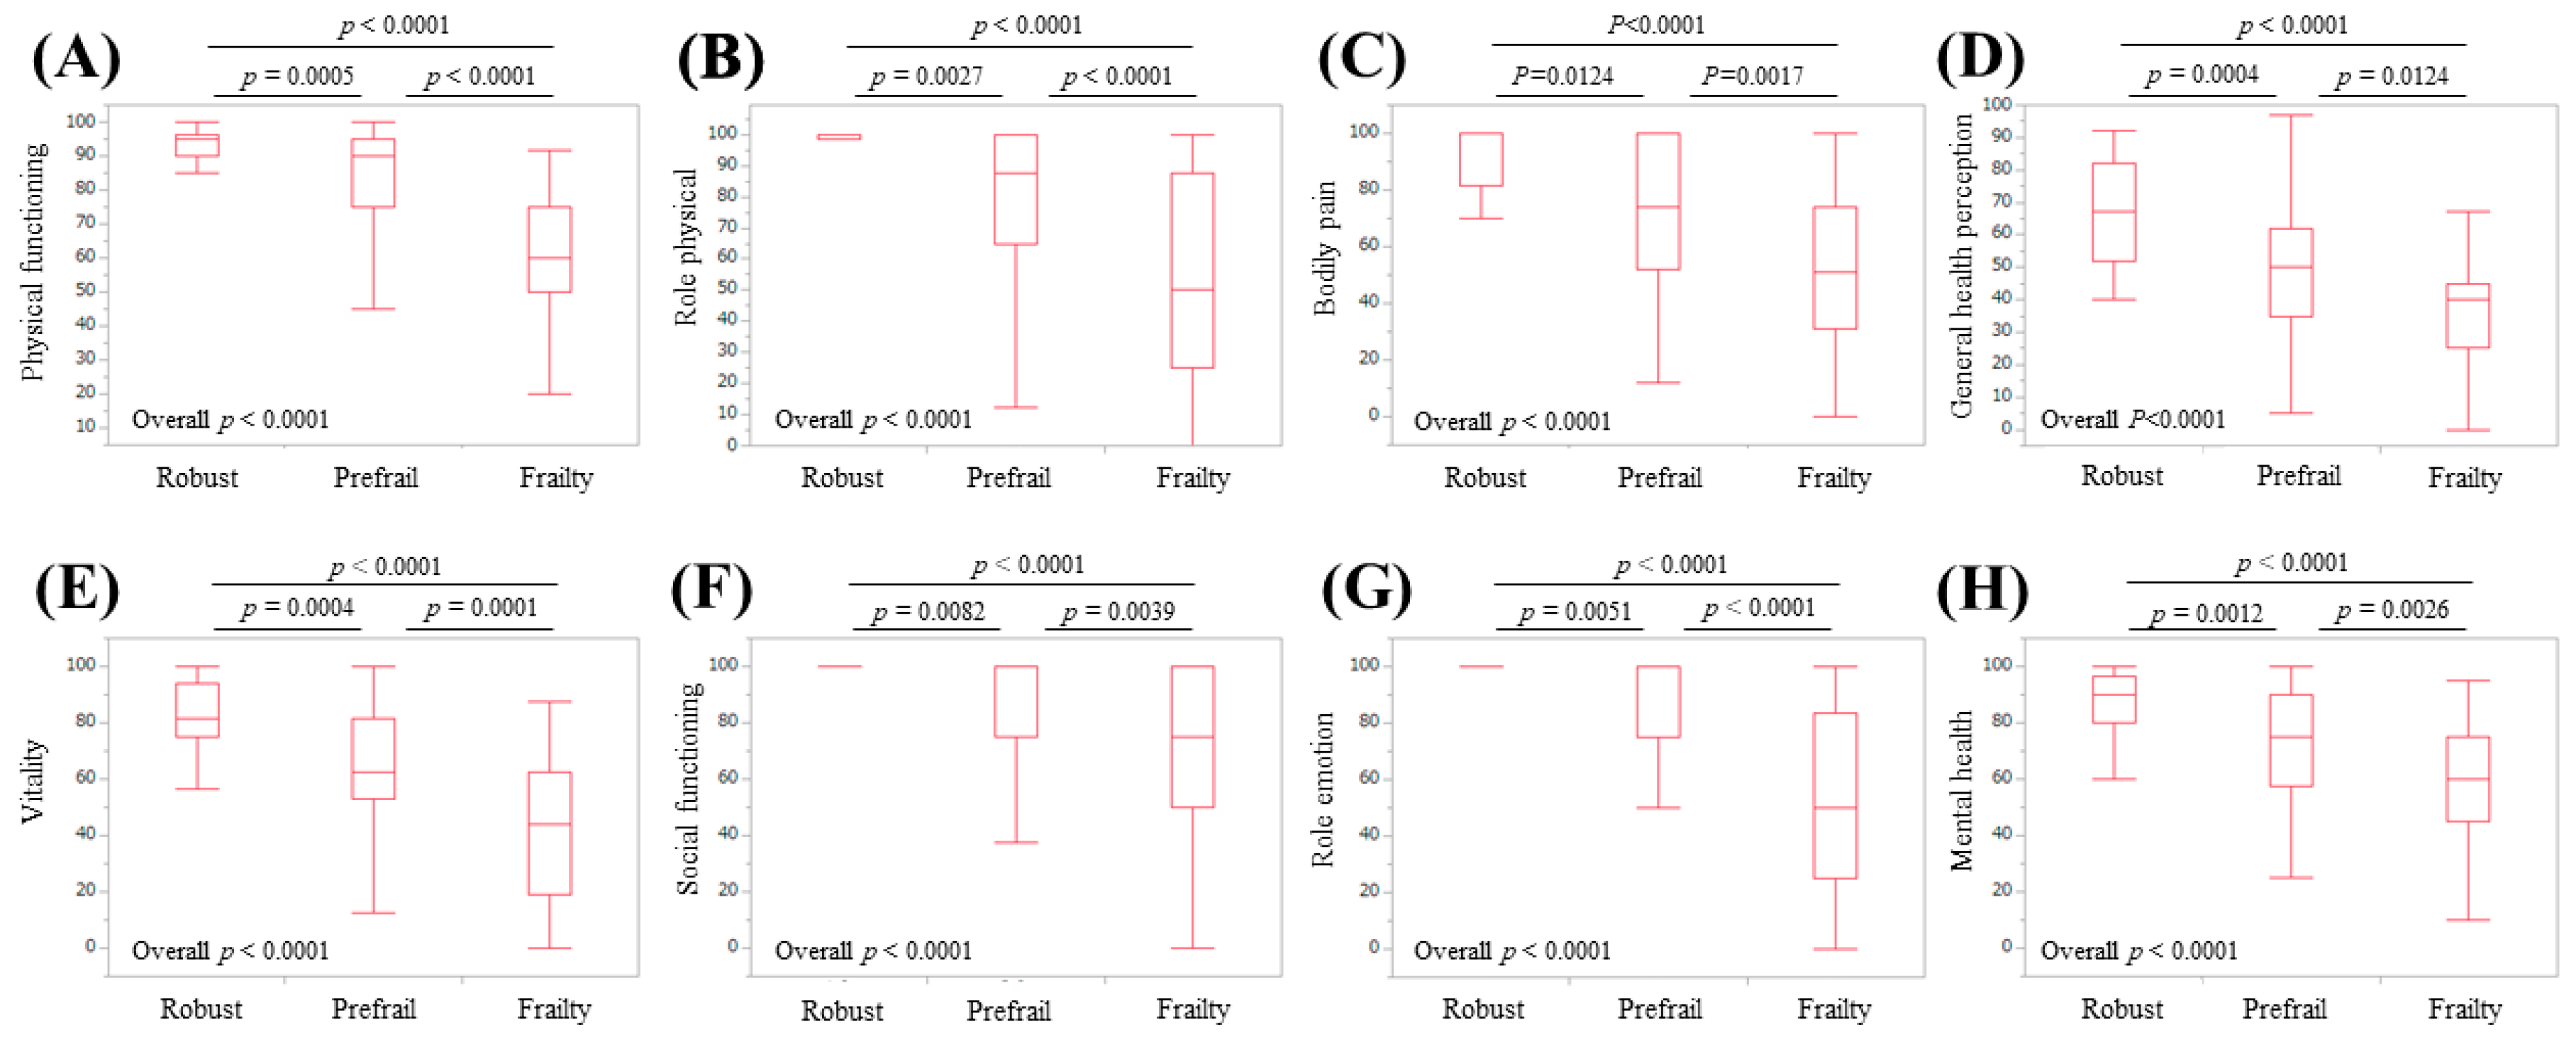
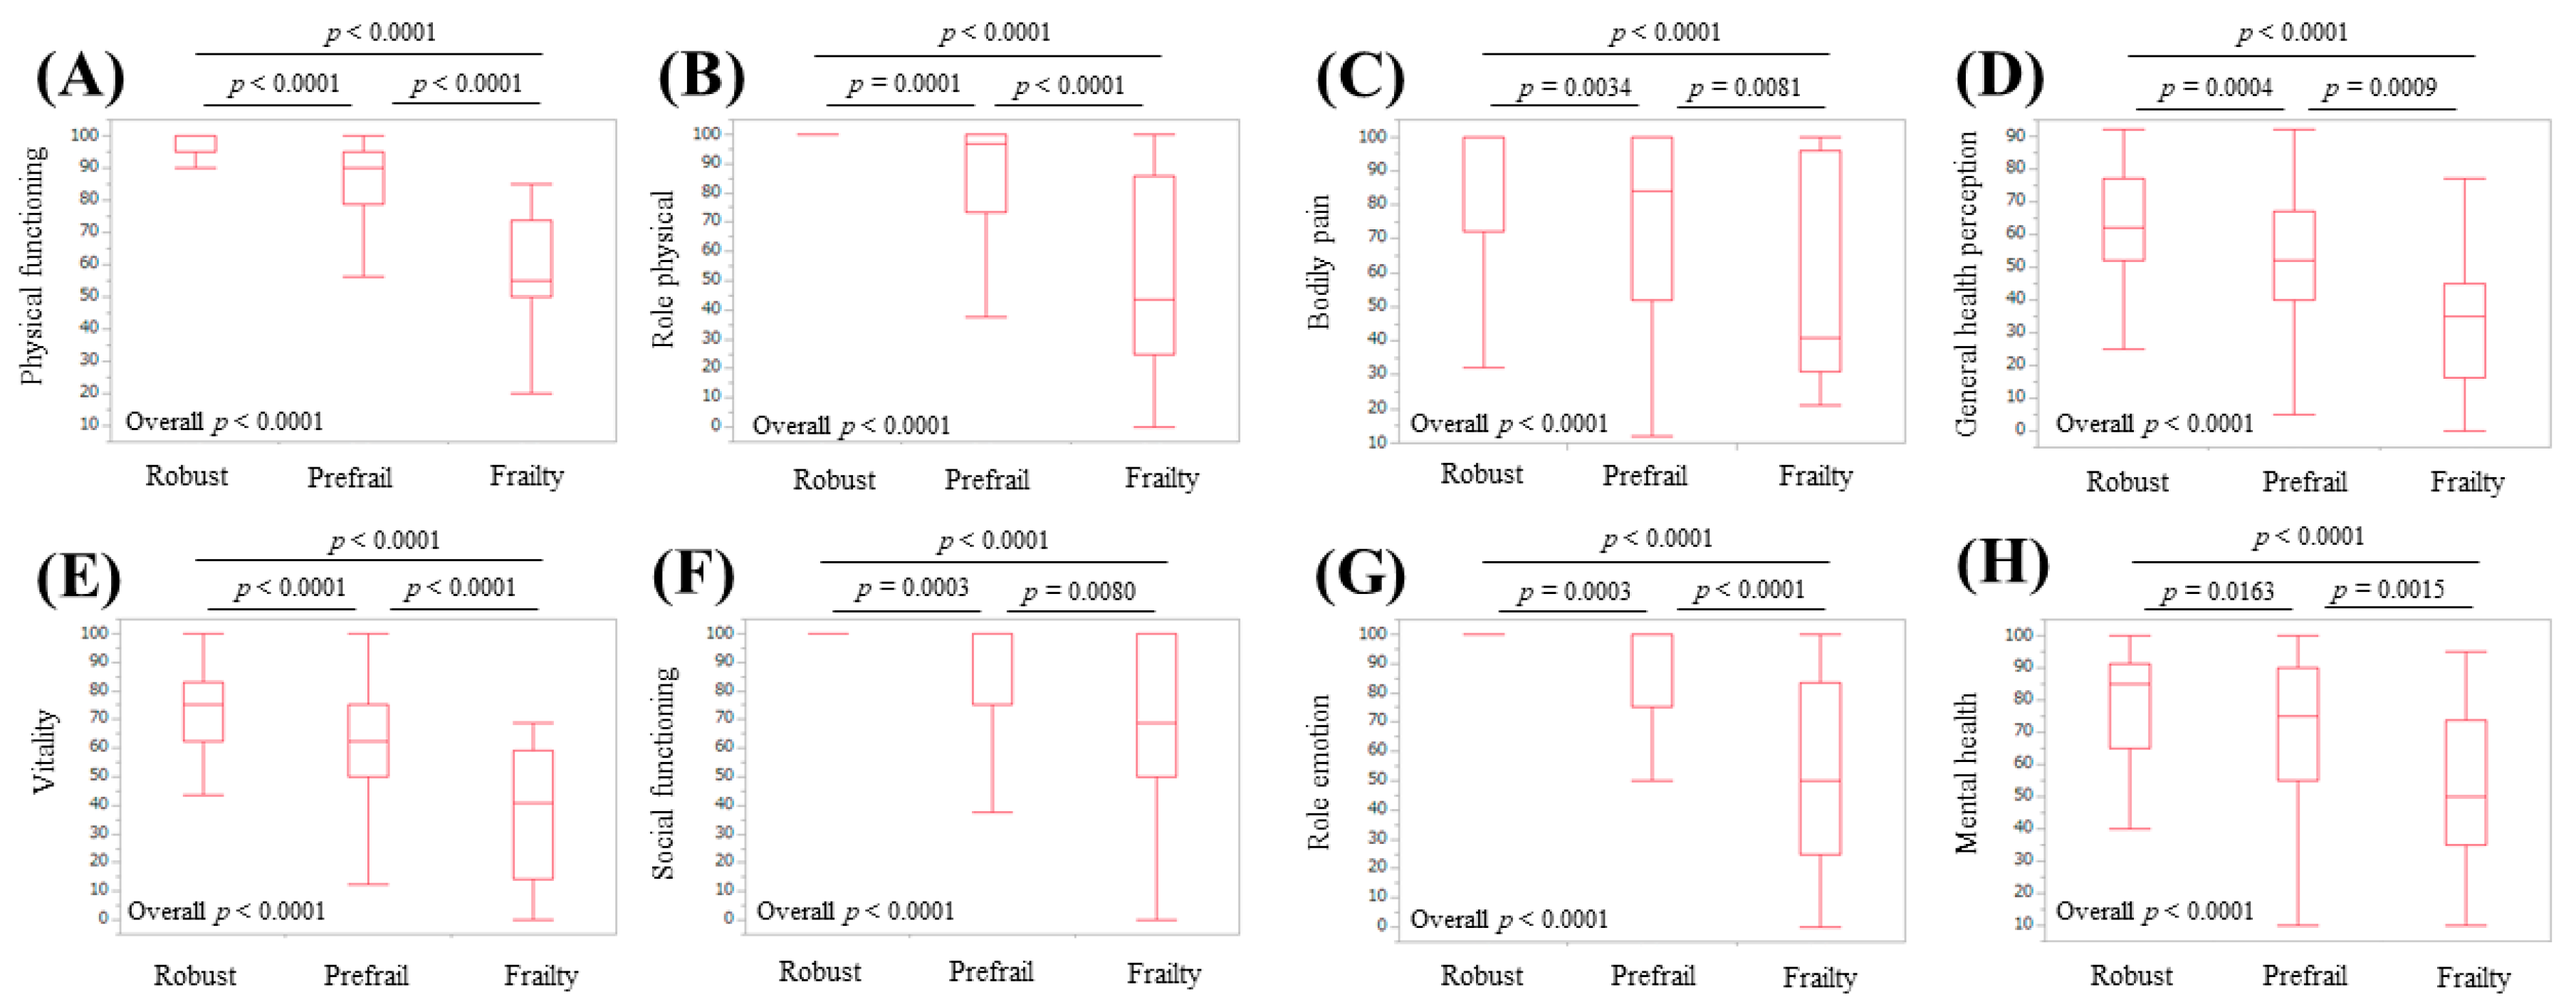
3.3. Subgroup Analysis 1: Scores of the Eight Scales of the SF-36 Relative to the Frailty Status in LC Patients

In LC patients (n = 122), robust, prefrail, and frailty statuses were identified in 22 (18.0%), 69 (56.6%), and 31 (25.4%) patients, respectively. The median (IQR) ages in LC patients classified as robust, prefrail, and frail in LC patients were 67.5 (57, 72.25) years, 68 (61.5, 73) years, and 73 (66, 76) years, respectively (overall p-value = 0.6884). For all eight scales, the overall p-values among groups of robust, prefrail, and frail patients reached significance (overall p-values: p < 0.0001 for all scales) (Figure 5).

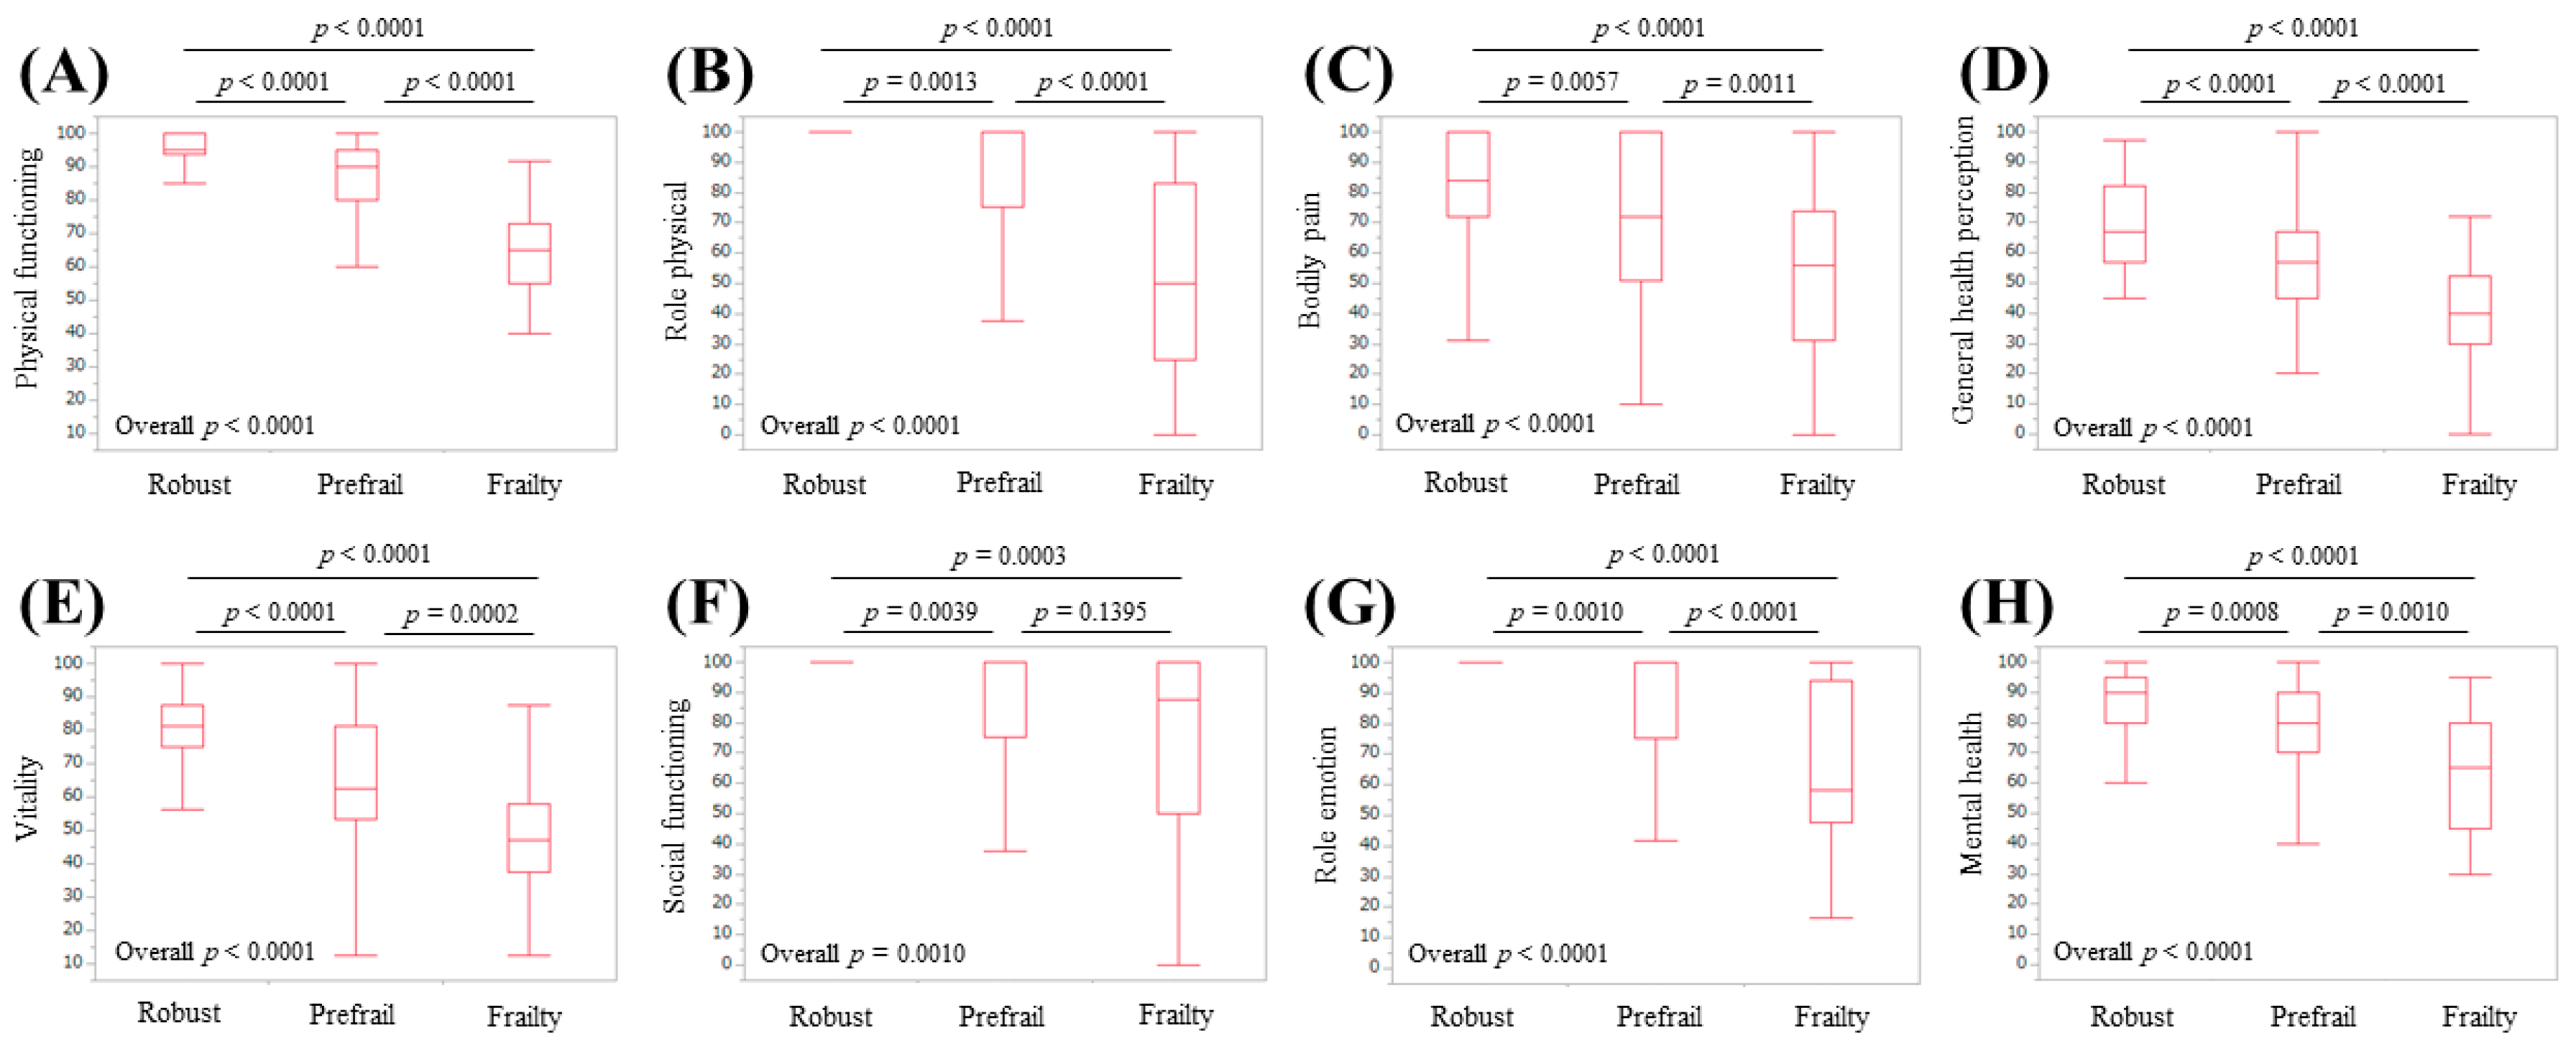
3.4. Subgroup Analysis 2: Scores of the Eight Scales of the SF-36 Relative to the Frailty Status in Non-LC Patients

In non-LC patients (n = 219), robust, prefrail, and frail statuses were identified in 86 (39.3%), 118 (53.9%), and 15 (6.8%) patients, respectively. The median (IQR) ages in non-LC patients classified as robust, prefrail, and frail were 59.5 (48, 66) years, 64.5 (52, 72) years, and 73 (70, 75) years (overall p-value < 0.0001). For all eight scales, the overall p-values of the robust, prefrail, and frail groups reached significance (overall p-values: p = 0.0013 for social functioning, p = 0.0002 for mental health, p < 0.0001 for the remaining six scales) (Figure 6).

3.5. Subgroup Analysis 3: Scores of the Eight Scales of the SF-36 Relative to the Frailty Status in Male Patients

In male patients (n = 164), robust, prefrail, and frail statuses were identified in 54 (32.9%), 90 (54.9%), and 20 (12.2%) patients, respectively. For all eight scales, the overall p-values of the robust, prefrail, and frail groups reached significance (overall p-values: p < 0.0001 in all scales) (Figure 7).

3.6. Subgroup Analysis 4: Scores of the Eight Scales of the SF-36 Relative to the Frailty Status in Female Patients

In female patients (n = 177), robust, prefrail, and frail statuses were identified in 54 (30.5%), 97 (54.8%), and 26 (14.7%) patients, respectively. For all eight scales, the overall p-values of the robust, prefrail, and frail groups reached significance (overall p-values: p = 0.0010 for social functioning and p < 0.0001 for the remaining seven scales) (Figure 8).

3.7. Univariate and Multivariate Analysis of Factors Linked to Frailty

A univariate analysis identified the following significant factors linked to frailty; age (p = 0.0002), presence of LC (p < 0.0001), serum albumin (p < 0.0001), physical functioning (p < 0.0001), role physical (p < 0.0001), bodily pain (p < 0.0001), general health perception (p < 0.0001), vitality (p < 0.0001), social functioning (p < 0.0001), role emotion (p < 0.0001), and mental health (p < 0.0001) (Table 2). In the multivariate analysis, age (p = 0.0126), physical functioning (p = 0.0005), and vitality (p = 0.0246) were independent predictors linked to frailty, while the presence of LC tended to be significant (p = 0.0685) (Table 2).

4. Discussion

Frailty is a multi-dimensional disease concept that represents the end-stage manifestation of disorders in numerous physiological systems, resulting in physiological reserve decline and an increase in vulnerability to health stressors [15]. The SF-36 can measure the Hr-QoL for various diseases and can compare the Hr-QoL between patients with different diseases [33,34,35,36]. To the best of our knowledge, this is the first study elucidating the relationship between frailty and Hr-QoL as assessed using the SF-36 in Japanese patients with CLDs. In our data, the lowest median score of general health (median value = 55) among the eight scales may be due to the long-standing disease burden of CLDs. Meanwhile, scores of role physical (median value = 100), social functioning (median value = 100), and role emotion (median value = 100) were well maintained.
Physical functioning at the top of the eight scales in the SF-36 is most strongly associated with physical health. Mental health at the bottom of the eight scales in the SF-36 is most strongly associated with mental health [33,34,35,36]. For the six scales between physical functioning and mental health, the higher the scale, the stronger the relationship with physical health, and the lower the scale, the stronger the relationship with mental health [33,34,35,36]. This structure helped us interpret our results. In our results, the scores of the eight scales of the SF-36, the PCS, and the MCS were all well stratified according to the frailty condition. In our multivariate analysis for frailty, physical functioning and vitality were independent predictors linked to frailty. Physical functioning, role physical, bodily pain, and general health perception are categorized as physical health, while vitality, social functioning, role emotion, and mental health are categorized as mental health [33,34,35,36]. Taken together, frailty in CLDs could be associated with both physical aspects and mental aspects. Before the current analysis, we hypothesized that frailty in CLDs as assessed by the Japanese version of the CHS criteria was linked to only physical health because five phenotypes for the assessment of frailty (unintentional BW loss, self-reported exhaustion, muscle weakness, slow WS, and low physical activity) are phenotypes mainly about physical health. The CHS criteria are a representative assessment tool for physical frailty [30,31]. For that reason, the current results were surprising to us. Role emotion was significantly stratified with a strong p-value (all, p < 0.0001) relative to the frailty status for all analyses. Role emotion indicates the effect of social activities on the psychological state [33,34,35,36]. Social frailty is clearly defined as poor participation in social networks and the awareness of lacking in contacts and surrounding support [38]. The CHS criteria may be somewhat linked to social frailty.
In our 46 frail patients, 34 patients (73.9%) had a GS decline. GS decline, rather than muscle mass decline, seems to be closely associated with poor QOL in CLDs [39]. Sarcopenia as assessed in terms of muscle mass decline and muscle strength decline or low physical activity is a key component in physical frailty, which is in line with our current data [15]. The prevalence of frailty may be difficult to report precisely because several assessment tools and cut-off values are currently available [15]. Lai et al. demonstrated that out of 983 LC patients, 151 (15%) displayed frailty and the median age of frail LC patients was 59 years [26]. In our data, 46 (13.5%) were identified as frail, and in patients less than 65 years (n = 155), 80 patients (51.6%) were prefrail and 8 patients (5.2%) were frail. We believe that frailty in CLDs should not be restricted to elderly patients and a disease-specific frailty condition should be fully assessed, even in younger CLD patients. Muscle protein synthesis may decrease in younger advanced CLD patients due to protein energy malnutrition or other metabolic disorders [15,40]. Out of our eight frail patients less than 65 years old, 7 (87.5%) had LC. In this sense, disease-specific frailty should be emphasized. In our multivariate analysis for frailty, age was also an independent factor, along with physical functioning and vitality, while the presence of LC tended to be significant. In LC patients, age did not significantly influence the frailty status (p = 0.6884). Inversely, in non-LC patients, age significantly influenced the frailty status (p < 0.0001). Considering these results, frailty in CLDs may be involved in both aging-related factors and liver-function-related factors.
Several limitations of this study need to be acknowledged. First, this study was a single-center observational study with a retrospective nature. Second, the study data was derived from Japanese CLD population data; additional exams on other ethnic backgrounds are needed to further verify and extend the application to these ethnic backgrounds. Third, GS or WS (i.e., one of phenotypes for frailty assessment) can vary depending on measurement conditions. Fourth, patients with large ascites or overt hepatic encephalopathy who are potentially frail were excluded due to unreliable self-reporting, creating bias. Our data should be therefore interpreted with caution. Nevertheless, our study results denoted that frailty in Japanese CLD patients had decreased Hr-QOL, as evaluated by the SF-36 in terms of both physical and mental components. In conclusion, Japanese CLD patients with frailty display poorer conditions, both physically and mentally. Appropriate interventions will be required for such patients.

Author Contributions

Data curation, H.N., K.Y., H.E., Y.I., Y.S. (Yoshiyuki Sakai), K.K., Y.S. (Yoshihiro Shimono), N.I., T.T., N.A., R.T., K.H., T.K., Y.Y., T.N., and S.N.; formal analysis, H.N.; supervision, S.N. and H.I.; writing—original draft, H.N. and K.Y.; writing—review and editing, H.E. All authors have read and agreed to the published version of the manuscript.

Acknowledgments

The authors gratefully thank Yasuko Higuchi in our nutritional guidance room for her significant help with data collection. This work was partly granted by the Hyogo Innovative Challenge, Hyogo College of Medicine, Japan.

Conflicts of Interest

The authors declare no conflict of interest.

Abbreviation

Hr-QOLhealth-related quality of life
CLDschronic liver diseases
SF-3636-item Short-Form Health Survey
LCliver cirrhosis
BWbody weight
GSgrip strength
WSwalking speed
CHSCardiovascular Health Study
PCSphysical component summary score
MCSmental component summary score
IQRinterquartile range
ALBIalbumin-bilirubin

References

  1. Lloyd, A.; Sawyer, W.; Hopkinson, P. Impact of long-term complications on quality of life in patients with type 2 diabetes not using insulin. Value Health 2001, 4, 392–400. [Google Scholar] [CrossRef] [PubMed] [Green Version]
  2. Zambroski, C.H.; Moser, D.K.; Bhat, G.; Ziegler, C. Impact of symptom prevalence and symptom burden on quality of life in patients with heart failure. Eur. J. Cardiovasc. Nurs. 2005, 4, 198–206. [Google Scholar] [CrossRef] [PubMed]
  3. Rebollo, P.; Ortega, F.; Baltar, J.M.; Díaz-Corte, C.; Navascués, R.A.; Naves, M.; Ureña, A.; Badía, X.; Alvarez-Ude, F.; Alvarez-Grande, J. Health-related quality of life (HRQOL) in end stage renal disease (ESRD) patients over 65 years. Geriatr. Nephrol. Urol. 1998, 8, 85–94. [Google Scholar] [CrossRef]
  4. Bottomley, A.; Pe, M.; Sloan, J.; Basch, E.; Bonnetain, F.; Calvert, M.; Campbell, A.; Cleeland, C.; Cocks, K.; Collette, L.; et al. Setting International Standards in Analyzing Patient-Reported Outcomes and Quality of Life Endpoints Data (SISAQOL) consortium. Analysing data from patient-reported outcome and quality of life endpoints for cancer clinical trials: A start in setting international standards. Lancet Oncol. 2016, 17, e510–e514. [Google Scholar] [PubMed]
  5. Gao, F.; Gao, R.; Li, G.; Shang, Z.M.; Hao, J.Y. Health-related quality of life and survival in Chinese patients with chronic liver disease. Health Qual. Life Outcomes 2013, 11, 131. [Google Scholar] [CrossRef] [Green Version]
  6. Li, L.; Yeo, W. Value of quality of life analysis in liver cancer: A clinician’s perspective. World J. Hepatol. 2017, 9, 867–883. [Google Scholar] [CrossRef] [PubMed]
  7. Spiegel, B.M.; Younossi, Z.M.; Hays, R.D.; Revicki, D.; Robbins, S.; Kanwal, F. Impact of hepatitis C on health-related quality of life: A systematic review and quantitative assessment. Hepatology 2005, 41, 790–800. [Google Scholar] [CrossRef] [PubMed]
  8. Younossi, Z.M.; Stepanova, M.; Younossi, I.; Pan, C.Q.; Janssen, H.L.A.; Papatheodoridis, G.; Nader, F. Long-term Effects of Treatment for Chronic HBV Infection on Patient-Reported Outcomes. Clin. Gastroenterol. Hepatol. 2018, 17, 1641–1642. [Google Scholar] [CrossRef] [PubMed]
  9. Schramm, C.; Wahl, I.; Weiler-Normann, C.; Voigt, K.; Wiegard, C.; Glaubke, C.; Brähler, E.; Löwe, B.; Lohse, A.W.; Rose, M. Health-related quality of life, depression, and anxiety in patients with autoimmune hepatitis. J. Hepatol. 2014, 60, 618–624. [Google Scholar] [CrossRef]
  10. Dyson, J.K.; Wilkinson, N.; Jopson, L.; Mells, G.; Bathgate, A.; Heneghan, M.A.; Neuberger, J.; Hirschfield, G.M.; Ducker, S.J.; UK-PBC Consortium; et al. The inter-relationship of symptom severity and quality of life in 2055 patients with primary biliary cholangitis. Aliment. Pharmacol. Ther. 2016, 44, 1039–1050. [Google Scholar] [CrossRef] [Green Version]
  11. Younossi, Z.M. Patient-reported Outcomes and the Economic Effects of Non-Alcoholic Fatty Liver Disease and Non-alcoholic Steatohepatitis-The Value Proposition. Hepatology 2018, 68, 2405–2412. [Google Scholar] [CrossRef] [Green Version]
  12. Tapper, E.B.; Baki, J.; Parikh, N.D.; Lok, A.S. Frailty, Psychoactive Medications, and Cognitive Dysfunction Are Associated With Poor Patient-Reported Outcomes in Cirrhosis. Hepatology 2019, 69, 1676–1685. [Google Scholar] [CrossRef] [PubMed]
  13. Kok, B.; Whitlock, R.; Ferguson, T.; Bailey, R.J.; Burak, K.W.; Kowalczewski, J.; Tangri, N.; Tandon, P. Health-Related Quality of Life: A Rapid Predictor of Hospitalization in Patients With Cirrhosis. Am. J. Gastroenterol. 2020, 115, 575–583. [Google Scholar] [CrossRef] [PubMed]
  14. Williams, F.R.; Berzigotti, A.; Lord, J.M.; Lai, J.C.; Armstrong, M.J. Impact of exercise on physical frailty in patients with chronic liver disease. Aliment. Pharmacol. Ther. 2019, 50, 988–1000. [Google Scholar] [CrossRef] [PubMed]
  15. Bunchorntavakul, C.; Reddy, K.R. Malnutrition/sarcopenia and frailty in patients with cirrhosis. Aliment. Pharmacol. Ther. 2020, 51, 64–77. [Google Scholar] [CrossRef] [PubMed] [Green Version]
  16. Aber, A.; Howard, A.; Woods, H.B.; Jones, G.; Michaels, J. Impact of Carotid Artery Stenosis on Quality of Life: A Systematic Review. Patient 2019, 12, 213–222. [Google Scholar] [CrossRef] [PubMed] [Green Version]
  17. Mikdashi, J. Measuring and monitoring health-related quality of life responsiveness in systemic lupus erythematosus patients: Current perspectives. Patient Relat. Outcome Meas. 2018, 9, 339–343. [Google Scholar] [CrossRef] [Green Version]
  18. Gerth, A.M.J.; Hatch, R.A.; Young, J.D.; Watkinson, P.J. Changes in health-related quality of life after discharge from an intensive care unit: A systematic review. Anaesthesia 2019, 74, 100–108. [Google Scholar] [CrossRef]
  19. Paracha, N.; Abdulla, A.; MacGilchrist, K.S. Systematic review of health state utility values in metastatic non-small cell lung cancer with a focus on previously treated patients. Health Qual. Life Outcomes 2018, 16, 179. [Google Scholar] [CrossRef] [Green Version]
  20. Behboodi Moghadam, Z.; Fereidooni, B.; Saffari, M.; Montazeri, A. Measures of health-related quality of life in PCOS women: A systematic review. Int. J. Womens Health 2018, 10, 397–408. [Google Scholar] [CrossRef] [Green Version]
  21. Ribeiro, A.R.; Howlett, S.E.; Fernandes, A. Frailty-A promising concept to evaluate disease vulnerability. Mech. Ageing Dev. 2020, 187, 111217. [Google Scholar] [CrossRef] [PubMed]
  22. Satake, S.; Arai, H. Implications of frailty screening in clinical practice. Curr. Opin. Clin. Nutr. Metab. Care 2017, 20, 4–10. [Google Scholar] [CrossRef]
  23. Sewo Sampaio, P.Y.; Sampaio, R.A.; Yamada, M.; Arai, H. Systematic review of the Kihon Checklist: Is it a reliable assessment of frailty? Geriatr. Gerontol. Int. 2016, 16, 893–902. [Google Scholar] [CrossRef] [PubMed]
  24. Dunn, M.A.; Rogal, S.S.; Duarte-Rojo, A.; Lai, J.C. Physical Function, Physical Activity, and Quality of Life after Liver Transplantation. Liver Transpl. 2020, 26, 702–708. [Google Scholar] [CrossRef] [PubMed]
  25. Lai, J.C.; Dodge, J.L.; Kappus, M.R.; Dunn, M.A.; Volk, M.L.; Duarte-Rojo, A.; Ganger, D.R.; Rahimi, R.S.; McCulloch, C.E.; Haugen, C.E.; et al. Changes in frailty are associated with waitlist mortality in patients with cirrhosis. J. Hepatol. 2020. [Google Scholar] [CrossRef] [PubMed]
  26. Lai, J.C.; Dodge, J.L.; McCulloch, C.E.; Covinsky, K.E.; Singer, J.P. Frailty and the Burden of Concurrent and Incident Disability in Patients with Cirrhosis: A Prospective Cohort Study. Hepatol. Commun. 2019, 4, 126–133. [Google Scholar] [CrossRef] [Green Version]
  27. Kojima, G.; Iliffe, S.; Jivraj, S.; Walters, K. Association between frailty and quality of life among community-dwelling older people: A systematic review and meta-analysis. J. Epidemiol. Community Health 2016, 70, 716–721. [Google Scholar] [CrossRef]
  28. Derck, J.E.; Thelen, A.E.; Cron, D.C.; Friedman, J.F.; Gerebics, A.D.; Englesbe, M.J.; Sonnenday, C.J. In ESLD patient referred for liver transplant, diminished QoL appears to be significantly negatively associated with frailty and not with severity of liver disease as measured MELD. Transplantation 2015, 99, 340–344. [Google Scholar] [CrossRef] [Green Version]
  29. Nixon, A.C.; Bampouras, T.M.; Pendleton, N.; Mitra, S.; Brady, M.E.; Dhaygude, A.P. Frailty is independently associated with worse health-related quality of life in chronic kidney disease: A secondary analysis of the Frailty Assessment in Chronic Kidney Disease study. Clin. Kidney J. 2019, 13, 85–94. [Google Scholar] [CrossRef]
  30. Satake, S.; Arai, H. Chapter 1 Frailty: Definition, diagnosis, epidemiology. Geriatr. Gerontol. Int. 2020, 20 (Suppl. 1), 7–13. [Google Scholar] [CrossRef]
  31. Fried, L.P.; Tangen, C.M.; Walston, J.; Newman, A.B.; Hirsch, C.; Gottdiener, J.; Seeman, T.; Tracy, R.; Kop, W.J.; Burke, G.; et al. Frailty in older adults: Evidence for a phenotype. J. Gerontol. A Biol. Sci. Med. Sci. 2001, 56, M146–M156. [Google Scholar] [CrossRef]
  32. Nishikawa, H.; Shiraki, M.; Hiramatsu, A.; Moriya, K.; Hino, K.; Nishiguchi, S. Japan Society of Hepatology guidelines for sarcopenia in liver disease (1st edition): Recommendation from the working group for creation of sarcopenia assessment criteria. Hepatol. Res. 2016, 46, 951–963. [Google Scholar] [CrossRef]
  33. Mchorney, C.A.; Ware, J.E.; Raczek, A.E. The MOS 36-item Short-Form Health Survey (SF-36): Ⅱ. Psychometric and Clinical Tests of Validity in Measuring Physical and Mental Health Constructs. Med. Care 1993, 31, 247–263. [Google Scholar] [CrossRef] [PubMed] [Green Version]
  34. Mchorney, C.A.; Ware, J.E.; Raczek, A.E. The MOS 36-item Short-Form Health Survey (SF-36): Ⅲ. Tests of Data Quality, scaling Assumptions, and Reliability across Diverse Patient Groups. Med. Care 1994, 32, 40–66. [Google Scholar] [CrossRef] [PubMed]
  35. Fukuhara, S.; Bito, S.; Green, J.; Hsiao, A.; Kurokawa, K. Translation, adaptation, and validation of the SF-36 Health Survey for use in Japan. J. Clin. Epidemiol. 1998, 51, 1037–1044. [Google Scholar] [CrossRef]
  36. Fukuhara, S.; Ware, J.E.; Kosinski, M.; Wada, S.; Gandek, B. Psychometric and clinical tests of validity of the Japanese SF-36 Health Survey. J. Clin. Epidemiol. 1998, 51, 1045–1053. [Google Scholar] [CrossRef]
  37. Johnson, P.J.; Berhane, S.; Kagebayashi, C.; Satomura, S.; Teng, M.; Reeves, H.L.; O’Beirne, J.; Fox, R.; Skowronska, A.; Palmer, D.; et al. Assessment of liver function in patients with hepatocellular carcinoma: A new evidence-based approach-the ALBI grade. J. Clin. Oncol. 2015, 33, 550–558. [Google Scholar] [CrossRef]
  38. Bunt, S.; Steverink, N.; Olthof, J.; van der Schans, C.P.; Hobbelen, J.S.M. Social frailty in older adults: A scoping review. Eur. J. Ageing 2017, 14, 323–334. [Google Scholar] [CrossRef]
  39. Nishikawa, H.; Enomoto, H.; Yoh, K.; Iwata, Y.; Sakai, Y.; Kishino, K.; Ikeda, N.; Takashima, T.; Aizawa, N.; Takata, R.; et al. Health-Related Quality of Life in Chronic Liver Diseases: A Strong Impact of Hand Grip Strength. J. Clin. Med. 2018, 7, 553. [Google Scholar] [CrossRef] [Green Version]
  40. Nishikawa, H.; Osaki, Y. Clinical significance of therapy using branched-chain amino acid granules in patients with liver cirrhosis and hepatocellular carcinoma. Hepatol. Res. 2014, 44, 149–158. [Google Scholar] [CrossRef]
Figure 1. Scores for the eight scales in the SF-36 for all cases (n = 341). PF indicates physical functioning, RP indicates role physical, BP indicates bodily pain, GH indicates general health perception, VT indicates vitality, SF indicates social functioning, RE indicates role emotion, and MH indicates mental health.
Life 10 00076 g001
Figure 2. Scores for four of the scales of the SF-36 relative to the frailty status for all cases: (A) physical functioning, (B) role physical, (C) bodily pain, and (D) general health perception.
Life 10 00076 g002
Figure 3. Scores for four of the scales of the SF-36 relative to the frailty status for all cases: (A) vitality, (B) social functioning, (C) role emotion, and (D) mental health.
Life 10 00076 g003
Figure 4. Physical component summary score (A) and mental component summary score (B) relative to the frailty status for all cases.
Life 10 00076 g004
Figure 5. Scores for the eight scales of the SF-36 relative to the frailty status for LC cases (n = 122): (A) physical functioning, (B) role physical, (C) bodily pain, (D) general health perception, (E) vitality, (F) social functioning, (G) role emotion, and (H) mental health.
Life 10 00076 g005
Figure 6. Scores for the eight scales of the SF-36 relative to the frailty status for non-LC cases (n = 219): (A) physical functioning, (B) role physical, (C) bodily pain, (D) general health perception, (E) vitality, (F) social functioning, (G) role emotion, and (H) mental health.
Life 10 00076 g006
Figure 7. Scores for the eight scales of the SF-36 relative to the frailty status for male cases (n = 164): (A) physical functioning, (B) role physical, (C) bodily pain, (D) general health perception, (E) vitality, (F) social functioning (G) role emotion, and (H) mental health.
Life 10 00076 g007
Figure 8. Scores for the eight scales of the SF-36 relative to the frailty status for female cases (n = 177): (A) physical functioning, (B) role physical, (C) bodily pain, (D) general health perception, (E) vitality, (F) social functioning, (G) role emotion, and (H) mental health.
Life 10 00076 g008
Table 1. Baseline characteristics (n = 341).
VariablesAll Cases (n = 341)
Age (years)66 (55, 72)
Gender, male/female164/177
Liver disease etiology
HCV-related/HBV-related/HBV- and HCV-related/NBNC-related
174/61/7/99
Presence of frailty, yes/no46/295
Presence of LC, yes/no122/219
Body mass index (kg/m2)22.7 (20.5, 25.65)
Walking speed (m/s)1.303 (1.1005, 1.4445)
Grip strength (kg), male33.3 (27.925, 38.925)
Grip strength (kg), female20.8 (17.6, 24.45)
Total bilirubin (mg/dL)0.8 (0.6, 1.1)
Serum albumin (g/dL)4.3 (4.0, 4.5)
ALBI score−2.9 (−3.12, −2.6)
ALBI grade, 1/2/3256/78/7
Prothrombin time (%)91.2 (80.55, 99.05)
Platelet count (×104/mm3)17.5 (12.6, 22.0)
AST (IU/L)25 (19, 34)
ALT (IU/L)19 (14, 33)
Total cholesterol (mg/dL)181 (151.25, 213)
HbA1c (NGSP)5.7 (5.4, 6.1)
Scales of SF-36
Physical functioning90 (80, 95)
Role physical100 (75, 100)
Bodily pain74 (52, 100)
General health perception55 (45, 71)
Vitality68.8 (56.2, 81.3)
Social functioning100 (75, 100)
Role emotion100 (75, 100)
Mental health80 (65, 90)
Physical component summary score51.1 (41.2, 54.3)
Mental component summary score53.6 (46.0, 59.2)
Data are expressed as the number or median value (interquartile range). HCV: hepatitis C virus, HBV: hepatitis B virus, NBNC: non-B and non-C, LC: liver cirrhosis, ALBI: albumin-bilirubin, AST: aspartate aminotransferase, ALT: alanine aminotransferase, NGSP: National Glycohemoglobin Standardization Program, SF-36: 36-item Short-Form Health Survey.
Table 2. Univariate and multivariate analyses of factors linked to frailty.
VariablesUnivariate
Analysis p-Value
Multivariate Analysis
EstimatesSEp-Value
Age (years)0.0002−0.04990.020 0.0126
Gender0.5292
Presence of LC<0.0001−0.4840.265 0.0685
Body mass index0.3701
Total bilirubin0.9042
Serum albumin<0.00010.2590.413 0.5308
Prothrombin time0.2037
Platelet count 0.0543
AST 0.0992
ALT 0.6717
Total cholesterol 0.0815
HbA1c (NGSP)0.1741
Physical functioning<0.00010.04340.0125 0.0005
Role physical<0.00010.007690.0102 0.4531
Bodily pain<0.0001−0.0008040.0095 0.9327
General health perception<0.00010.003570.0139 0.7976
Vitality<0.00010.03490.0155 0.0246
Social functioning<0.0001−0.01690.0117 0.1481
Role emotion<0.00010.01580.0106 0.1384
Mental health<0.0001−0.003940.0146 0.7877
SE: standard error, LC: liver cirrhosis, AST: aspartate aminotransferase, ALT: alanine aminotransferase, NGSP: National Glycohemoglobin Standardization Program.

