Article

Development of Infrared-Guided Missile Precision Detection Simulator

1
College of Mechanical and Electrical Engineering, Harbin Engineering University, Harbin 150001, China
2
School of Mechanical Engineering, Hebei University of Technology, Tianjin 300130, China
*
Author to whom correspondence should be addressed.
Machines 2021, 9(9), 198; https://doi.org/10.3390/machines9090198
Submission received: 13 July 2021 / Revised: 27 August 2021 / Accepted: 3 September 2021 / Published: 14 September 2021
(This article belongs to the Section Machine Design and Theory)

Abstract

:
In order to carry out various detections of system indicators during the research and development phase of infrared guided missiles, the article first analyzes several main design schemes of the infrared guided missile detection simulator and finds that it has the disadvantages of difficult processing technology and low detection accuracy. The overall structure of the detection device was designed, including the design of the rotation and swing mechanism, lens mechanism, optical system and control system. The optical system error analysis is performed on the infrared guided missile detection simulator. The position of the receiving light source is obtained by analyzing the mechanism characteristics of the detection simulator and the kinematics model of the device. The phase difference analysis of the eccentricity and tilt system is obtained. The image quality was evaluated by the optical transfer function (MTF), and the system error was found to meet the requirements of imaging quality. The experiments show that the simulation of 1.7~4.9 um medium wave infrared dynamic target signals provides an accurate and reasonable experimental environment for the missile and the verification of the light source target and meets the experimental requirements.

1. Introduction

In today’s era, infrared guided missile systems have been sought after by various countries due to their high resolution, strong anti-interference, simple equipment, light weight, low cost, and good concealment, and have developed rapidly [1,2]. The system’s various indicators are tested during the research and development phase of infrared missiles. The use of real targets in real environments for missile detection is not only expensive, but also limited by actual conditions. Under different weather conditions and environments, the target’s detection of infrared missiles will produce impact, and it is impossible to test all cases separately. Therefore, the infrared semi-physical simulation device has become an indispensable link in the development and detection of infrared guided missiles, and has been highly valued by countries around the world [3].
The infrared guided missile detection simulator mainly has the following design schemes: large screen projection, five-axis rotary table, optical mechanical and zoom projection [4,5,6,7]. The large-screen projection-type infrared simulation system [8], an infrared guided semi-physical simulation detection device built by the American Boeing Aerospace Corporation in the 1970s, consists of four parts: an infrared target generation system, a large reflective screen, a three-axis turntable, and a control computer. The disadvantage of this solution is that it needs to process precise large ellipsoidal mirrors. The machining accuracy and finish are the guarantee of simulation accuracy, which is difficult to achieve in technology; it cannot provide characteristics such as infrared interference and multi-targets; there is not much room for expansion. British Aerospace’s Stevenage division began to develop infrared target detection simulators in the early 1970s to meet the needs of developing infrared weapons [9]. It uses a five-axis turntable to implement the entire simulation system. The target generation system is fixed on two outer frame axes. The movement of the two outer frame axes provides two azimuth movements of the target. The distance simulation of the point target is realized by the change of the aperture of the scene stop of the optical projector in the target generation system. The advantage of this solution is that the structure is compact, the coordinates of the rotating shaft are unified, and the accuracy is determined only by the inertia and angular acceleration of the outer frame of the turntable, so the position accuracy is high; The disadvantage of this solution is that the machining process of the five-axis turntable is more difficult and the cost is high; because the composite target projection system is installed on the outer frame, the moment of inertia is increased, which limits the dynamic performance of the equipment servo system, and cannot achieve the complex target. Simulation is very limited and difficult to expand; it is difficult to obtain high accuracy. The U.S. Army Advanced Simulation Center (ASC)’s infrared simulation system is a pioneer in the use of opto-mechanical solutions [10,11,12,13]. This solution was designed by General Electric in the early 1970s. This solution has the following advantages: the complex projection technology is used to solve the complex target background simulation problem of the terminal guidance segment. The shortcomings of this solution are: there are many key technologies in the system, such as light sources and micro-pit mirrors in optical systems; dense bead bearings, field stops, and display arms in mechanical systems; automatic control systems and fast solving devices in computer systems Wait. Hughes further modified and improved the simulation simulator in the process of serializing the opto-mechanical solution [14,15,16,17,18]. The most significant one is the use of a zoom projection system as the target projector. In this way, the direct simulation between the target and the missile is used. The distance effect instead of the opening angle of the simulated target to the missile increases the fidelity of the simulation. Although the zoom range is limited, the simulation range is limited, and high requirements are made in terms of technology and cost, it is still an ideal solution.
By comparing the advantages and disadvantages of the above design schemes, this paper proposes a new type of infrared target simulator [19,20]. Through the cooperation of the main body, lens, shaking table and computer, the target of waveband, different size and different distance can be simulated, which can dynamically control the position and radiation degree of the target in the field of view of the seeker, so as to ensure that the missile can accurately identify and hit the target in the complex and severe combat. Secondly, the simulator has the characteristics of long entry pupil distance, accurate target positioning, rotating and swinging around the central axis, remote control and test circulation.

2. Device Design Based on Infrared Guided Missile Detection

The design of the infrared guided missile detection device is divided into five parts: overall structure design, rotation and swing mechanism design, lens structure design, optical system and control system design.

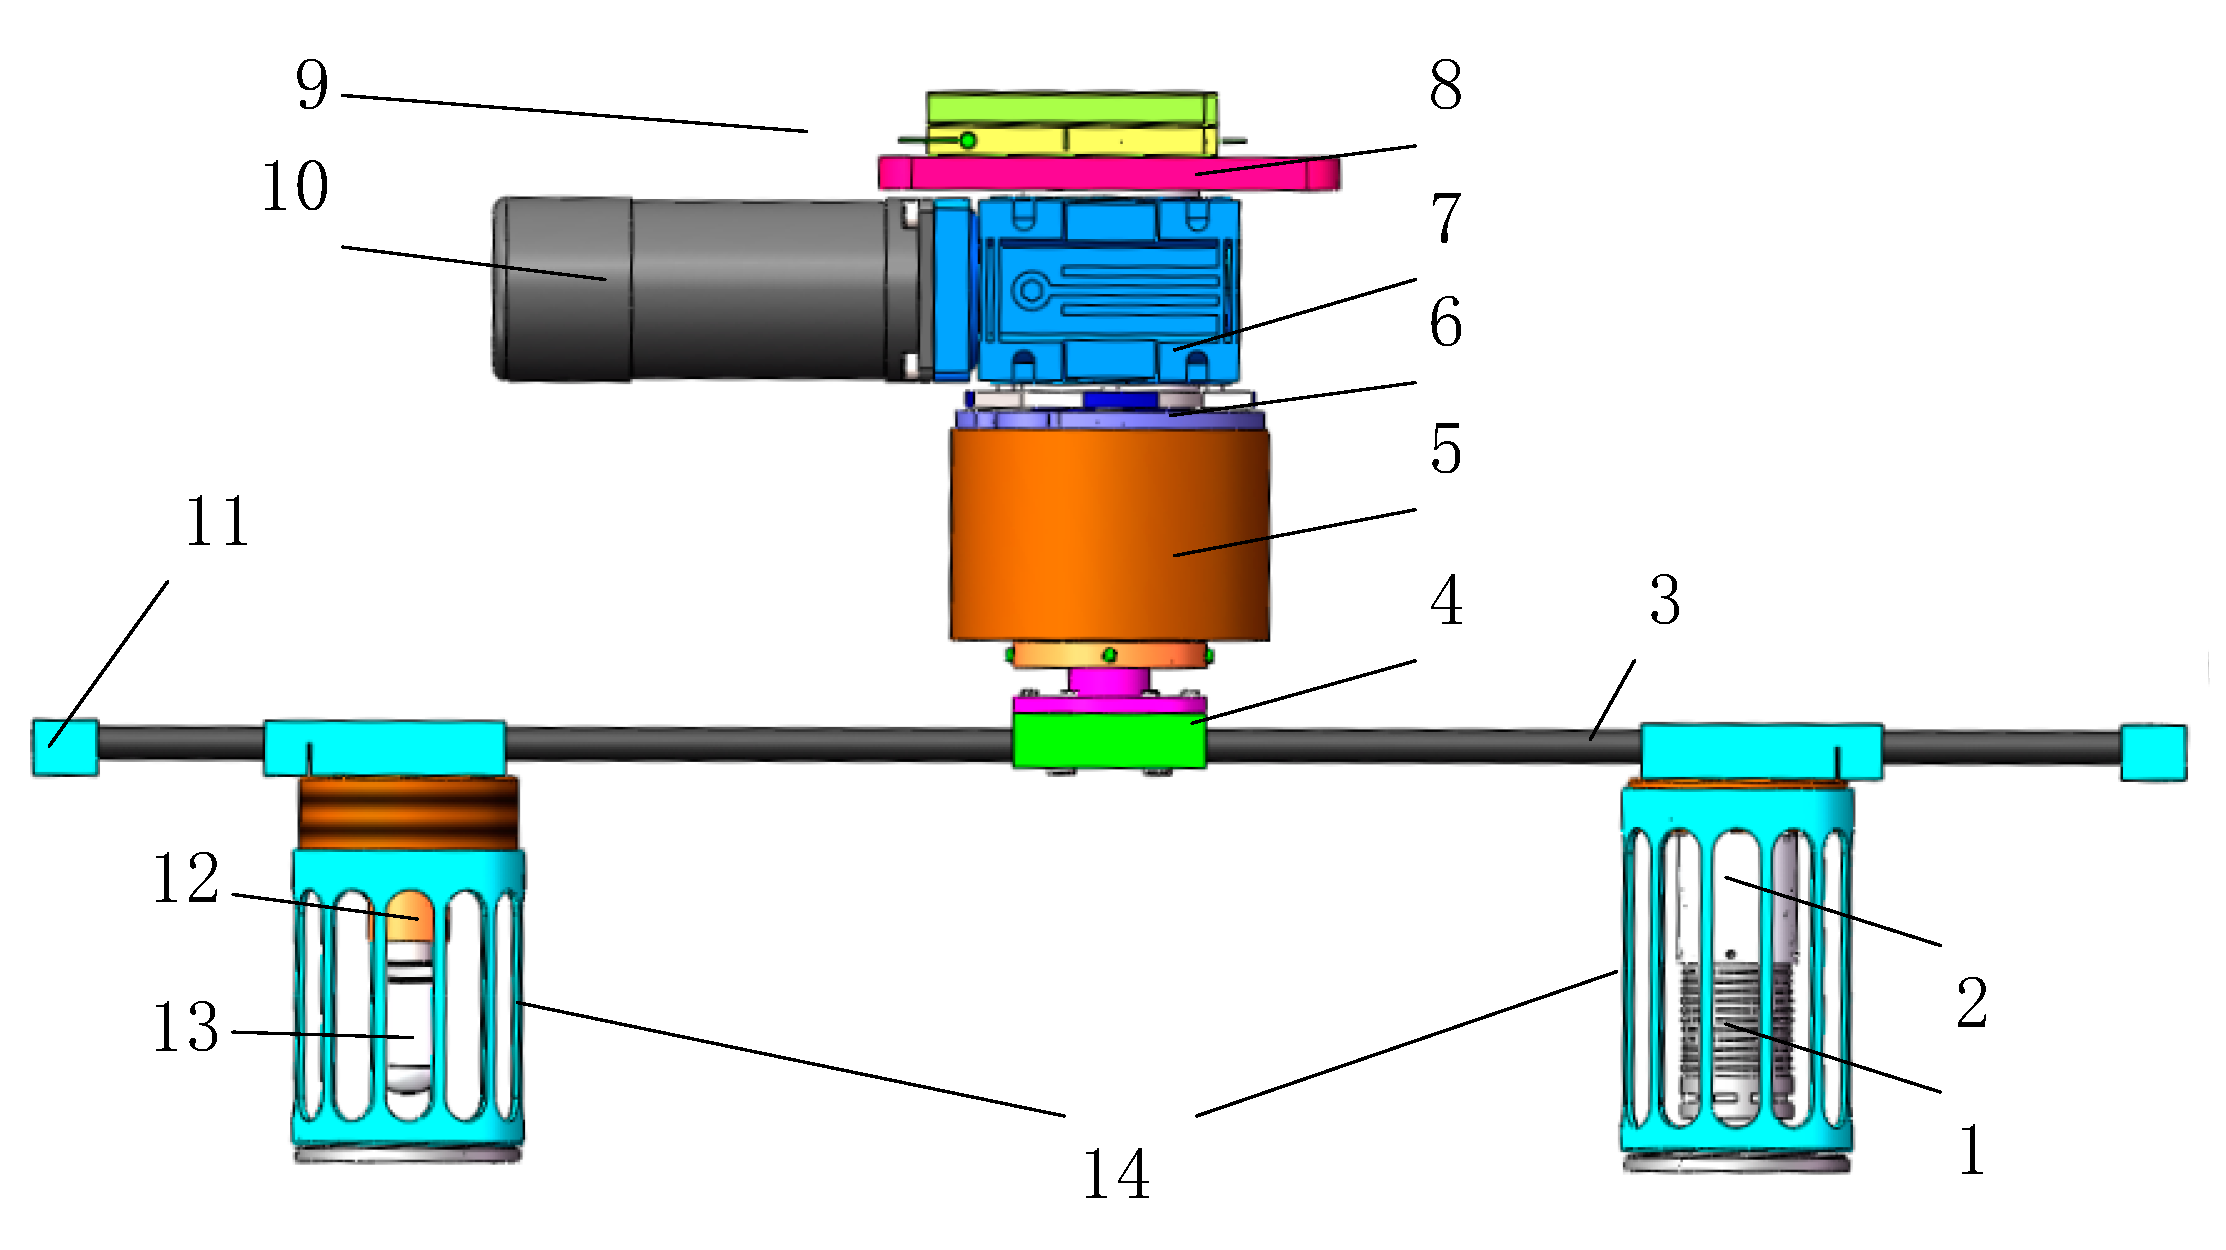
2.1. Overall Structural Design of the Detection Device

The function of the detection device depends on the overall structure. The fixing method is that the column base plate is fixed to the flange base through corner codes, and the flange base is fixed to the ground by anchor bolts, as shown in Figure 1.

2.2. Design of Rotating Device of Detection Device

In this design, the rotary swing mechanism needs to be able to adapt to a variety of speeds and different positions, so the rotary swing mechanism is required to have a position to adjust the distance, as shown in Figure 2.
The rotating and swinging mechanism is mainly composed of a blackbody, a blackbody seat, a carbon fiber tube, a rotating shaft, a rotating slip ring, a reducer fixing plate, a reducer, a base plate, a slider, a motor, a stop block, a lamp holder, a tungsten light bulb, and a light bar. A self-locking slider and a guide rail are installed on the base plate, so that the rotary swing mechanism can move left and right along the guide rail and fix the position, so that the center of the simulator is aligned with the center of the vibration table. The DC servo motor and the reducer are fixed on the lower side of the base plate, and the rotary shaft is fixed on the lower side of the reducer. The carbon fiber tube is rotated by the flange, and the inner ring of the rotary slip ring rotates together with the rotary shaft. Because the blackbody and tungsten filament lamp need to be fixed during the test, in order to reduce the weight of the simulator and reduce the moment of inertia, the linear movement of the blackbody and tungsten filament lamp uses the linear sliding movement of the aluminum block on the carbon fiber tube, and the aluminum pieces that have been ruled by the ruler are fixed on the limit blocks at both ends to facilitate the adjustment of the distance between the blackbody and the tungsten filament lamp.

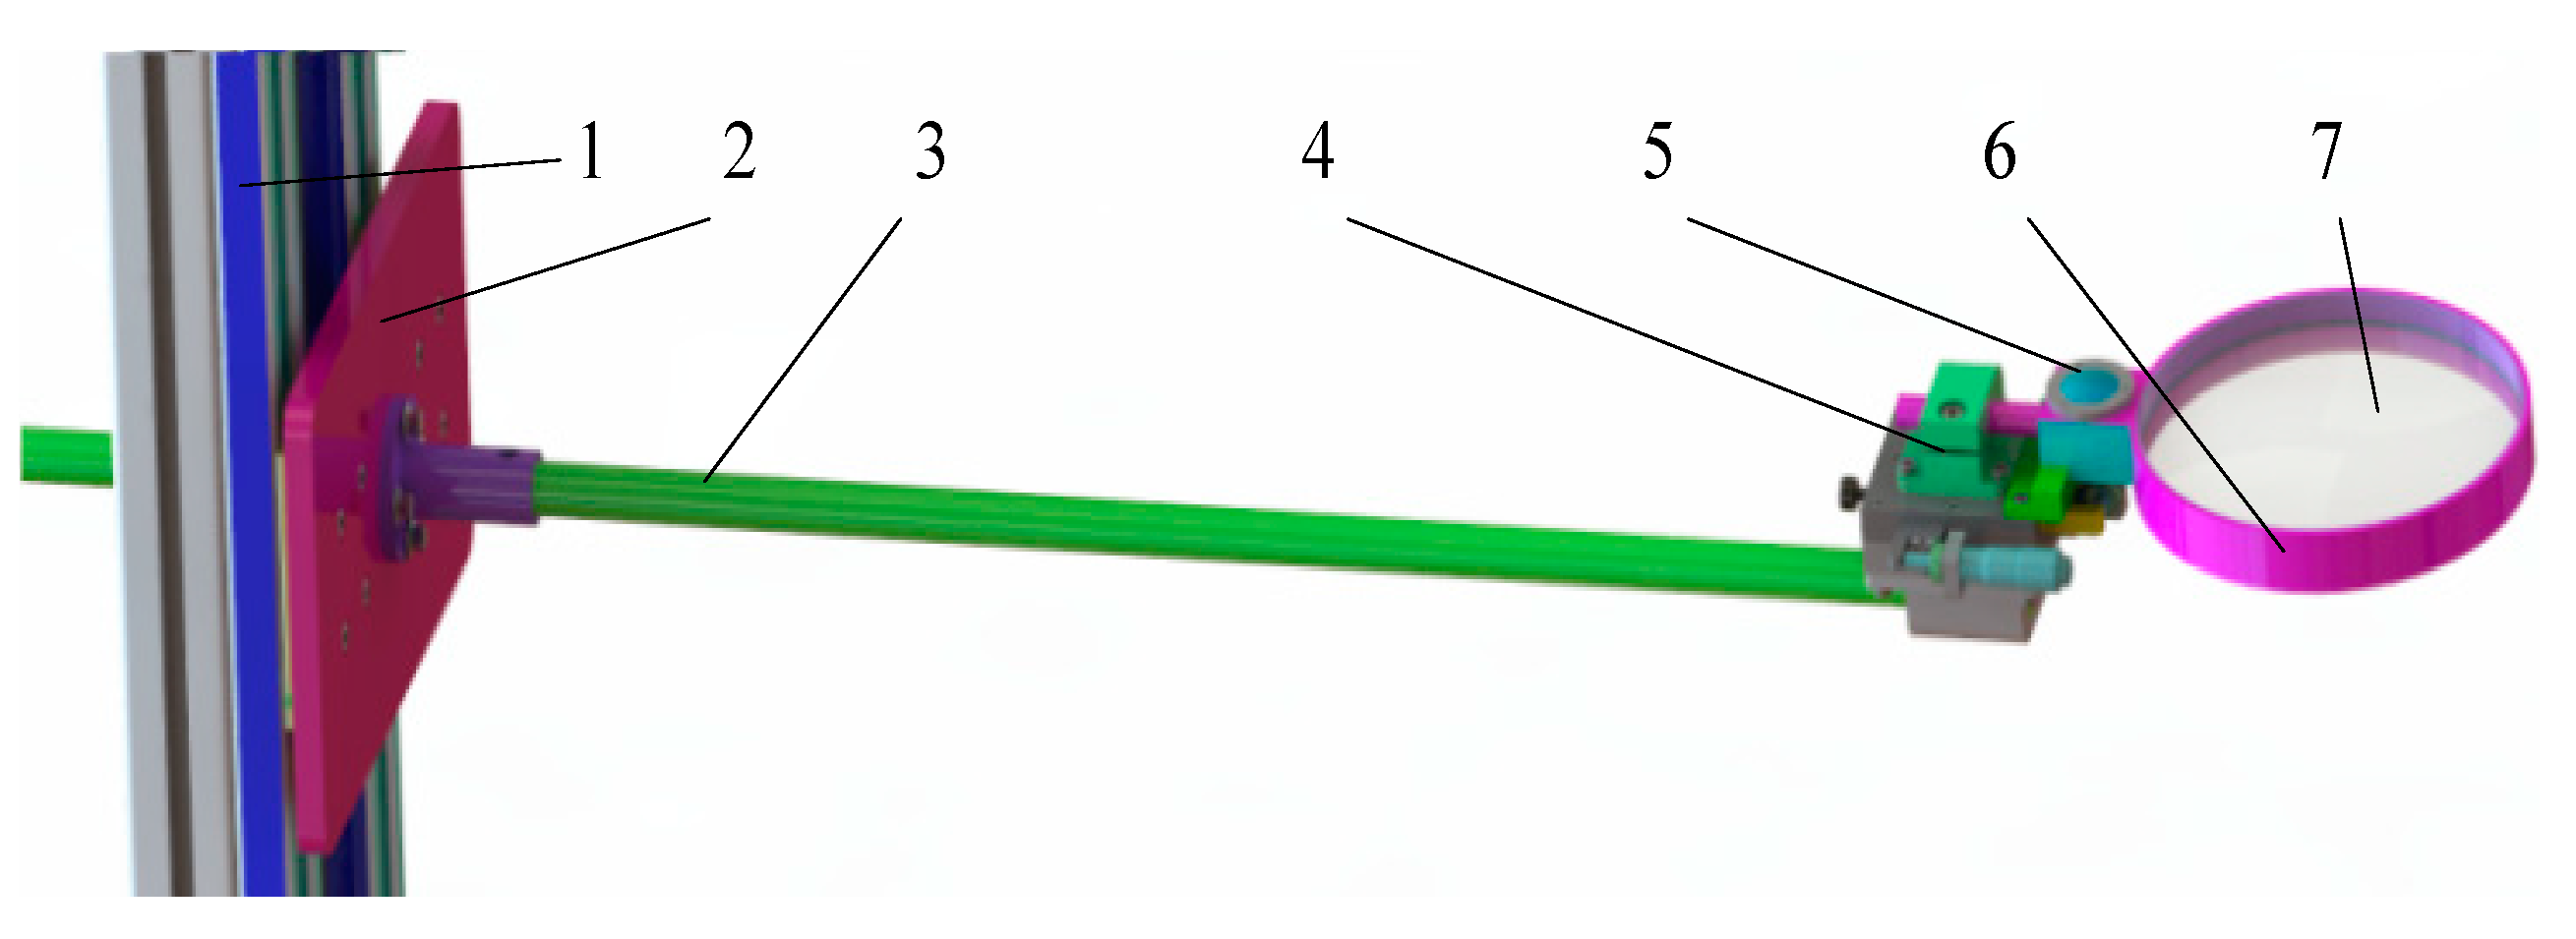
2.3. Design of Lens Mechanism of Detection Device

The lens acts as a part of the projection optical system, so that the light can refract parallel light to transmit radiant energy to the seeker. The design of the lens part mainly includes the design of the lens clamping mechanism, the design of the support method, and the design of the fine adjustment mechanism. When designing the lens, this article uses the same method to fix it on the substrate with the slider of the self-locking guide rail, adjust the vertical movement of the lens by manual slider, use the fine-tuning self-locking device to fix the position, and fine-tune the slide table. The level is used to observe the level of the lens and adjust it. The lens mechanism is shown in Figure 3.

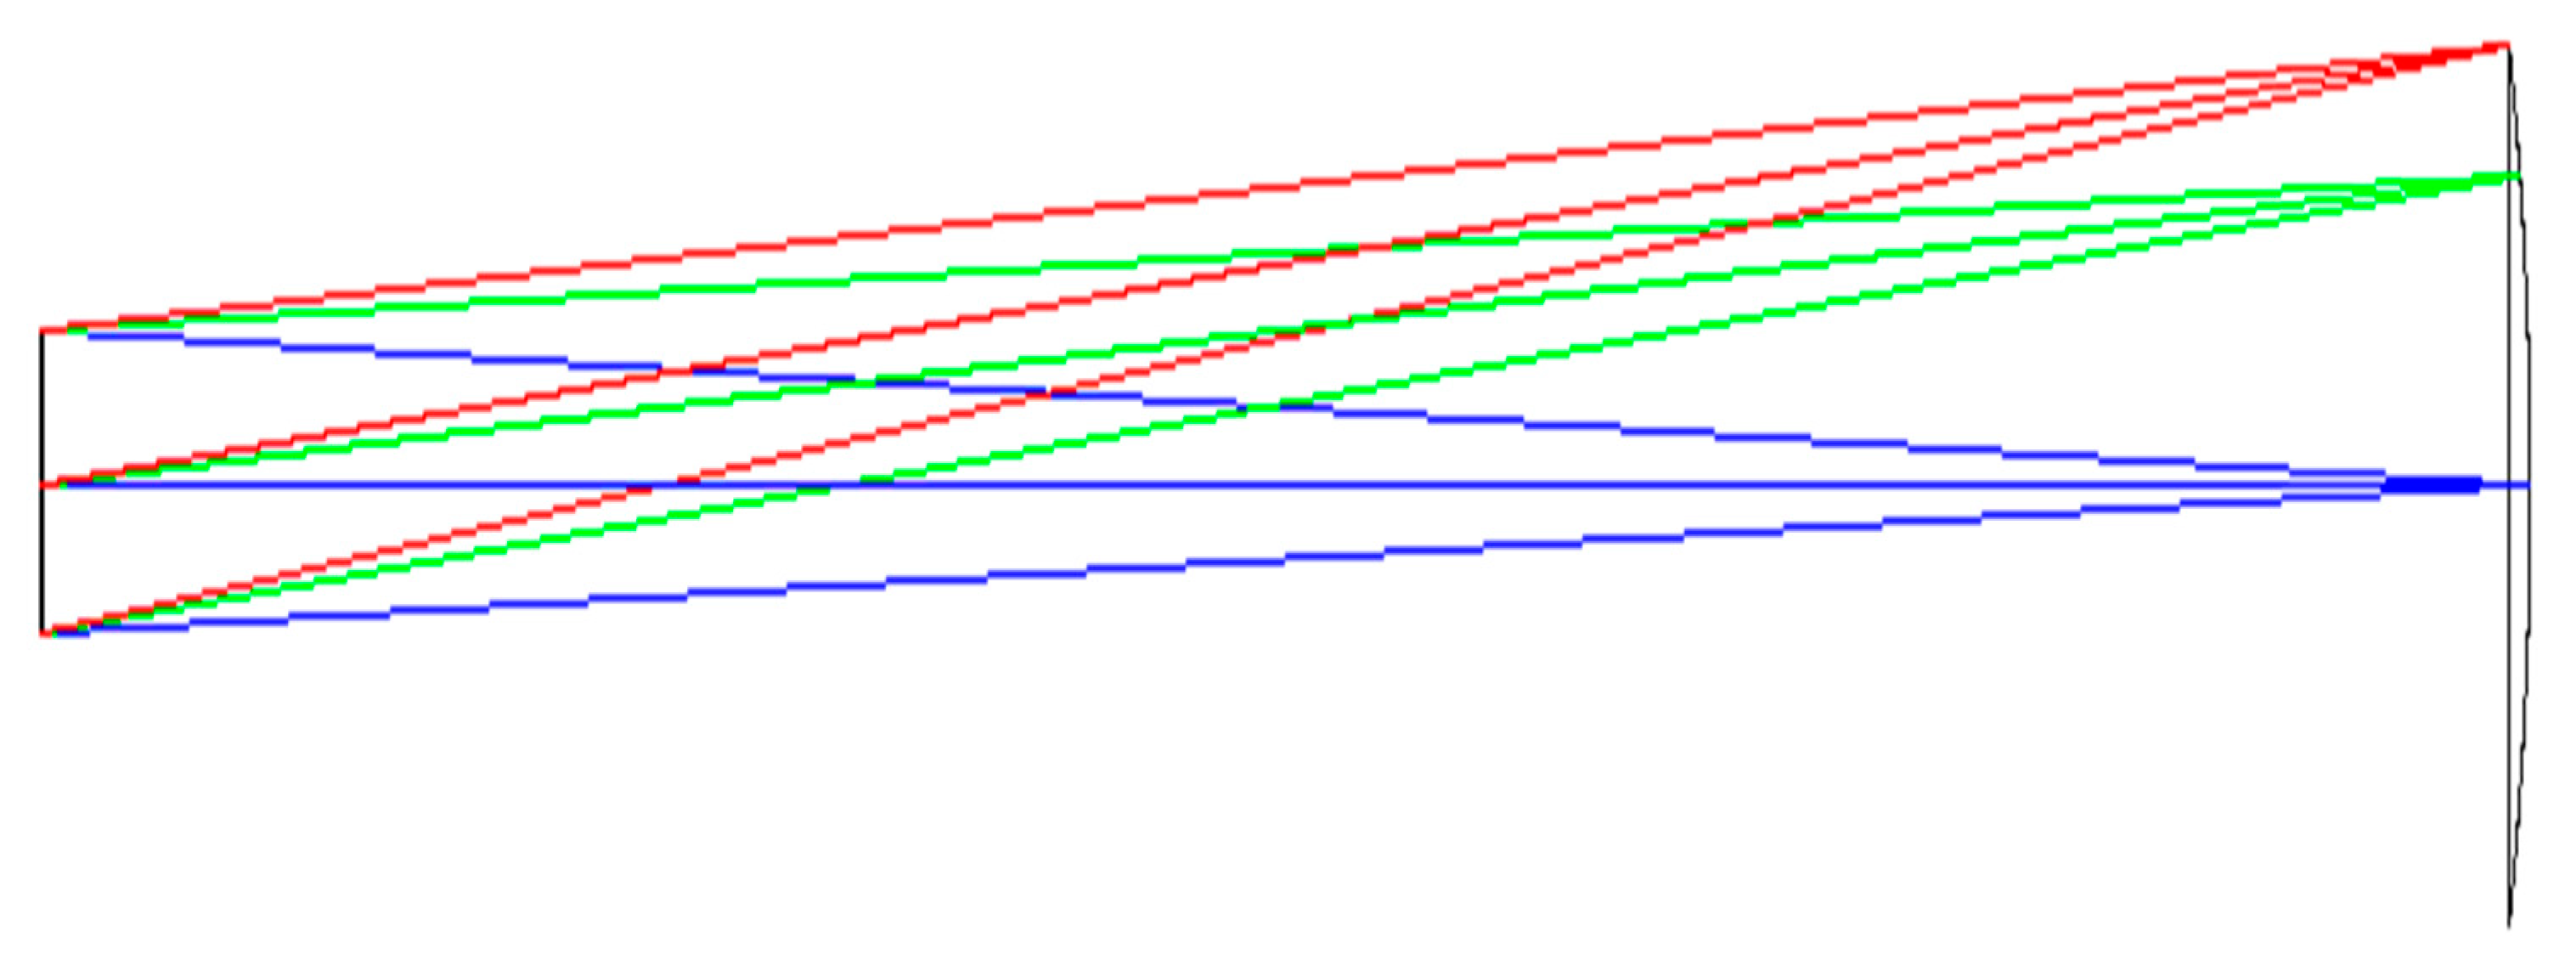
2.4. Design of Optical System of Detection Device

2.4.1. Scheme Design of Rotating Radiation Source

The radiator in the optical system is an important part of the infrared target simulator. The radiated energy simulates the target in the real environment for the seeker to receive. Because the blackbody is only related to temperature, no reflection and refraction will occur. Different temperatures can be adjusted to obtain different wavelengths, so the blackbody is selected as the radiation source in this paper. Blackbody as a radiation source improves test accuracy [21]. The blackbody temperature range studied in this paper is 373~673 K, which belongs to the mid-far infrared band. Therefore, a medium-temperature blackbody is selected. The blackbody radiation source must be matched with an infrared bandpass filter to make the wavelength of light reach the technical requirements of 1.7~4.9 µm.
Because the radiation source needs to make a rotational movement to simulate the change of the target position, it needs to achieve rotational balance during the movement. Mount the other end of the device with an incandescent lamp, which has three applications:
(1)
It can balance the blackbody and reach a balanced state;
(2)
It can be used as an interference source to test the ability of the seeker to hit the target under the influence of low temperature interference;
(3)
It can be used as a radiation source at low temperatures to test other types of missiles.

2.4.2. Scheme Design of Light Path

In order to improve the resolution in this design, a spatial optical system with a large field of view and a long focal length was selected [22,23]. In order to meet the uniformity of the optical axis, a single lens system with an easy-to-adjust structure was selected. In the design of imaging optical system, it mainly refers to the design of the lens system. The single lens system is mainly composed of four surfaces: object surface, image surface, lens front surface, lens rear surface. According to technical requirements, the wavelength should be λ = 1.7 4.9   μ m , the distance between the blackbody and the central axis should be y = 190 mm , entrance pupil diameter should be l 1 = 2500 mm and exit pupil diameter should be l 2 = 200 mm . Through F = f / D , the value of F is 19.23, and according to tan ω = y / l 1 ,the field angle is 2 ω = 8.692 °. The meaning of the index number is set in ZEMAX. After multiple optimizations, the optical system structure diagram and the optical fan diagrams with relative heights of 0, 0.707, and 0.1 are obtained, as shown in Figure 4 and Figure 5.
The above initial system is obtained. Although the shape of the lens cannot be seen in Figure 4, the current focusing system can be seen. The blue to pink curves in Figure 5 represent the curves with wavelengths of 1.7, 2.5, 3.3, 4.1, and 4.9 um in order. All of them pass the origin point to indicate that the system is not out of focus and the image quality is good.

2.5. Design of Control System for Detection Device

In this paper, the infrared rotating target simulator needs to select a suitable control system to control the rotation, swing, rotation speed, direction and temperature of the mechanism. Finally, the motion of the rotary swing mechanism is controlled by the PLC system. Compared with a control system of the same size, the electrical wiring switch node can be greatly reduced, and the failure is reduced accordingly. The advantages of this control method are strong anti-interference ability and strong driving ability [24,25].
The temperature of the blackbody and the brightness of the tungsten filament lamp are controlled by the blackbody temperature control box. The work of the temperature control box and the PLC control system are independent of each other. The reason for this deployment is to prevent one system from affecting the other system when it fails. During installation, the temperature control box, text display and PLC components are installed in the designed main control box for easy control. The rotation speed and the temperature of the blackbody can be displayed on the console panel digitally. The required angular velocity accuracy can reach the required accuracy of 1 °/s. The control system network architecture is shown in Figure 6.

2.6. Working Principle of Target Simulator

The rotating target simulator system is mainly composed of a mechanical system, a control system and an optical system. The following is a detailed introduction of how the simulator works. Firstly, the seeker of the missile is fixed on the shaking table through the gyro rotator, and the level on the lens clamping mechanism is used to adjust the lens parallel to the ground, so that the distance between the lens and the seeker is 0.2 m. Then, move the blackbody center, lens center and seeker center to the optical axis to test the blackbody radiation and seeker performance. After the test is completed, the center of the bracket rotation, the center of the lens and the center of the seeker are moved to the center axis of the entire optical system to accurately test the overall performance of the structure without center deviation or significant jitter. Secondly, the target’s circular variable light bar is placed on the preset focal surface of the projection optical system, and the target is manually adjusted to the specified position. At the same time, adjust the tungsten filament lamp to the corresponding position in the opposite direction, carry out counterweight, and tighten the screws on the aluminum base for fixing. By adjusting the light bars, the circular target with changing size and position is projected to infinity to simulate the target in real environment for the seeker to receive. Operate a temperature controller to control the temperature of the source (the blackbody) so that the blackbody emits infrared radiation of a certain energy. Through the PLC control system to adjust the radiation source around the central axis of the angular velocity of continuous rotation or to achieve the angle of 45°, 90°, 180° swing function. Finally, the vibration table is adjusted to different frequencies to simulate the vibration influence of the missile in the real environment. Under the influence of different vibration frequencies, whether the seeker can receive the target is tested, and the performance index of the seeker is displayed through the computer.
Because the target will be far away from the missile for a long time, the missile can treat the target as a pixel size point target during guidance. Adjust the target to the corresponding position, change the blackbody temperature or change the field of view light bar to simulate the target near and far change. When the target changes from the surface array distribution to an image element size, the blackbody temperature or the optical bar hole are turned down to reduce the radiation emittance and simulate the process of the target becoming far away. The schematic diagram of its optical system is shown in Figure 7.

3. Eccentricity and Error Analysis of Infrared Guided Missile Detection Device

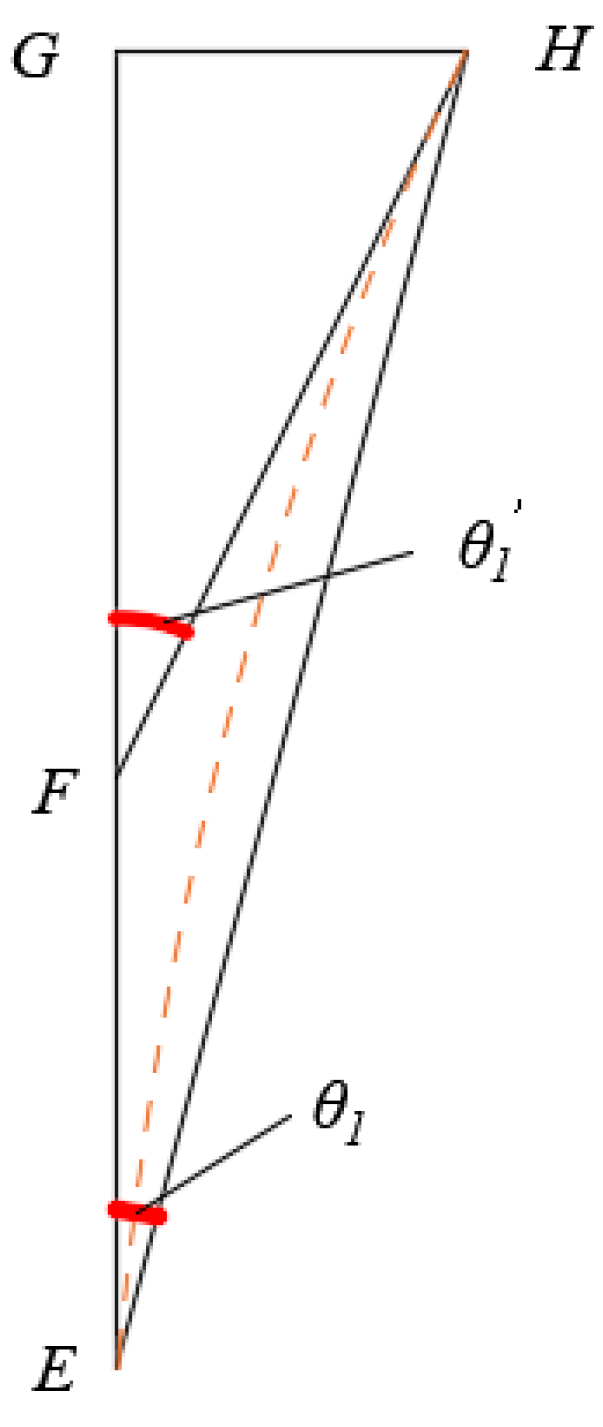
3.1. Analysis of Eccentricity of Detection Device Cantilever

When the cantilever beam is moving, the angular deviation will cause the aberration changes between the ideal direction and actual direction. This section will analyze the factors affecting the aberrations. The cantilever beam is the main component that needs to support the rotating swing mechanism. Bending and resonance are the basic working conditions of the cantilever beam. In these two states, it is necessary to effectively ensure the strength and stiffness of the movement mechanism. If the strength is not satisfied, it will easily cause fracture, and the stiffness will be greatly deformed. The rotating and swinging mechanism is installed as a slewing part on the front end of the cantilever beam, and will be subject to periodic forces. Resonance will not resonate with the rotating mechanism. Therefore, in this section, the static analysis of the rotating and oscillating mechanism is simplified, and the changes of stress and displacement in the bending state are analyzed.
The bending state means that the cantilever beam is subjected to external load, and its shape and surface stress also change with the action of force. The left side of the supporting cantilever beam is fixed and simplified into a left articulated rod structure. The longitudinal concentrated load (F = 100 N) acts on the right end. The length of the beam is 1700 mm and the cross-sectional area of each beam is S = 1600 mm2.
Next, we perform a finite element analysis on the cantilever beam, analyze the effects of its two variables, displacement and stress, on the device, and analyze the deflection and rotation angle. Because the structure of the entire rotating target simulator device is too large and complicated, problems will occur when the finite element mesh is divided. To this end, this paper simplifies the external forces on the cantilever beam. The established 3D model is imported into Ansys Workbench by software, and the material is defined, and constraints and loads are added.
In this section, a concentrated load is applied to the right end of the beam, and the calculated stress and deformation cloud diagram results are shown in Figure 8 and Figure 9. It can be concluded that the cantilever beam undergoes slow deformation after loading, and the position of bending deformation changes with time. Initially, the concentrated position of the load undergoes a downward bending change. Later, the deformation is transmitted from the right end to the left end. The maximum deformation occurs at the inclined support of the cantilever beam and the bracket, and the deformation is about 4 mm.
Closely related to beam bending is beam stress. It can be seen from the Figure 10 and Figure 11 that the maximum stress of the beam is 34.28 MPa, which is far less than the tensile limit value of the material used. At the same time, the simulation results show the necessity of the diagonal arm support. The deflection curve equation and angle of rotation equation of the beam will be derived to determine its maximum deflection as a ω max and angle as θ max .
The angle of rotation equation obtained by ignoring the shear stress:
E I z w = M ( x ) d x + C 1
Bending deflection equation:
E I z w = M ( x ) d x d y + C 1 x + C 2
Substituting the boundary conditions x = 0 , ω = 0 and x = 0 , ω = 0 into the corner equation and torsion curve are obtained:
{ E I w = F l x + F x 2 2 E I w = F l x 2 2 + F x 3 6
Both the maximum corner value and the deflection value occur at the free-end cross section, so that:
{ θ max = θ | x = l = F l 2 E I + F L 2 2 E I = F l 2 2 E I w max = w | x = l = F l 3 3 E I
It is obtained that θ max = 0.00369 r a d , w max = 4.1823 mm . The rotation angle is 0.211°.

3.2. Modeling and Solving of Translation Distance and Tilt Angle

During the adjustment, the consistency deviation between the actual central axis’s direction, displacement, and ideal state will not only destroy the axis consistency of the optical imaging system, but also affect the benchmark of rotational symmetry. Eccentricity will cause the translation of the optical axis, and tilting will cause the optical axis to rotate. The following will analyze the end position of the lens receiving light, and analyze its translation distance and tilt angle through coordinate transformation.

3.2.1. Calculation of Translational Distance and Tilt Angle

In the previous section, we analyzed the cantilever beam and found the values of its rotation angle θ max and the maximum deflection ω max . In order to obtain the translational distance and tilt angle, we need to calculate the angle and displacement of each important force-bearing part of the mechanism. A schematic diagram of the position of the end of the beam of the boom is shown in Figure 12.
The magnitude of θ 2 and the value of AC are obtained from the illustrated geometric relationship.
From the geometric relationship, we can get the following relationship. Substituting the known values of the angles θ 2 = 0 . 2114 and CD  w max = 4.1823 mm into Equation (5):
{ B D = C D sin θ 2 B C = C D tan θ 2 tan θ 2 = C D A C
Then, BD = 1133.42 mm, BC = 1133.41 mm, the total length of the known beam is 1700 mm, and AB = 566.58 mm, AC = 1699.99 mm, and θ 2 = 0.141 are obtained to determine the position coordinate system at this time.
Through the analysis of statics, we calculated the force where the beam is in contact with the supporting beam, the deformation is GH = 0.44 mm, and the height of the supporting beam is 4500 mm. The schematic diagram of the position where the end of the beam contacts the supporting beam is shown in Figure 13. According to the deflection formula, the value of θ 1 is 0.008406°, and the values of EG and θ 1 can be calculated in the same way. Because the angle of rotation is too small, the calculated values of GF and HF are nearly equal, so let G F = H F 3000 m m , θ 1 = 0 . 00406 .
When the rotating shaft is fixed, the bearing will have a certain clearance, which will cause the axis offset error of the rotating shaft. In order to reduce the clearance, a needle roller bearing with small volume and bearing only radial force is selected in this paper. Given that the length of the output rotary shaft is 85 mm and the clearance of the needle bearing with an internal bore of 20 mm is 0.06 mm, the actual axis offset angle is calculated to be 0.02°. Refer to the design manual to know the allowable axis offset of the needle bearing The quantity is 2 , which meets the conditions of use of needle bearings, and can determine the position of the rotary shaft when there is an error.

3.2.2. Kinematics Modeling of Translation and Tilt

The infrared guided missile detection device is fixed to the ground by ground feet. The simplified schematic diagram of the simulator mechanism is shown in Figure 14.
In actual installation and adjustment, the infrared guided missile detection device is affected by many factors. The main influencing factors are the axis system error of the supporting beam, the axis system error of the cross-arm beam, the axis system error of the rotating shaft, and the installation height error. According to the theory of the multibody system, the coordinate transformation matrix can describe the motion relationship between the mechanisms. Therefore, it is scientific and reasonable to use mechanism kinematics to study the error when the mechanism is biased. In this way, in an ideal state, the coordinate transformation matrix between adjacent bodies of the infrared guided missile detection device can be decomposed into two coordinate transformation matrices, and then solved in a kinematic manner.
Kinematic parameters are shown in Table 1. The Denavit-Hartemberg (D-H) method is used to establish the coordinate system of the rotating target simulator. As shown in Figure 15 below, the coordinate transformation in the figure includes translation coordinate transformation and rotation coordinate transformation of the simulator mechanism.
The coordinate system x 0 y 0 z 0 is the base coordinate system of the simulator itself, x 1 y 1 z 1 , x 2 y 2 z 2 , and x 3 y 3 z 3 are the coordinate systems of the support beam, the transverse beam, and the rotation axis, and ο 1 , ο 2 , and ο 3 are their corresponding origins. Because the machine is prone to errors during installation, the distance between the center of the rotation axis where the blackbody is located and the lens is regarded as a height error. From the perspective of kinematics, this error is described by translation coordinate transformation, and x 4 y 4 z 4 with ο 4 as the origin is the coordinate system of the installation height error.
The D-H change matrices of the adjacent coordinate systems i and i − 1 can be obtained by the following formula.
T i i 1 = [ cos ( θ i ) sin ( θ i ) 0 a i 1 sin ( θ i ) cos ( α i 1 ) cos ( θ i ) cos ( α i 1 ) sin ( α i 1 ) d i sin ( α i 1 ) sin ( θ i ) sin ( α i 1 ) cos ( θ i ) sin ( α i 1 ) cos ( α i 1 ) d i cos ( α i 1 ) 0 0 0 1 ]
Then the positive kinematics of the transformation matrix of the simulator mechanism can be obtained by Equation (7).
T 1 0 = T 1 0 T 2 1 T i i 1
According to the coordinate system and kinematic parameters of the simulator mechanism, the homogeneous transformation matrix between two adjacent coordinate systems can be obtained, respectively, so that the kinematic model can be established.
The homogeneous transformation matrix of the simulator mechanism’s own base coordinate system x 0 y 0 z 0 and the support beam coordinate system x 1 y 1 z 1 is shown in the following Formula (8).
T 1 0 = [ cos ( θ 1 + π / 2 ) sin ( θ 1 + π / 2 ) 0 0 sin ( θ 1 + π / 2 ) cos ( θ 1 + π / 2 ) 0 0 0 0 1 0 0 0 0 1 ]
The homogeneous transformation matrix of the coordinate system of the supporting beam to the coordinate system of the beam is shown in the following Formula (9).
T 2 1 = [ cos ( θ 2 π / 2 ) sin ( θ 2 π / 2 ) 0 a 1 sin ( θ 2 π / 2 ) cos ( θ 2 π / 2 ) 0 0 0 0 1 0 0 0 0 1 ]
The homogeneous transformation matrix of the rotation axis coordinate system to the installation height error coordinate system is shown in the following Formula (10).
T 4 3 = [ 1 0 0 0 0 cos ( α 4 ) sin ( α 4 ) ( d 4 + l 3 + l 4 ) sin ( α 4 ) 0 sin ( α 4 ) cos ( α 4 ) ( d 4 + l 3 + l 4 ) cos ( α 4 ) 0 0 0 1 ]
In summary, from Equation (8), we can know the positive kinematics solution of the coordinate system of the light incident point of the lens relative to the standard system of its base:
T 4 0 = T 1 0 T 2 1 T 3 2 T 4 3 = [ n x o x a x p x n y o y a y p y n z o z a z p z 0 0 0 1 ]
In the formula:
p x = a 2 ( cos ( π / 2 + θ 1 ) cos ( θ 2 - π / 2 ) - sin ( π / 2 + θ 1 ) sin ( θ 2 - π / 2 ) ) + a 1 cos ( π / 2 + θ 1 ) + sin ( α 4 ) ( cos ( θ 3 ) ( cos ( π / 2 + θ 1 ) sin ( θ 2 - π / 2 ) + cos ( θ 2 - π / 2 ) sin ( π / 2 + θ 1 ) ) + sin ( θ 3 ) ( cos ( π / 2 + θ 1 ) cos ( θ 2 - π / 2 ) - sin ( π / 2 + θ 1 ) sin ( θ 2 - π / 2 ) ) ) ( d 4 + l 3 + l 4 ) p y = a 2 ( cos ( π / 2 + θ 1 ) sin ( θ 2 - π / 2 ) + cos ( θ 2 - pi / 2 ) sin ( π / 2 + θ 1 ) ) + a 1 sin ( π / 2 + θ 1 ) - sin ( α 4 ) ( cos ( θ 3 ) ( cos ( π / 2 + θ 1 ) cos ( θ 2 - π / 2 ) - sin ( π / 2 + θ 1 ) sin ( θ 2 - π / 2 ) ) - sin ( θ 3 ) ( cos ( π / 2 + θ 1 ) sin ( θ 2 - π / 2 ) + cos ( θ 2 - π / 2 ) sin ( π / 2 + θ 1 ) ) ) ( d 4 + l 3 + l 4 ) p z = cos ( α 4 ) ( d 4 + l 3 + l 4 )
In the process of deriving the positive solution of the coordinate transformation matrix, the error declination of each part has been included in the rotation angle θ i , so the current initial position of the coordinate system in Figure 15 is the initial zero of the transformation matrix. By taking the error angle θ i of each point as 0, the transformation matrix of the infrared guided missile detection device in this case can be obtained, corresponding to the transformation matrix of the tool coordinate system relative to the base coordinate system in Figure 15:
T 0 = [ 1 0 0 1700 0 0 1 1682 0 1 0 0 0 0 0 1 ]
Based on the coordinate system of Figure 15 and the derivation process of the positive solution, the actual error value obtained in the previous paragraph is brought into the formula, and the transformation matrix under the influence of the error can be obtained:
T 1 = [ 1 0 0 1692.08 0 0 1 1676.84 0 1 0 0 0 0 0 1 ]
From the matrix we can know that the coordinates of the incident light point are (1692.08, 1768.84, 0), and the offset from the ideal coordinates is (7.92, 5.16, 0). The distance calculated by the matrix coordinates is 9.45 mm.

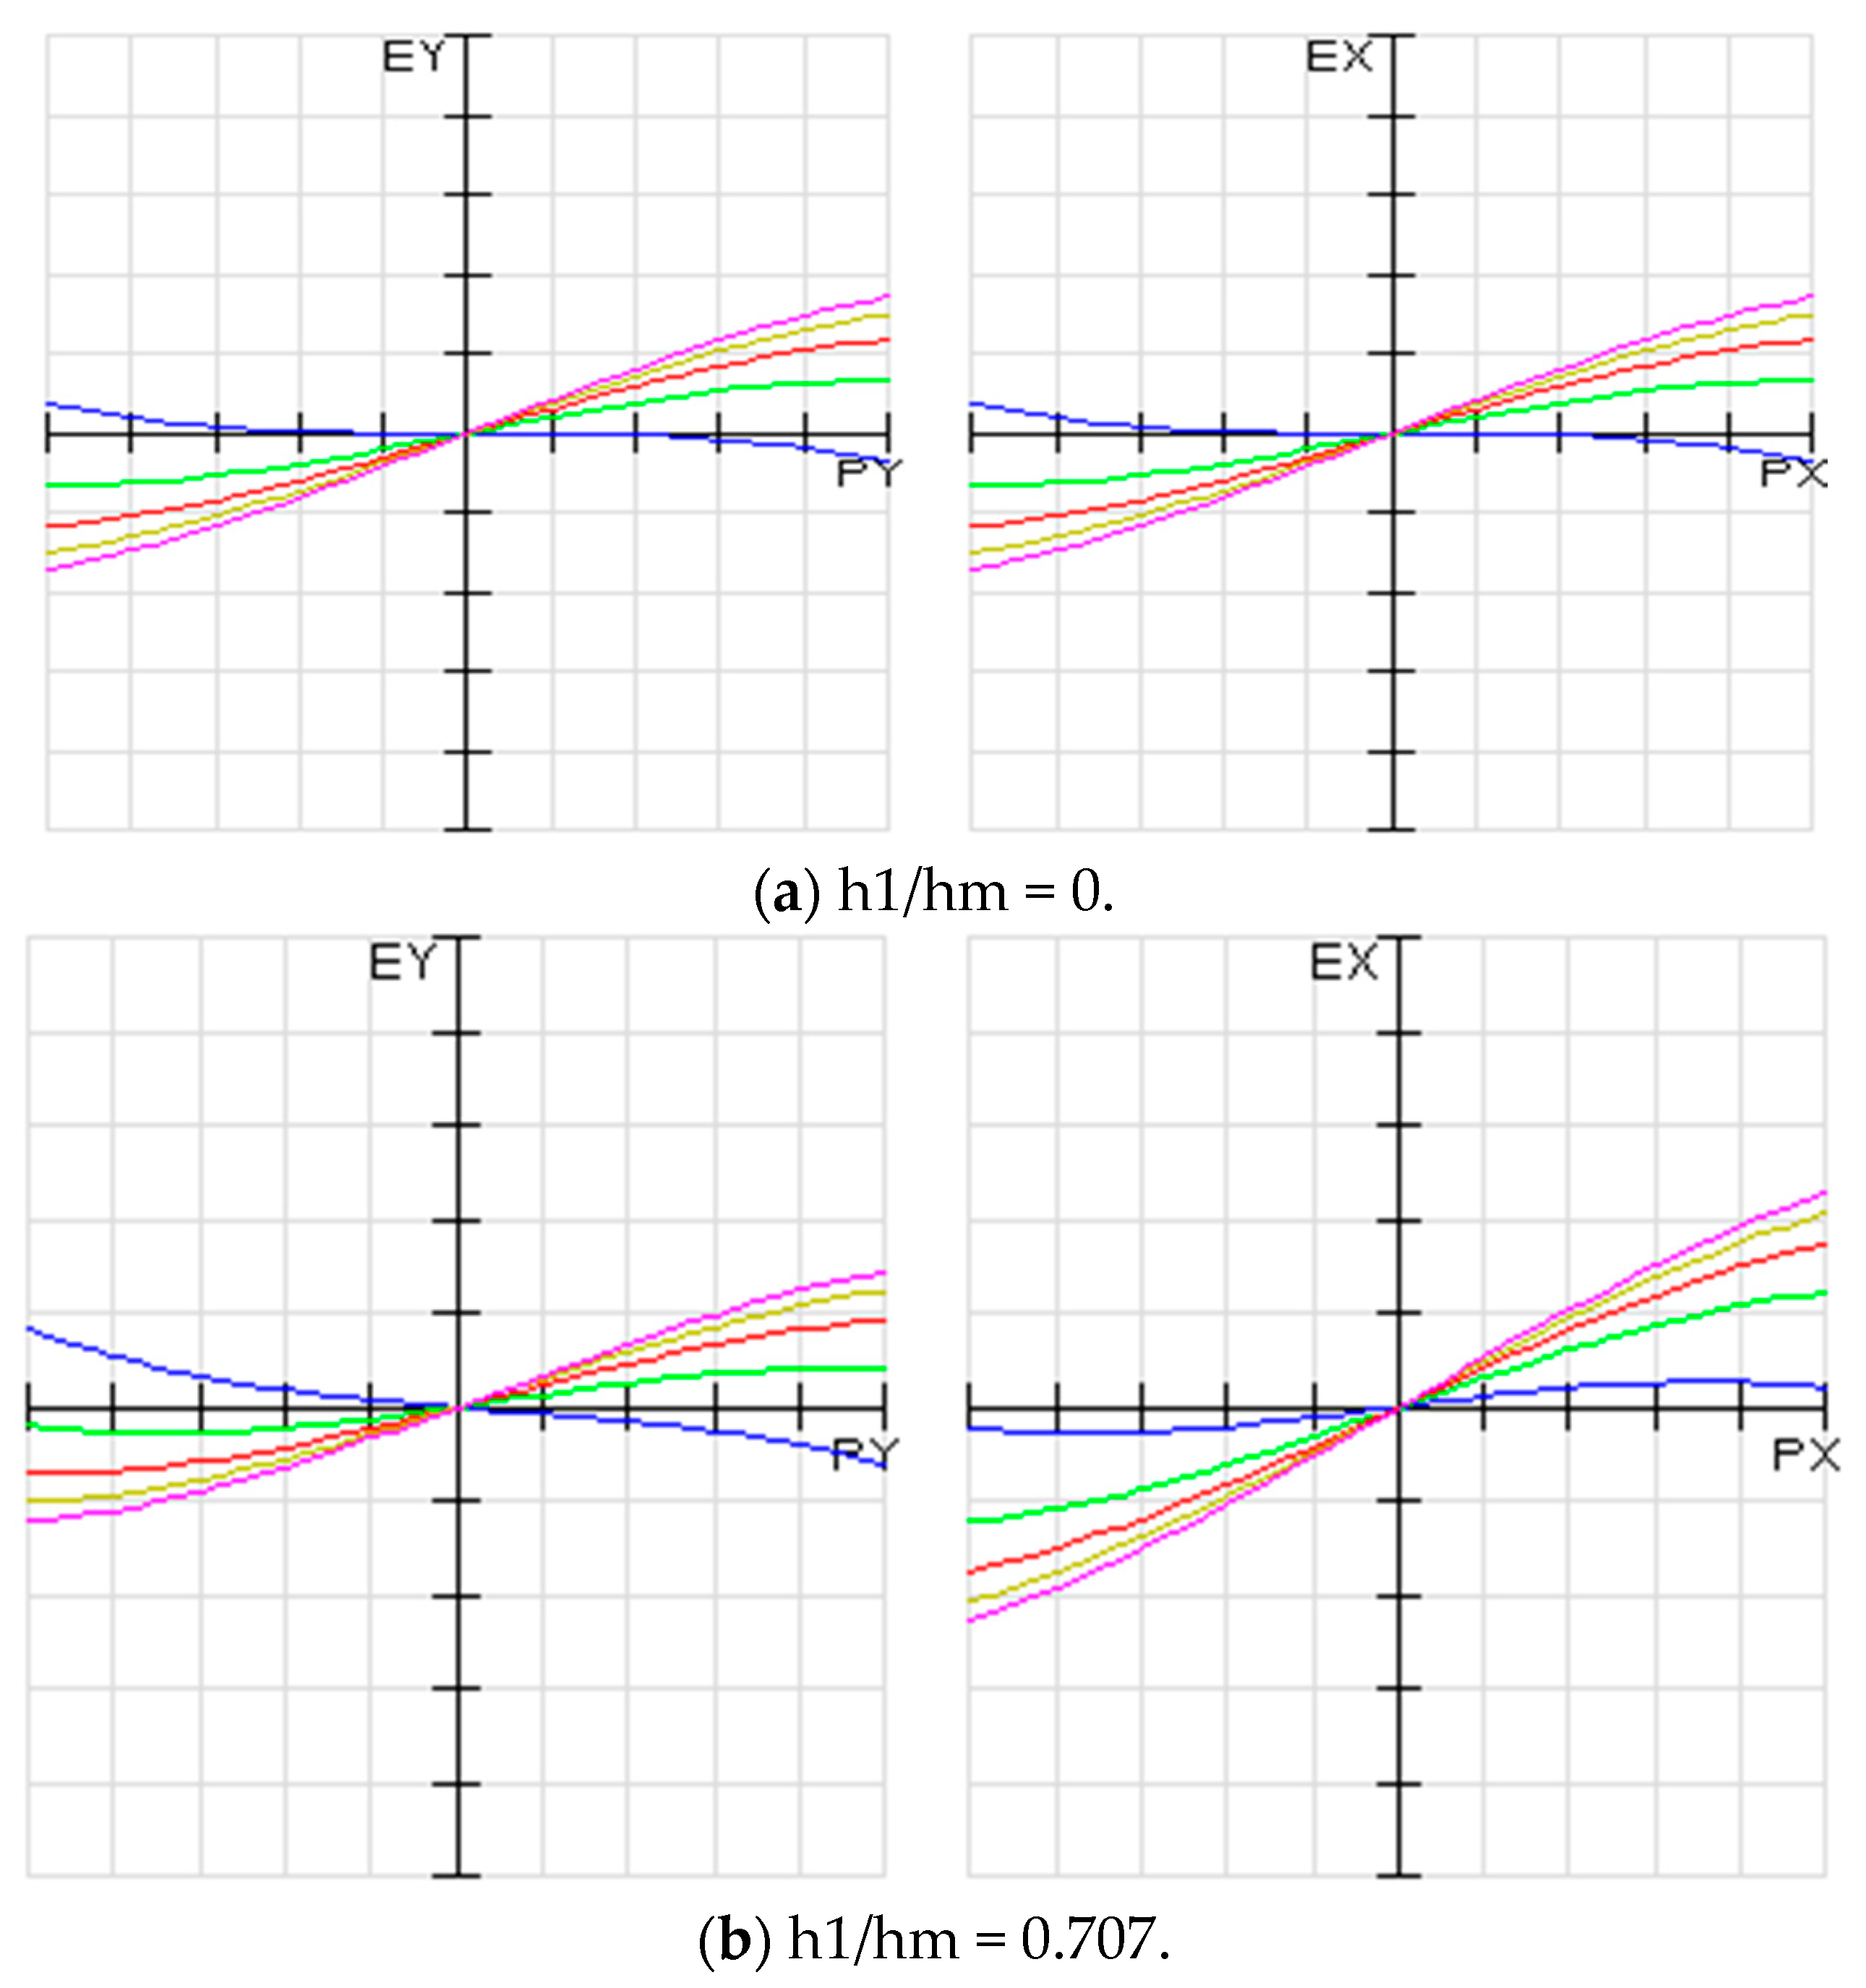
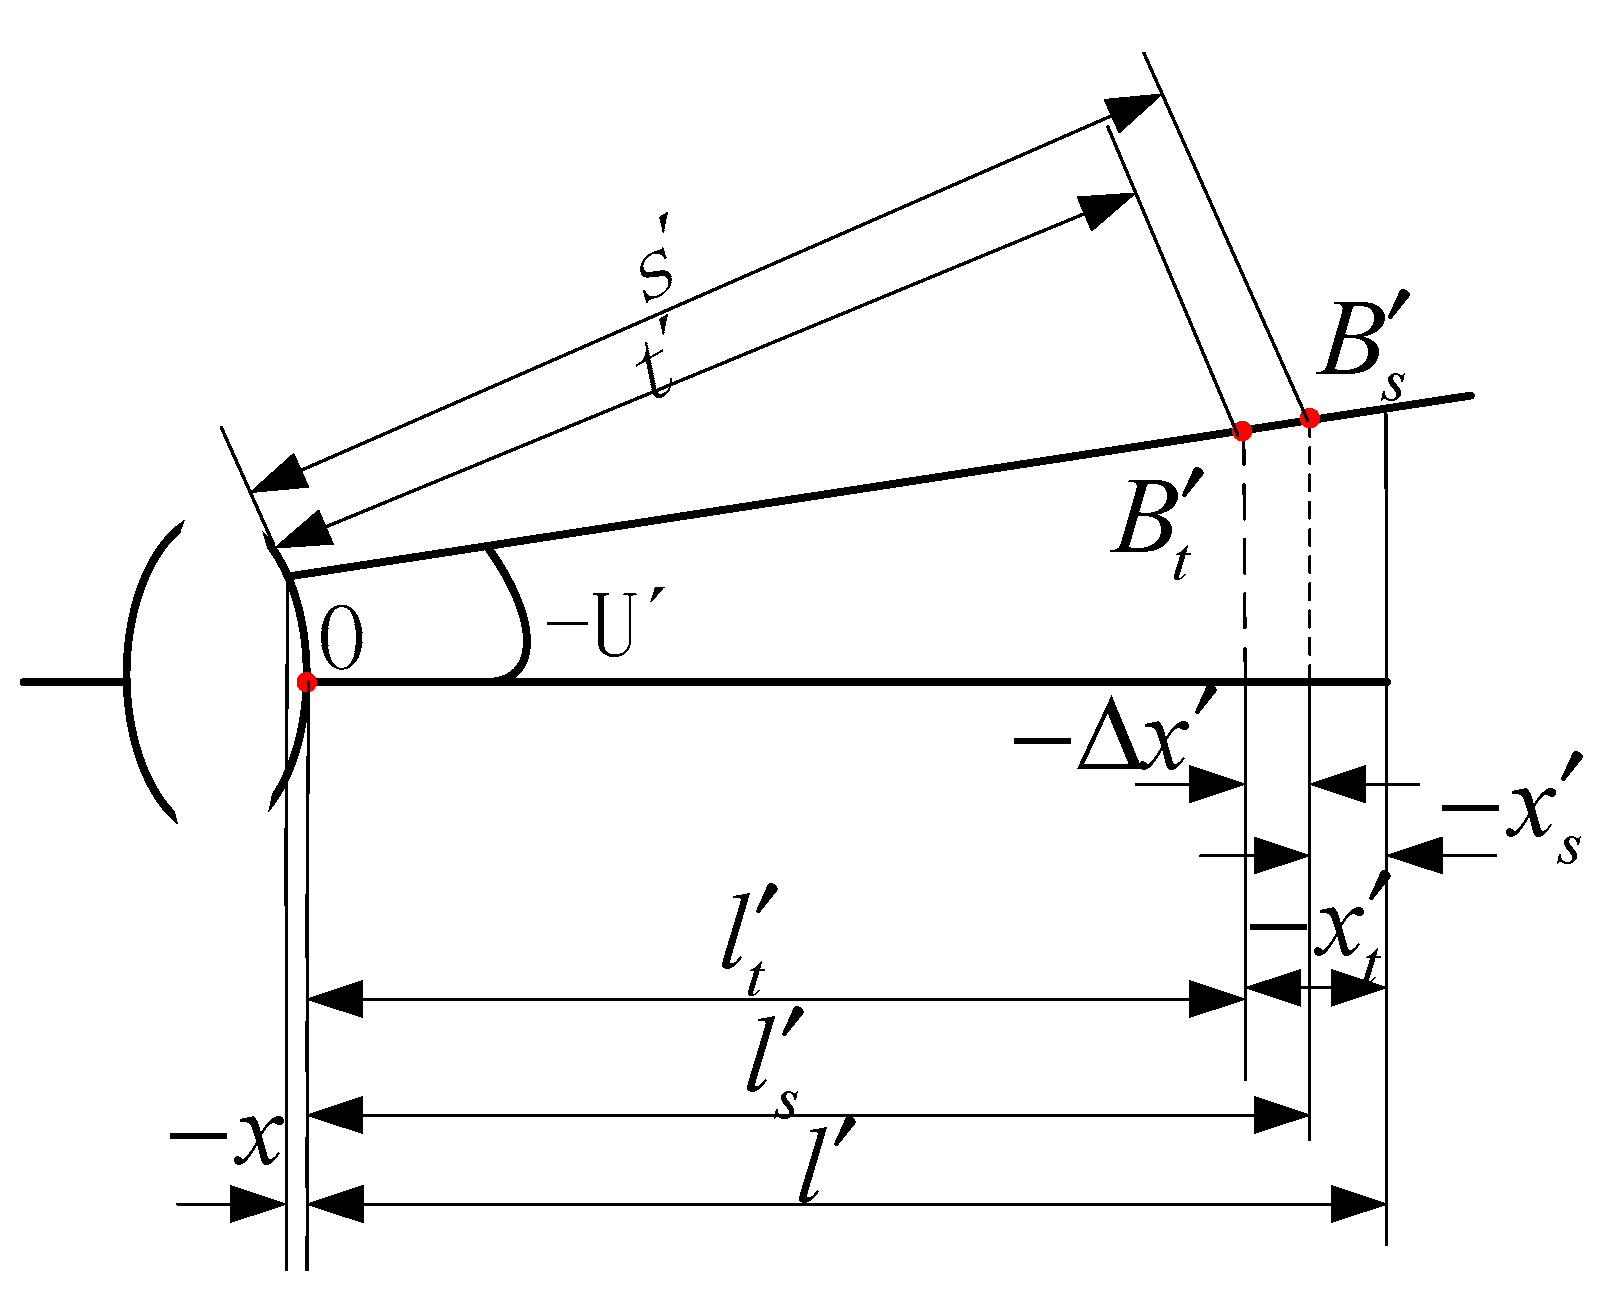
3.3. Aberration Analysis and Calculation of Eccentric and Tilt Systems

The traditional optical system with spatial transmission structure cannot accurately estimate and analyze the imaging quality in the process of installation and adjustment. The actual installation and adjustment mainly rely on the centering deviation measuring instrument and many years of engineering experience, which leads to long installation and adjustment time, large repeatability and low control precision, so it cannot meet the requirements of installation and adjustment. Because the design of the rotating infrared target simulator and the mechanical structure of the beam inevitably bring system eccentricity and tilt, coma and astigmatism can be induced in eccentric and inclined state through calculation and analysis that coma and astigmatism increase linearly as the offset increases, according to the following analysis of coma, astigmatism, respectively.

3.3.1. Computational Analysis of Coma

Coma is used to describe the aberration of the off-axis point beam losing symmetry with the main beam. Usually, it is required to take the meridian beam and sagittal beam. The coma of a single spherical surface is caused by two factors. On the one hand, the coma increases with the spherical aberration. On the other hand, the coma caused by the refraction spherical surface is also related to the position of the radiation beam, that is, the incident angle i p of the main ray. i p 0 , if i p is 0, no coma will occur regardless of the change.
Figure 16 shows the geometric light form at the coma focus. The light distribution can be imagined as a diffuse spot with a comet shape. The height of the image surface formed by different apertures forms a coma, in other words, the coma is the deviation of the edge of the aperture from the main ray. It can be seen from the fan diagram that this light is no longer rotationally symmetric.
The uppermost point in Figure 17 is the intersection point of the meridian rays and the lowermost point is the intersection point of the sagittal rays. From the above analysis, we can know that the calculated coma value is beneficial to further optimize the optical system and control the optical system during the adjustment process.
Figure 18 is a schematic diagram of the meridional coma, which shows the difference between the average of the focal heights of the pair of rays and the gaussian image plane and the height of the intersection of the main lines.
It is learned that the formula for meridian coma aberration is:
K t = 1 2 ( y a + y b ) y p
The sagittal coma formula is obtained because the coordinates of the intersection of a pair of symmetric sagittal rays and the Gaussian image plane are equal in the y direction:
K s = y s y p
Substituting the amount of eccentricity obtained in the previous section, that is, the defocus distance in optics, into the coma calculation software to obtain a coma value of 0.000806, which satisfies the requirement that the aberration is less than 2%. The coma is formed by imaging the points of the external field of view. You can reduce the coma by adjusting the field of view light bar, that is, the smaller the light bar aperture, the smaller the coma is. In this structure, the coma aberration of 0.5 mm is the smallest.

3.3.2. Computational Analysis of Astigmatism

Astigmatism and coma are also a type of aberration describing asymmetry. The difference is that coma is mostly a comet-shaped spot caused by a thick beam, while astigmatism is mostly a diffuse spot caused by a thin beam. The maximum and minimum two mutually perpendicular main intercept lines existing on a tiny surface element correspond to the meridian and sagittal directions in the optical system. The former converges at the meridional image point B t and the latter converges at the sagittal image point B s . The aberration of the position difference between them is astigmatism, as shown in Figure 19.
Enter the parameters into the software to get the maps of different faces to demonstrate the relationship between the meridian and sagittal planes and astigmatism in this structure in detail. The plane in the aforementioned optical system design was changed to the XY direction. The fan obtained by setting the parameters refers to the meridian and the sagittal plane. Figure 20 is a 3D view of a sagittal light fan.
In the light spot diagram shown in Figure 21, these are light spot diagrams at 0, 3.07, and 4.346 degrees of field of view, respectively. The figure shows that the off-axis field of view has obvious non-rotational symmetry, and the middle field of view has obvious elliptical characteristics, which is the main form of astigmatism. Now change the field of view to the meridional plane with only the second field of view. If you zoom in on the focal point of the image plane, you can see that the rays in the meridional section are not fully focused at this time, as shown in Figure 22. Then change the angle of the view, rotate the view 90 degrees around the Z axis, check the focus of the sagittal pipeline of the second field of view, and also enlarge the focus of the image plane, as shown in Figure 23. From the comparison of the light focus of the meridional section and the sagittal section, the cause of astigmatism can be clearly understood.
The position of the image point and the size of the dispersion vary with the incident surface. Two curved surfaces formed by the image point and tangent to the center point of the Gaussian image surface, that is, the image surface formed by the meridional image surface and the sagittal image surface, also called field song. x t and x s are meridian and sagittal field curvature, respectively. The astigmatism diagram is shown in Figure 24, and the astigmatism calculation formula is as follows:
{ l t = t cos U + x l s = s cos U + x
In the formula: l t is the axial distance of the refraction point M of the principal ray on the sphere relative to B t ; l s is the axial distance of the refraction point M of the principal ray on the sphere relative to B s ; t is the axial distance of the refraction point M of the principal ray on the sphere relative to B t ; s is the axial distance of the refraction point M of the principal ray on the sphere relative to B s .
The meridian field area and the sagittal field area are:
{ x t = l t l x s = l s l
Astigmatism:
Δ x = x t x s
The meridian field is obtained by software as x t = 0.4841 , The sagittal field curvature is x s = 0.2287 , Astigmatism is Δ x = 0.2563 , The maximum astigmatism is less than 2%, and the calculated value meets the requirements of aberrations, and it can be designed according to this structure. When designing the optical system, in order to improve the optical efficiency of the system, the main aberration value should be calculated. Select a reasonable system focal length, aperture, field of view, and structure according to the technical indicators to grasp the overall accuracy of the system.

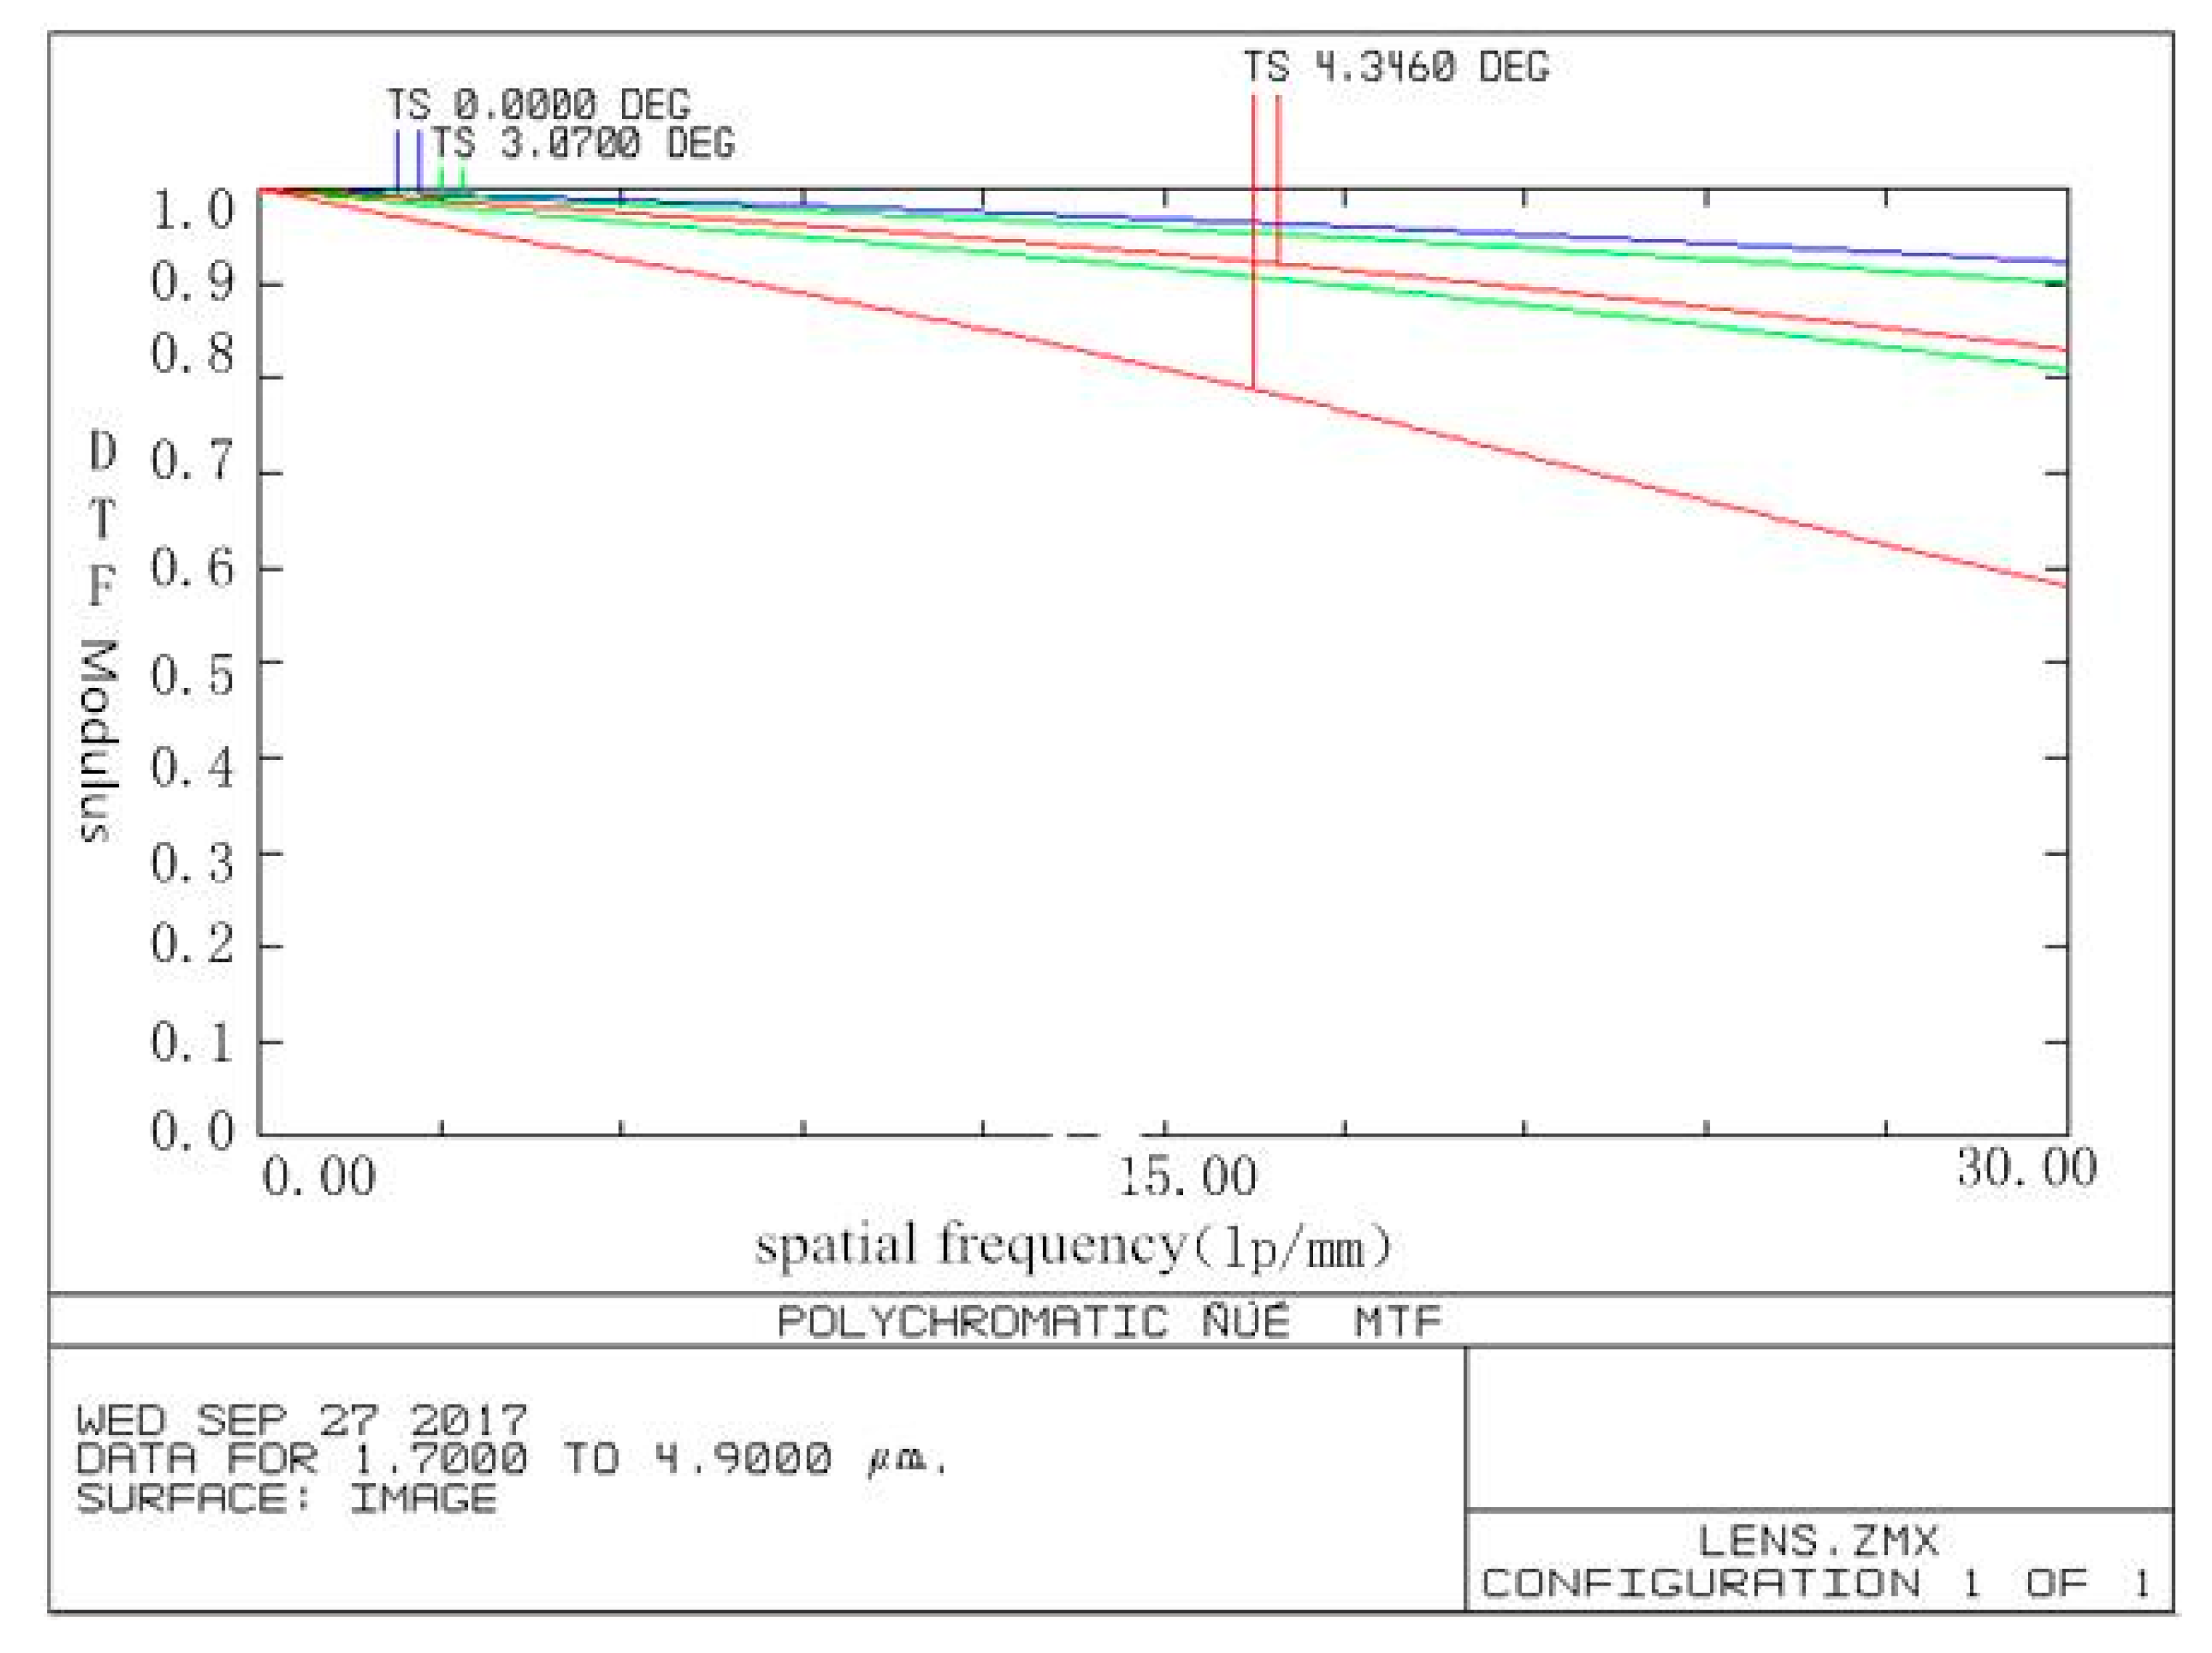
3.4. Optical Transfer Function to Evaluate Imaging Quality

An important issue in infrared optical systems is assessing imaging quality. It is known through practice that it is impossible and unnecessary to completely eliminate aberrations. Some residual aberrations must exist. When designing an optical system, the designer needs to ensure that the aberration is within a certain tolerance range, so that the receiving seeker cannot detect the change in aberration before the image quality can be considered satisfactory. The transfer function is used as an accurate and effective method to evaluate image quality. It is based on the essential characteristics of the optical imaging system, that is, the invariance of the space in the iso-halo area. The theory and methods in the telecommunications network are similarly applied to the optical system by the method of the Borie transform. The object and image information is analyzed by spectrum language, and the image quality evaluation adopts the characteristics of frequency spectrum change. This method is expressed in the form of functions, which can be applied to both small aberration systems and large aberration systems. Computer processing is simple and easy. In the optical transfer function, the high, medium or low frequency respectively represents the details, levels and contour transfer of the object, while the MTF transfer function can reflect the comprehensive performance of the system. MTF transfer function can meet the needs of infrared rotating target simulator system analysis, and it is selected to evaluate the imaging quality after comprehensive consideration.
In Figure 24, T represents the magnitude in the meridional direction, and S represents the magnitude in the sagittal direction. The meridional and sagittal transfer function curves of the field of view are automatically given in the software. In Figure 24 we can conclude: It can be known from the MTF curve that the spatial frequency of the system when it reaches the diffraction limit is 30 lp/mm, and it has good imaging quality. The system spot diagram is shown in Figure 21.
Figure 21 is a diffuse spot formed by the aperture area corresponding to different wavelengths and different viewing places. The larger the diffuse spot is, the larger the aberration is. It can be seen that the diffuse spot becomes larger as the wavelength increases.
From the point map, multiple rays emitted from a point affected by aberrations are dispersed in a certain area of the image plane. The degree of dispersion is used to directly observe the performance of the optical system. Using the results of ZEMAX design, we know that the diameter of the diffuse spot in the maximum field of view is approximately 950 µm, and the diameter of the remaining diffuse spot in the field of view is less than 950 µm. The dispersion angle corresponding to the maximum dispersion spot is θ = 950 / 2500 = 0.363   mrad , and the radius dispersion angle is 0.181 < 0.3 mrad , which meet the requirements of imaging quality in technical indicators.

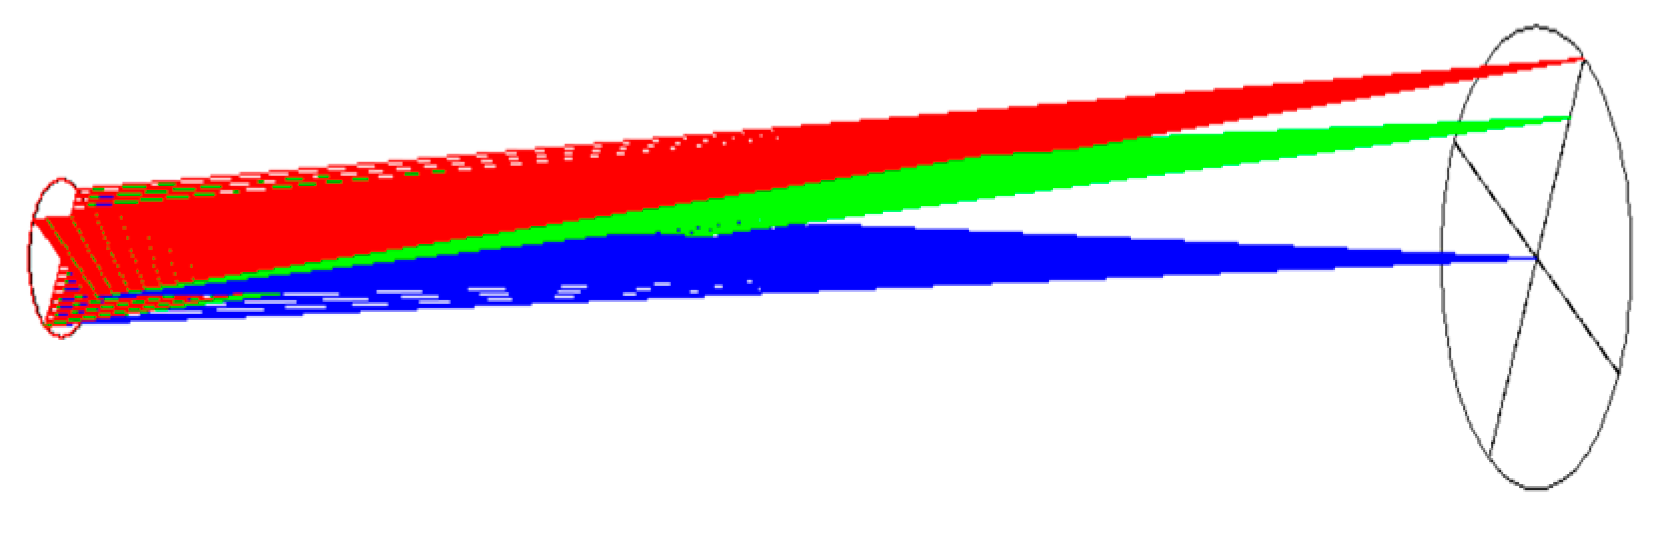
3.5. Diffraction Problem Analysis

In the infrared band, diffraction often affects the imaging quality, and the influence of diffraction and aberration should be considered comprehensively when evaluating the imaging quality. According to the diffraction theory of light, it is known that the optical system of the circular optical bar makes the point light source at infinite distance form the image of circular alternating light and dark diffraction, among which the brightest central circular spot is also called Airy spot. The angular diameter of Airy spot is shown as follows:
Δ θ = 2.44 λ D
The line diameter δl can be obtained by multiplying the angular diameter △θ with the focal length f’:
δ l = f · Δ θ = 2.44 λ f D = 2.44 λ F
By substituting the values of wavelength λ, pupil diameter D and focal length f’ into Equations (19) and (20), the angular diameter and line diameter can be calculated. When the wavelength λ is 1.7 μm, Δ θ = 3.19 × 10 - 5 mm , δ l = 0.07975 mm . When the wavelength λ is 4.9 μm, Δ θ = 9.2 × 10 - 5 mm , δ l = 0.23 mm . According to the above results, it can be analyzed that F increases with the increase in λ, and so does the diffraction damage. For the seeker, energy, aberration and diffraction should be considered comprehensively when choosing F.
The diameter of Airy spot 0.23 mm is smaller than the diameter of diffuse spot 0.95 mm obtained from the upper segment, so the angle meets the technical requirements. In this device, the influence of geometrical aberration is greater than that of diffraction.

4. Experimental Study of Infrared Guided Missile Detection Device

4.1. Construction of the Body Structure of the Detection Device

Infrared guided missile detection device experimental platform is shown in Figure 25, which consists of the simulator’s body structure, optical system, and control system. The auxiliary experimental equipment includes a missile seeker, a shaking table and an industrial control computer. Figure 26 is a lens device.

4.2. Detection Device Hardware System Construction

The hardware system is mainly composed of PLC control system, text display, DC servo motor driver, DC power supply and blackbody temperature control box. This device uses RS232 communication.
Due to the low rotation speed and relatively large torque of the mechanism, a permanent magnet DC servo motor was selected as the power source. Its characteristics of smooth torque, high accuracy, and wide speed regulation are widely used in servo drives. The specific model of the motor is: Yujie Motor 45LYX02, which adopts full closed-loop control to accurately control the position and speed. It is suitable for harsh application environments. The 1000-line encoder provides precise position accuracy, and the applicable temperature is −20 °C–100 °C. It is used together with ACSD608 servo driver. The driver uses a differential interface circuit suitable for differential signals. It uses a 32-bit high-speed DSP chip. The orientation vector is controlled by the FOC field. The position or speed supports closed-loop control. The power supply voltage range is 20 V–50 V, open-collector and PNP output circuit signal in one.
In order to improve the reliability of the system, PLC is selected as the controller, and the core technology is large-scale integrated circuits. Because there is only one controlled object for a PLC controller, a small PLC can be selected to meet the work requirements. The specific model of PLC is Delta DVP28SV. The PLC has a 28-point host, 14 channels of 200 K input/output, a complete communication -type host, the host points 8PI/4DO, built-in MiniUSB, Ethernet, RS-485 communication interfaces.
In order to achieve human-computer interaction, a text display is selected as the human-machine interface. The specific model is Delta TP04G-BL-CU, which can support RS232 communication ports, and provides 0–9 numeric keys for user-defined modules.

4.3. Detection Device Rotation and Swing Operation Experiment

The rotating and oscillating part of the device is the core of the device. Its role is to simulate the movement of real targets at different distances and positions. The rotation and swing operation test needs to realize continuous rotation and swing motion, and the distance and position of the target can be freely adjusted. After the missile is received, the structure can be fed back to the industrial control machine, which can meet the missile test requirements.

4.3.1. Positioning before Mechanism Experiment

Before the infrared guided missile detection device performs the work, it is necessary to manually adjust the position of the light bulb and the blackbody in the rotary swing mechanism and perform the positioning. Move the position of the light bulb and the blackbody to realize the positioning of the target to the target point of the missile seeker.
From the experimental results, it can be concluded that through manual adjustment, the position of the target source can be flexibly and quickly placed in different positions, thereby achieving the simulation of targets with different radii.

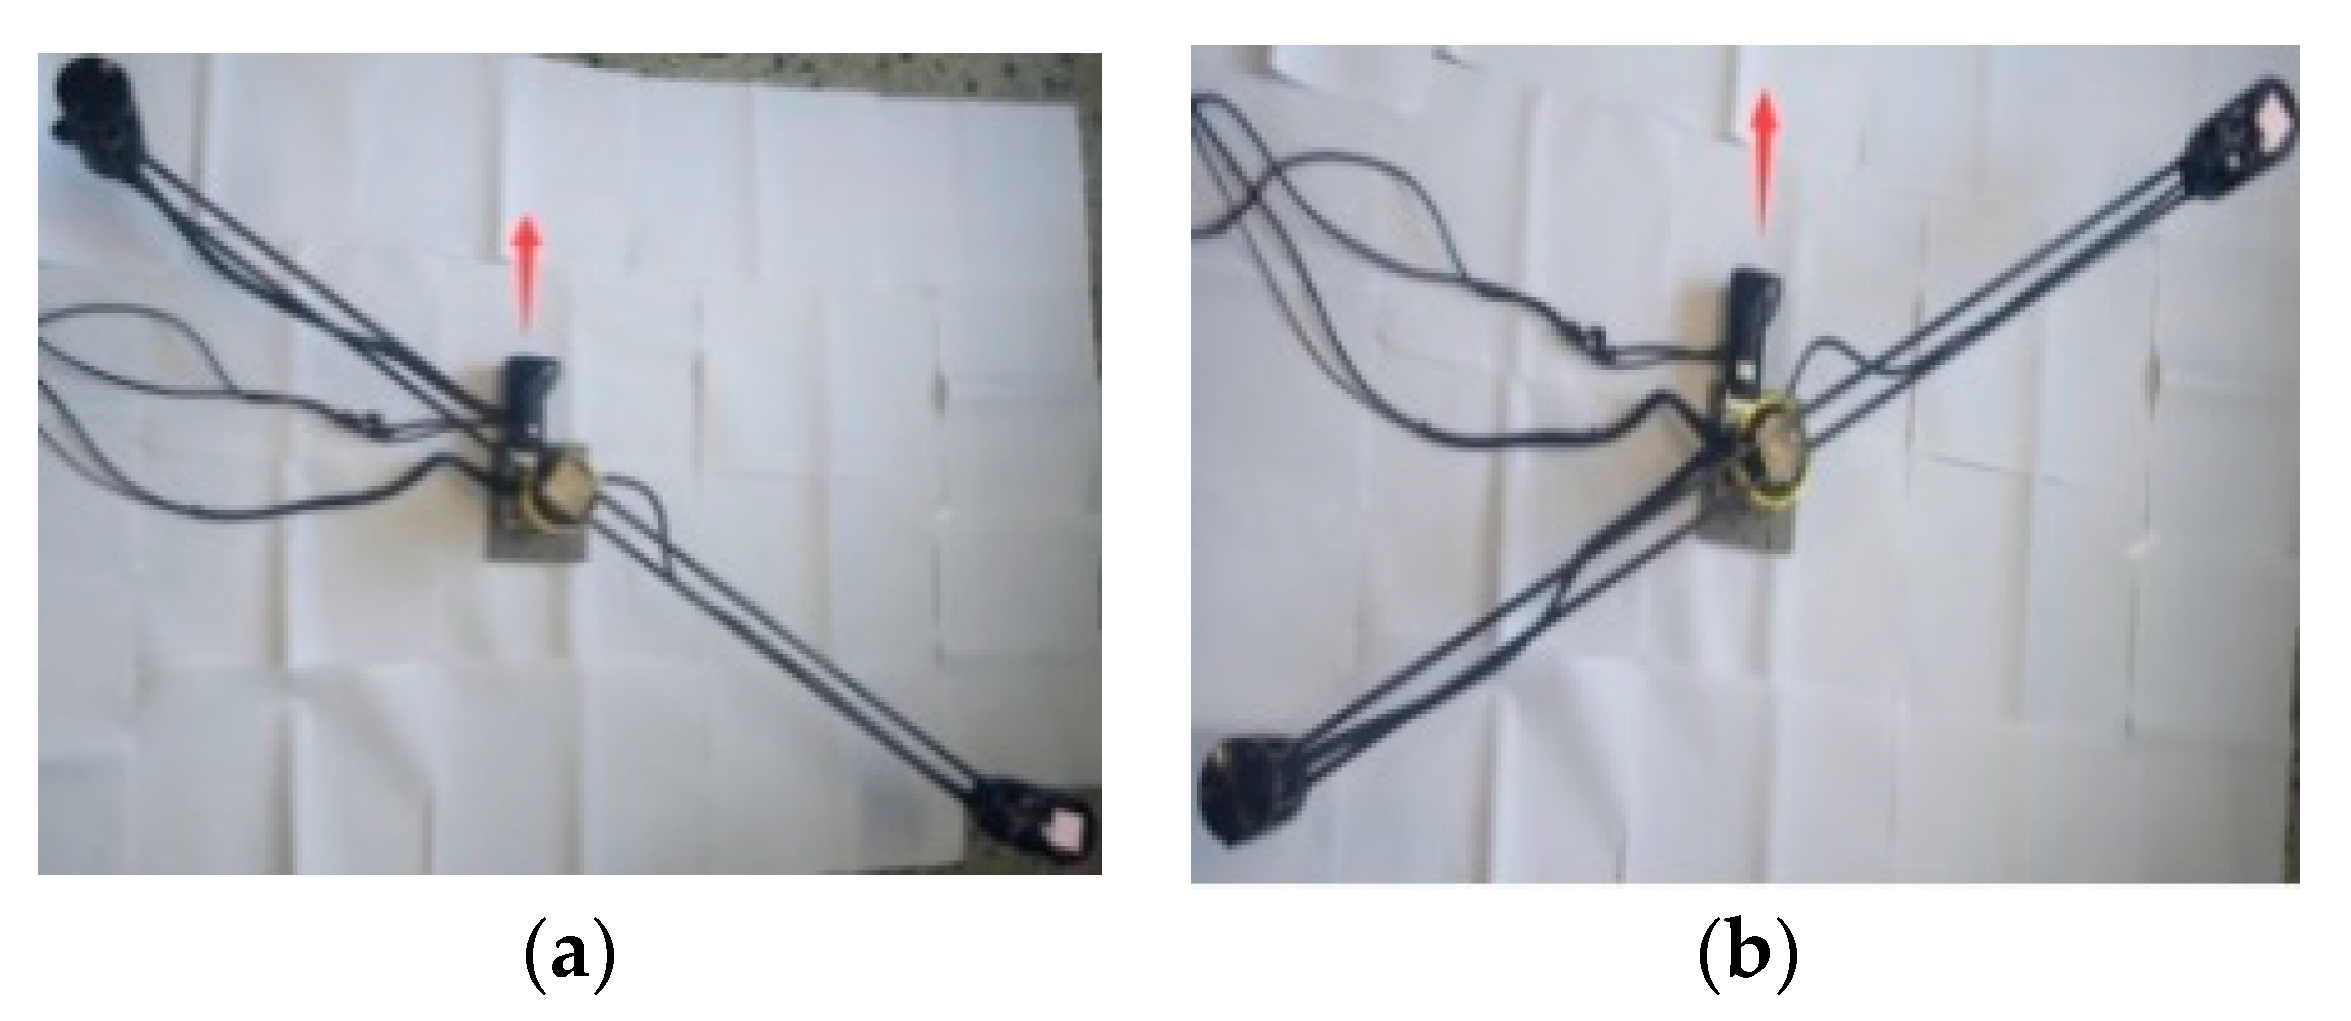
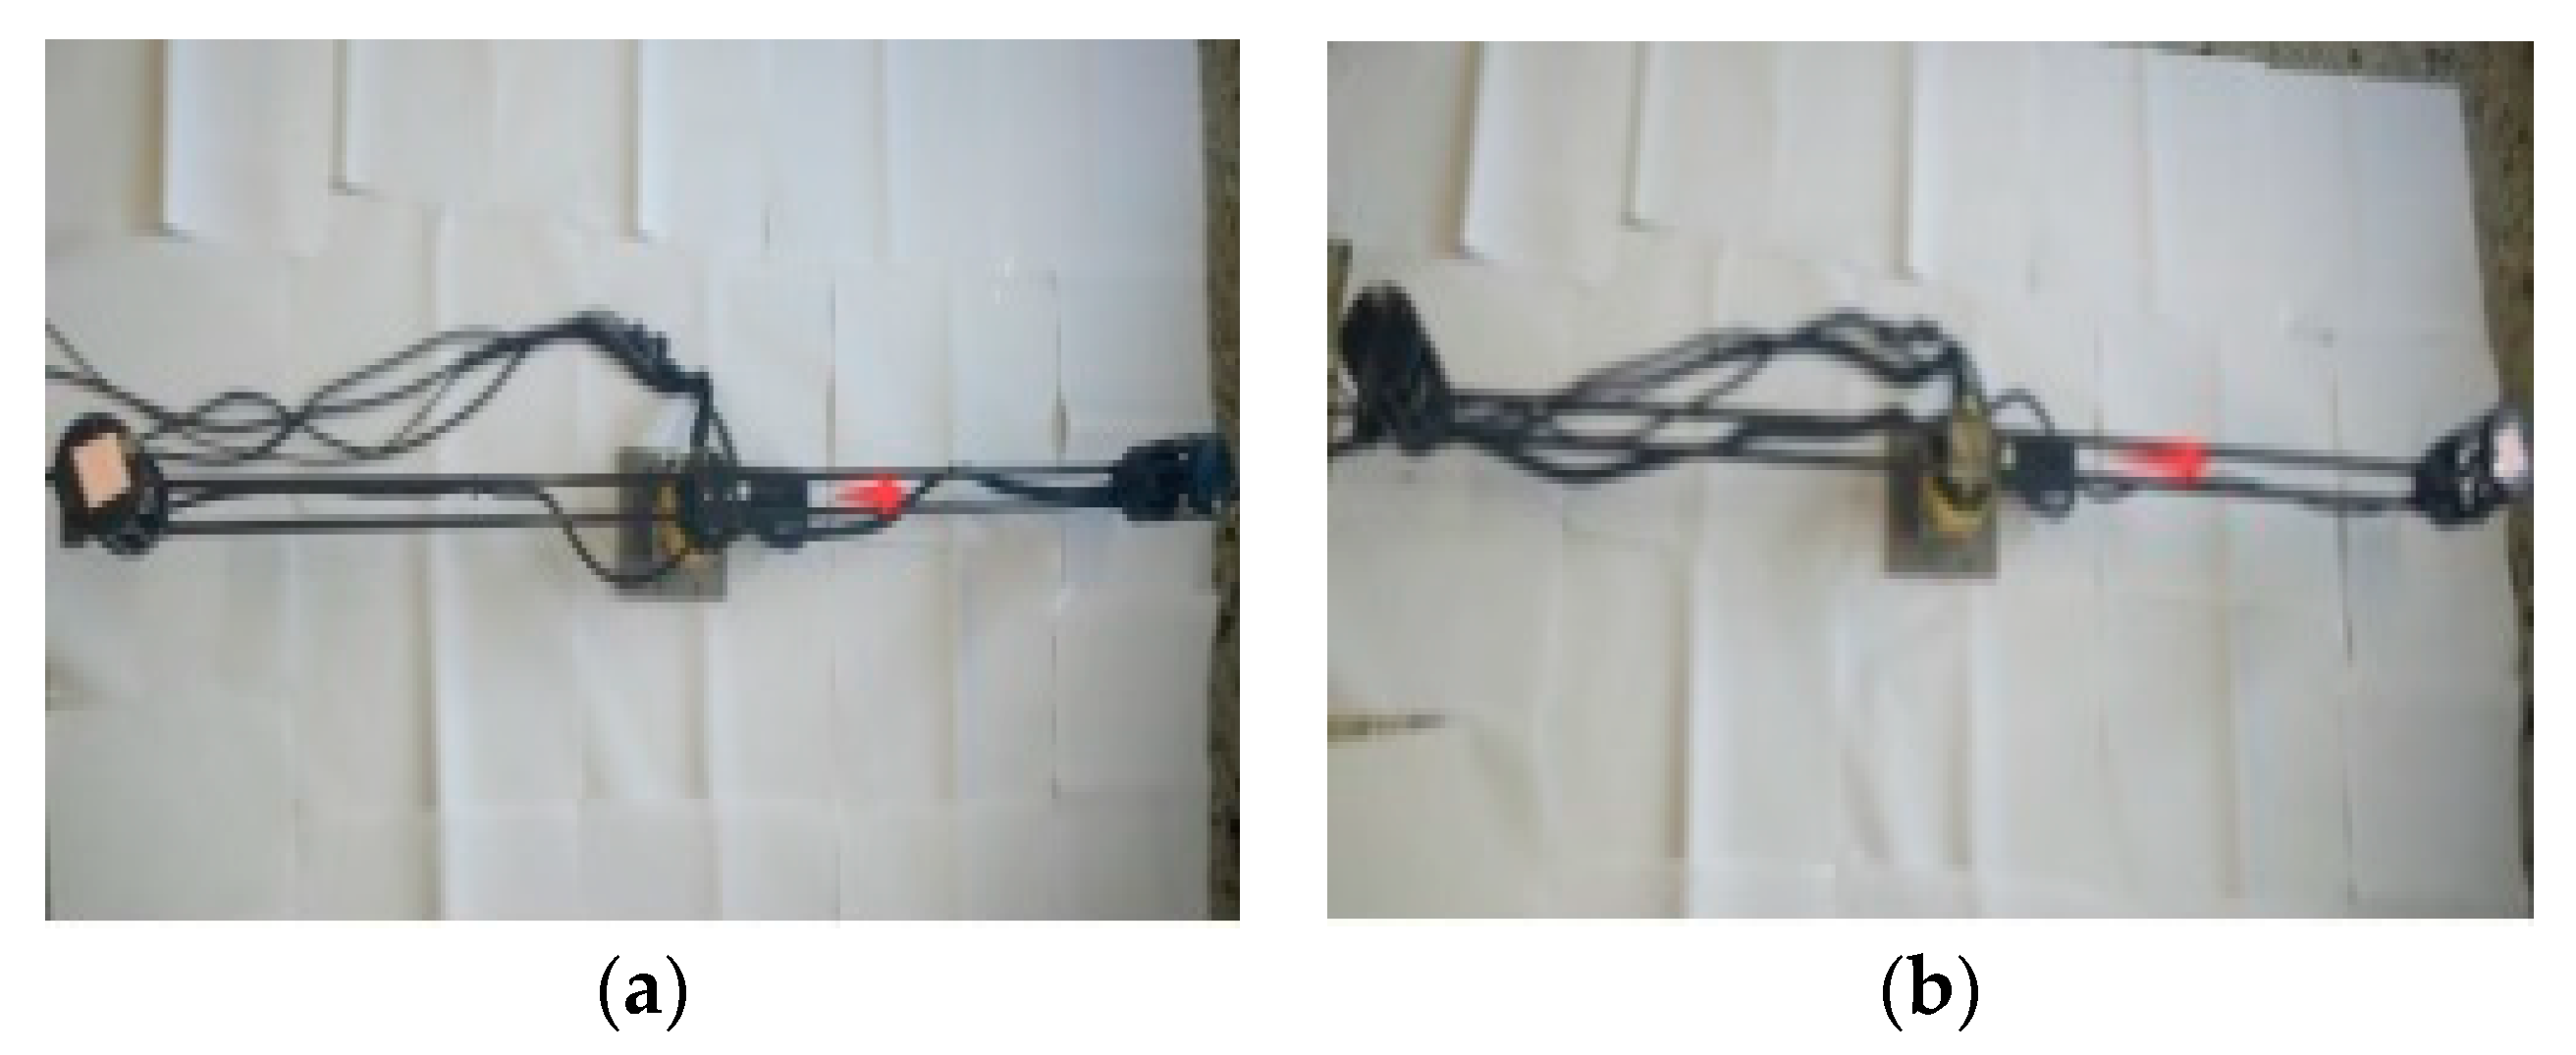
4.3.2. Mechanism Movement Range Test

Because the rotary swing mechanism uses a PLC control table to control the angle and speed, it is necessary to set the initial position before the experiment to ensure the accuracy of the movement. This experiment did not choose to install on a cantilever beam for experiments, but chose to test the performance of movement in the laboratory, because the support frame is too high, and the angle of rotation is difficult to observe and collect. The reference initial position set in this experiment is perpendicular to the central axis of the motor as the starting point, and the experiment is performed by clockwise and counterclockwise swings of 45°, 90°, 180°, and 360°, as shown in Figure 27, Figure 28 and Figure 29.
The results obtained through observation are consistent with the initial results, the target source can achieve continuous swing, and the final position when the clockwise or counterclockwise rotation is made substantially coincides with the initial position.

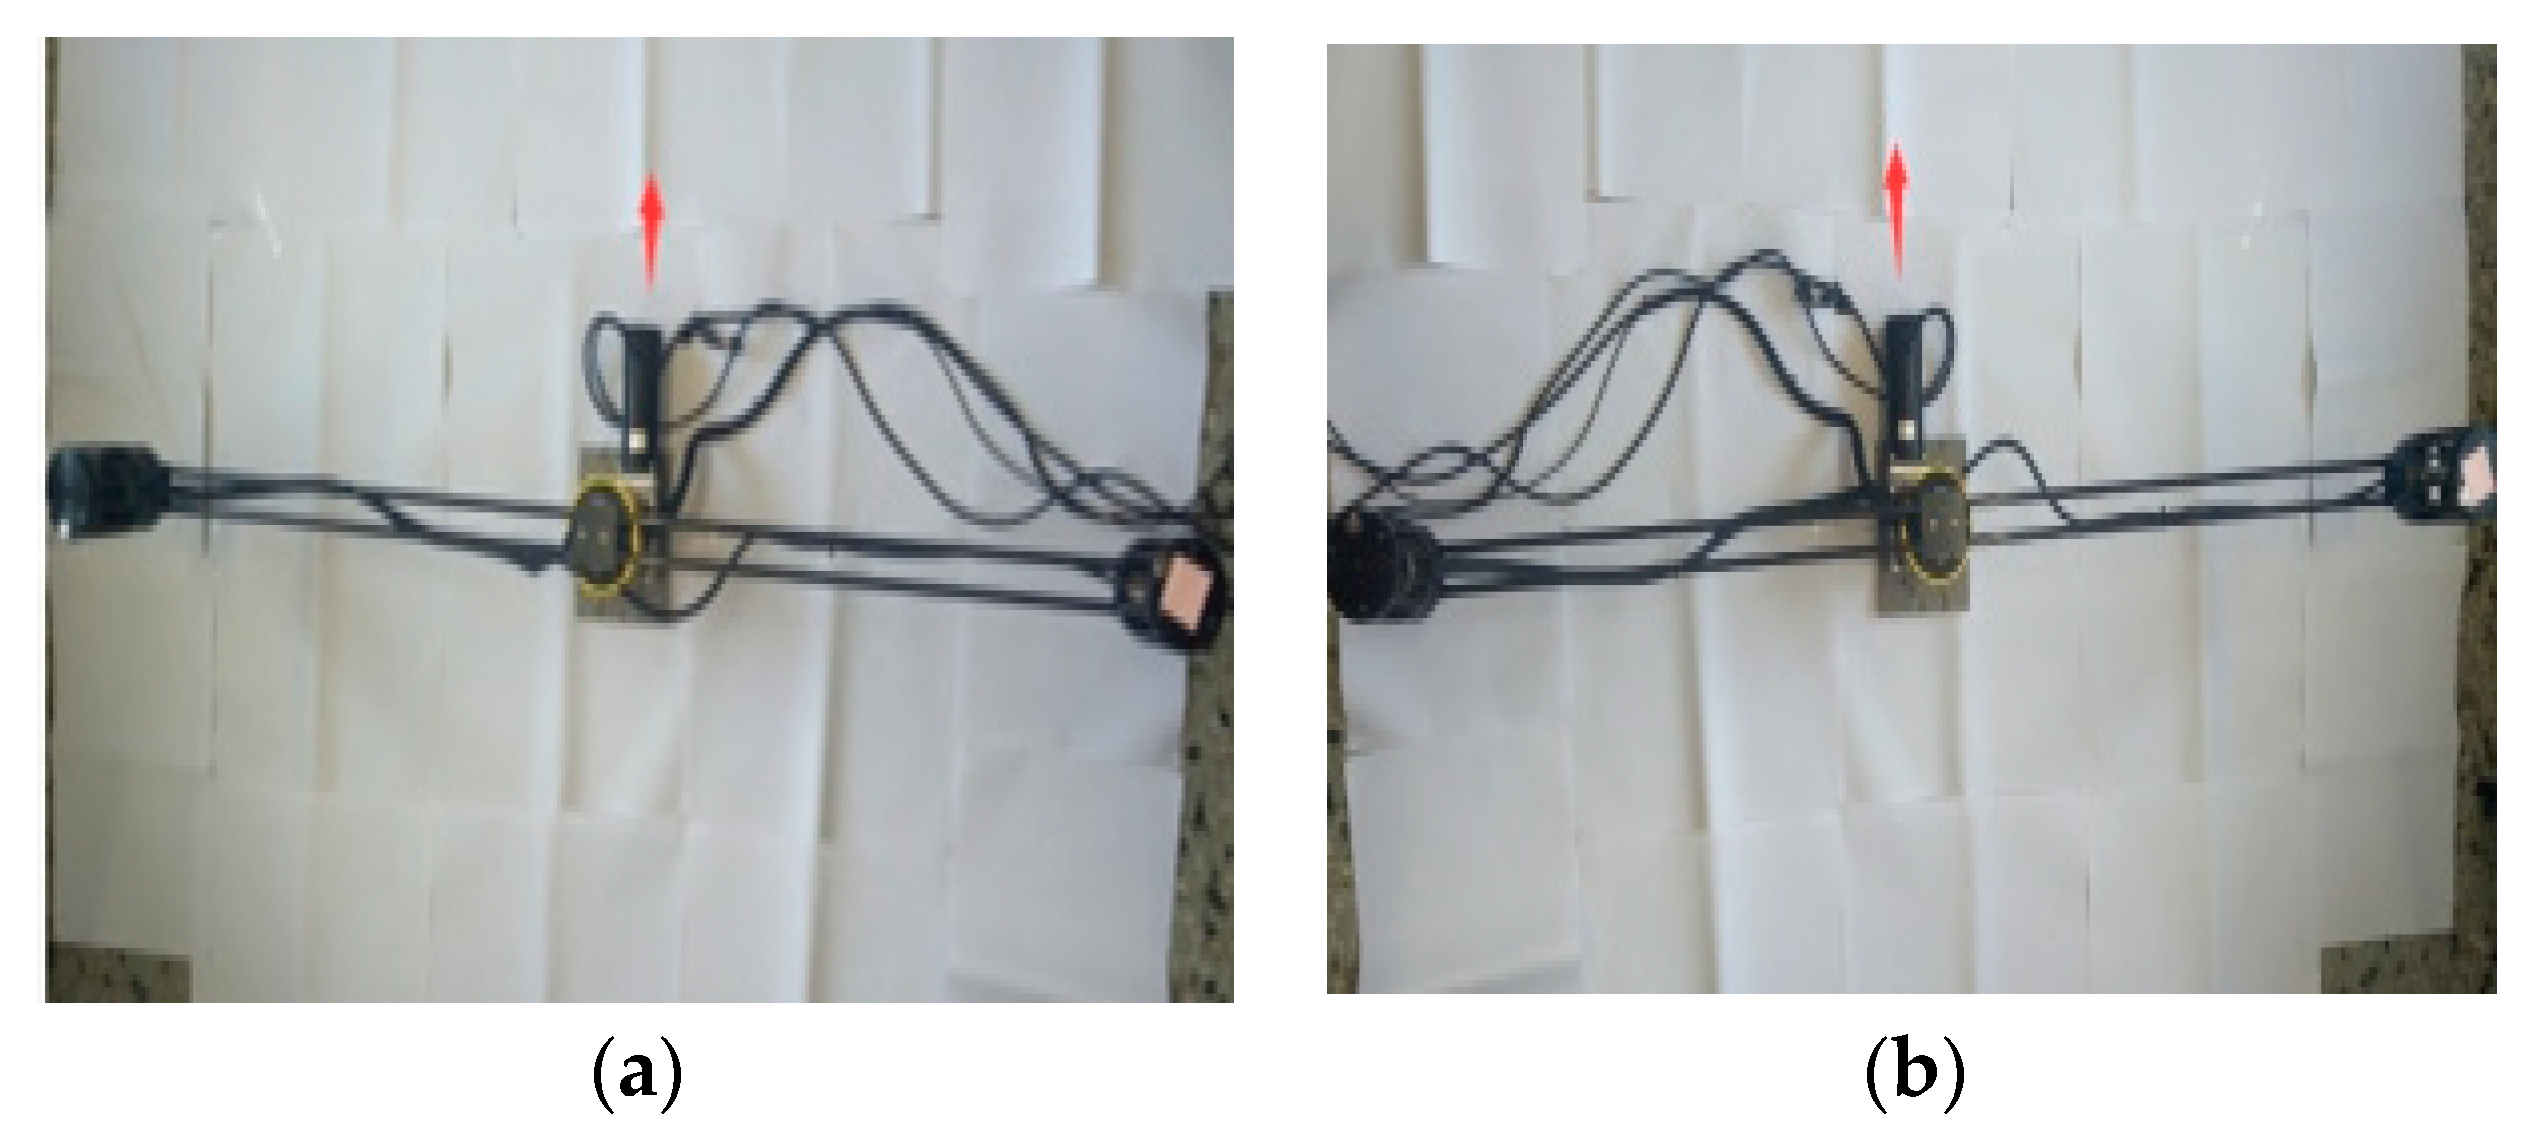
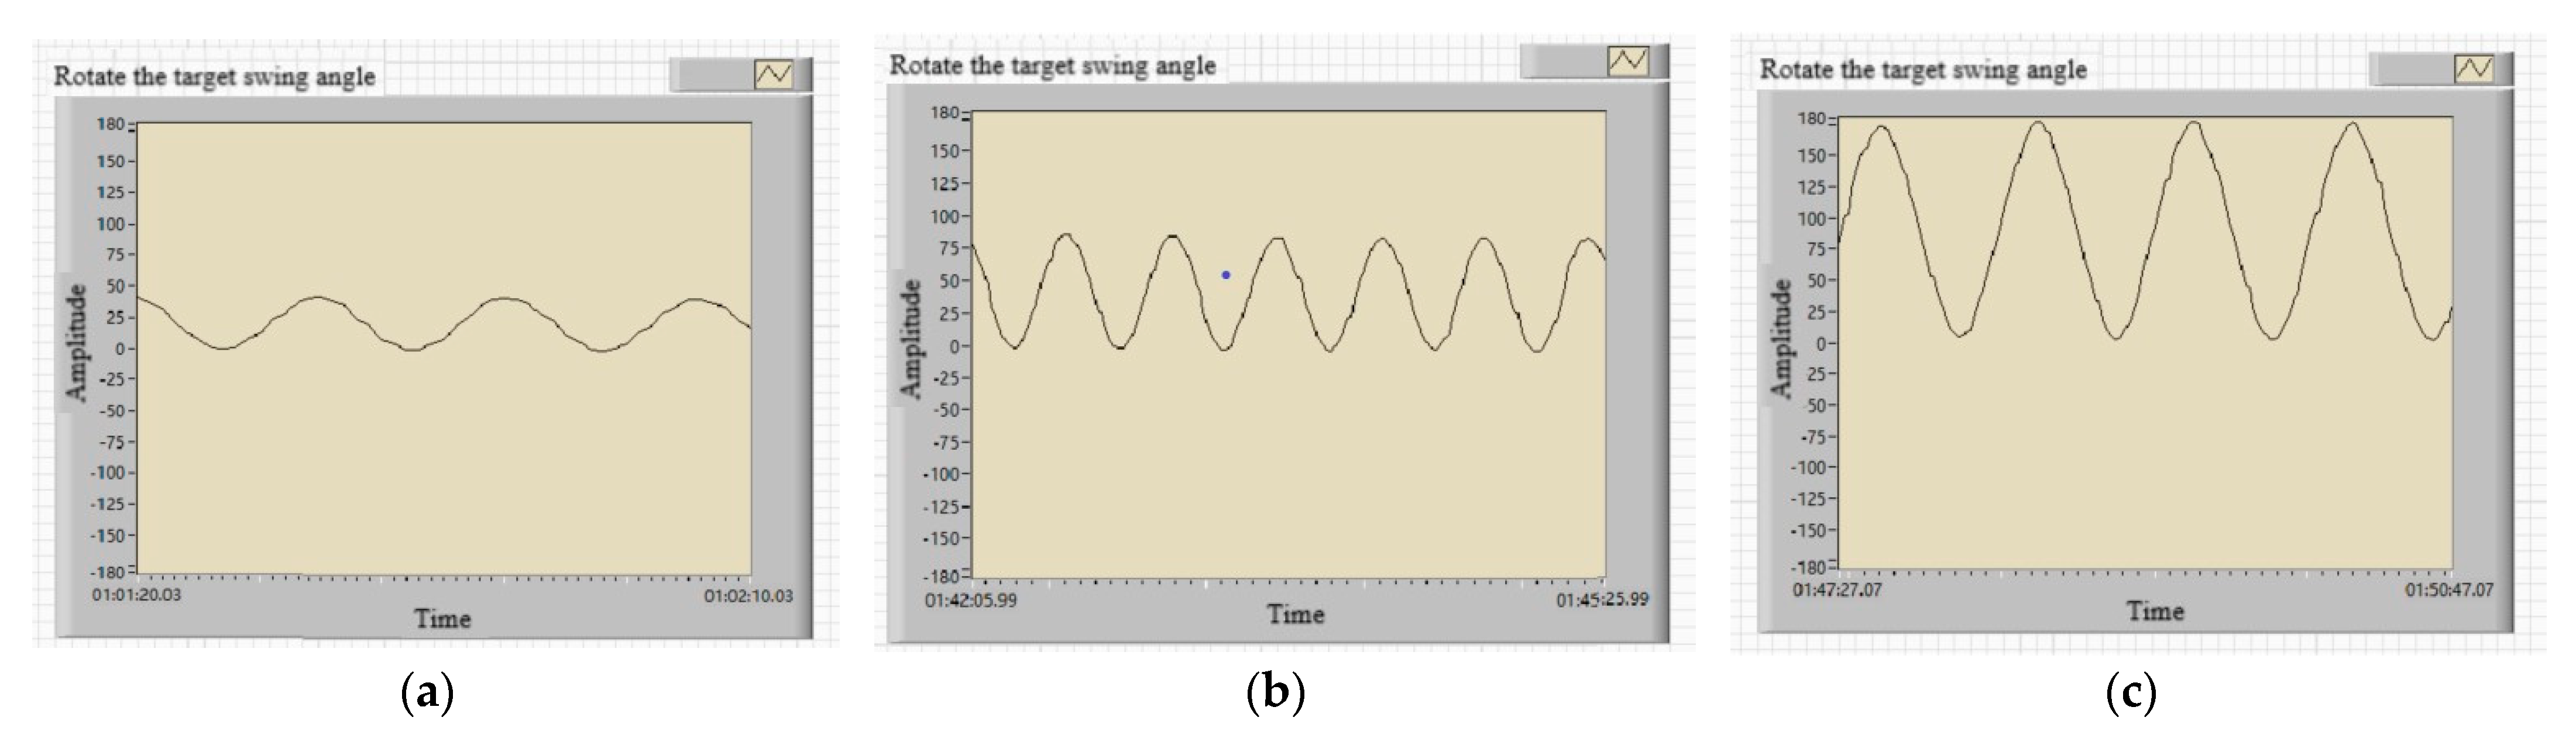
4.4. Verification of Rotation Angle

Through LabVIEW software to build the rotation angle acquisition platform, in the process of mechanism rotation, there is a need to monitor the operation of the mechanism according to the data collected by the upper computer. At the same time, the actual rotation angle and the theoretical value are measured, and finally the accuracy of the actual requirements is analyzed through comparison.
A VISA serial port driver is used to design the upper computer. The three-axis accelerometer that collects Angle and angular acceleration is placed at the target optical bar hole. The data of the accelerometer are read by ARM single chip microcomputer, and the data are input into the computer by serial port, and the data and data curve are displayed in LabVIEW software. The method of collecting experimental data is shown in Figure 30 below.
The curve of rotation angle is collected by the upper computer, and the mechanism rotates at the speed of 15 °/s and 30 °/s, respectively. The result is shown in Figure 31 and Figure 32 below. Figure 31a–c shows the curves of rotation 45°, 90° and 180° at a speed of 15 °/s, respectively. Figure 32a–c shows the curves of rotation 45°, 90° and 180° at a speed of 30 °/s, respectively. The error range of peak value is between 0.4 and 0.8°, which meets the requirements.

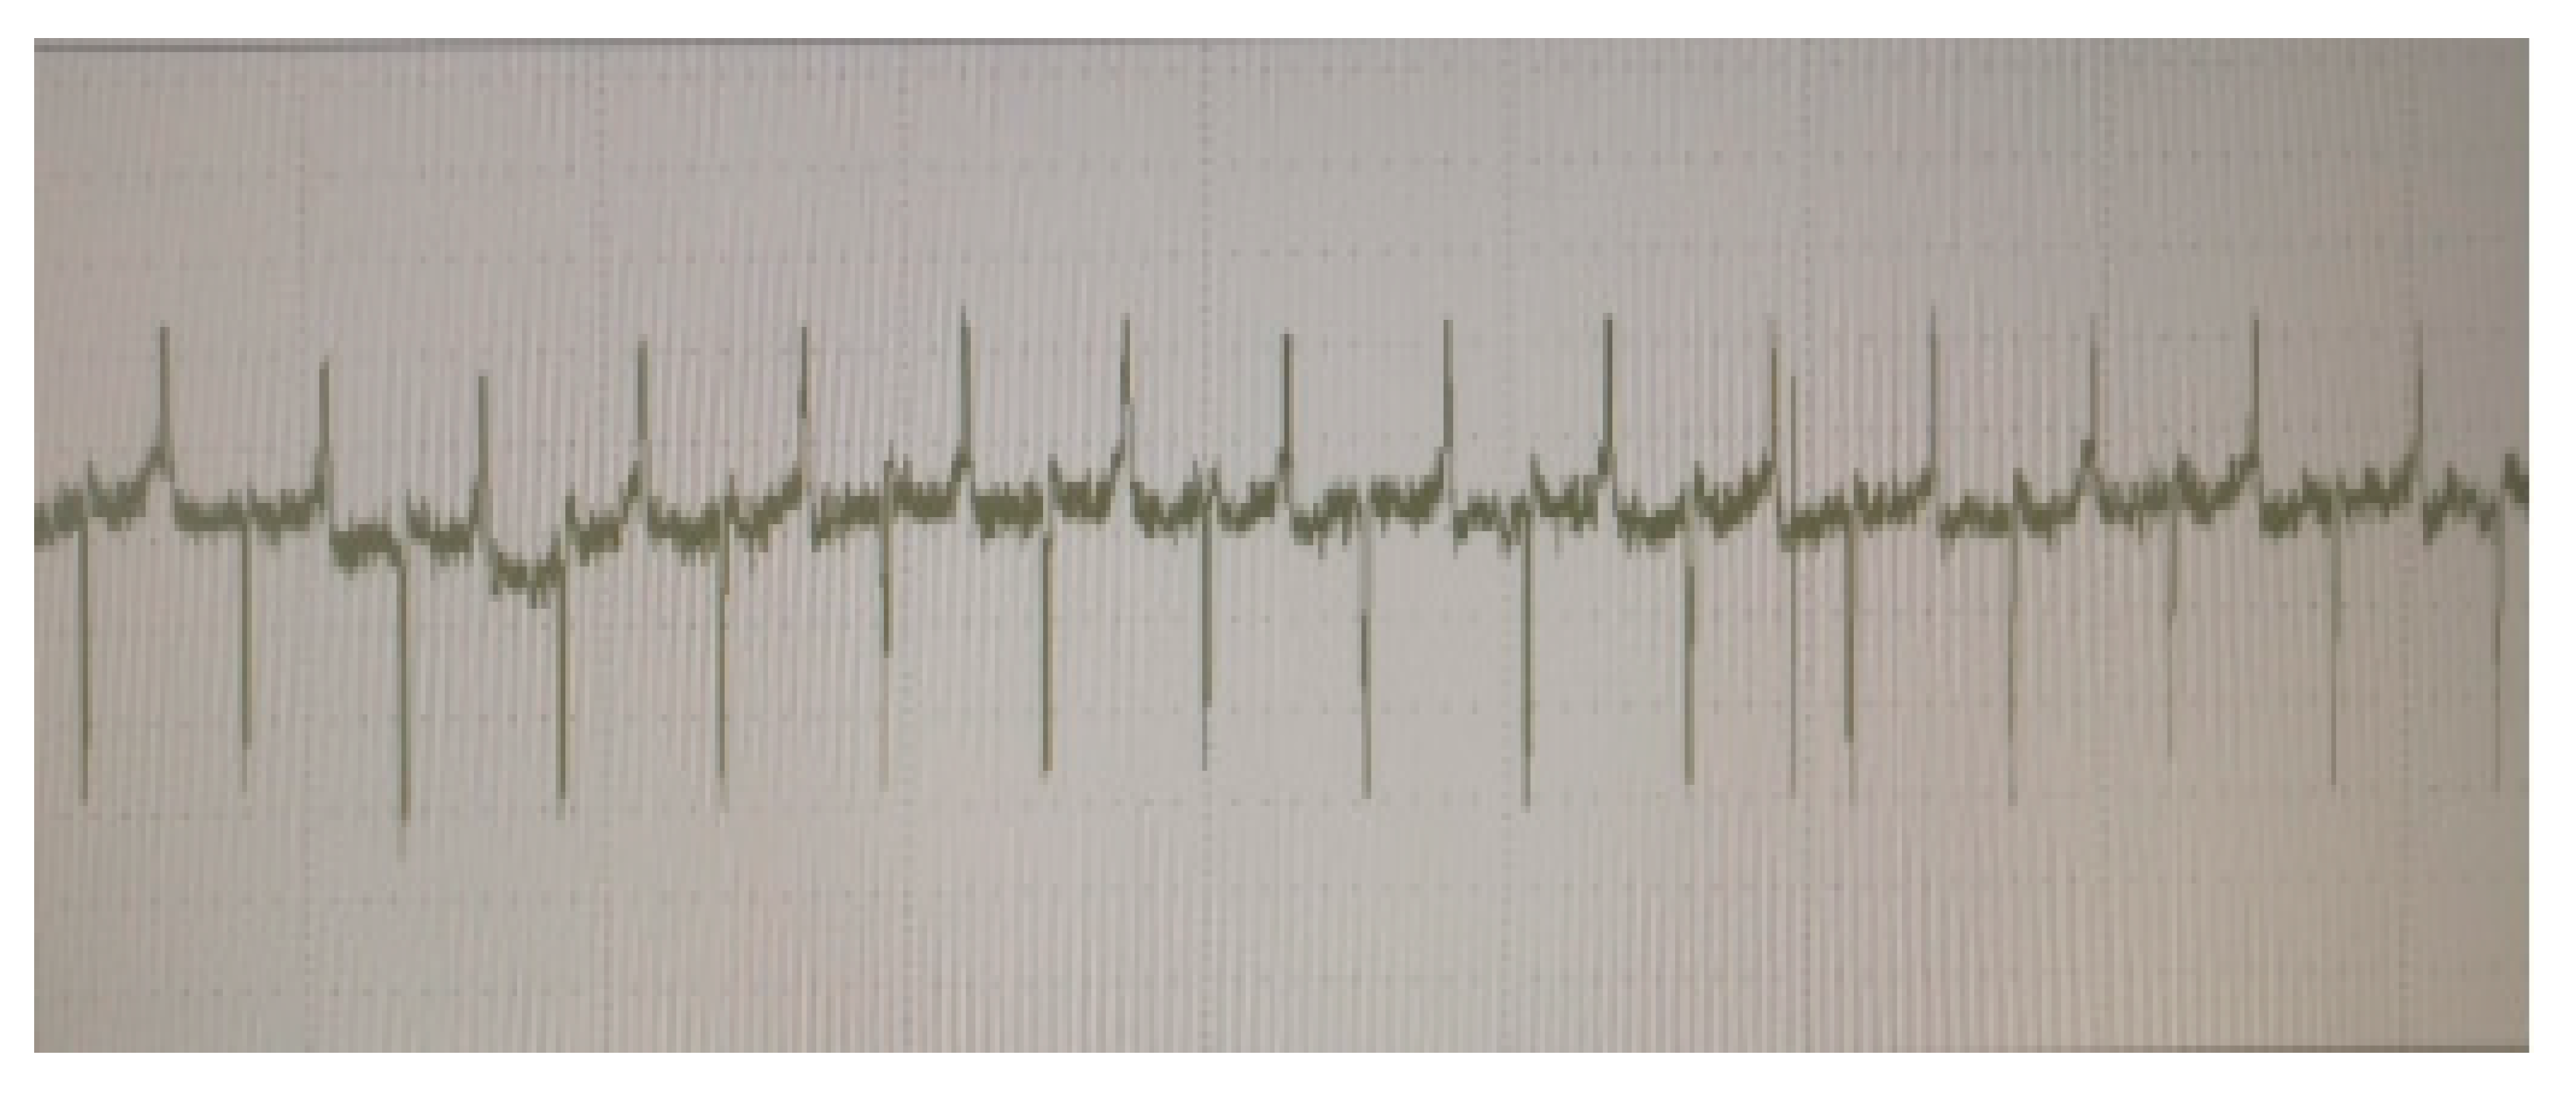
4.5. Detection Device Vibration Resistance Stability Swing Experiment

The development of infrared guided missile detection device is essentially to verify the ability of the seeker to receive targets under different vibration intensities. The center of rotation of the bracket, the center of the fixed table surface of the vibration table and the longitudinal axis of the seeker after installation are aligned on a straight line, and the slider is locked to fix the position of the rotation target simulator. The target is dynamically controlled to rotate or swing around the missile’s field of view as its center. The experimental temperature was (573 ± 2) K. The barrier hole is ϕ 1 mm . The tracking angular velocity of the seeker under vibration is not less than 4 °/s. The seeker has normal rudder control signal output, the parameters of the shaker are shown in Table 2, and the random vibration spectrum screened in the test is shown in Figure 33.
The hardware-in-the-loop simulation, that is, the missile’s dynamic receiving experiment was verified, and the waveforms graph received by the seeker are obtained in an industrial computer. The results are shown in Figure 34.
The experimental results show that the infrared guided missile detection device realizes the receiving experiment of the target radiation source in the vibration environment of the missile and meets the real needs. Applying multiple vibration frequencies to the seeker can measure the tracking of targets at different frequencies and improve the ability of the missile to be used in different environments.
In the following, the parameters of vibration frequency, amplitude and acceleration are adjusted to realize the simulation experiments of the seeker tracking target under different vibration intensities. The parameter table of vibration intensity test is shown in Table 3.
The experimental data show that the dynamic sensitivity and the maximum tracking angular velocity of the seeker meet the requirements. The seeker can stably track the simulated target. For missile strike target simulation experiments, the infrared guided missile detection device provides it with an accurate, controllable and repeatable indoor environment, so that staff can accurately and reasonably design and evaluate infrared point source guidance seekers while saving a lot of experimental costs.

5. Conclusions

The errors affecting the optical system are analyzed, and the mechanism characteristics of the simulator are analyzed in depth to obtain the final position of the seeker to receive the light source. The amount of eccentric tilt calculated from the matrix coordinates is 9.45 mm. Analyze the effect of the diffraction problem, and get a radius dispersion angle of 0.181 mrad. The optical transfer function (MTF) is used to evaluate the image quality. It is concluded that the system error meets the requirements of imaging quality, that is, it is required to ensure that the dispersion angle half-angle of the 1.7~4.9 um band is less than 0.3 mrad. Based on the Lab-view system, the curve data of angle and angular acceleration are collected to ensure the reliability of the mechanism operation, and the missile simulation and tracking target experiment is completed.
This infrared guided missile detection technology is an interdisciplinary fusion of optical, mechanical and electrical integration. It is suitable for the simulation and detection of short-range and small-scale missiles. It has the characteristics of long inter-pupillary distance, accurate target positioning, rotatable swing around the central axis, remote control and test cycle. It can greatly improve the success rate of missile strike targets, shorten the simulation target time, and reduce the experimental expenses. The infrared guided missile detection device has a simple structure, compactness, accuracy, and simple operation. It also has broad application development prospects.

Author Contributions

Z.W. (Zhuo Wang), conceived the framework of the article and wrote the article; Z.W. (Zhenyu Wu), carried out eccentricity and error analysis of infrared guided missile detection device; the third author, T.W., carried out experimental research on infrared guided missile detection device; B.Z., carried out device design based on infrared guided missile detection device. All authors have read and agreed to the published version of the manuscript.

Funding

The present research was funded by the NSFC (Contract name: Research on ultimate bearing capacity and parametric design for the grouted clamps strengthening the partially damaged structure of jacket pipes) (Grant No: 51879063), and (Contract name: Research on analysis and experiments of gripping and bearing mechanism for large-scale holding and lifting tools on ocean foundation piles), (Grant No: 51479043).

Data Availability Statement

Not applicable.

Conflicts of Interest

The authors declare no conflict of interest.

Nomenclature

Acronyms/SymbolsExplanation
MTFModulation Transfer Function
DCDirect Current
λWavelength
yThe distance between the blackbody and the central axis
l1Entrance pupil diameter
l2Exit pupil diameter
FF-number
ωThe field angle
ZEMAXOptical design software
PLCProgrammable logic controller
ωmaxMaximum deflection
θmaxAngle
EModulus of elasticity
IMoment of inertia
D-HDenavit-Hartemberg [26]
DOFDegree of freedom
i p The incident angle
K t Meridian coma aberration
K s The sagittal coma
B t The meridional image point
B s The sagittal image point
l t The axial distance of the refraction point M of the principal ray on the sphere relative to B t
l s The axial distance of the refraction point M of the principal ray on the sphere relative to B s
t The axial distance of the refraction point M of the principal ray on the sphere relative to
s The axial distance of the refraction point M of the principal ray on the sphere relative to B s
x t The meridian field area
x s The sagittal field area
Δ x Astigmatism
θThe dispersion angle
Δ θ The angular diameter of Airy spot
δlThe line diameter
f’Focal length
RS232Recommeded standard 232
DSPDigital Signal Processing
FOCField-oriented control
PNPP-N-P
PIPurse input
DODigital output
MiniUSBMini UniversalSerialBUS
LabVIEWA program development environment developed by NATIONAL Instruments (NI)
VISAVirtual Instrument Software Architecture
ARMAdvanced RISC Machines

References

  1. Sakarya, D.U.; Sari, H. Design of dual mode seeker for millimeter wave and four-quadrant detectors in missile application. In Optomechanical Engineering 2019; SPIE-International Society for Optics and Photonics: Bellingham, WA, USA, 2019. [Google Scholar]
  2. Zhao, J.; Yang, S.; Xiong, F. Cooperative guidance of seeker-less missile considering localization error. Chin. J. Aeronaut. 2019, 32, 1933–1945. (In Chinese) [Google Scholar] [CrossRef]
  3. Lv, J.; Luo, Y.; Qing, S.; Ye, J.B.; Zhou, X.Y.; Zhou, X.Q. Analysis of the application of infrared guidance technology in air-to-air missiles. Ordnance Equip. Eng. News 2017, 38, 70–74. (In Chinese) [Google Scholar]
  4. Lu, Y.; Kong, W.H.; Li, J. Analysis on Development of Test Capabilities of Semi-physical Simulation Tests of Foreign Tactical Missiles. Tactical Missile Technol. 2020, 02, 99–104. (In Chinese) [Google Scholar]
  5. Yang, X.D.; Chen, X.L. Development of infrared guided weapon simulation system. Infrared Laser Eng. 1998, 27, 16–19. (In Chinese) [Google Scholar]
  6. Zhou, Q. Dynamic Scene Simulation Techonlogy Used for Infrared Seeker. In International Symposium on Photoelectronic Detection and Imaging 2009: Advances in Infrared Imaging and Applications; SPIE-International Society for Optics and Photonics: Bellingham, WA, USA, 2009; Volume 7384, p. 73832W. [Google Scholar]
  7. Seppanen, M.S. Special Purpose Simulator Development. In Proceedings of the 1990 Winter Simulation Conference, New Orleans, LA, USA, 9–12 December 1990; pp. 67–71. [Google Scholar]
  8. Chen, H.J. British Aircraft System Simulation Technology. Syst. Eng. Electron. 1984, 1, 1–12. (In Chinese) [Google Scholar]
  9. Peng, G.Y. British Aerospace Corporation’s simulation experiments and several related laboratories. Syst. Eng. Electron. Technol. 1984, 1, 13–26. (In Chinese) [Google Scholar]
  10. Chen, X.D. Summary of Hardware-in-the-Loop Simulations of Foreign Tactical Missile Guidance Systems. Syst. Eng. Electron. 1984, 1, 26–35. (In Chinese) [Google Scholar]
  11. William, L.; Wolfe, G.; Lissis, J. The Infrared Handbook; Environmental Research Institute of Michigan: Ann Arbor, MI, USA, 1978; pp. 63–67. [Google Scholar]
  12. Beasslec, R.J.; Popper, H. Infrared Simulation System (IRSS). Phase I Final Report; Defense Technical Information Center: Fort Belvoir, VA, USA, 1977. [Google Scholar]
  13. Huang, C.; Chen, H.Q.; Li, J.; Yang, Z.G.; Zhao, S. System Design and Description of Infrared Simulator System Based on the Multidimensional Flight Table. In Photonics and Optoelectronics Meetings (POEM) 2008: Laser Technology and Applications; SPIE-International Society for Optics and Photonics: Bellingham, WA, USA, 2009; Volume 7276, p. 72760M. [Google Scholar]
  14. Bianco, V.; Mazzeo, P.L.; Paturzo, M.; Distante, C.; Ferraro, P. Deep learning assisted portable IR active imaging sensor spots and identifies live humans through fire. Opt. Lasers Eng. 2020, 124, 105818. [Google Scholar] [CrossRef]
  15. Hill, J.E. Techniques for Simulation Multi-mode Seekers. In Proceedings of the 1992 Summer Computer Simulation Conference, Reno, NV, USA, 27–30 July 1992; pp. 836–849. [Google Scholar]
  16. Sholes, W.J.; Buford, J.A., Jr.; Harrison, K.R.; Barnette, J.S. System Description and Applications of the Imaging Infrared Simulation System III at the U.S. Army Aviation and Missile Command. In Technologies for Synthetic Environments: Hardware-in-the-Loop Testing V; SPIE-International Society for Optics and Photonics: Bellingham, WA, USA, 2000; Volume 4027, pp. 22–29. [Google Scholar]
  17. John, S.C. A Second Generation Millimeter Wave Hardware in-the-loop Simulation Facility. In Proceedings of the 1994 Summer Computer Simulation Conference, San Diego, CA, USA, 18–20 July 1994; pp. 373–378. [Google Scholar]
  18. Wang, Z.L.; Zhang, W. Research on optical technology of infrared imaging target simulator based on zoom system. Opt. Tech. 2004, 30, 420–422. (In Chinese) [Google Scholar]
  19. Shanmugam, L.; Naebe, M.; Kim, J.; Varley, R.J.; Yang, J. Recovery of Mode I self-healing interlaminar fracture toughness of fiber metal laminate by modified double cantilever beam test. Compos. Commun. 2019, 16, 25–29. [Google Scholar] [CrossRef] [Green Version]
  20. Terasaki, N.; Fujio, Y.K.; Horiuchi, S.; Akiyama, H. Mechanoluminescent studies of failure line on double cantilever beam (DCB) and tapered-DCB (TDCB) test with similar and dissimilar material joints. Int. J. Adhes. Adhes. 2019, 93, 102328. [Google Scholar] [CrossRef]
  21. Zhang, Y.L.; Dong, J.X.; Zhang, Z.Q.; Sun, H.S.; Mei, G.H. Circle vector function applied to ray tracing in MCM for calculating effective emissivities of blackbody cavities. Infrared Phys. Technol. 2019, 104, 103104. [Google Scholar] [CrossRef]
  22. Juan, C.V.; Jorge, G.M. On-axis diffraction- limited design of bi-parabolic singlet lenses. Optik 2019, 193, 162970. [Google Scholar]
  23. Liu, Z.Y.; Li, W.B.; Wang, Y.; Qi, Y. Correction of keystone distortion in tilted imaging systems using a digital micro-mirror. Appl. Opt. 2019, 58, 5465–5471. [Google Scholar] [CrossRef]
  24. Haller, P.; Genge, B.; Duka, A.V. On the practical integration of anomaly detection techniques in industrial control applications. Int. J. Crit. Infrastruct. Prot. 2019, 24, 48–68. [Google Scholar] [CrossRef]
  25. Stockman, M.; Dwivedi, D.; Gentz, R.; Peisert, S. Detecting control system misbehavior by fingerprinting programmable logic controller functionality. Int. J. Crit. Infrastruct. Prot. 2019, 26, 100306. [Google Scholar] [CrossRef] [Green Version]
  26. Felicetti, L.; Sabatini, M.; Pisculli, A.; Gasbarri, P.; Palmerini, G.B. Adaptive thrust vector control during on-orbit servicing. In Proceedings of the AIAA SPACE 2014 Conference and Exposition, San Diego, CA, USA, 4–7 August 2014. [Google Scholar]
Figure 1. Schematic diagram of the overall structure of the infrared guided missile detection device (1-Main control box 2-Blackbody Control Box 3-Support substrate 4-Inclined support 5-Vertical beam 6-Rotate the target mold vertically 7-Lens substrate 8-lens).
Machines 09 00198 g001
Figure 2. Schematic diagram of the rotary swing mechanism (1-Blackbody 2-Pedestal 3-Carbon fiber tube 4-Axis of rotation 5-Rotating slip ring 6-Reducer fixing plate 7-reducer 8-Substrate 9-Slider 10-Motor 11-Limit block 12-Lamp holder 13-Tungsten filament bulb 14-Light bar).
Machines 09 00198 g002
Figure 3. Schematic diagram of the lens support (1-Aluminum bracket 2-Substrate 3-Cross bar 4-Fine-tuning slide 5-Level 6-Lens clamping mechanism 7-lens).
Machines 09 00198 g003
Figure 4. Optical path structure.
Machines 09 00198 g004
Figure 5. Light fan diagram.
Machines 09 00198 g005aMachines 09 00198 g005b
Figure 6. Network architecture of the control system.
Machines 09 00198 g006
Figure 7. Diagram of working optical system.
Machines 09 00198 g007
Figure 8. Stress cloud diagram of cantilever beam.
Machines 09 00198 g008
Figure 9. Displacement and deformation of cantilever beam in y direction.
Machines 09 00198 g009
Figure 10. Mechanical model diagram of a cantilever beam before loading.
Machines 09 00198 g010
Figure 11. Maximum rotation angle and deflection of a cantilever beam after loading.
Machines 09 00198 g011
Figure 12. Schematic diagram of the end position of the beam.
Machines 09 00198 g012
Figure 13. Simplified diagram of the position where the end of the beam contacts the supporting beam.
Machines 09 00198 g013
Figure 14. Schematic diagram of the rotating target simulator.
Machines 09 00198 g014
Figure 15. Kinematic coordinate system of the DOF of the rotating target simulator.
Machines 09 00198 g015
Figure 16. The form of geometric rays of coma.
Machines 09 00198 g016
Figure 17. Coma aberration.
Machines 09 00198 g017
Figure 18. Schematic diagram of coma analysis.
Machines 09 00198 g018
Figure 19. Schematic diagram of astigmatism analysis.
Machines 09 00198 g019
Figure 20. 3D view of the sagittal fan surface.
Machines 09 00198 g020
Figure 21. System spot diagram.
Machines 09 00198 g021
Figure 22. Noon 3D view.
Machines 09 00198 g022
Figure 23. 3D view of sagittal section.
Machines 09 00198 g023
Figure 24. MTF curve of diffraction in optical system.
Machines 09 00198 g024
Figure 25. Experimental platform system diagram.(1-Truss base; 2-Control box; 3-Truss; 4-Rotating target simulator).
Machines 09 00198 g025
Figure 26. Lens device diagram (1-Substrate 2-Bottom wheel 3-Aluminum bracket 4-lens).
Machines 09 00198 g026
Figure 27. (a) Swing 45° clockwise, (b) Swing 45° counterclockwise.
Machines 09 00198 g027
Figure 28. (a) Swing 90° clockwise, (b) Swing 90° counterclockwise.
Machines 09 00198 g028
Figure 29. (a) Swing 180° clockwise, (b) Swing 180° counterclockwise.
Machines 09 00198 g029
Figure 30. The method of collecting experimental data (1-Three-axis accelerometer 2-ARM microcontroller).
Machines 09 00198 g030
Figure 31. Swing curve at 15 °/s. (a) Swing angle 45°, (b) Swing angle 90°, (c) Swing angle 180°.
Machines 09 00198 g031
Figure 32. Swing curve at 30 °/s. (a) Swing angle 45°, (b) Swing angle 90°, (c) Swing angle 180°.
Machines 09 00198 g032
Figure 33. Spectrum pattern of random vibration screening.
Machines 09 00198 g033
Figure 34. Industrial computer reception results.
Machines 09 00198 g034
Table 1. Kinematic coordinate system parameters of infrared guided missile detection device. (θi: Take axis Zi as axis, the rotation angle from Xi−1 to Xi, and according to the right hand rule, the positive direction of Zi is positive; αi: Take axis Xi−1 as axis, the rotation angle from Zi−1 to Zi, and according to the right hand rule, the positive direction of Xi−1 is positive; ai−1: the distance from Zi−1 to Zi along the direction of axis Xi−1, where the positive direction of axis Xi−1 is positive; di: the distance from Xi−1 to Xi along the direction of axis Zi, where the positive direction of axis Zi is positive.).
Joint i θ i / rad α i 1 / rad a i 1 / mm d i / mm
1 θ 1 ( π / 2 ) 000
2 θ 2 ( π / 2 ) 0 a 1 ( l 1 ) 0
3 θ 3 ( 0 ) 0 a 2 ( l 2 ) 0
40 α 3 ( π / 2 ) 0 d 4 ( l 3 + l 4 )
Table 2. Table of vibration environment parameters in X and Y directions.
DirectionFrequency Range (Hz)Total Square Root Acceleration (g)Spectral Density (g2/Hz)Vibration Time
(s)
Y20~200050.02812
X20~20007.60.062812
Table 3. Parameter table of vibration strength test.
Test Conditions
Frequency
(Hz)
Amplitude
(mm)
Acceleration
(m/s2)
Test Duration (min)
X
axis
Y
axis
Z
axis
(10 ± 2)(2.0 ± 0.3)
(20 ± 2)(1.0 ± 0.15)
(30 ± 2)(0.8 ± 0.12)
(40 ± 2)(0.6 ± 0.19)
(50 ± 2)(0.4 ± 0.06) (10 ± 1)55
(60 ± 2)(0.3 ± 0.04)
(80 ± 2) (40 ± 8)
(100 ± 2)
(120 ± 2)
Publisher’s Note: MDPI stays neutral with regard to jurisdictional claims in published maps and institutional affiliations.

