
Fault Detection and Diagnosis for Plasticizing Process of Single-Base Gun Propellant Using Mutual Information Weighted MPCA under Limited Batch Samples Modelling

 ,
,
Abstract
:1. Introduction
2. Basic Theories and Methods
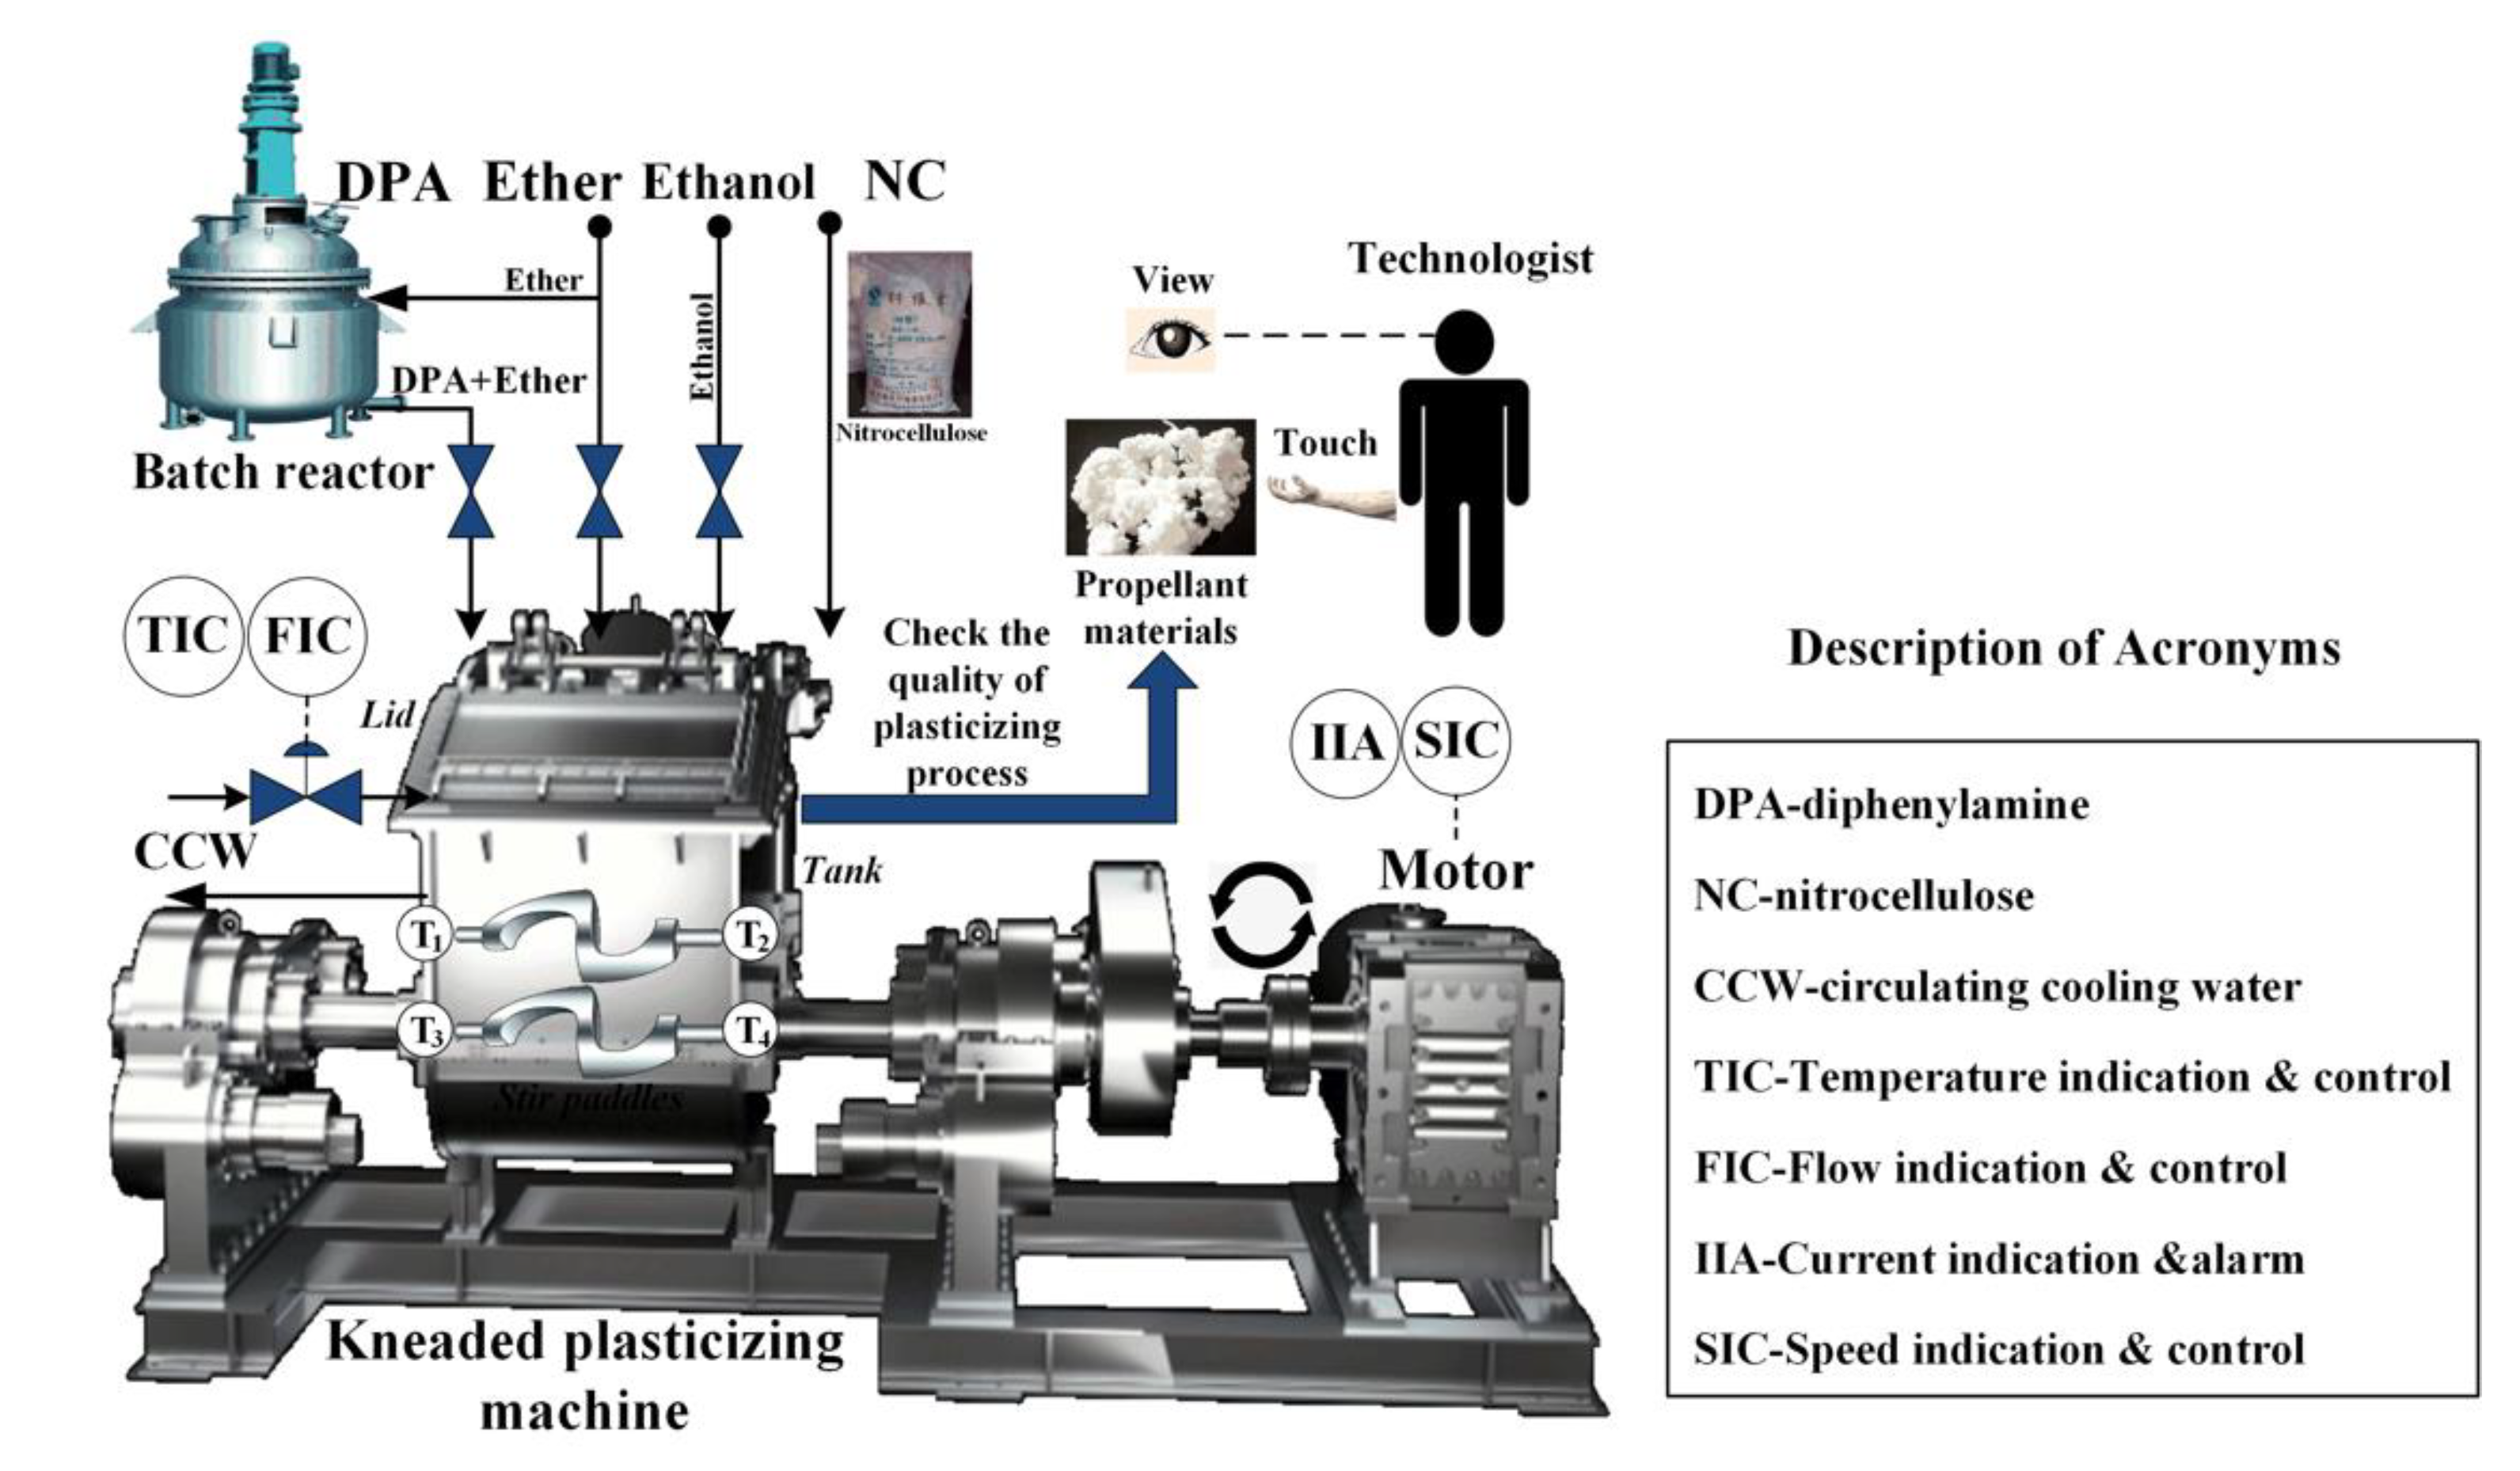
2.1. The Plasticizing Process of Single-Base Gun Propellant and Its Batch Process Attribute
2.2. Process Monitoring Method Based on Multiway Principal Componet Analysis (MPCA)
2.3. Mutual Information and Mutual Information Principal Component Analysis (MI-PCA)
3. Normalized Mutual Information Weighted Multiway Principal Component Analysis (NMI-WMPCA) Method
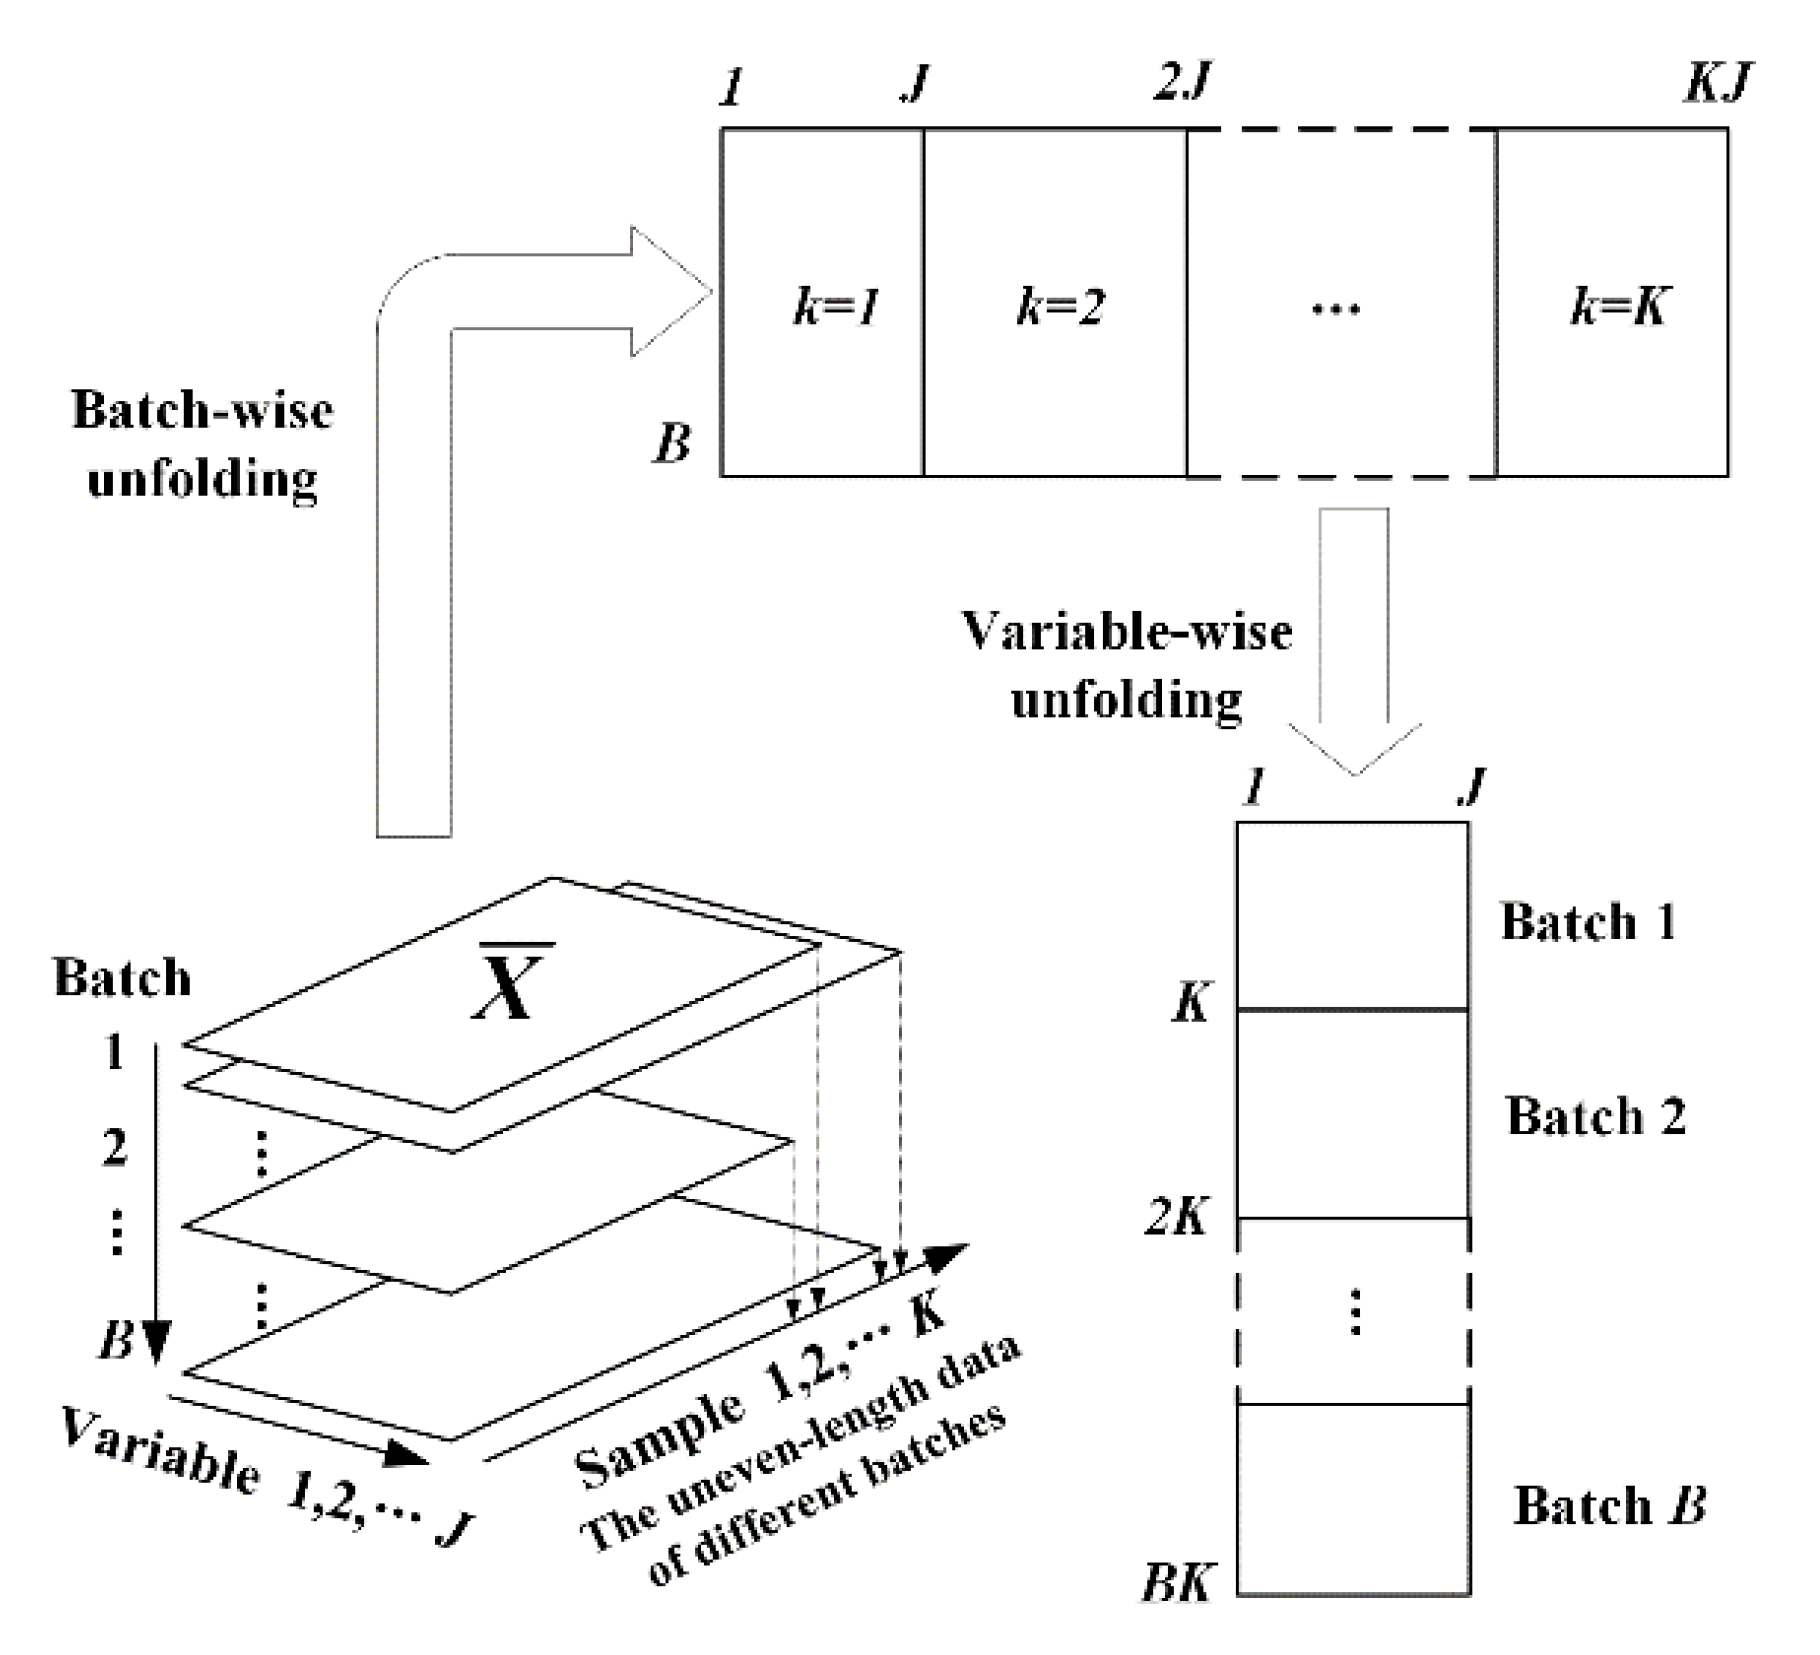
3.1. Two-Stage Batch Data Unfolding Method of the Plasticizing Process
3.2. Weighted Correction Modelling Based on Normalized Mutual Information
3.3. Multi-Model Information Fusion Strategy Based on Bayesian Inference
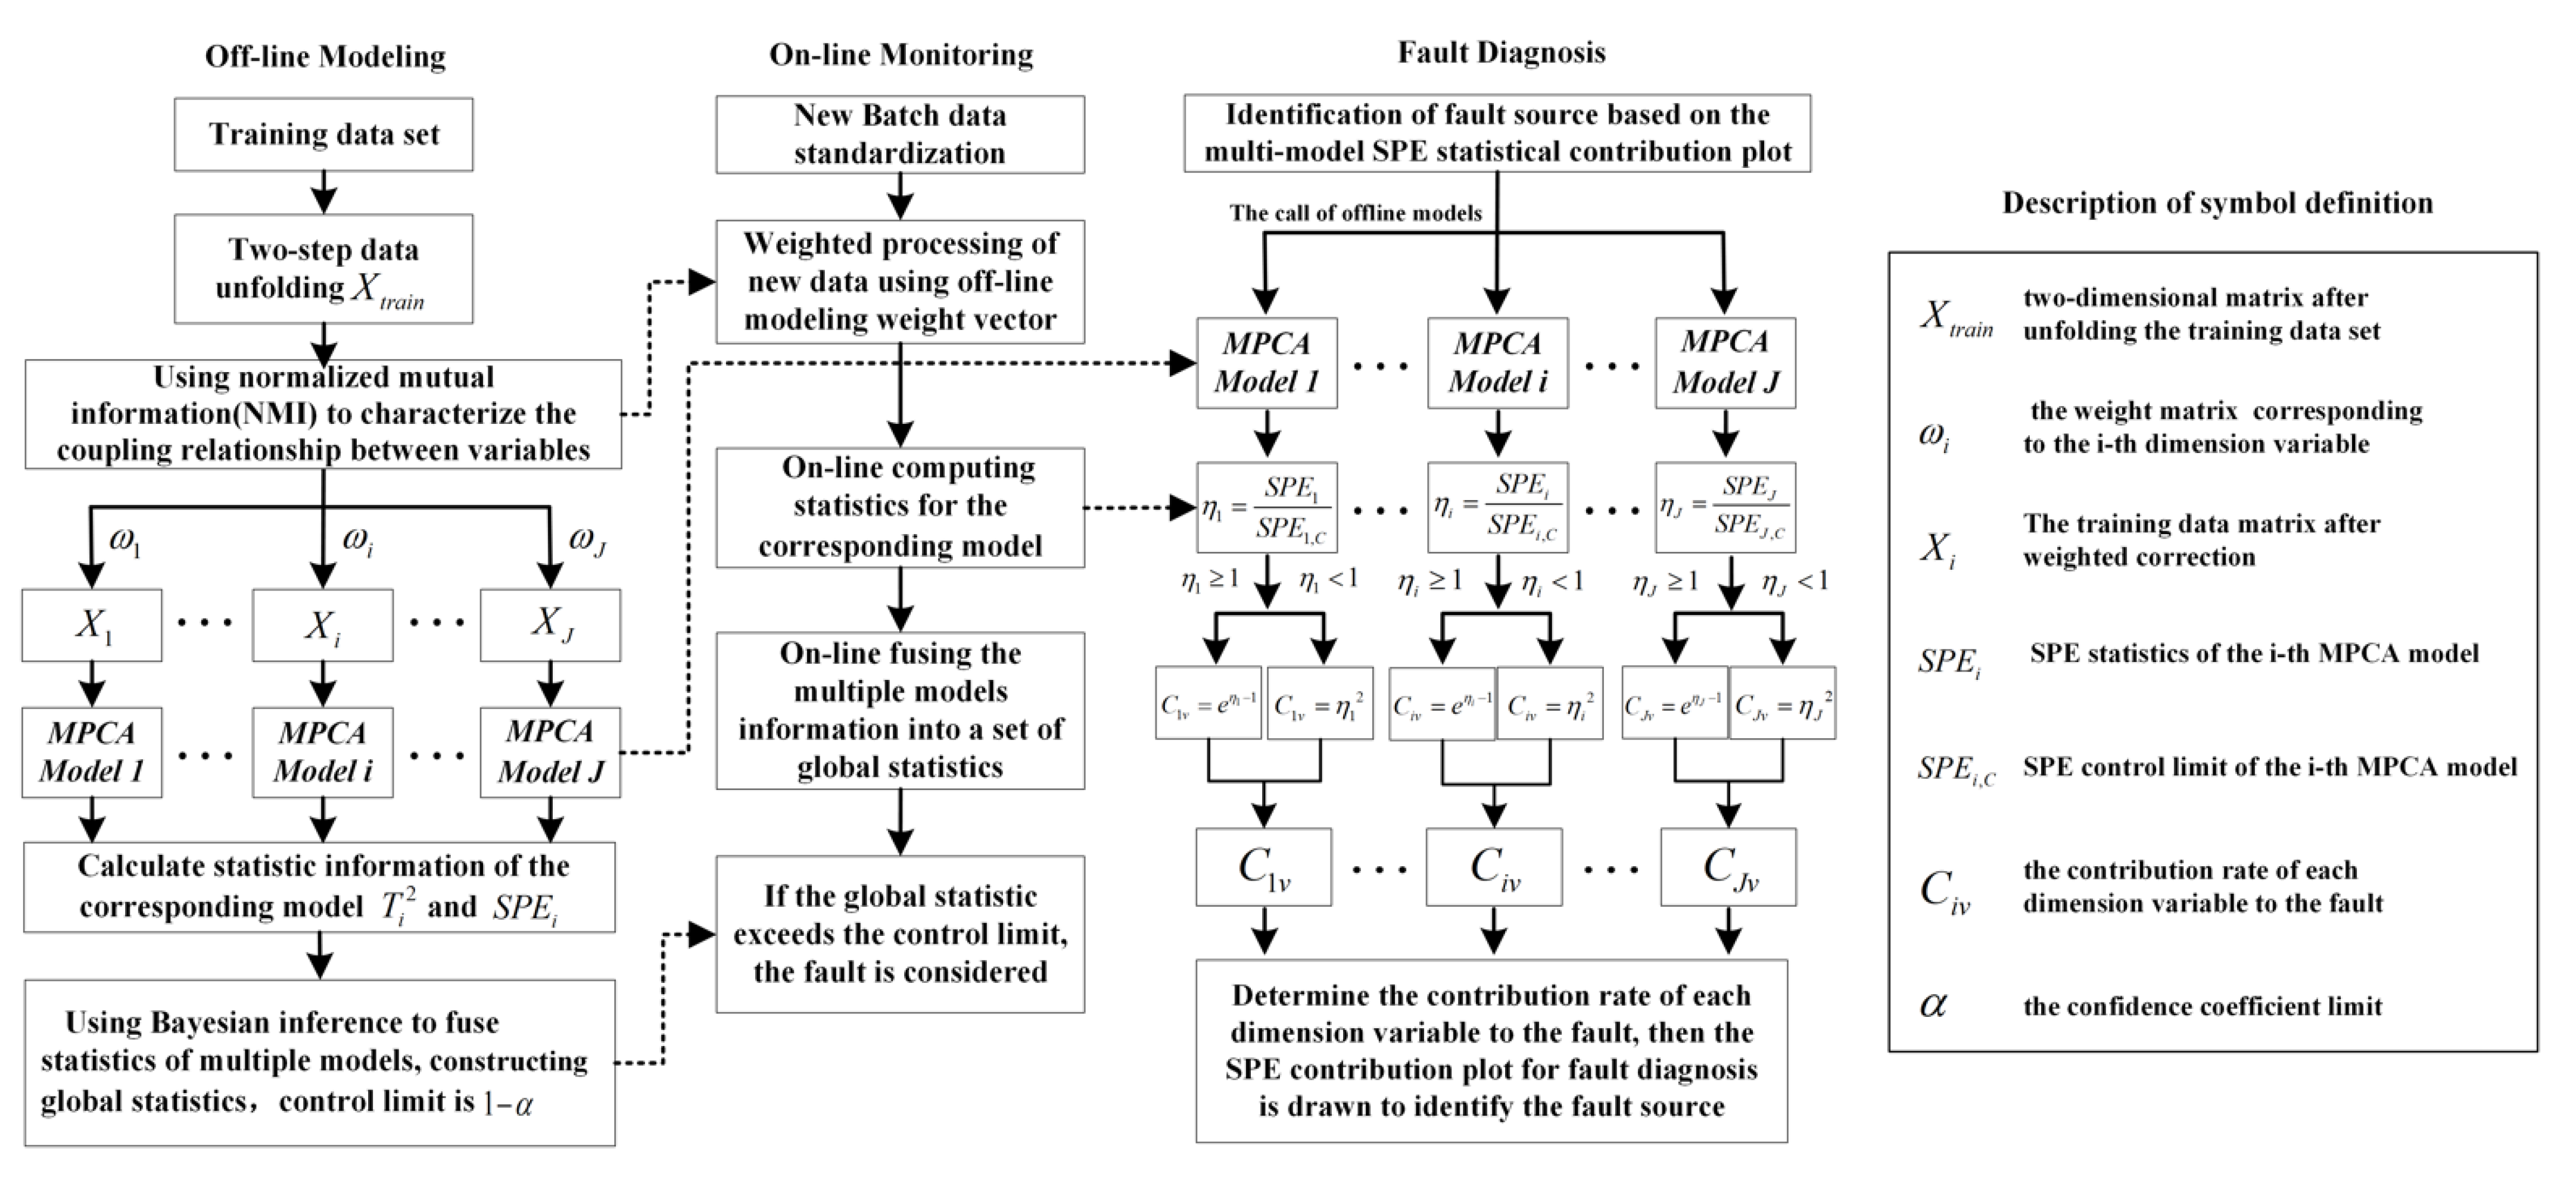
4. Fault Detection and Diagnosis Method Based on NMI-WMPCA
4.1. Establish the NMI-WMPCA Model under Normal Working Conditions (Offline Modelling)
- (1)
- Three-dimensional data unfolding: collect batch data of the plasticization process under normal working conditions as a training data set, and unfold the three-dimensional data set according to the method proposed in this article to obtain ;
- (2)
- Description of coupling relationship: set the initial value of to 1, for the -th dimension process variable , calculate the normalized mutual information value between it and each dimension variable in ;
- (3)
- Weighted correction: determine the weight matrix corresponding to the -th dimension variable according to the calculated normalized mutual information value. The formula is: , and the unfolded data matrix is weighted to obtain the training data matrix , which reflects the characteristics of the correlation difference between this dimension variable and other dimensions;
- (4)
- Model establishment: establish a condition monitoring model based on the MPCA algorithm for , namely , and calculate the and statistics and their control limits;
- (5)
- Set , repeat steps (2) to (4) to obtain J weighted data sets , and establish the corresponding J MPCA state monitoring models;
- (6)
- Determine the global statistics and constructed by Bayesian inference based on the confidence level α, and the control limit is .
4.2. Online Fault Monitoring of NMI-WMPCA Model
- (1)
- Online monitoring of the new batch process data , using the mean and standard deviation of the modelling data to standardize the new data;
- (2)
- Use the weight vector obtained during modelling to perform weighted fusion processing for the new batch data, namely , to obtain the corresponding ;
- (3)
- Call the model information of each MPCA separately, and calculate the and statistics of under the corresponding MPCA model online;
- (4)
- Construct new global statistics and through Bayesian inference, and fuse the statistics information of the J groups MPCA models into a set of probabilistic indicators. If the control limit is exceeded, the fault occurs in the process.
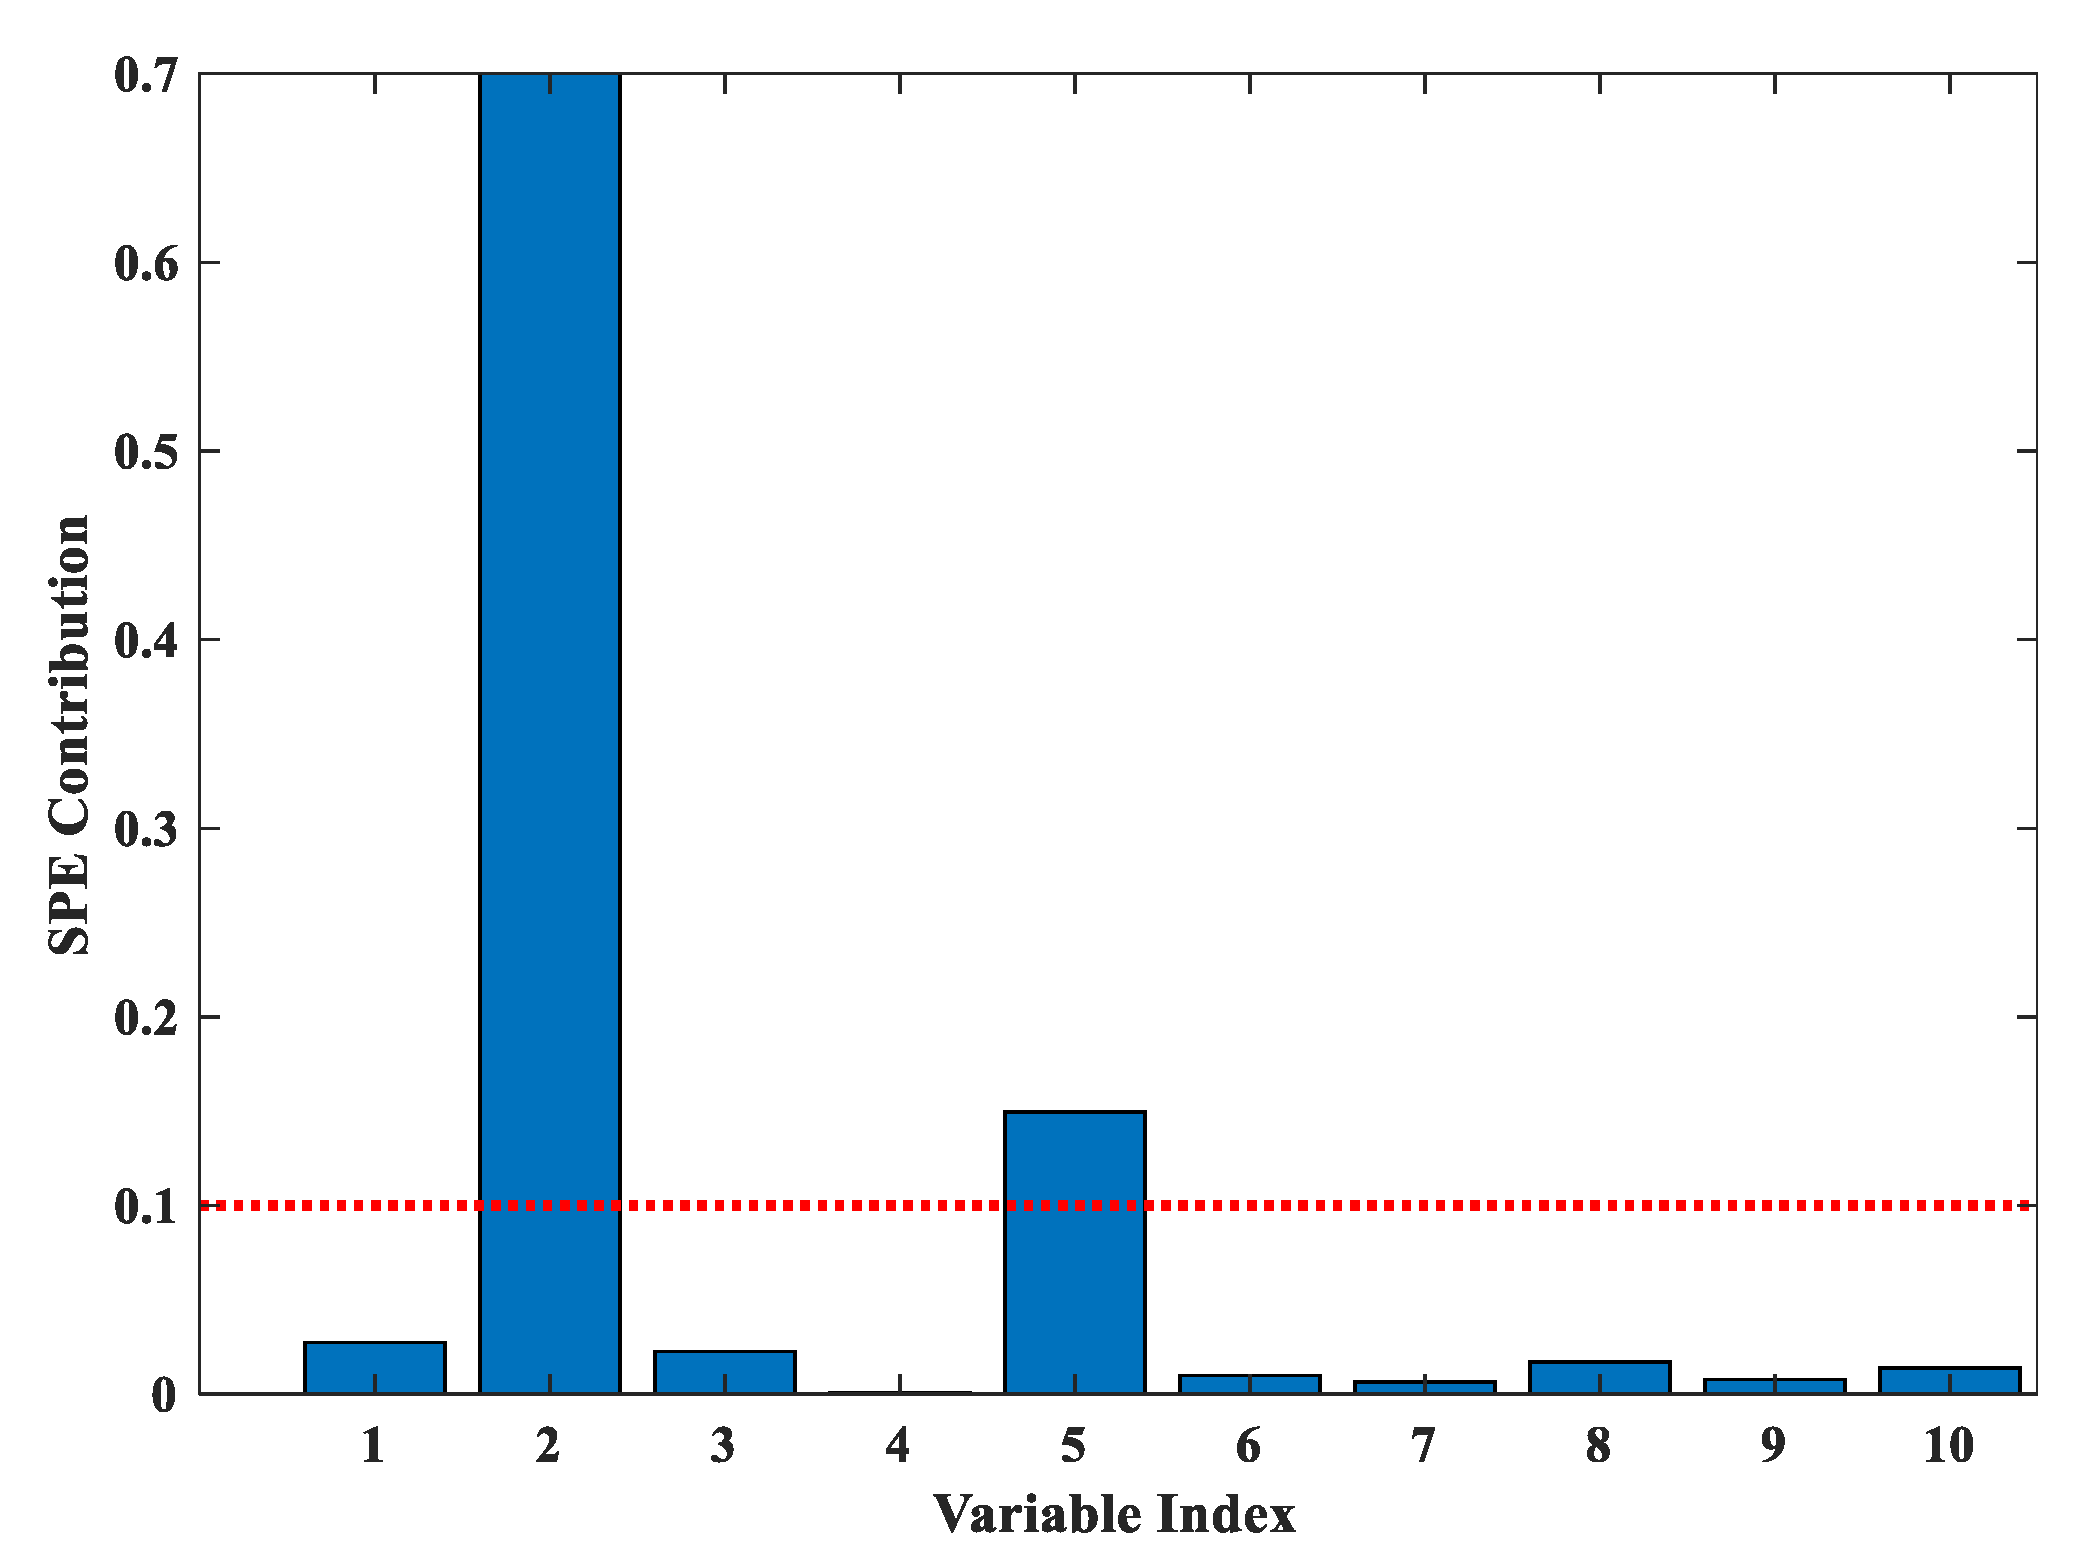
4.3. Fault Diagnosis Strategy Based on NMI-WMPCA Model
5. Experiments and Analysis
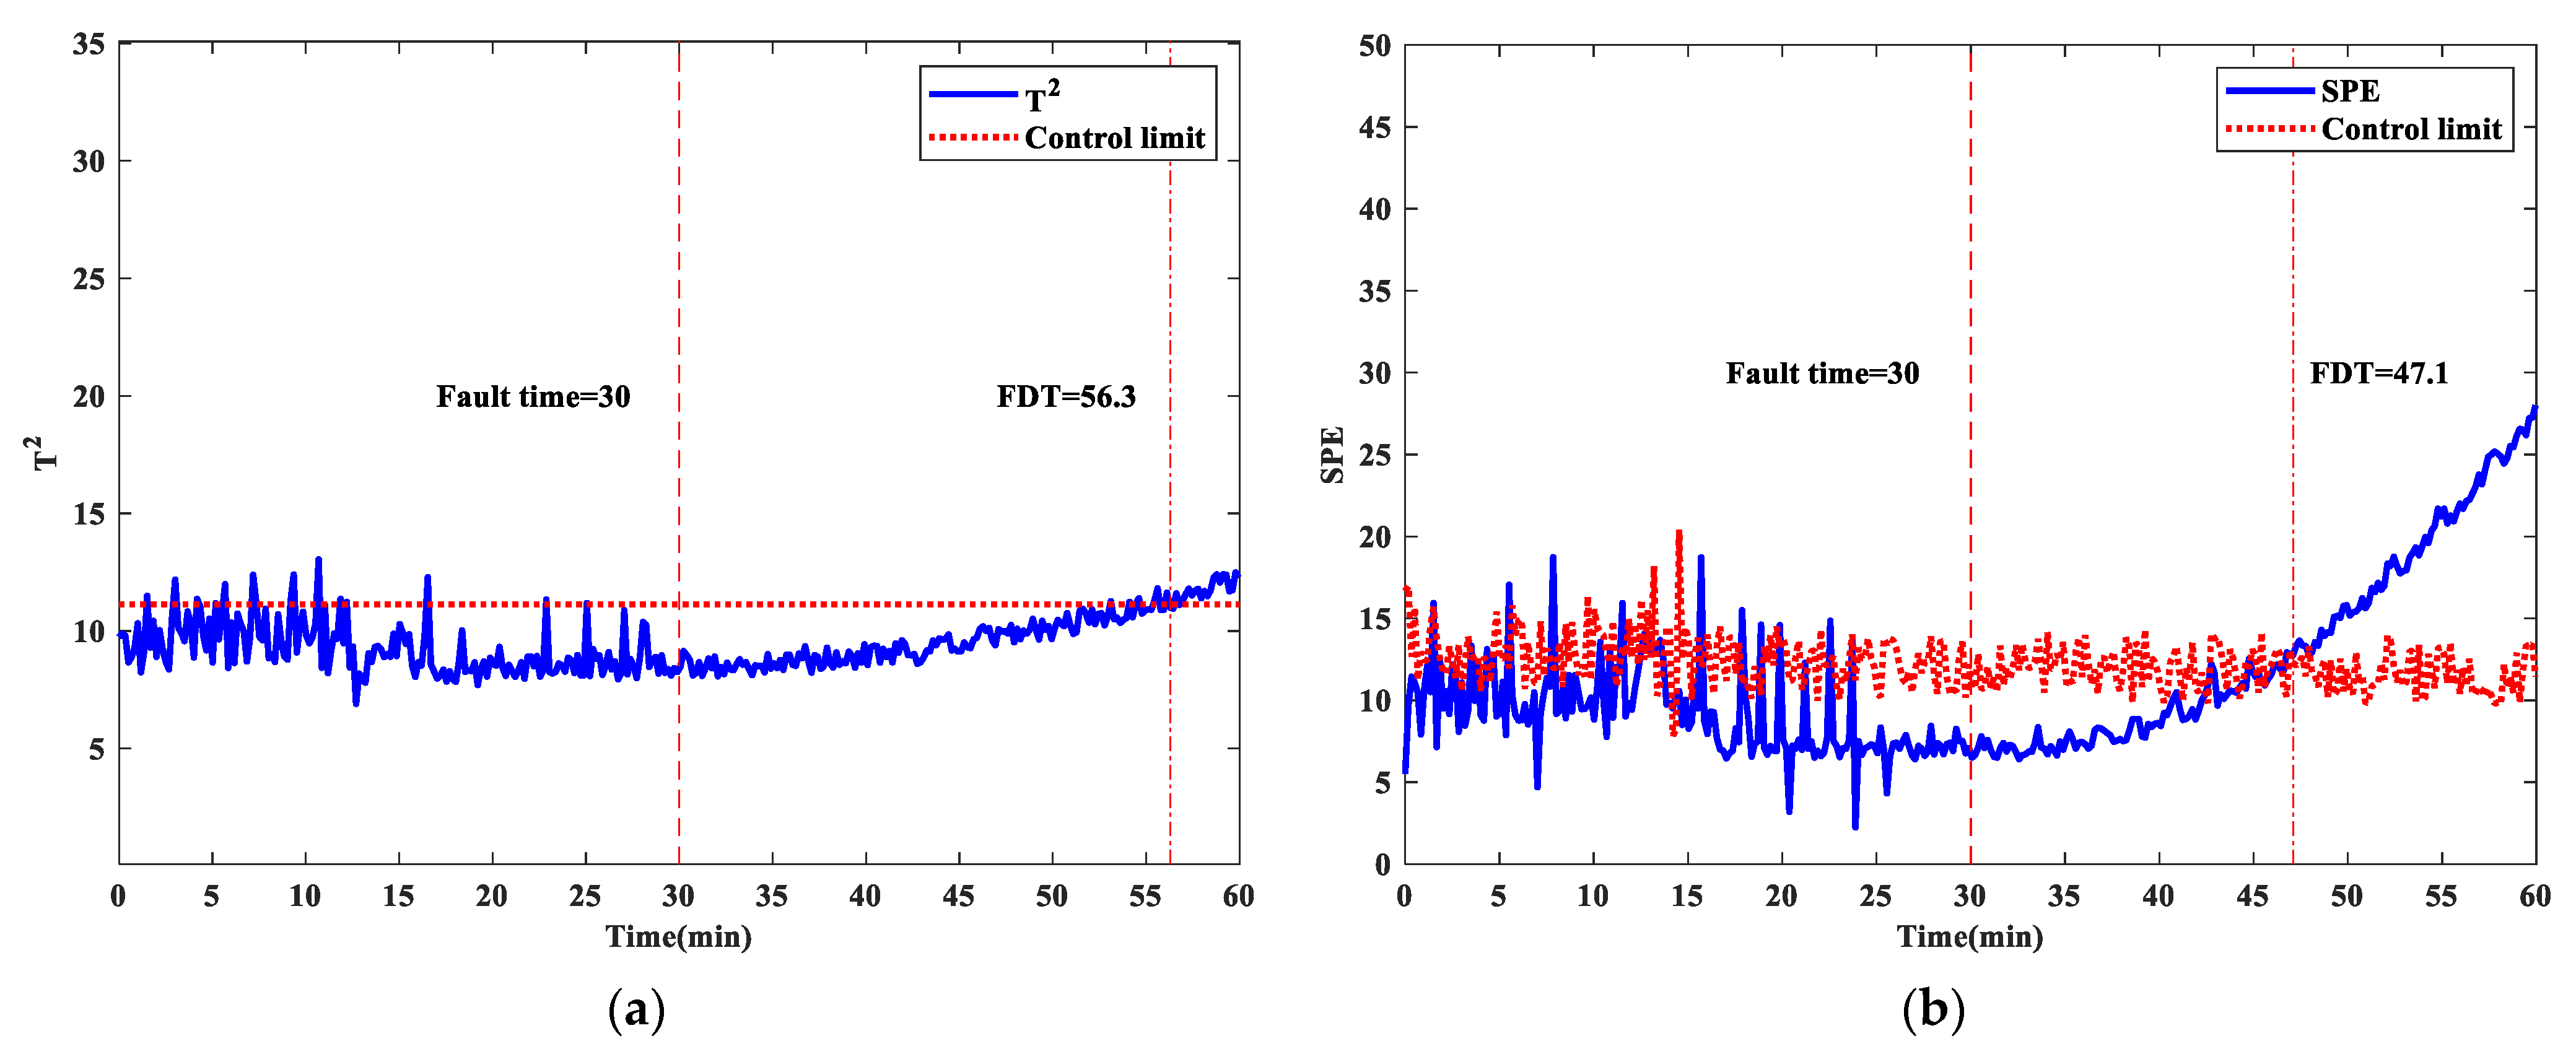
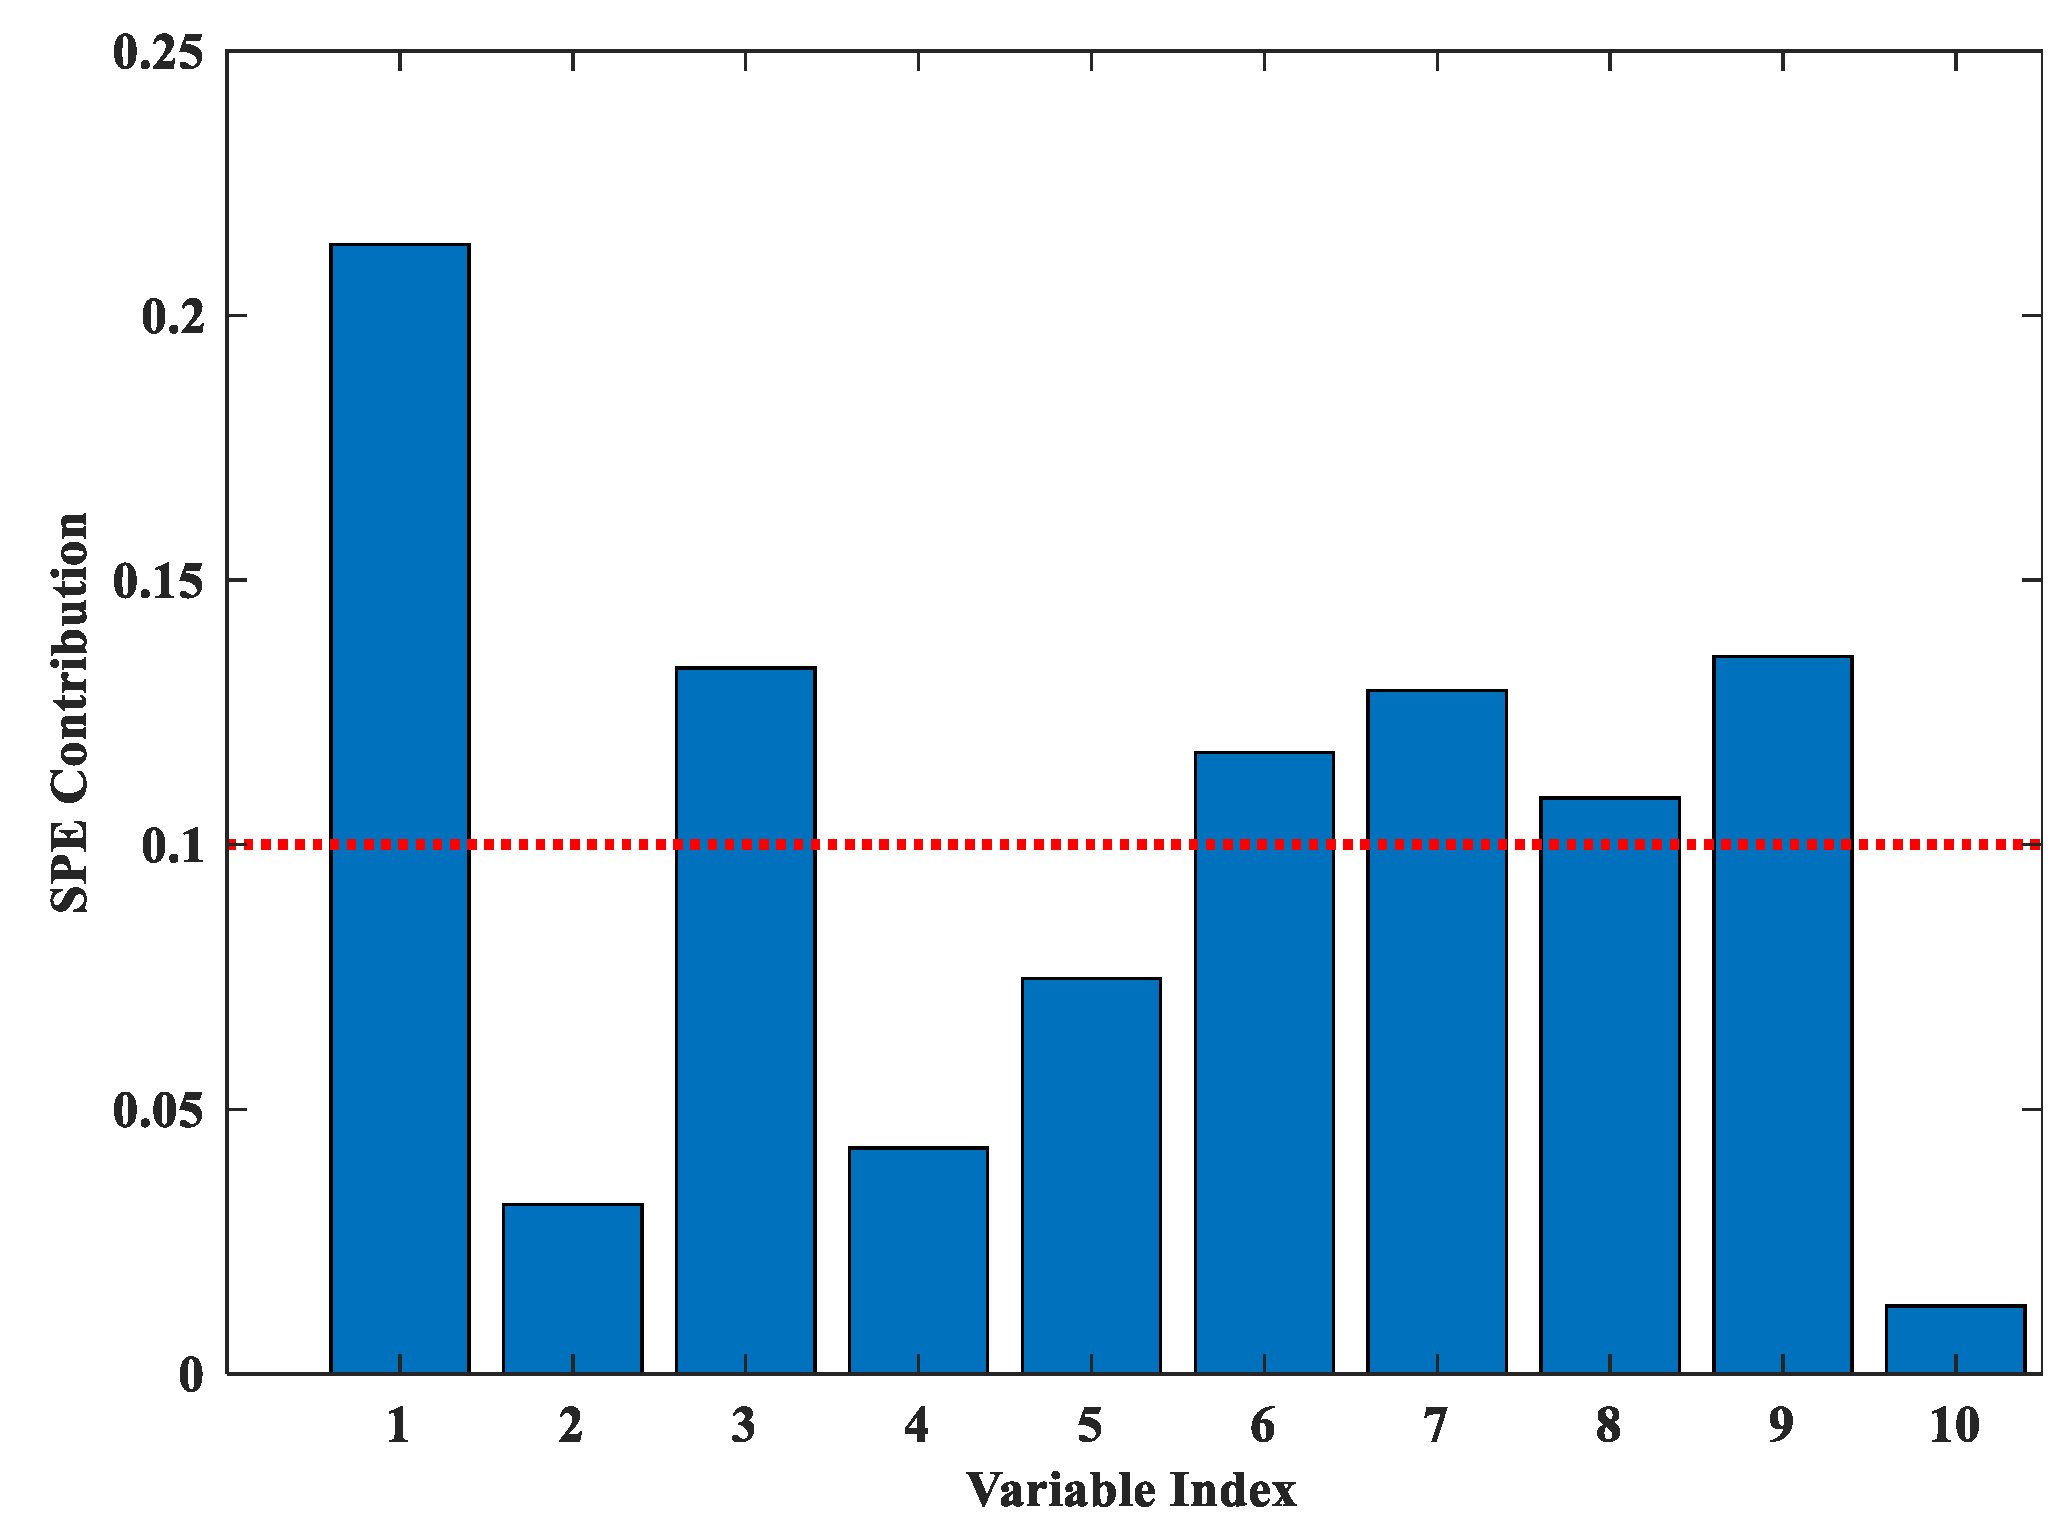
5.1. Fault Detection Results and Analysis of the Process Variable
5.2. Monitoring Results and Analysis of the Abnormal Operating Conditions
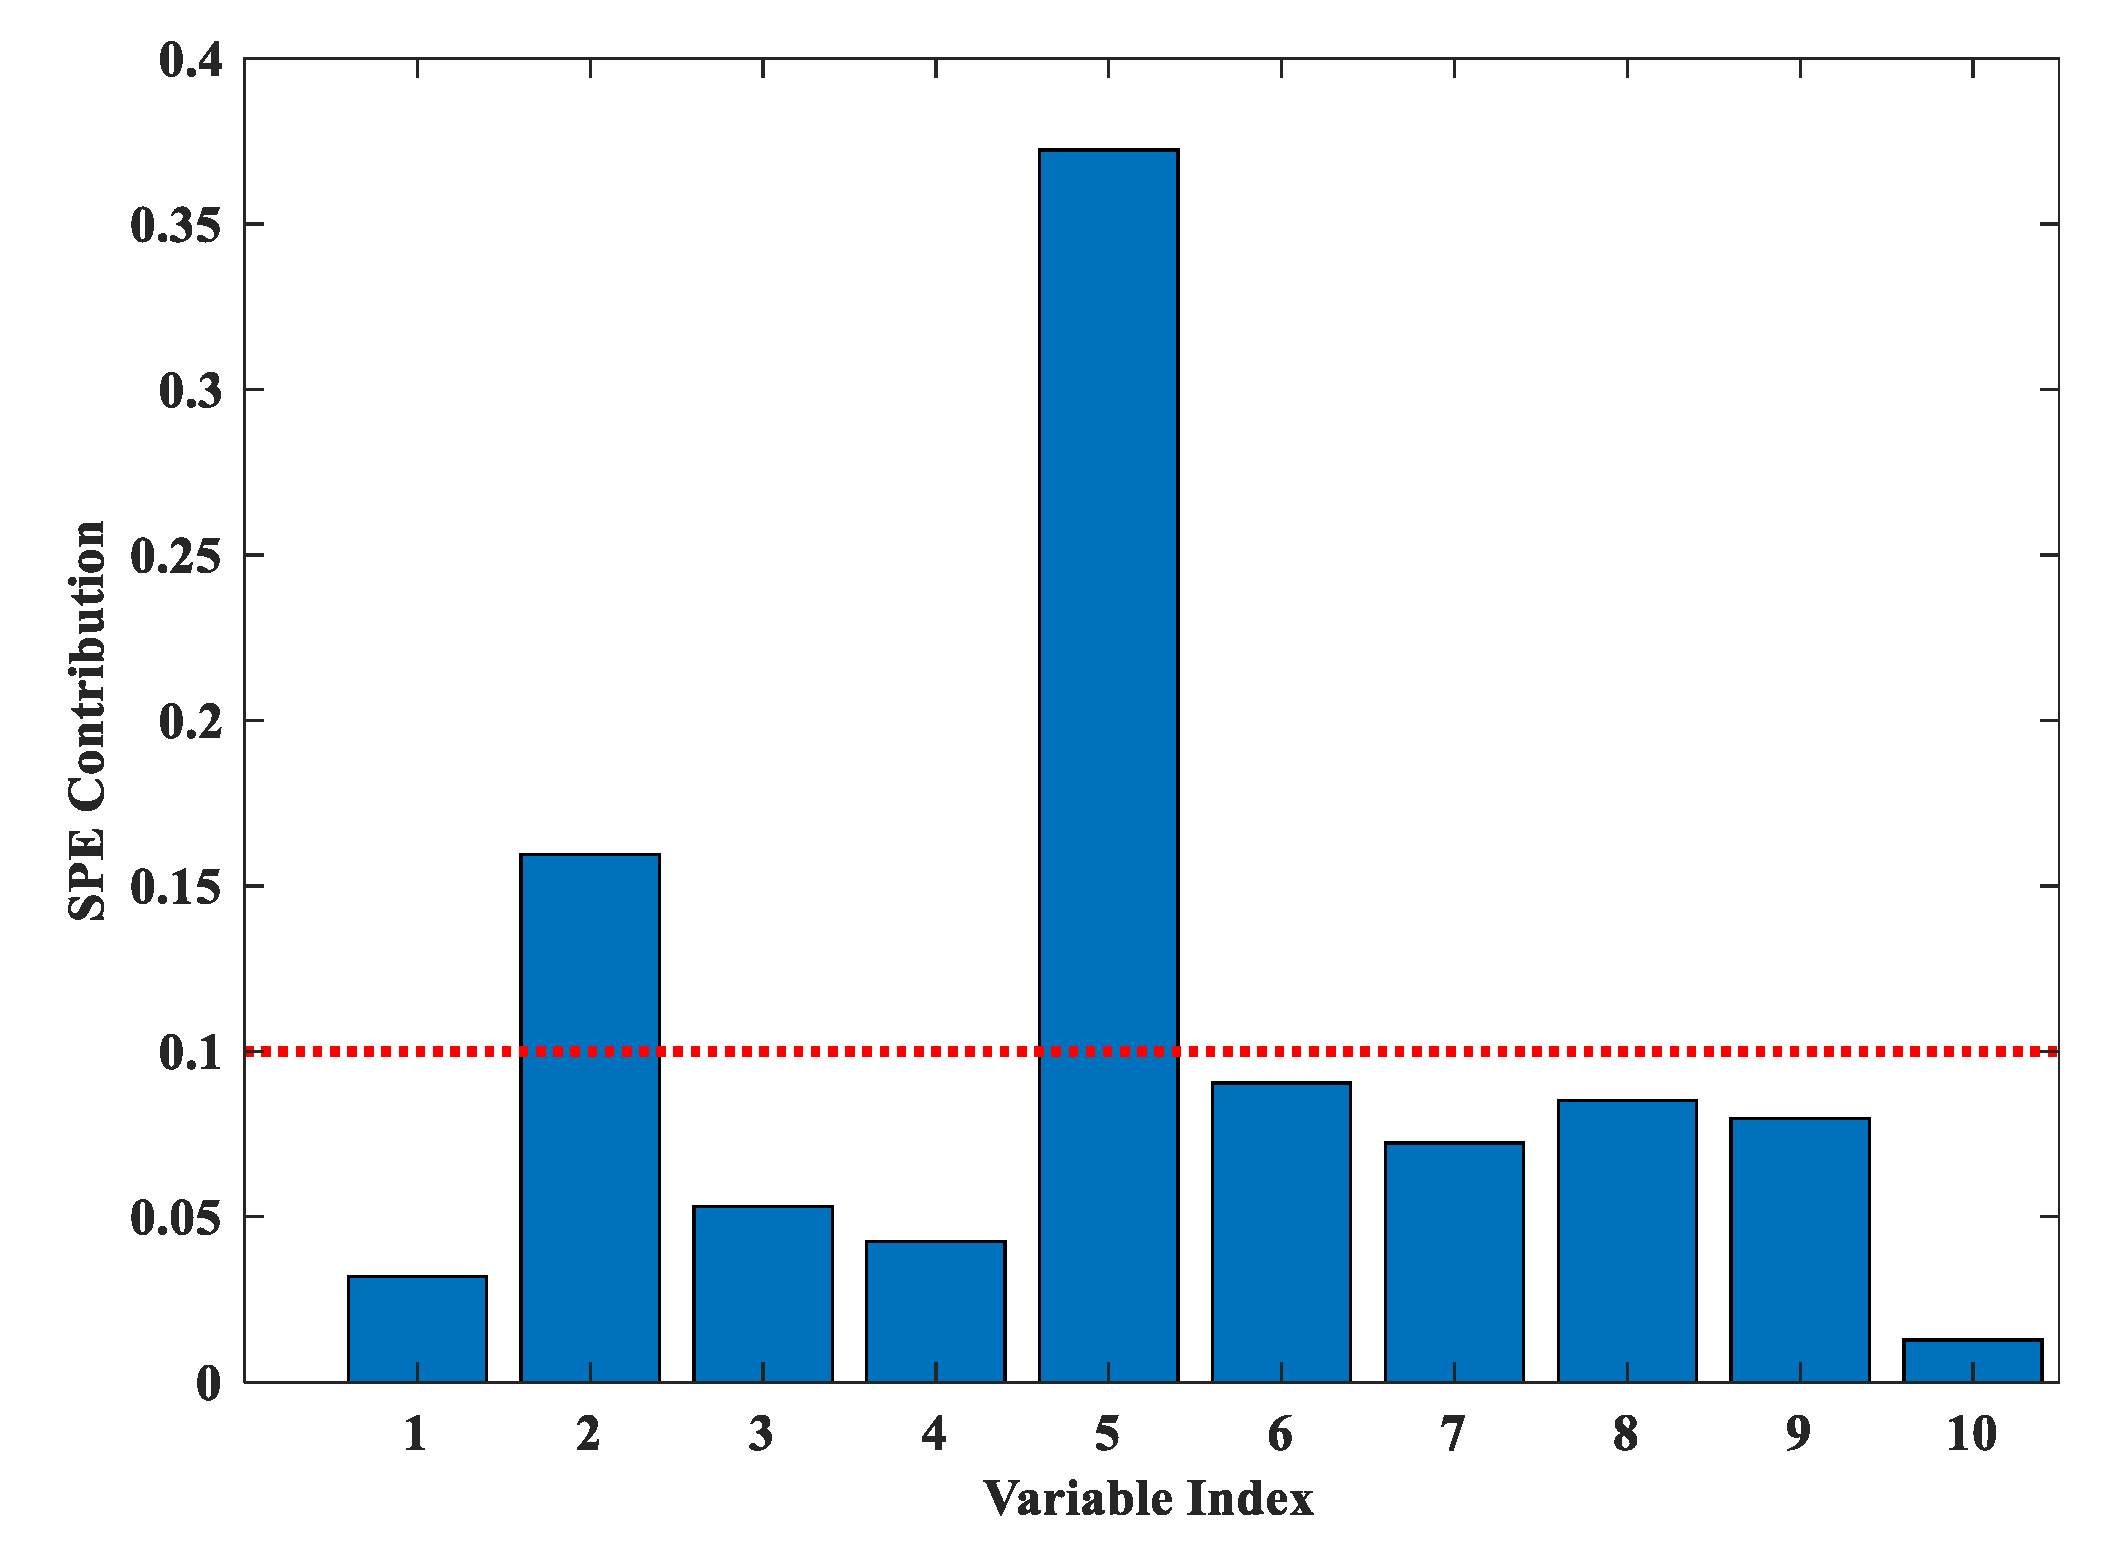
5.2.1. Monitoring Results and Analysis of Raw Material Mismatch
5.2.2. Monitoring Results and Analysis of Abnormal Operation of the Stirring Motor
5.3. Comparison and Analysis of Monitoring Results between Limited and Sufficient Batch Samples
5.4. Fault Diagnosis Results and Analysis Based on NMI-WMPCA
6. Conclusions
Author Contributions
Funding
Institutional Review Board Statement
Informed Consent Statement
Data Availability Statement
Conflicts of Interest
References
- Jiang, Q.C.; Yan, X.F.; Huang, B. Review and Perspectives of Data-Driven Distributed Monitoring for Industrial Plant-Wide Processes. Ind. Eng. Chem. Res. 2019, 58, 12899–12912. [Google Scholar] [CrossRef]
- Venkatasubramanian, V. The promise of artificial intelligence in chemical engineering: Is it here, finally? AIChE J. 2019, 65, 466–478. [Google Scholar] [CrossRef]
- Gajjar, S.; Kulahci, M.; Palazoglu, A. Real-time fault detection and diagnosis using sparse principal component analysis. J. Process Control 2018, 67, 112–128. [Google Scholar] [CrossRef]
- Reis, M.S.; Gins, G. Industrial Process Monitoring in the Big Data/Industry 4.0 Era: From Detection, to Diagnosis, to Prognosis. Processes 2017, 5, 35. [Google Scholar] [CrossRef] [Green Version]
- Boulkadid, K.M.; Lefebvre, M.H.; Jeunieau, L.; Dejeaifve, A. Mechanical and Ballistic Properties of Spherical Single Base Gun Propellant. Cent. Eur. J. Energetic Mater. 2017, 14, 90–104. [Google Scholar] [CrossRef]
- Yu, H.; Li, Z.; Liu, B.; Wei, L.; Zheng, S.; Han, B. Study on the Preparation and Properties of Modified Single-base Gun Propellant with High Nitrogen Content. Chin. J. Explos. Propellants 2018, 41, 632–636. [Google Scholar]
- Trebinski, R.; Janiszewski, J.; Leciejewski, Z.; Surma, Z.; Kaminska, K. On Influence of Mechanical Properties of Gun Propellants on Their Ballistic Characteristics Determined in Closed Vessel Tests. Materials 2020, 13, 3243. [Google Scholar] [CrossRef]
- Wang, Y.; Yang, H.; Han, J.; Gao, K. Effect of DGTN Content on Mechanical and Thermal Properties of Modified Single-based Gun Propellant Containing NQ and RDX. Propellants Explos. Pyrotech. 2020, 45, 128–135. [Google Scholar] [CrossRef]
- Wang, Y.-Y.; Deng, G.-D.; Xu, J.; Wang, Z.-Q.; Gu, Q.; Zeng, J. A Rapid Determination Method of Deterrent Component Content in Single-base Gun Propellant. Huozhayao Xuebao Chin. J. Explos. Propellants 2018, 41, 408–413. [Google Scholar] [CrossRef]
- Zhao, Q.-L.; Zhou, H.-W.; Chen, C.-L.; He, Y.; Zhang, W.-B.; Guo, L.-B.; Chen, G.; Yang, Q. Prediction Methodology of Function Failure Threshold Value of Deterred Gun Propellant for Firearms. Huozhayao Xuebao Chin. J. Explos. Propellants 2021, 44, 101–105. [Google Scholar] [CrossRef]
- Zeman, S.; Jungova, M. Sensitivity and Performance of Energetic Materials. Propellants Explos. Pyrotech. 2016, 41, 426–451. [Google Scholar] [CrossRef] [Green Version]
- Alauddin, M.; Khan, F.; Imtiaz, S.; Ahmed, S. A Bibliometric Review and Analysis of Data-Driven Fault Detection and Diagnosis Methods for Process Systems. Ind. Eng. Chem. Res. 2018, 57, 10719–10735. [Google Scholar] [CrossRef]
- Apsemidis, A.; Psarakis, S.; Moguerza, J.M. A review of machine learning kernel methods in statistical process monitoring. Comput. Ind. Eng. 2020, 142, 12. [Google Scholar] [CrossRef]
- Luwei, K.C.; Yunusa-Kaltungo, A.; Sha’aban, Y.A. Integrated Fault Detection Framework for Classifying Rotating Machine Faults Using Frequency Domain Data Fusion and Artificial Neural Networks. Machines 2018, 6, 59. [Google Scholar] [CrossRef] [Green Version]
- Astolfi, D. Perspectives on SCADA Data Analysis Methods for Multivariate Wind Turbine Power Curve Modeling. Machines 2021, 9, 100. [Google Scholar] [CrossRef]
- Gao, Z.; Liu, X. An Overview on Fault Diagnosis, Prognosis and Resilient Control for Wind Turbine Systems. Processes 2021, 9, 300. [Google Scholar] [CrossRef]
- Gao, Z.; Chen, M.Z.Q.; Zhang, D. Special Issue on “Advances in Condition Monitoring, Optimization and Control for Complex Industrial Processes”. Processes 2021, 9, 664. [Google Scholar] [CrossRef]
- Dong, Y.; Qin, S.J. A novel dynamic PCA algorithm for dynamic data modeling and process monitoring. J. Process Control 2018, 67, 1–11. [Google Scholar] [CrossRef]
- Park, Y.J.; Fan, S.K.S.; Hsu, C.Y. A Review on Fault Detection and Process Diagnostics in Industrial Processes. Processes 2020, 8, 1123. [Google Scholar] [CrossRef]
- Wang, R.; Edgar, T.F.; Baldea, M.; Nixon, M.; Wojsznis, W.; Dunia, R. A geometric method for batch data visualization, process monitoring and fault detection. J. Process Control 2018, 67, 197–205. [Google Scholar] [CrossRef]
- Zhang, L.; E, D. Car dumper hydraulic system state monitoring and fault diagnosis based on adaptive MPCA. Zhendong yu Chongji J. Vib. Shock. 2018, 37, 245–250, 256. [Google Scholar] [CrossRef]
- Peres, F.A.P.; Peres, T.N.; Fogliatto, F.S.; Anzanello, M.J. Fault detection in batch processes through variable selection integrated to multiway principal component analysis. J. Process Control 2019, 80, 223–234. [Google Scholar] [CrossRef]
- Zhou, J.; Huang, F.; Shen, W.; Liu, Z.; Corriou, J.-P.; Seferlis, P. Sub-period division strategies combined with multiway principle component analysis for fault diagnosis on sequence batch reactor of wastewater treatment process in paper mill. Process. Saf. Environ. Prot. 2021, 146, 9–19. [Google Scholar] [CrossRef]
- Alcala, C.F.; Qin, S.J. Analysis and generalization of fault diagnosis methods for process monitoring. J. Process Control 2011, 21, 322–330. [Google Scholar] [CrossRef]
- Wang, Y.J.; Sun, F.M.; Jia, M.X. Online monitoring method for multiple operating batch processes based on local collection standardization and multi-model dynamic PCA. Can. J. Chem. Eng. 2016, 94, 1965–1976. [Google Scholar] [CrossRef]
- Huang, J.P.; Yan, X.F. Relevant and independent multi-block approach for plant-wide process and quality-related monitoring based on KPCA and SVDD. ISA Trans. 2018, 73, 257–267. [Google Scholar] [CrossRef] [PubMed]
- Zhang, S.M.; Wang, F.L.; Zhao, L.P.; Wang, S.; Chang, Y.Q. A Novel Strategy of the Data Characteristics Test for Selecting a Process Monitoring Method Automatically. Ind. Eng. Chem. Res. 2016, 55, 1642–1654. [Google Scholar] [CrossRef]
- Yu, W.K.; Zhao, C.H. Robust Monitoring and Fault Isolation of Nonlinear Industrial Processes Using Denoising Autoencoder and Elastic Net. IEEE Trans. Control Syst. Technol. 2020, 28, 1083–1091. [Google Scholar] [CrossRef]
- Pilario, K.E.; Shafiee, M.; Cao, Y.; Lao, L.; Yang, S.-H. A Review of Kernel Methods for Feature Extraction in Nonlinear Process Monitoring. Processes 2020, 8, 24. [Google Scholar] [CrossRef] [Green Version]
- Tong, C.; Shi, X. Mutual information based PCA algorithm with application in process monitoring. Huagong Xuebao CIESC J. 2015, 66, 4101–4106. [Google Scholar] [CrossRef]
- Jiang, Q.C.; Yan, X.F. Plant-wide process monitoring based on mutual information-multiblock principal component analysis. ISA Trans. 2014, 53, 1516–1527. [Google Scholar] [CrossRef]
- Tong, C.; Lan, T.; Shi, X. Fault detection by decentralized dynamic PCA algorithm on mutual information. Huagong Xuebao CIESC J. 2016, 67, 4317–4323. [Google Scholar] [CrossRef]
- Huang, J.P.; Yan, X.F. Quality Relevant and Independent Two Block Monitoring Based on Mutual Information and KPCA. IEEE Trans. Ind. Electron. 2017, 64, 6518–6527. [Google Scholar] [CrossRef]
- Mori, L.; Yu, J. Maximized mutual information based non-gaussian subspace projection method for quality relevant process monitoring and fault detection. In Proceedings of the 52nd IEEE Conference on Decision and Control, Florence, Italy, 10–13 December 2013; pp. 4361–4366. [Google Scholar]
- Aljunaid, M.; Tao, Y.; Shi, H. A Novel Mutual Information and Partial Least Squares Approach for Quality-Related and Quality-Unrelated Fault Detection. Processes 2021, 9, 166. [Google Scholar] [CrossRef]
- Ge, Z.; Song, Z. Distributed PCA model for plant-wide process monitoring. Ind. Eng. Chem. Res. 2013, 52, 1947–1957. [Google Scholar] [CrossRef]
- Tong, C.D.; Lan, T.; Shi, X.H. Fault detection and diagnosis of dynamic processes using weighted dynamic decentralized PCA approach. Chemom Intell. Lab. Syst. 2017, 161, 34–42. [Google Scholar] [CrossRef]
- Jiang, Q.C.; Yan, X.F.; Huang, B.A. Performance-Driven Distributed PCA Process Monitoring Based on Fault-Relevant Variable Selection and Bayesian Inference. IEEE Trans. Ind. Electron. 2016, 63, 377–386. [Google Scholar] [CrossRef]
- Zhao, C.H. Phase analysis and statistical modeling with limited batches for multimode and multiphase process monitoring. J. Process Control 2014, 24, 856–870. [Google Scholar] [CrossRef]
- Pan, S.J.; Yang, Q. A Survey on Transfer Learning. IEEE Trans. Knowl. Data Eng. 2010, 22, 1345–1359. [Google Scholar] [CrossRef]
- Wang, S.; Wang, D.; Kong, D.; Wang, J.; Li, W.; Zhou, S. Few-Shot Rolling Bearing Fault Diagnosis with Metric-Based Meta Learning. Sensors 2020, 20, 6437. [Google Scholar] [CrossRef] [PubMed]
- Lu, J.Y.; Cao, Z.X.; Zhao, C.H.; Gao, F.R. 110th Anniversary: An Overview on Learning-Based Model Predictive Control for Batch Processes. Ind. Eng. Chem. Res. 2019, 58, 17164–17173. [Google Scholar] [CrossRef]
- Shi, K.; Liu, Y.; Zhang, Z.; Yu, Q.; Zhang, Q. Constructing a Method for an Evaluation Index System Based on Graph Distance Classification and Principal Component Analysis. Adv. Mater. Sci. Eng. 2019, 2019, 6015754. [Google Scholar] [CrossRef] [Green Version]
- Zhang, H.Y.; Tian, X.M.; Deng, X.G. Batch Process Monitoring Based on Multiway Global Preserving Kernel Slow Feature Analysis. IEEE Access 2017, 5, 2696–2710. [Google Scholar] [CrossRef]
- Kammammettu, S.; Li, Z. Change point and fault detection using Kantorovich Distance. J. Process Control 2019, 80, 41–59. [Google Scholar] [CrossRef]
- Qin, Y.; Zhao, C.H.; Wang, X.Z.; Gao, F.R. Subspace decomposition and critical phase selection based cumulative quality analysis for multiphase batch processes. Chem. Eng. Sci. 2017, 166, 130–143. [Google Scholar] [CrossRef] [Green Version]
- Li, G.; Qin, S.J. Comparative study on monitoring schemes for non-Gaussian distributed processes. J. Process Control 2018, 67, 69–82. [Google Scholar] [CrossRef]
- Wang, K.; Liu, J.; Wang, J.-Y. Learning Domain-Independent Deep Representations by Mutual Information Minimization. Comput. Intell. Neurosci. 2019, 2019, 9414539. [Google Scholar] [CrossRef] [PubMed]
- Tang, Q.; Chai, Y.; Qu, J.; Fang, X. Industrial process monitoring based on Fisher discriminant global-local preserving projection. J. Process Control 2019, 81, 76–86. [Google Scholar] [CrossRef]
- Gujrati, P.D. Jensen inequality and the second law. Phys. Lett. A 2020, 384, 6. [Google Scholar] [CrossRef] [Green Version]
- Velázquez, J.C.; Caleyo, F.; Cabrera-Sierra, R.; Teran, G.; Hernandez-Sanchez, E.; Capula-Colindres, S.; Herrera-Hernández, H.; Ortiz-Herrera, C.C. A Bayesian Approach for Estimating the Thinning Corrosion Rate of Steel Heat Exchanger in Hydrodesulfurization Plants. Adv. Mater. Sci. Eng. 2018, 2018, 4314139. [Google Scholar] [CrossRef] [Green Version]


| No. | Operating Parameter | Set Point |
|---|---|---|
| 1 | Nitrification degree of nitrocellulose (NC) | 207 mL/g |
| 2 | The addition amount of NC | 200 kg |
| 3 | The addition amount of diphenylamine (DPA) | 2~4 kg |
| 4 | stirring time of DPA/ether mixed solvent | 30 min |
| 5 | Jacket temperature of solvent preparation tank | 22 °C (18~25 °C) |
| 6 | solvent/NC ratio | 0.65~0.75:1 |
| 7 | Ether-ethanol solvent ratio | 1.0~1.2:1 |
| 8 | Stirring speed | 30 rpm |
| 9 | Jacket temperature of the plasticizing machine | 22 °C (18~25 °C) |
| 10 | Forward stirring time | 240 s |
| 11 | Backward stirring time | 60 s |
| 12 | Interval time between forward and backward | 15 s |
| 13 | Plasticizing time setting | 60 min |
| No. | Variable Description | Units |
|---|---|---|
| x1 | The addition amount of ether-ethanol mixed solvent and DPA | kg |
| x2 | Stirring speed of Agitator motor | rpm |
| x3 | Jacket cooling water valve opening | % |
| x4 | Jacket cooling water temperature | °C |
| x5 | Agitator motor current | A |
| x6 | Agitator shaft temperature T1 | °C |
| x7 | Agitator shaft temperature T2 | °C |
| x8 | Agitator shaft temperature T3 | °C |
| x9 | Agitator shaft temperature T4 | °C |
| x10 | Total plasticizing time | min |
| Case No. | Fault Description | Time (min) |
|---|---|---|
| F1 | Step fault in stirring rate (x2) with magnitude increased by 5% | 30–end |
| F2 | Gradual fault in stirring speed (x2) with a speed of 0.1 rpm/min | 30–end |
| F3 | Gradual fault in jacket temperature (x4) with a speed of 0.1 °C/min | 30–end |
| F4 | Mismatch of raw material, artificial setting solvent/NC ratio of 0.55:1 | 0–end |
| F5 | Abnormal operation of stirring motor, under-voltage operation with magnitude decreased by 10% | 0–20 |
| Fault No. | FDER (%) | |||||
|---|---|---|---|---|---|---|
| MPCA | MI-MPCA | NMI-WMPCA | ||||
| T2 | SPE | T2 | SPE | T2 | SPE | |
| F1 | 2.7 | 4.4 | 1.7 | 2.2 | 0 | 0 |
| F2 | 7.2 | 11.1 | 5 | 4.4 | 0 | 0 |
| F3 | 7.7 | 10.5 | 5.5 | 5 | 0 | 0 |
| Fault No. | Fault Detection Time (FDT) | |||||
|---|---|---|---|---|---|---|
| MPCA | MI-MPCA | NMI-WMPCA | ||||
| T2 | SPE | T2 | SPE | T2 | SPE | |
| F1 | 31.1 | 30.6 | 30.4 | 30.2 | 30.1 | 30.0 |
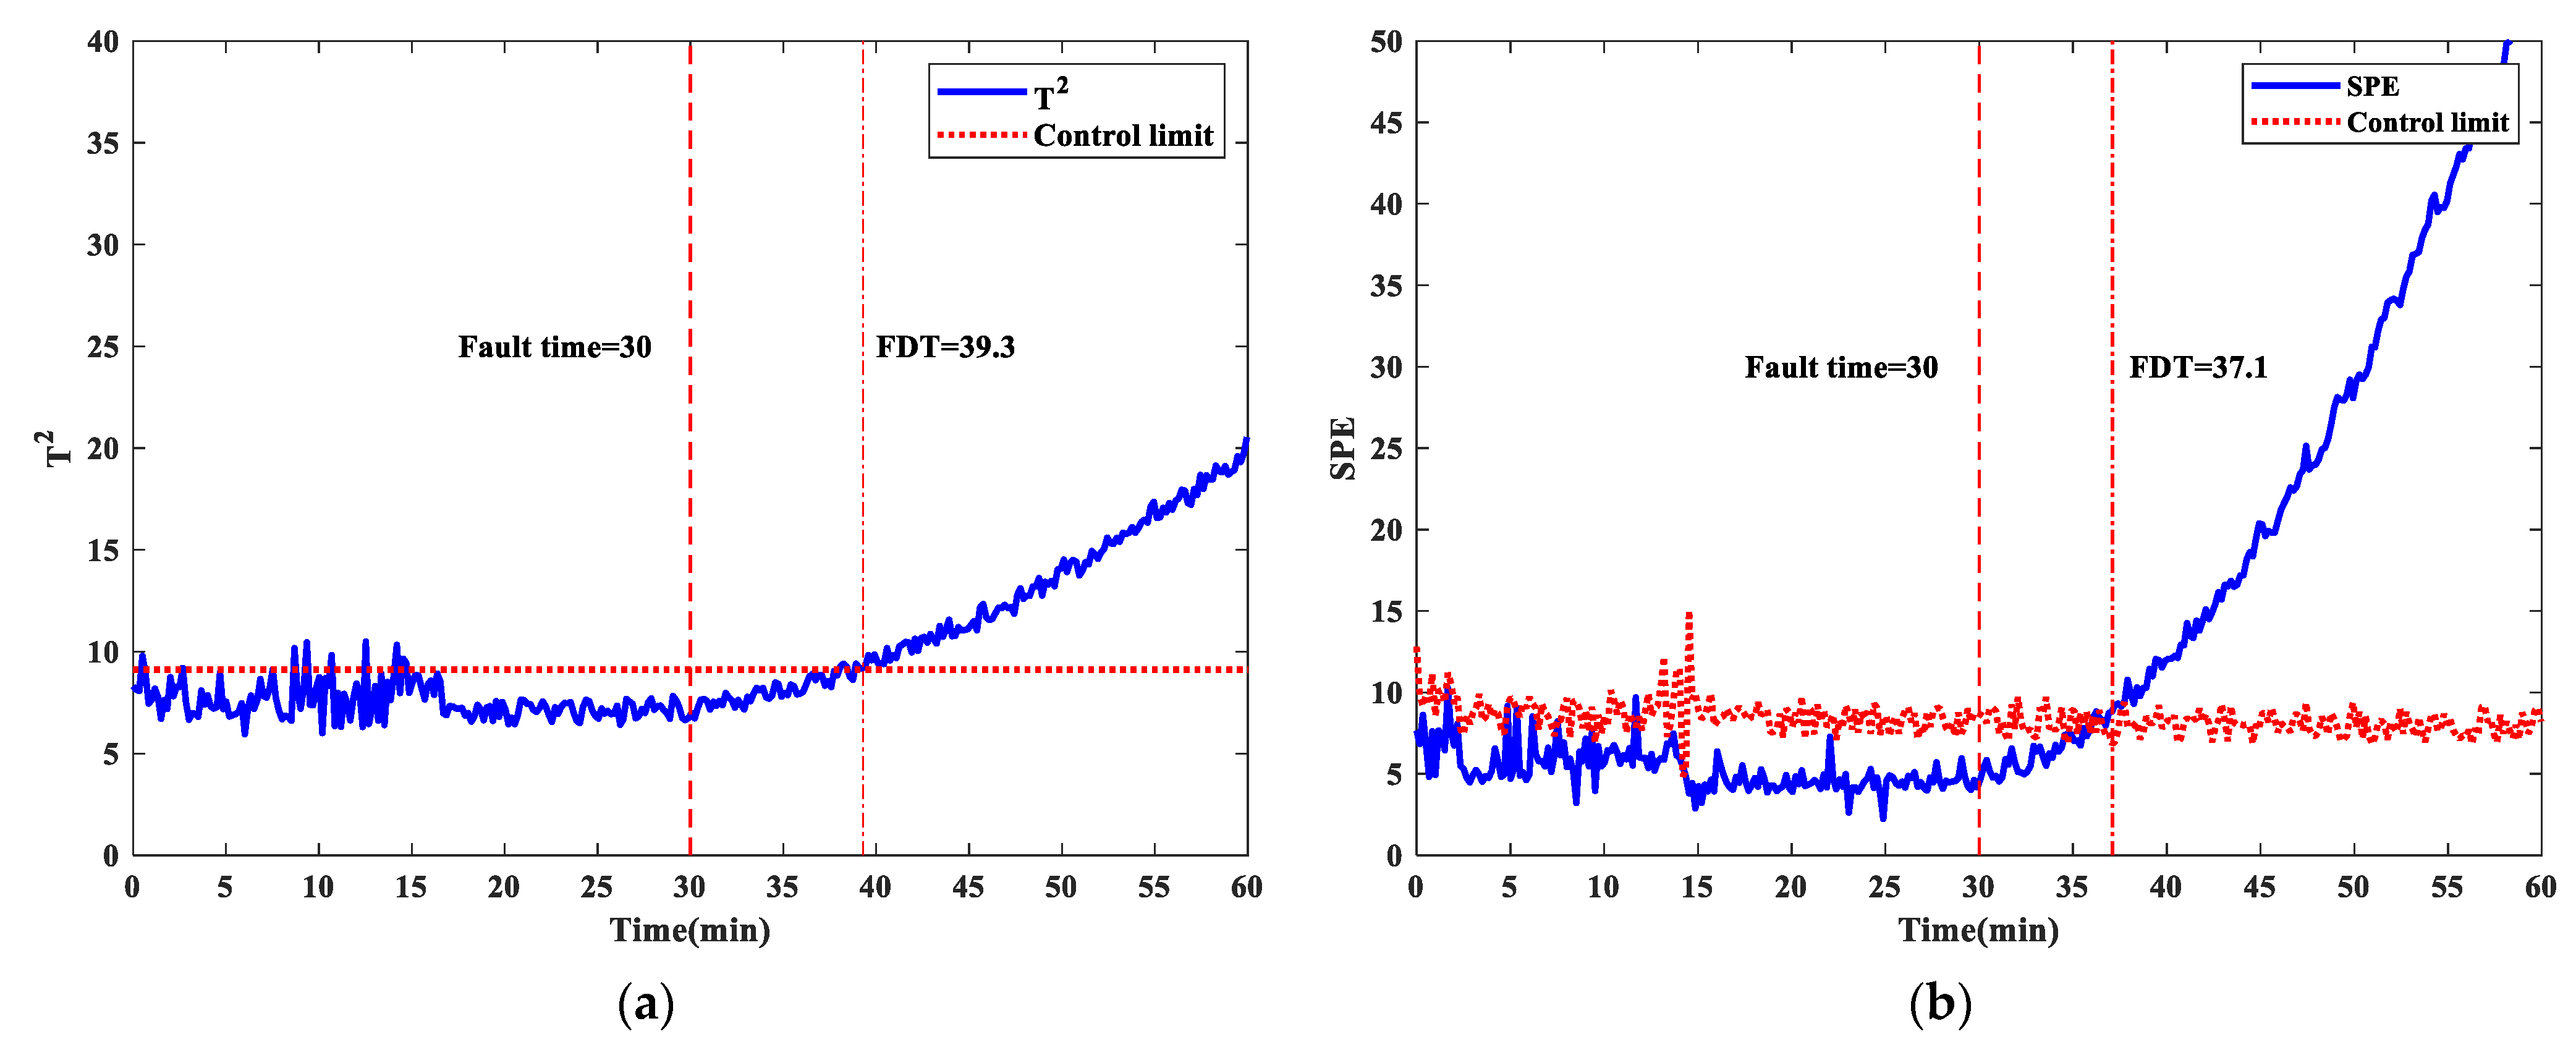
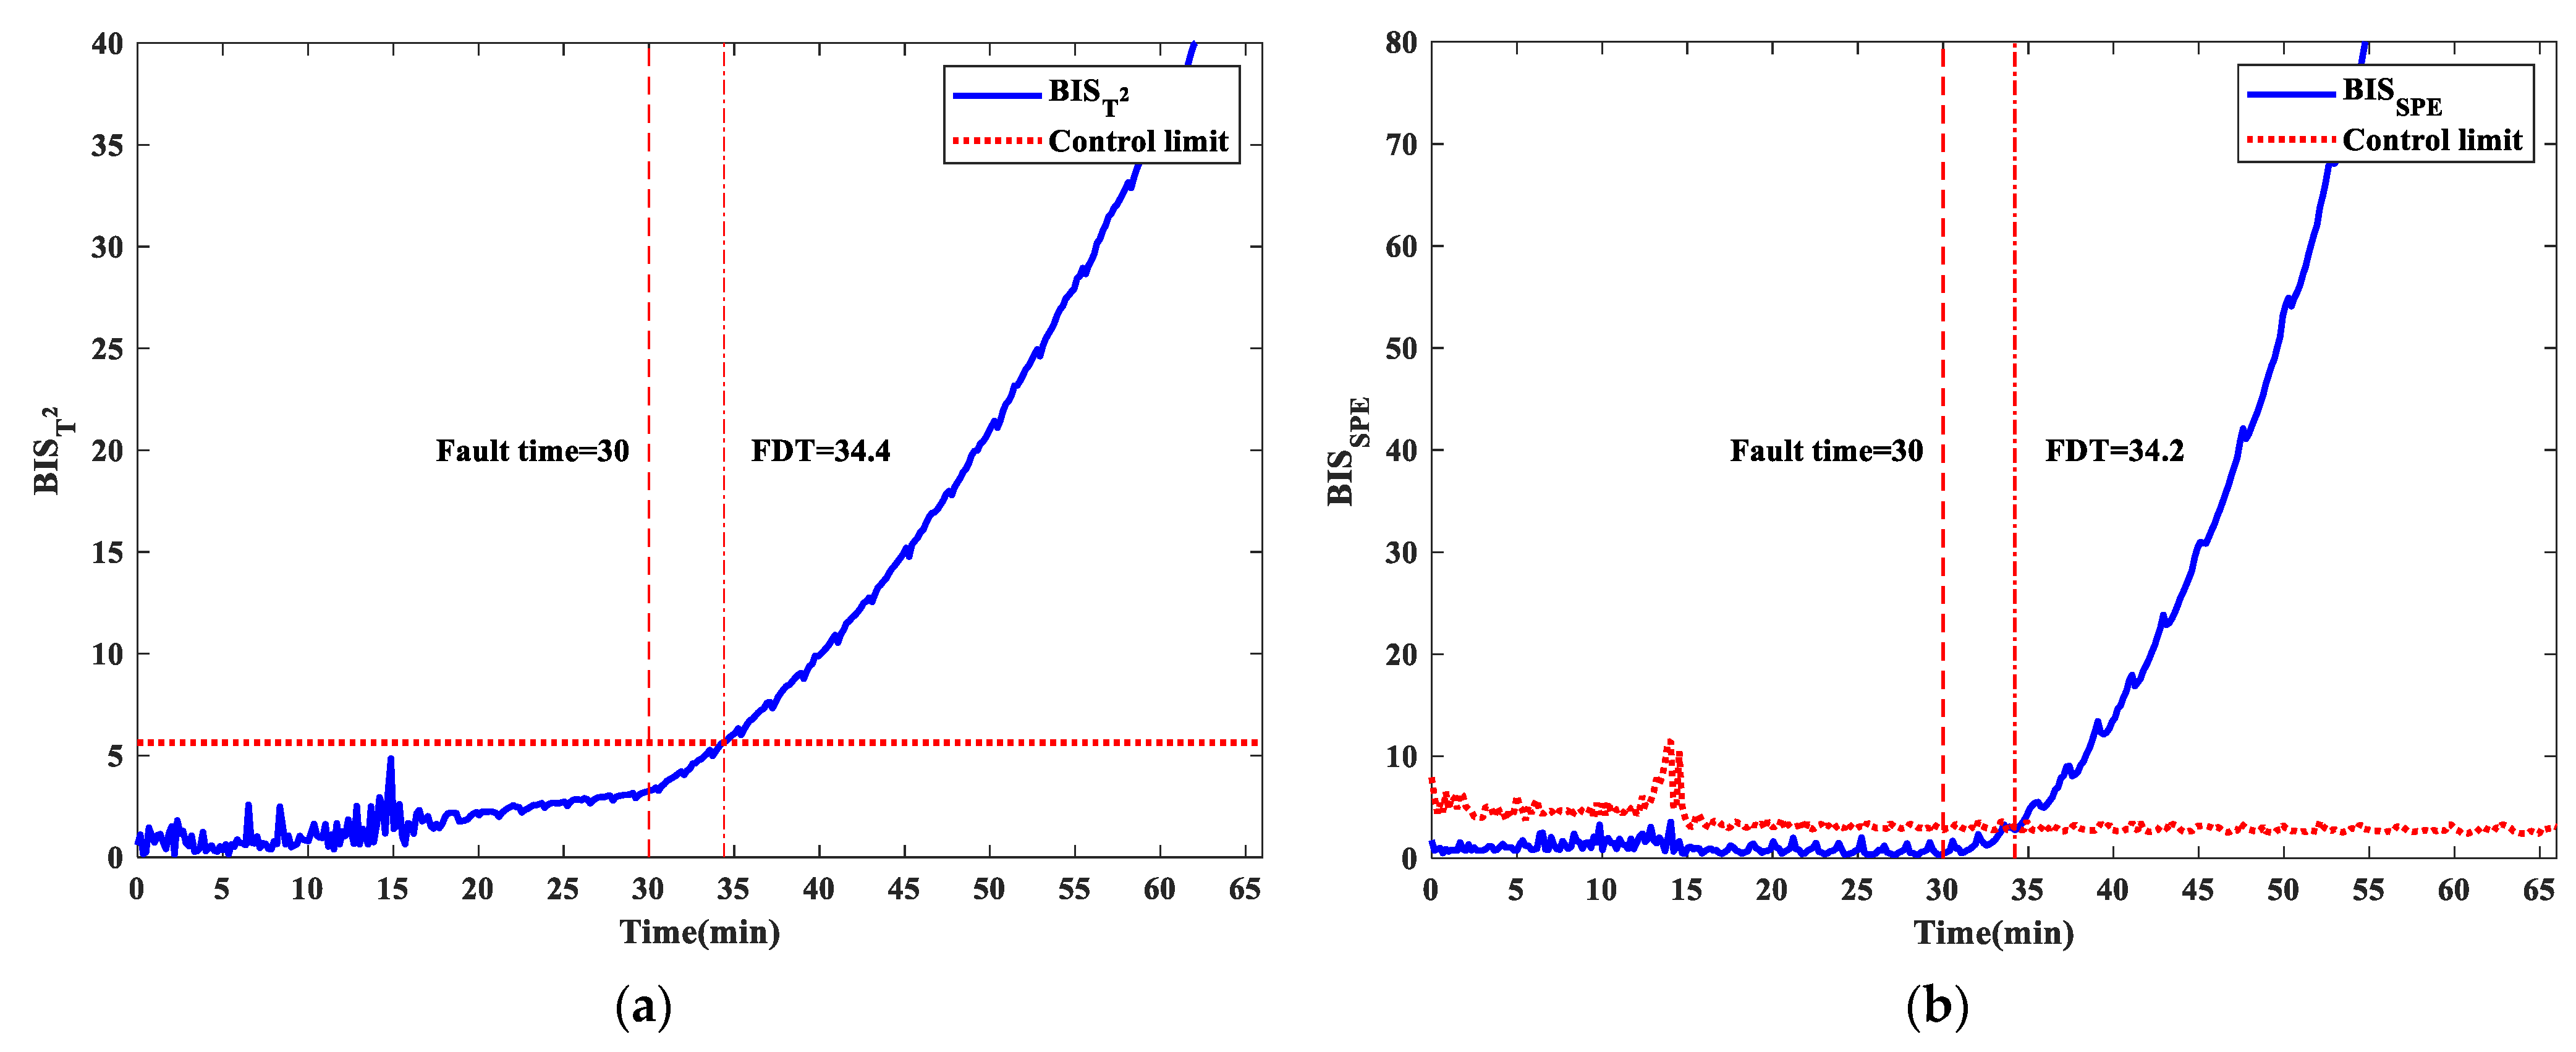
| F2 | 56.3 | 47.1 | 39.3 | 37.1 | 34.4 | 34.2 |
| F3 | 55.8 | 46.7 | 39.1 | 36.9 | 34.3 | 34.1 |
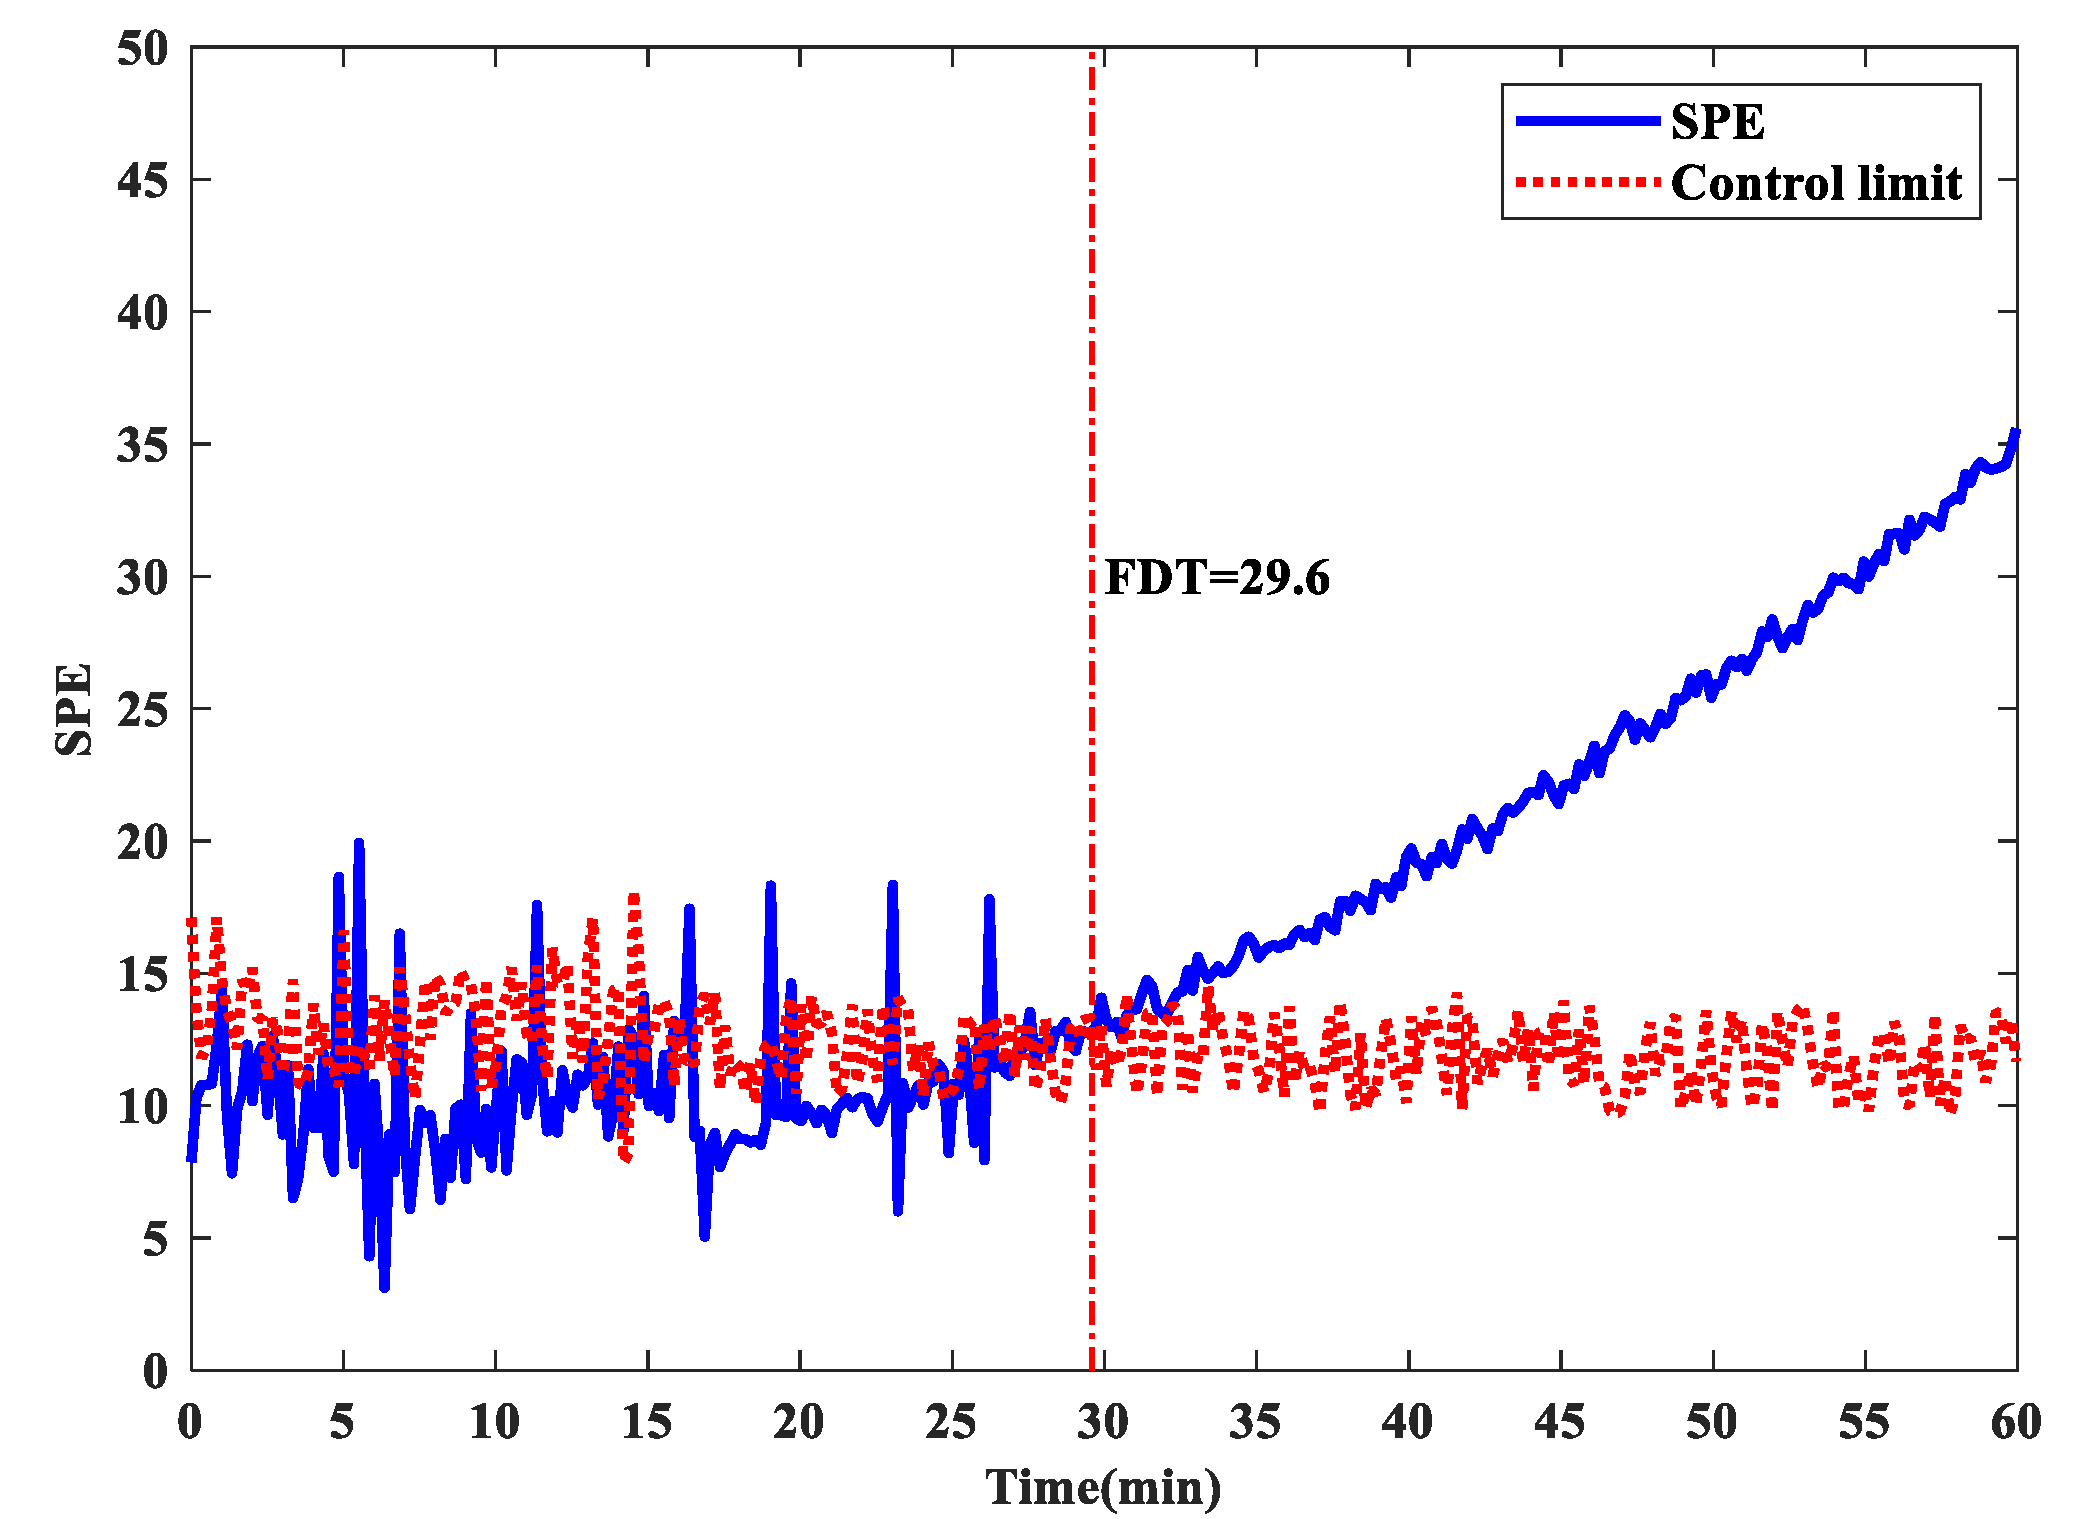
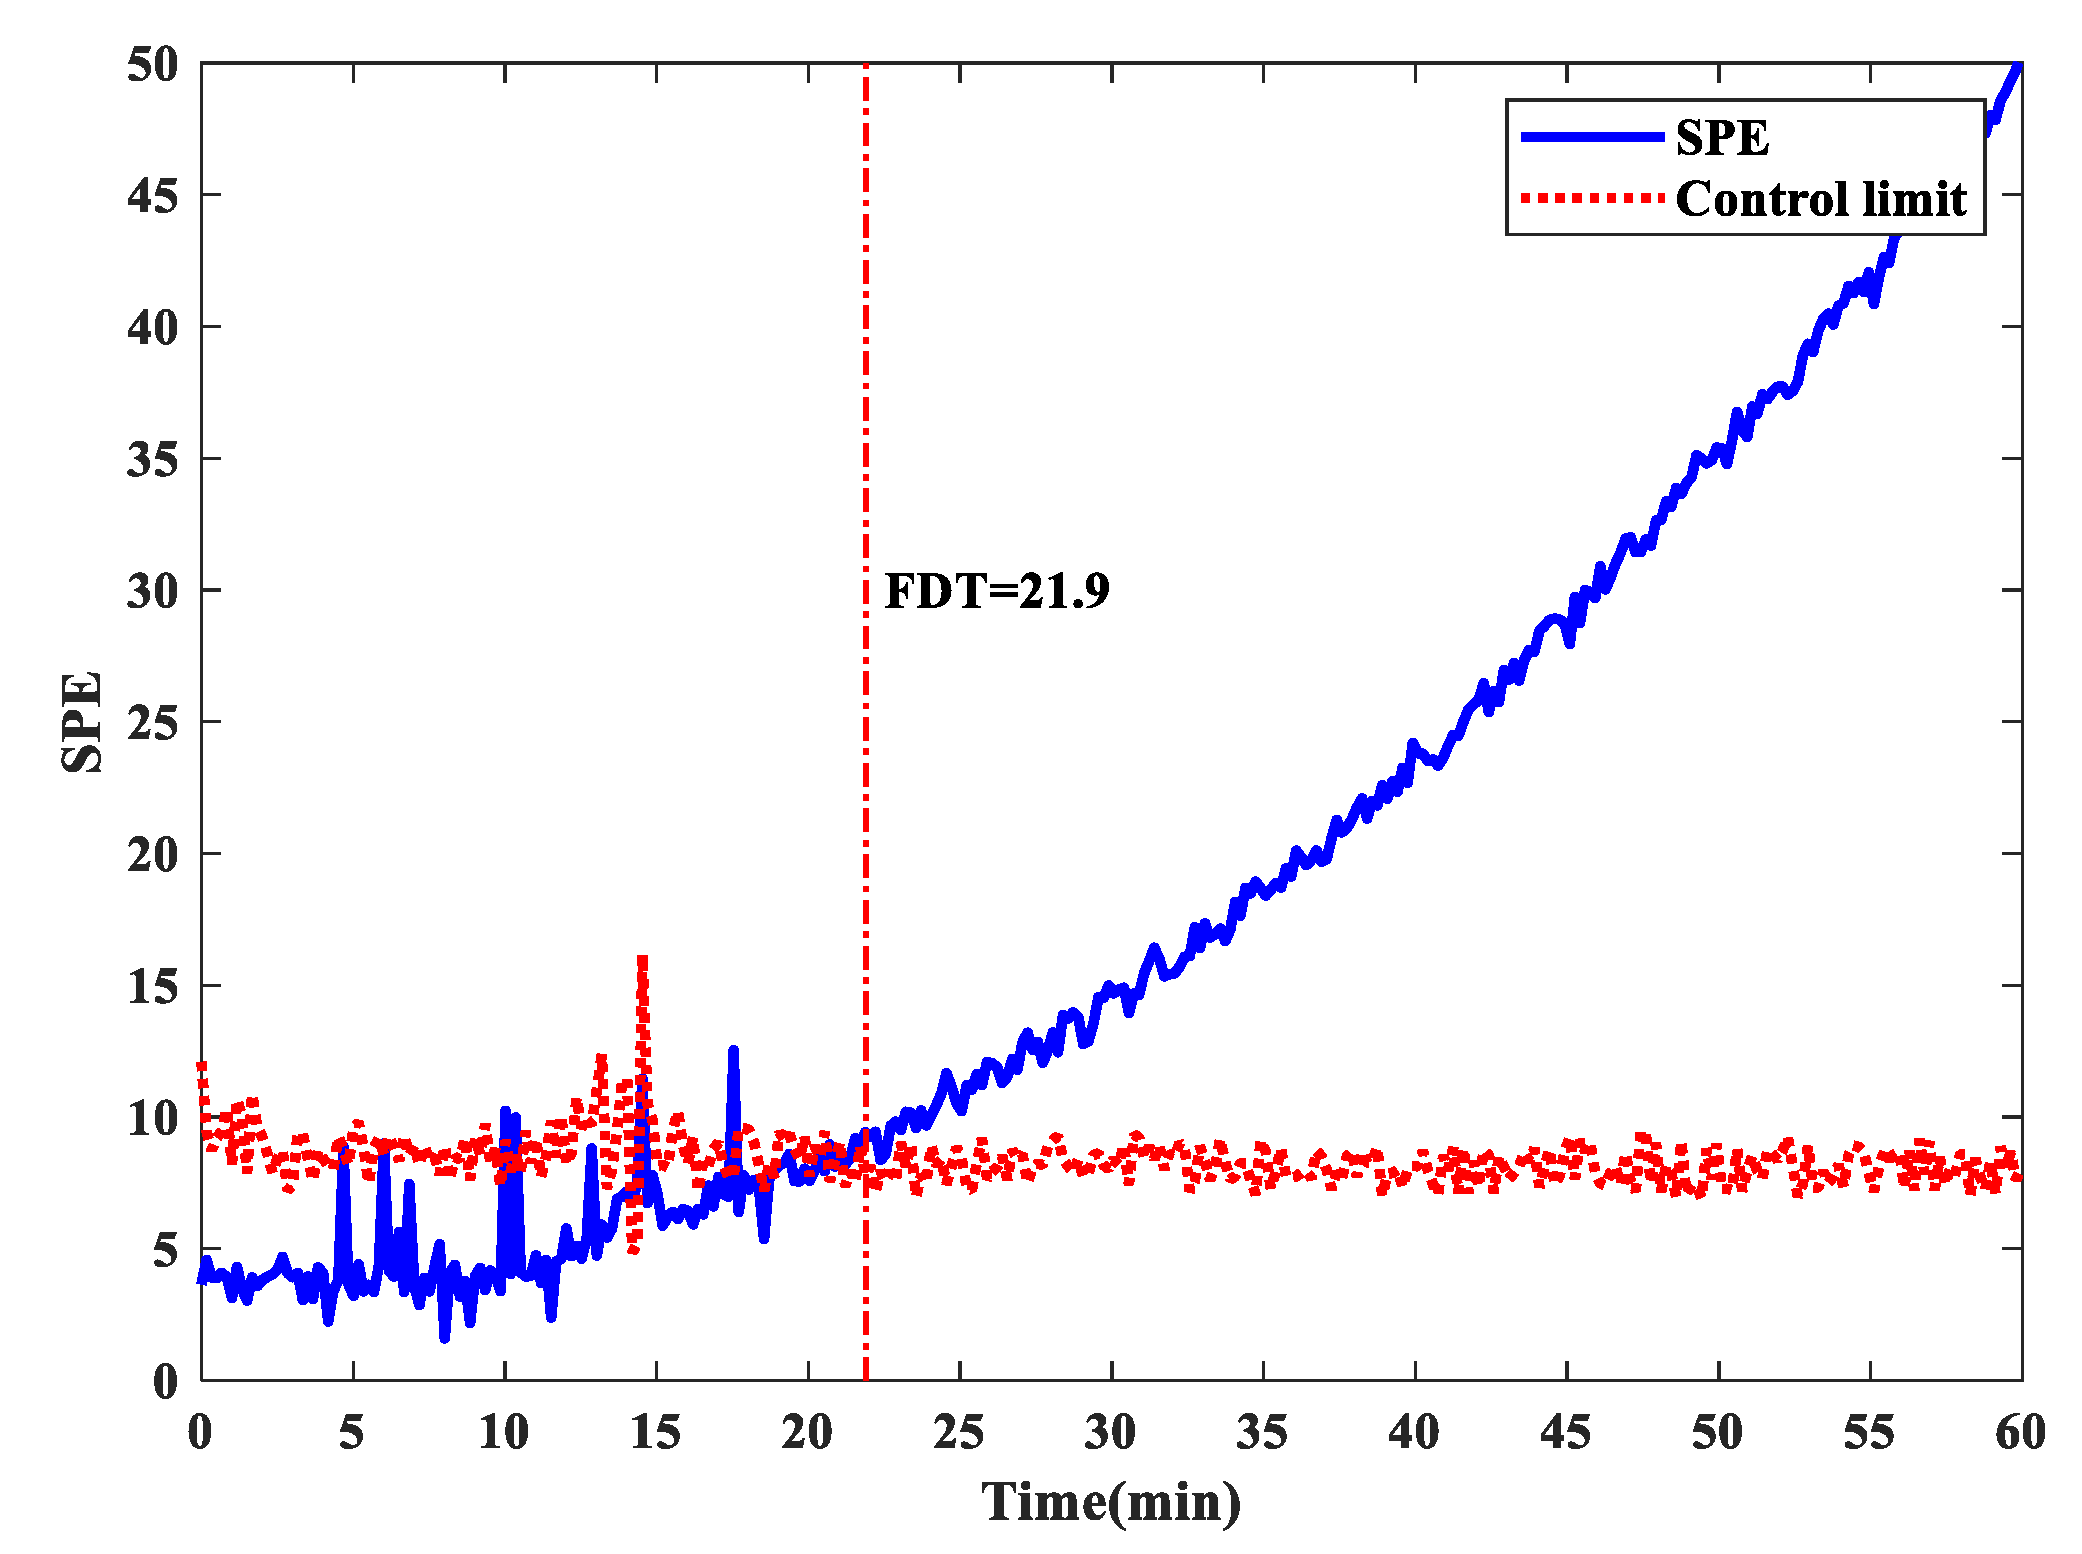
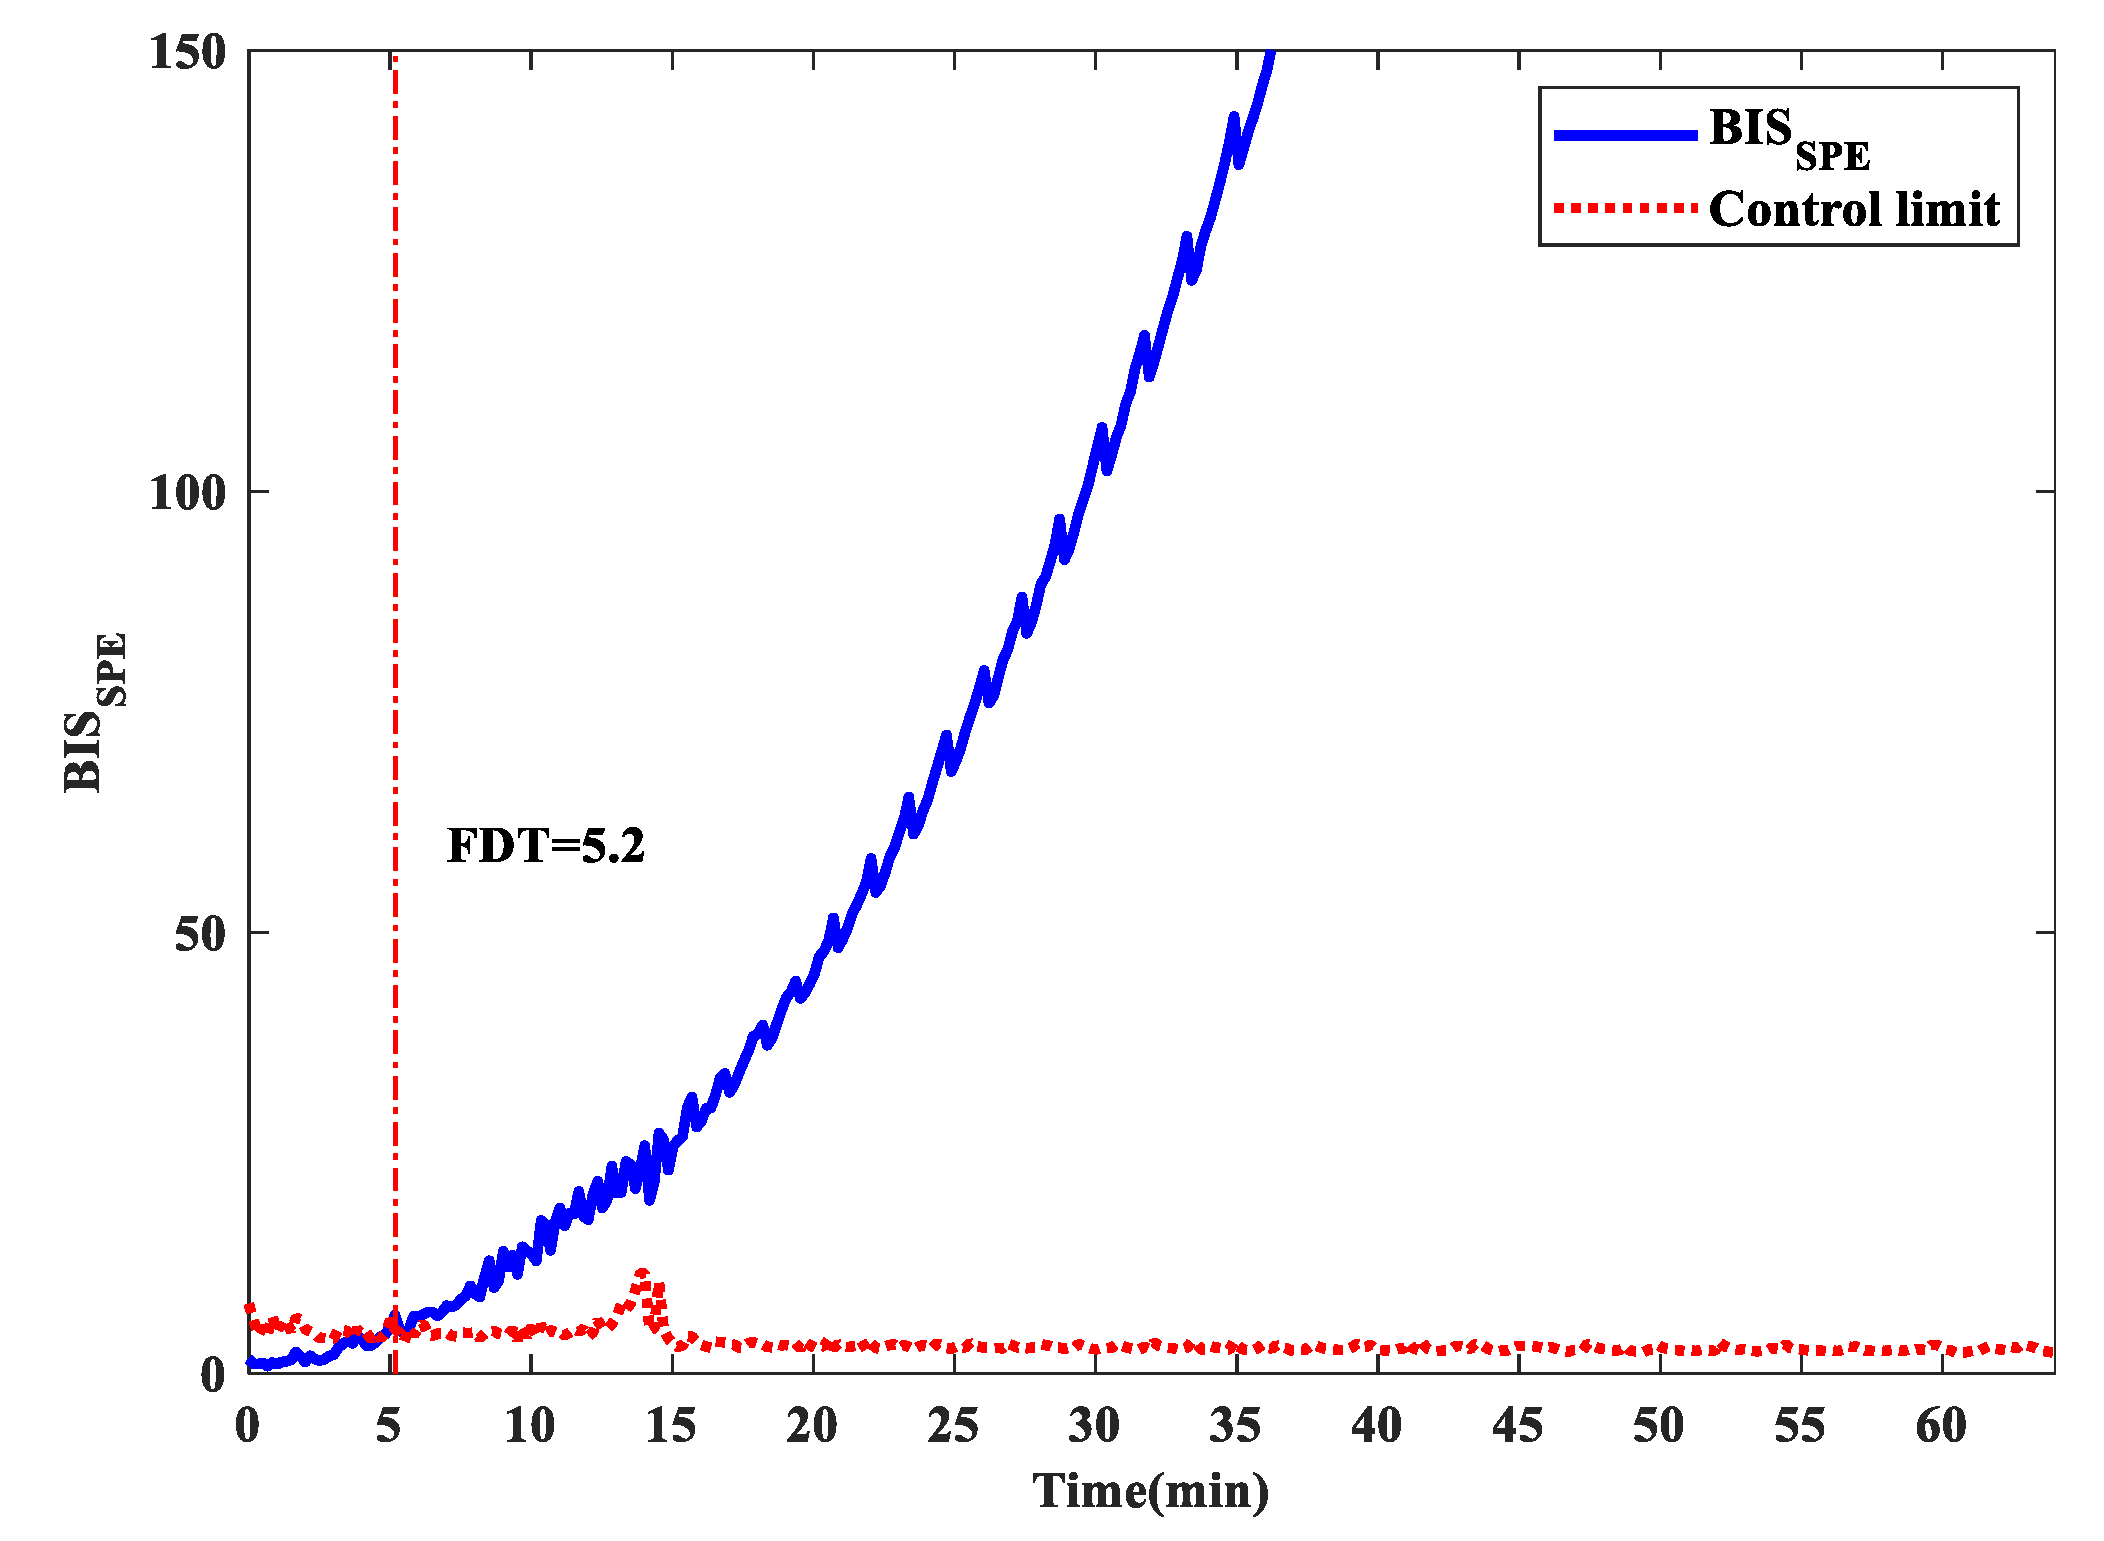
| F4 | 55.3 | 29.6 | 40.7 | 21.9 | 14.8 | 5.2 |
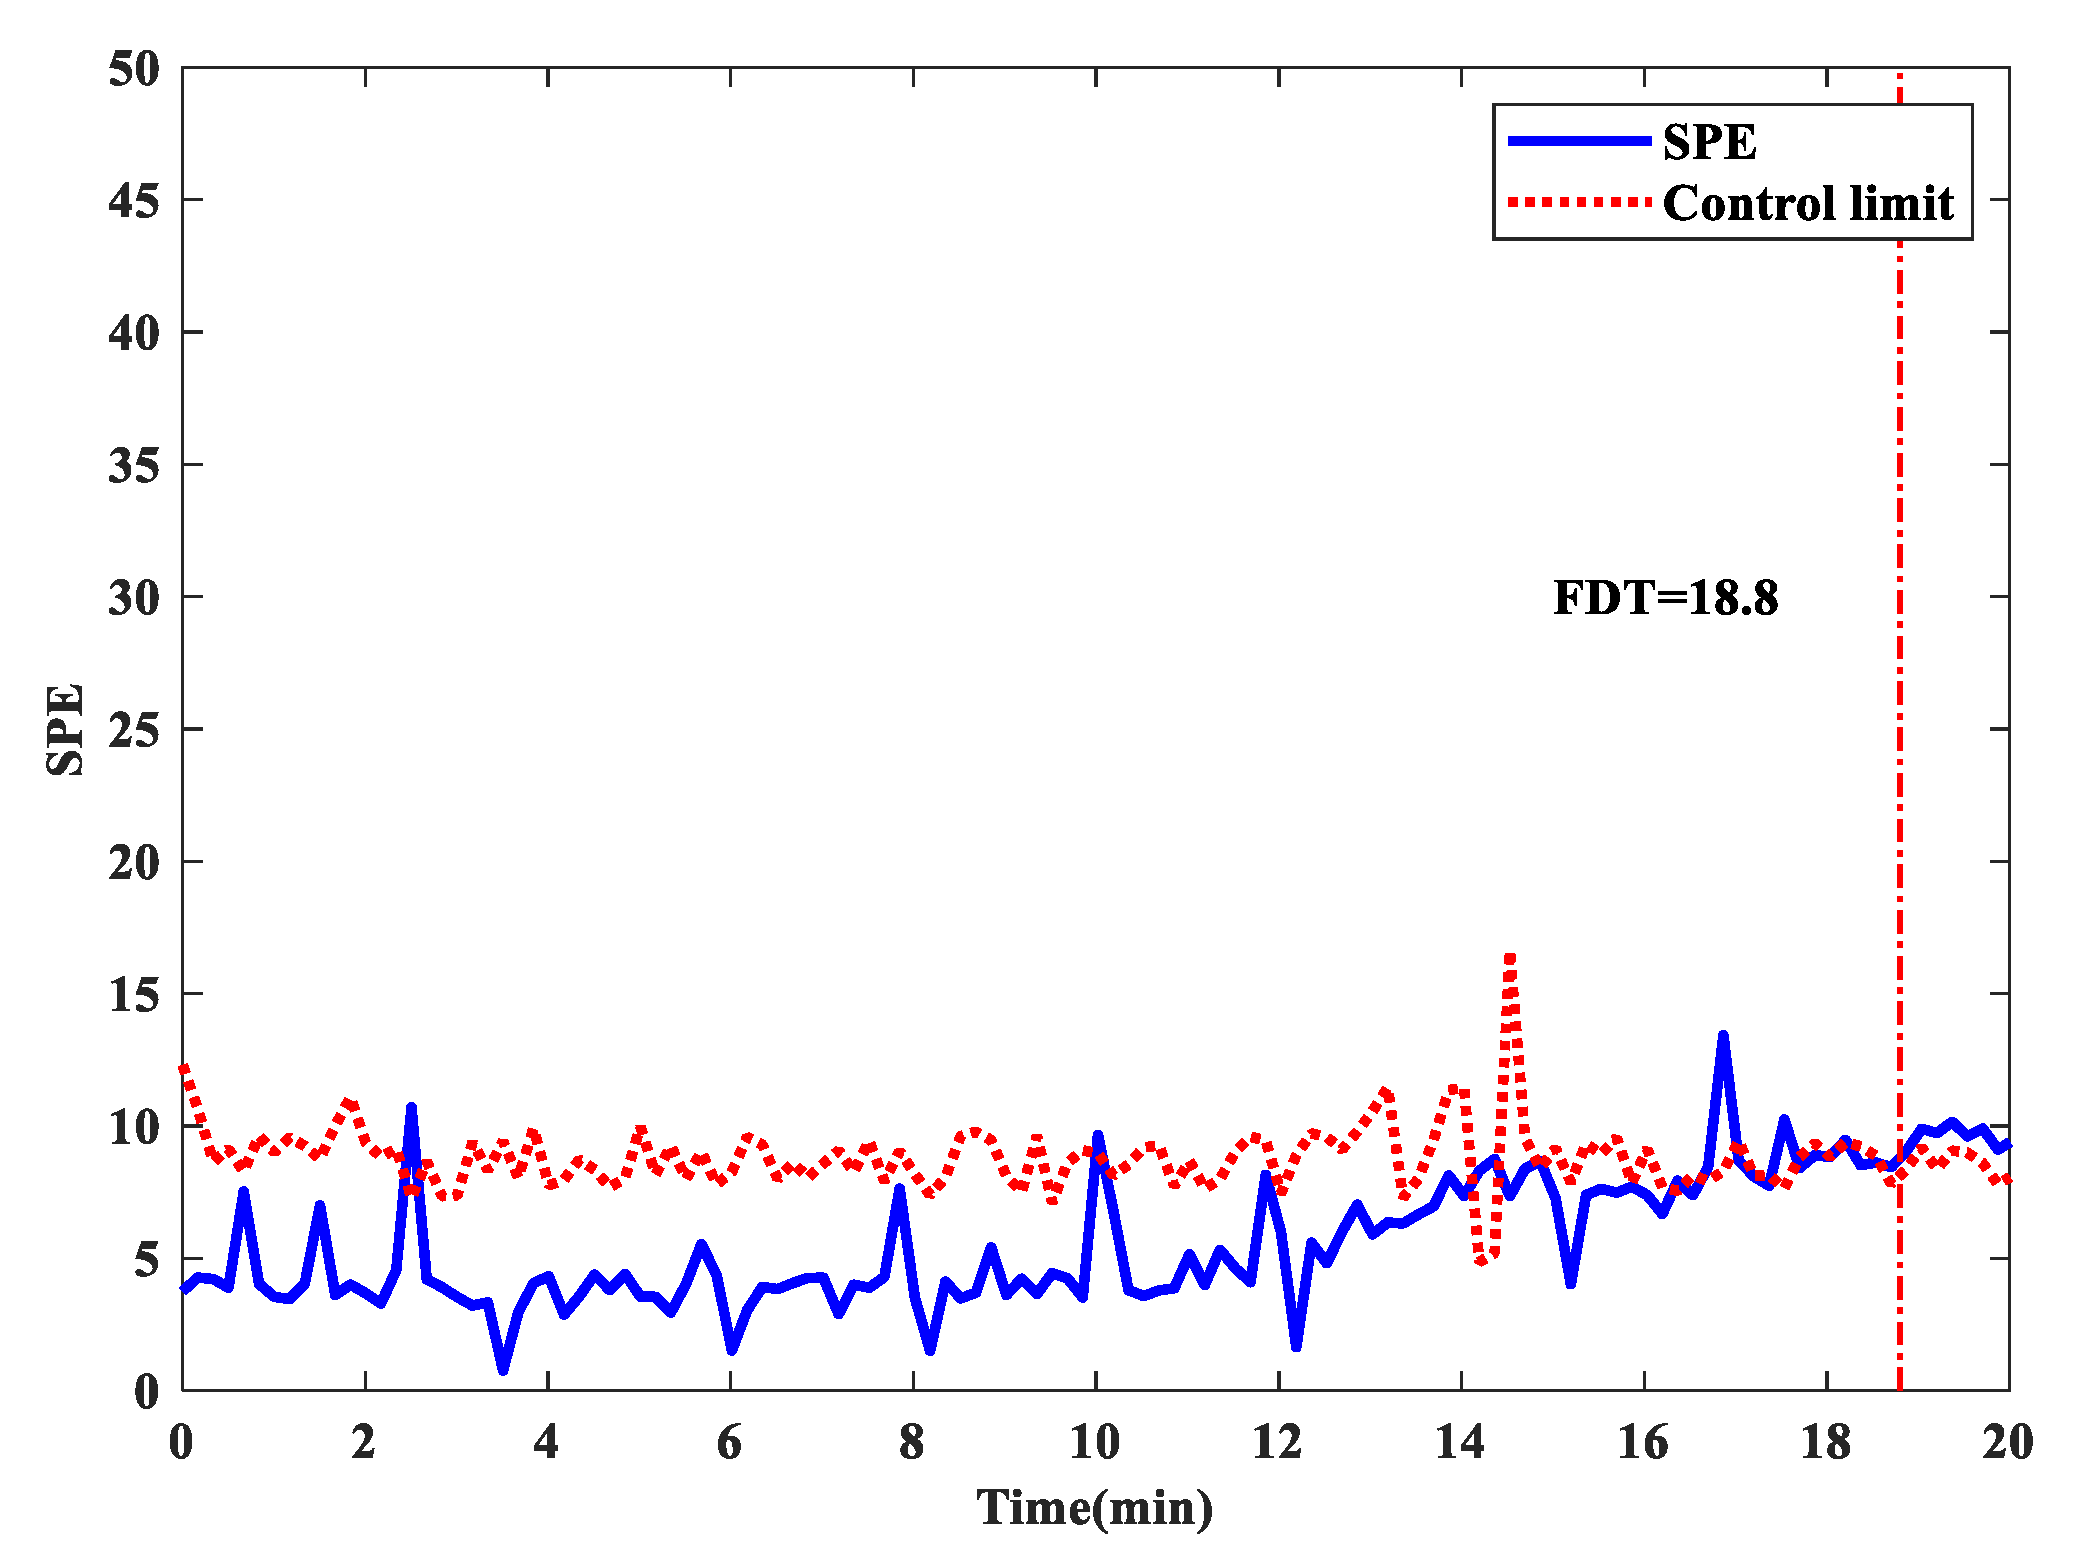
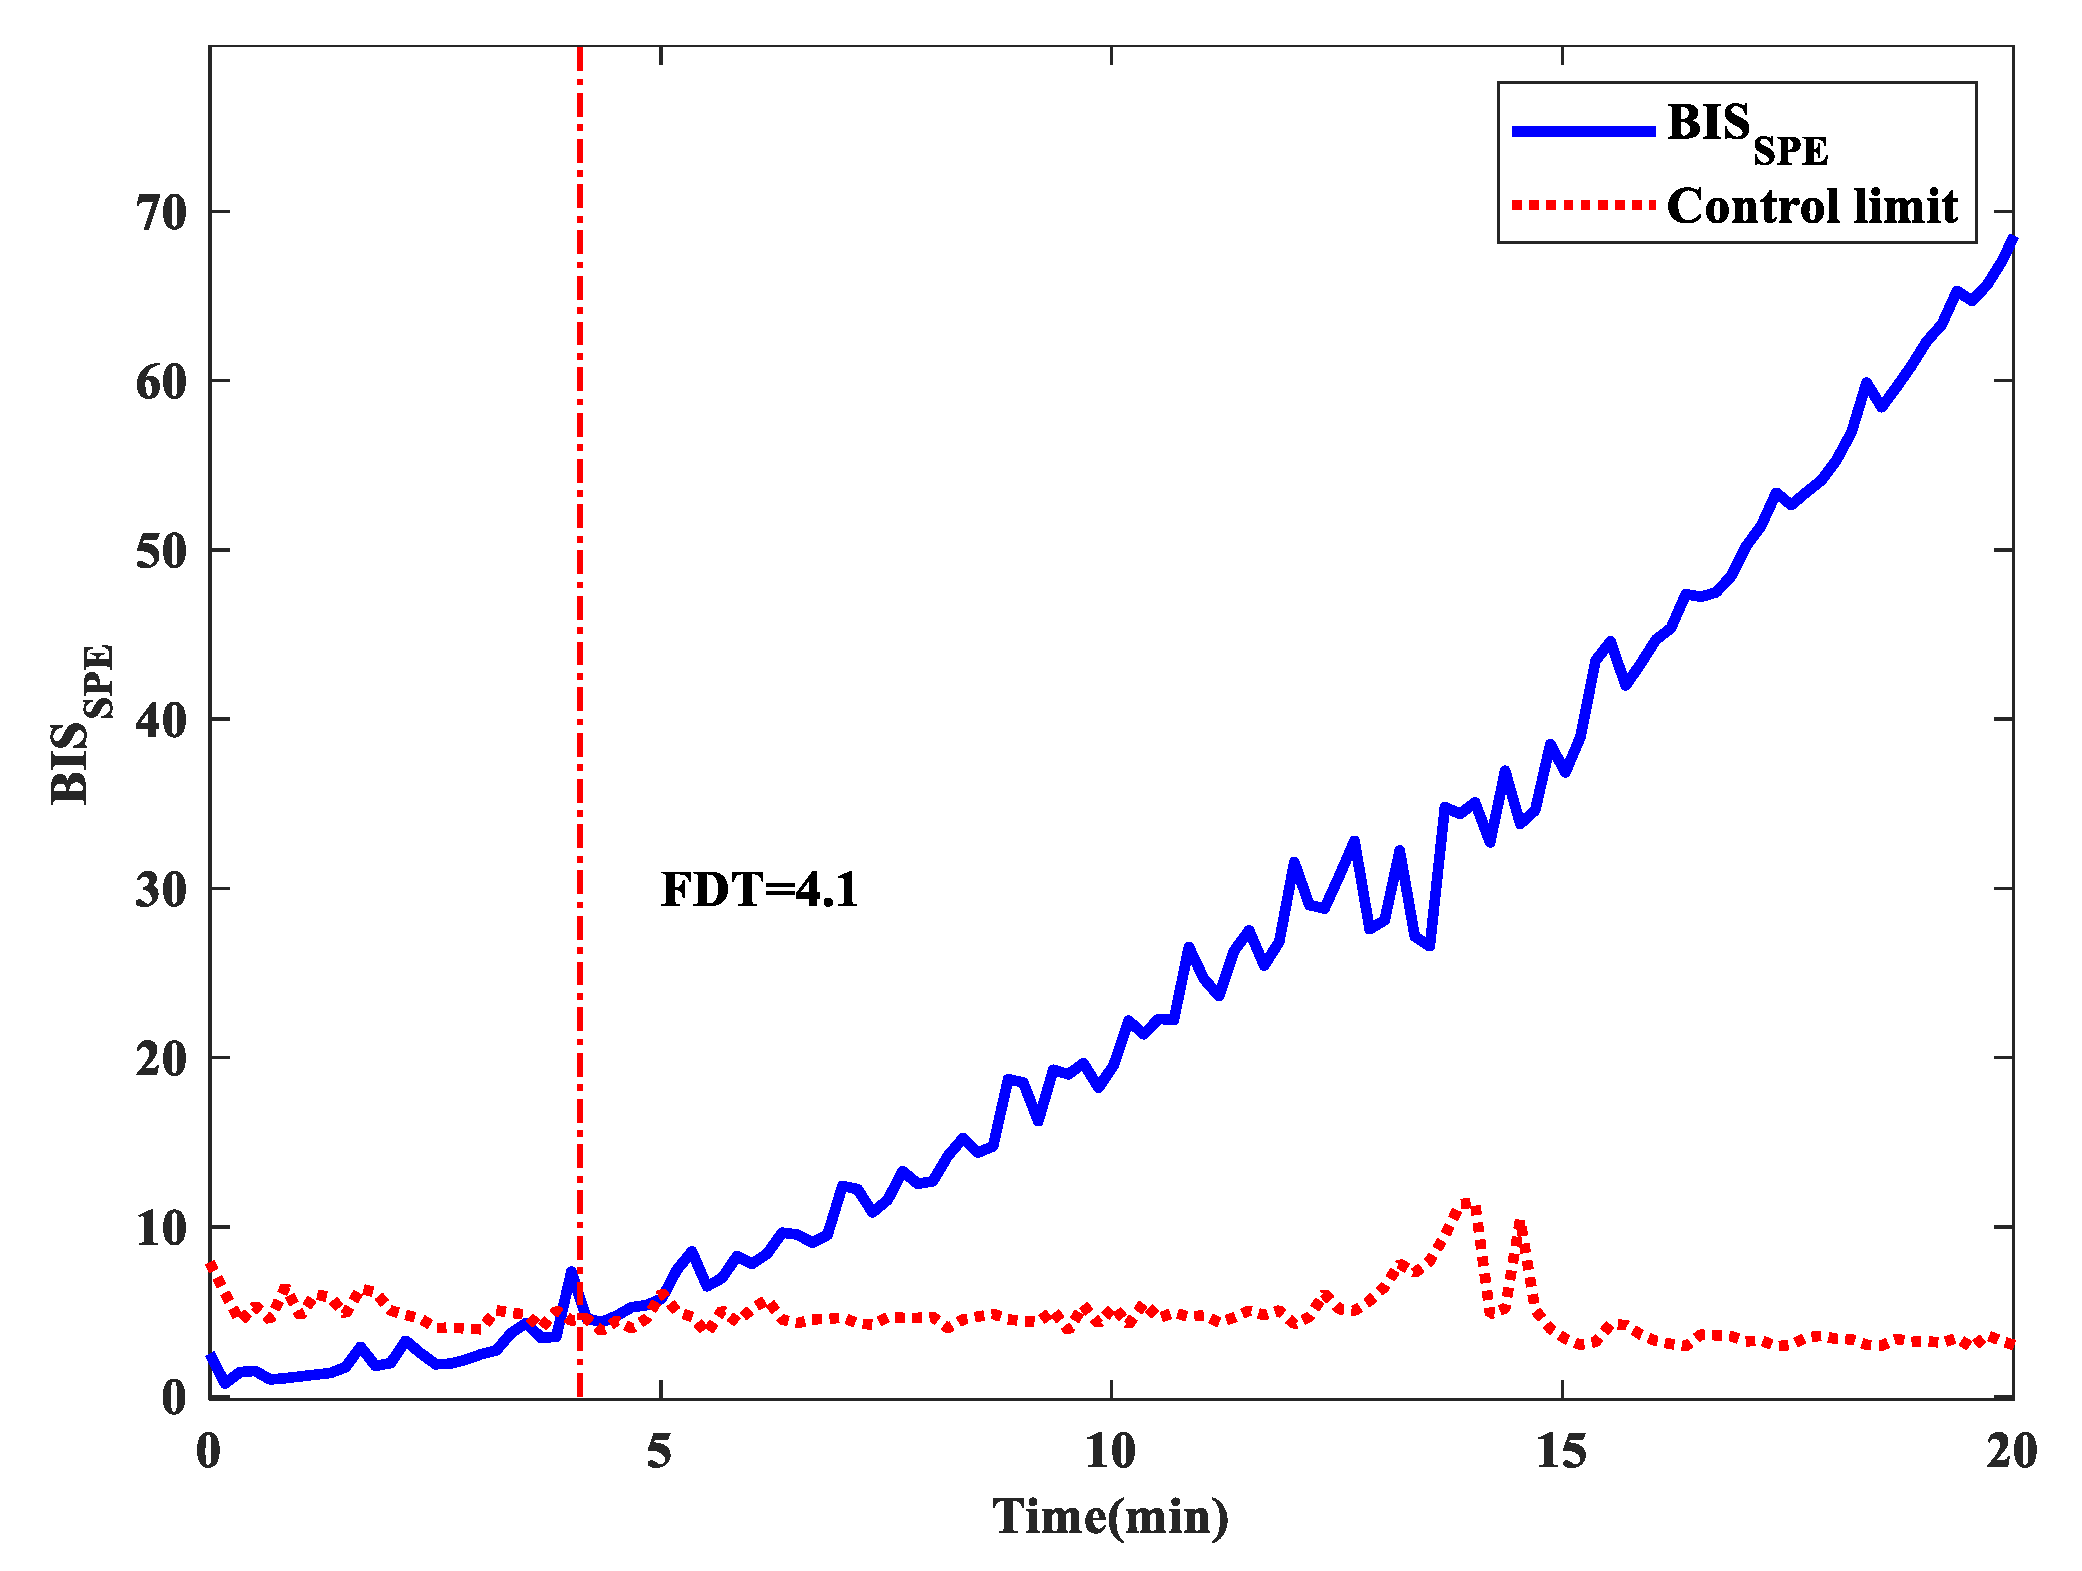
| F5 | — | — | — | 18.8 | 12.8 | 4.1 |
| Fault No. | Miss Detection Rate (MDR) | |||||
|---|---|---|---|---|---|---|
| MPCA | MI-MPCA | NMI-WMPCA | ||||
| T2 | SPE | T2 | SPE | T2 | SPE | |
| F1 | 3.9% | 2.2% | 1.6% | 1.1% | 0.5% | 0.0% |
| F2 | 87.8% | 57.2% | 31.1% | 23.9% | 15% | 13.9% |
| F3 | 86.1% | 56.1% | 30.5% | 23.3% | 14.4% | 13.3% |
| F4 | 92.2% | 49.4% | 67.8% | 36.4% | 24.7% | 8.6% |
| F5 | 100% | 100% | 100% | 94.2% | 64.2% | 20.8% |
| Algorithm | Size of Batch Samples | Performance Index (SPE) | Fault No. | ||||
|---|---|---|---|---|---|---|---|
| F1 | F2 | F3 | F4 | F5 | |||
| MPCA | Limited batch samples modelling | FDER | 4.4% | 11.1% | 10.5% | — | — |
| MDR | 2.2% | 57.2% | 56.1% | 49.4% | 100% | ||
| FDT | 30.6 | 47.1 | 46.7 | 29.6 | — | ||
| Sufficient batch samples modelling | FDER | 3.9% | 9.4% | 10% | — | — | |
| MDR | 1.1% | 32.8% | 31.7% | 18.1% | 51.7% | ||
| FDT | 30.2 | 39.8 | 39.5 | 10.8 | 10.3 | ||
| MI-MPCA | Limited batch samples modelling | FDER | 2.2% | 4.4% | 5% | — | — |
| MDR | 1.1% | 23.9% | 23.3% | 36.4% | 94.2% | ||
| FDT | 30.2 | 37.1 | 36.9 | 21.9 | 18.8 | ||
| Sufficient batch samples modelling | FDER | 1.7% | 2.2% | 2.7% | — | — | |
| MDR | 0.6% | 18.3% | 17.2% | 10.3% | 29.2% | ||
| FDT | 30.1 | 35.5 | 35.2 | 6.2 | 5.8 | ||
| NMI-WMPCA | Limited batch samples modelling | FDER | 0% | 0% | 0% | — | — |
| MDR | 0% | 13.9% | 13.3% | 8.6% | 20.8% | ||
| FDT | 30.0 | 34.2 | 34.1 | 5.2 | 4.1 | ||
| Sufficient batch samples modelling | FDER | 0% | 0% | 0% | — | — | |
| MDR | 0% | 10.6% | 10.6% | 6.9% | 17.5% | ||
| FDT | 30.0 | 33.1 | 33.1 | 4.1 | 3.5 | ||
| Items Comparison | MPCA | MI-MPCA | NMI-WMPCA |
|---|---|---|---|
| Complexity of the model | Simple | Medium | Complex |
| Modeling efficiency | Fast | Medium | Slow |
| Fault detection error rate | High | Medium | Low |
| Miss detection rate | High | Medium | Low |
| Processing the uneven-length data of batches | No | No | Yes |
| Considering the difference in coupling correlation of variables | No | No | Yes Excellent |
| the coupling characteristics of linear and nonlinear relationships | No | Yes | Yes Excellent |
| Detection performance under limited batch samples modelling | Poor | Medium | Excellent |
| Detection performance for the fault of process variables | Medium | Good | Excellent |
| Detection performance for the abnormal operating conditions | Poor | Medium | Excellent |
| Detection performance under sufficient batch samples modelling | Medium | Good | Excellent |
Publisher’s Note: MDPI stays neutral with regard to jurisdictional claims in published maps and institutional affiliations. |
© 2021 by the authors. Licensee MDPI, Basel, Switzerland. This article is an open access article distributed under the terms and conditions of the Creative Commons Attribution (CC BY) license (https://creativecommons.org/licenses/by/4.0/).
Share and Cite
Yang, M.; Wang, J.; Zhang, Y.; Bai, X.; Xu, Z.; Xia, X.; Fan, L. Fault Detection and Diagnosis for Plasticizing Process of Single-Base Gun Propellant Using Mutual Information Weighted MPCA under Limited Batch Samples Modelling. Machines 2021, 9, 166. https://doi.org/10.3390/machines9080166
Yang M, Wang J, Zhang Y, Bai X, Xu Z, Xia X, Fan L. Fault Detection and Diagnosis for Plasticizing Process of Single-Base Gun Propellant Using Mutual Information Weighted MPCA under Limited Batch Samples Modelling. Machines. 2021; 9(8):166. https://doi.org/10.3390/machines9080166
Chicago/Turabian StyleYang, Mingyi, Junyi Wang, Yinlong Zhang, Xinlin Bai, Zhigang Xu, Xiaofang Xia, and Linlin Fan. 2021. "Fault Detection and Diagnosis for Plasticizing Process of Single-Base Gun Propellant Using Mutual Information Weighted MPCA under Limited Batch Samples Modelling" Machines 9, no. 8: 166. https://doi.org/10.3390/machines9080166