Article

Experimental Research and Numerical Analysis of Pressure Fluctuation Characteristics of Rim Driven Propulsion Pump Outlet

Research Center of Fluid Machinery Engineering and Technology, Jiangsu University, Zhenjiang 212013, China
*
Author to whom correspondence should be addressed.
Machines 2021, 9(11), 293; https://doi.org/10.3390/machines9110293
Submission received: 15 October 2021 / Revised: 10 November 2021 / Accepted: 15 November 2021 / Published: 18 November 2021

Abstract

:
The pressure fluctuation characteristics of a rim driven propulsion pump are studied by an experimental method firstly, and then its unsteady inner flow is studied by numerical simulation to reveal the generating mechanism of the pressure fluctuation. In the experiment, a monitoring point was set in a downstream region with a distance of 1D (D, Diameter of impeller) to the impeller. The monitoring point’s dominant frequencies within a low frequency band are 1APF (APF, Axial Passing Frequency) and 2APF. In the numerical simulation, the main fluctuation near the impeller region appears at 1BPF (BPF, Blade Passing Frequency) and as the monitoring point moves downstream, the amplitude becomes smaller. The 1BPF fluctuation nearly disappears when the distance exceeds 1D, and the main frequency moves to 1APF and 2APF, which is in good agreement with the experimental results in the low frequency band. The transient velocity, pressure and vorticity distribution were studied to reveal the causes of 1BPF, 1APF and 2APF fluctuation. The main cause of 1BPF is the jet from the tail of the blade and the main cause of 2APF is the movement of a large-scale double vortex structure on both sides of the low-pressure zone. The movement of the vortex group near the wall may be the main cause that induces the 1APF fluctuation.

1. Introduction

The rim driven propulsion pump is a new type of integrated electric drive thruster and is mainly composed of casing, stator winding, a rotating drum, impeller and sliding bears. The rim driven propeller abandons the shafting structure, which makes the propeller more compact. It has great advantages in improving propulsion performance, reducing vibration and noise, and its easy manufacturing and maintenance. It can be applied to many types of marine equipment [1], such as submarines, small underwater vehicles, rescue vessels and so on.
The prototype of rim driven propulsion was proposed by a German, Kort, in 1940 [2]. In 2003, General Dynamics of the United States designed and manufactured a five-blade shaftless propeller and applied it to large-scale marine equipment. Then, the Rolls-Royce, Smart Motor A S, etc., developed a batch of products. Because of its advantages in terms of low vibration and noise, the United States took the lead in making rim driven propulsion the key technology of submarine propulsion in 2005. Afterwards, the National Cheng Kung University developed a small rim driven propulsion unit and conducted research on the theoretical design, numerical simulation and experimental verification, but the power of the testing machine was too low and the volume was too large, which is only suitable for small unmanned submarine [3,4,5,6]. In 2014, Andersen from Chalmers University of Technology designed a rim driven pump applied to a small rescue vessel. The rim driven propulsion pump was an important development in the direction of underwater thruster technology [7].
However, the unsteady characteristic is the main factor affecting the operation stability of the propulsion pump. There are relative movement between the rotating blades and stationary parts, circumferential movement and asymmetric flow in the pump, which leads to pressure fluctuation, vibration and noise, thus affecting the stable operation of the pump [8,9]. An experimental study by Gonzalez on the unsteady flow characteristics of a centrifugal pump showed that unsteady pressure pulsation inside the pump is the main cause of pump vibration [10]. The flow-induced noise characteristics of a spiral mixed-flow water jet propulsion pump were studied by Wang and the results showed that the unsteady load on the blade surface and the rotor–stator interference are the main reasons affecting the noise of the impeller [11].
As the main reason for noise and vibration, pressure fluctuation has been studied deeply by a large number of scholars. Milabe analyzed the large-scale secondary circumfluence and vortex flow phenomenon under small flow rate by a PIV (Particle Image Velocimetry) test and numerical method, and it was pointed out that a rotating stall is the main factor to induce the unsteady operation of a mixed-flow pump [12,13]. Wang tested and analyzed the pressure fluctuation in the mixed-flow pump, and the results showed that the pressure pulsation under small flow rate conditions was severe, the pump operation was unstable with reflux appearing, causing complex and irregular pressure pulsation [14,15,16]. Furthermore, the pressure fluctuation characteristics of a rim driven propulsion pump would be affected by the structure more significantly compared with the conventional shaft-driven propulsion because of the absence of a shaft.
In the last few decades, a lot of research about the performance characteristics of the rim driven propulsion pump have been carried out. Rim driven propulsion was designed and the CFD method was used to analyze the impact of a hub and hubless blade on its performance, and the results showed that the hubless blade can reduce energy loss by 10% [17,18,19]. A new type of small shaftless water jet propulsion was proposed by Su in 2018, which eliminated the transmission shaft, reduced the disturbance of the water jet speed field by the uneven inflow, improved the propulsion performance of the propeller, and increased the thrust [20]. The SST turbulent flow model was used by Andersen to simulate the performance of the axial water jet pump, which revealed the inner flow structure of the passage [7,21,22]. Aleksander applied several turbulent models in the research of rotor–stator interaction in rim driven thrusters, and the SST model was found to have high relevance with experimental results, and was also more robust for solving low advance ratios [23]. Therefore, the numerical simulation for rim driven propulsion is an effective method used to study its performance and the SST turbulence flow model is suitable for the study of the rim driven propulsion pump.
In the present work, experimental methods are used to study the hydraulic performance and pressure fluctuation characteristics of rim driven propulsion and explore the operating characteristics of rim driven propulsion. Then, the numerical simulation is applied to reveal the mechanism of the pressure fluctuation. The research on the unsteady characteristics of rim driven propulsion can provide a basis for the study of its internal flow-induced noise and lay a theoretical solution for improving the acoustical hidden performance.

2. The Research Model and Test
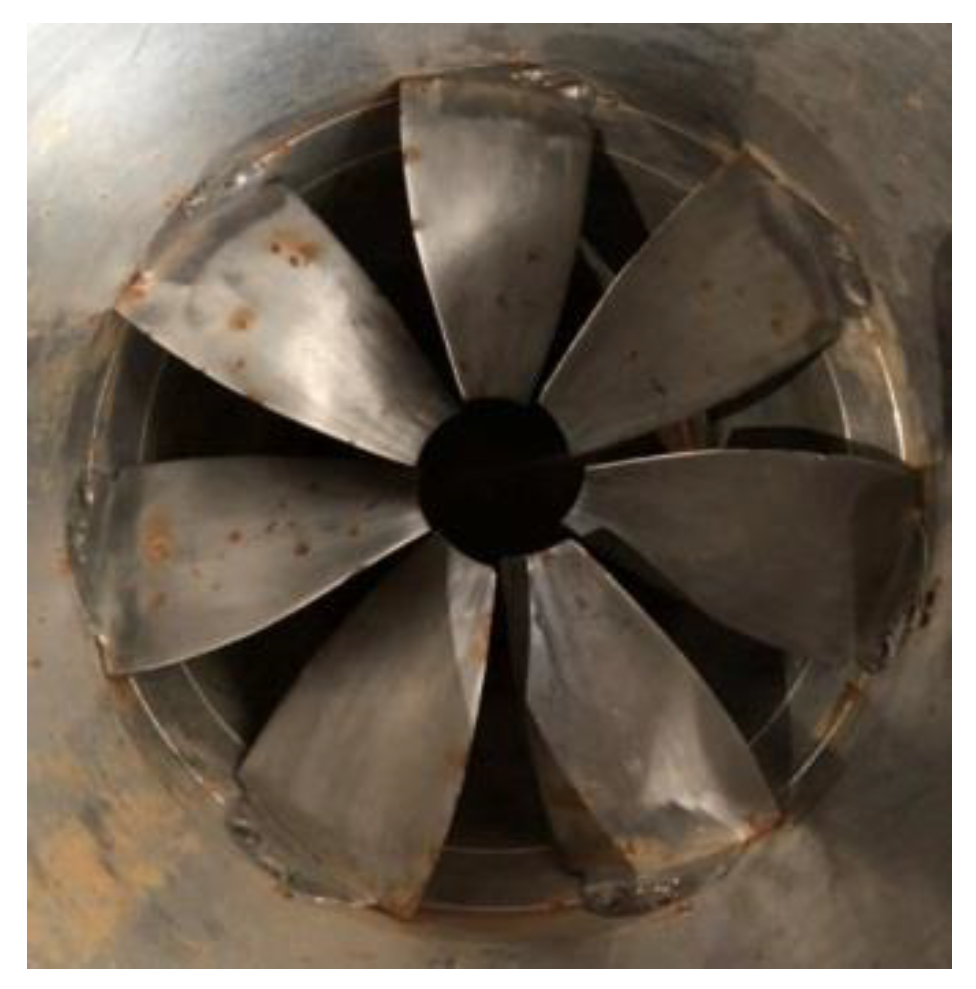
2.1. Research Model

The main parameters of a rim driven propulsion pump are the rated flow rate Qd = 1300 m3/h, the rated head H = 6.5 m, power P = 40 kW, the diameter of impeller D = 300 mm, the blade number Z = 7, virtual hub ratio dh/D = 0.2. Figure 1 shows the research model of rim driven propulsion pump.

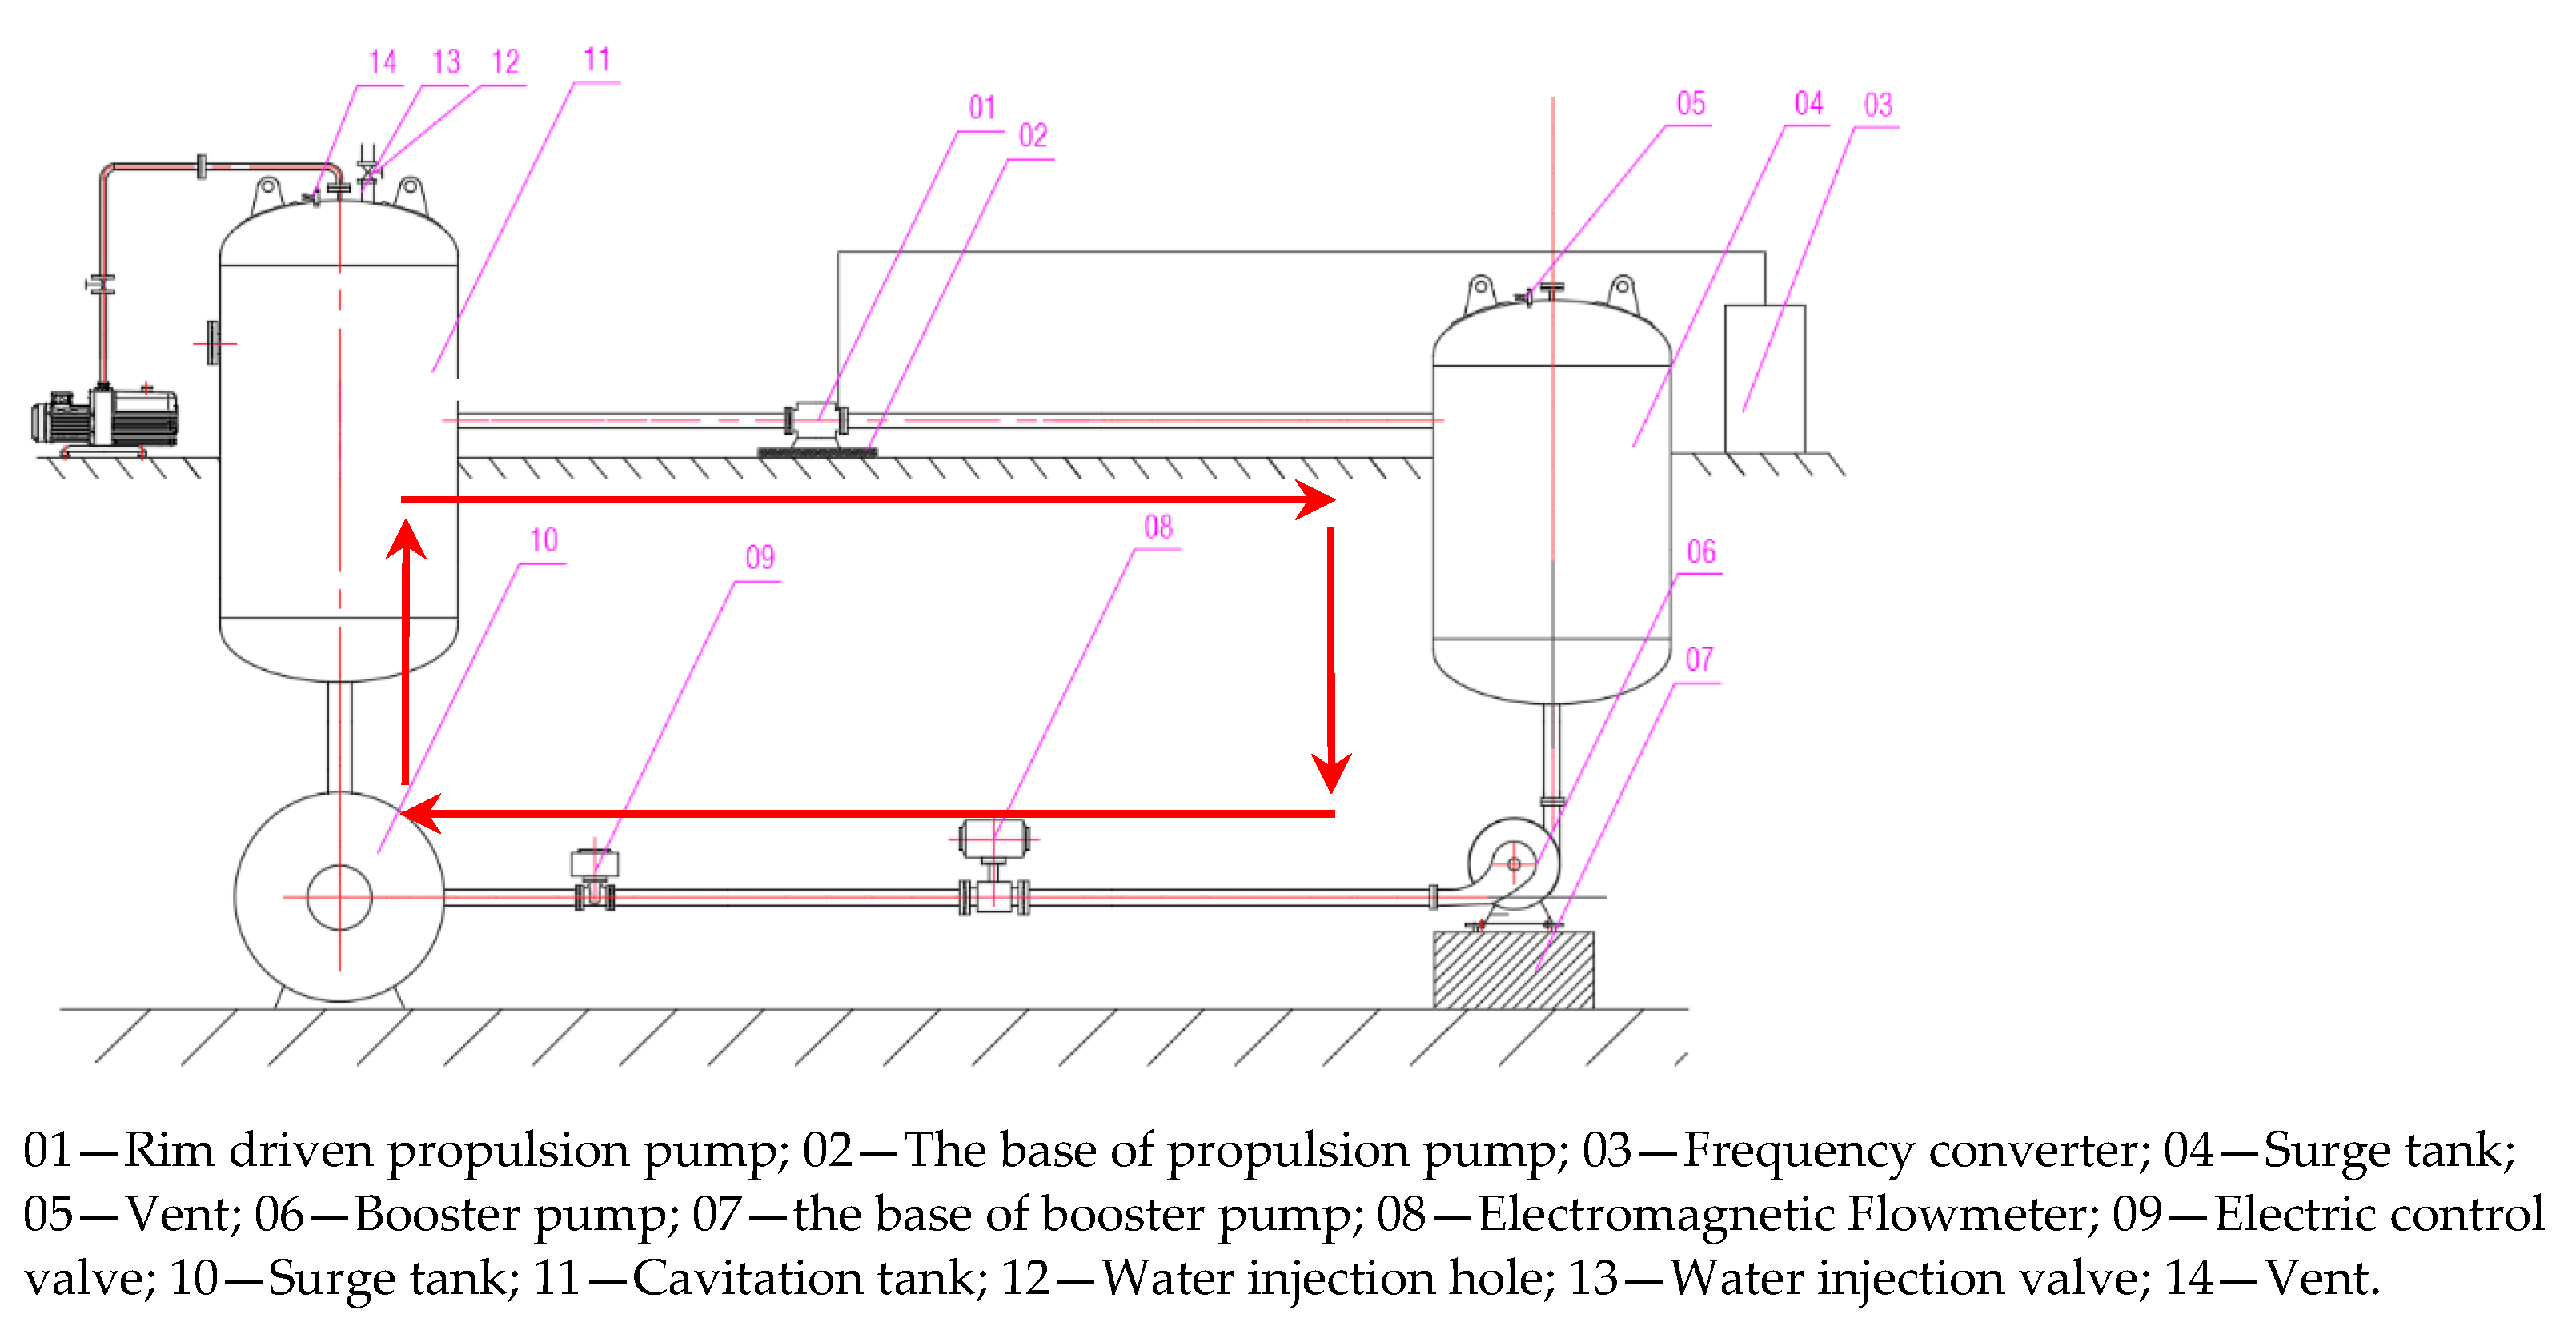
2.2. The Introduction of Test Rig

The head, power, efficiency and the pressure fluctuation of rim driven propulsion pump are tested by designing a test system for the performance test. Figure 2 shows the test system for the performance of the rim drive propulsion pump. The surge tank and cavitation tank in the test rig are set to supply the steady flow for propulsion pump. The electric control valve is used to control the flow speed. The electromagnetic flowmeter is used to measure the flow rate and its measuring accuracy is 0.5%. The booster pump is used to increase the test range of propulsion pump performance and the inverter is used to control the shutdown and start of the propulsion pump. To ensure the steady inlet and outlet flow conditions and make full use of space on the test rig, the length of inlet pipe and the outlet pipe, respectively, are 2.2 m and 2.9 m, and their inner diameters are both 300 mm.

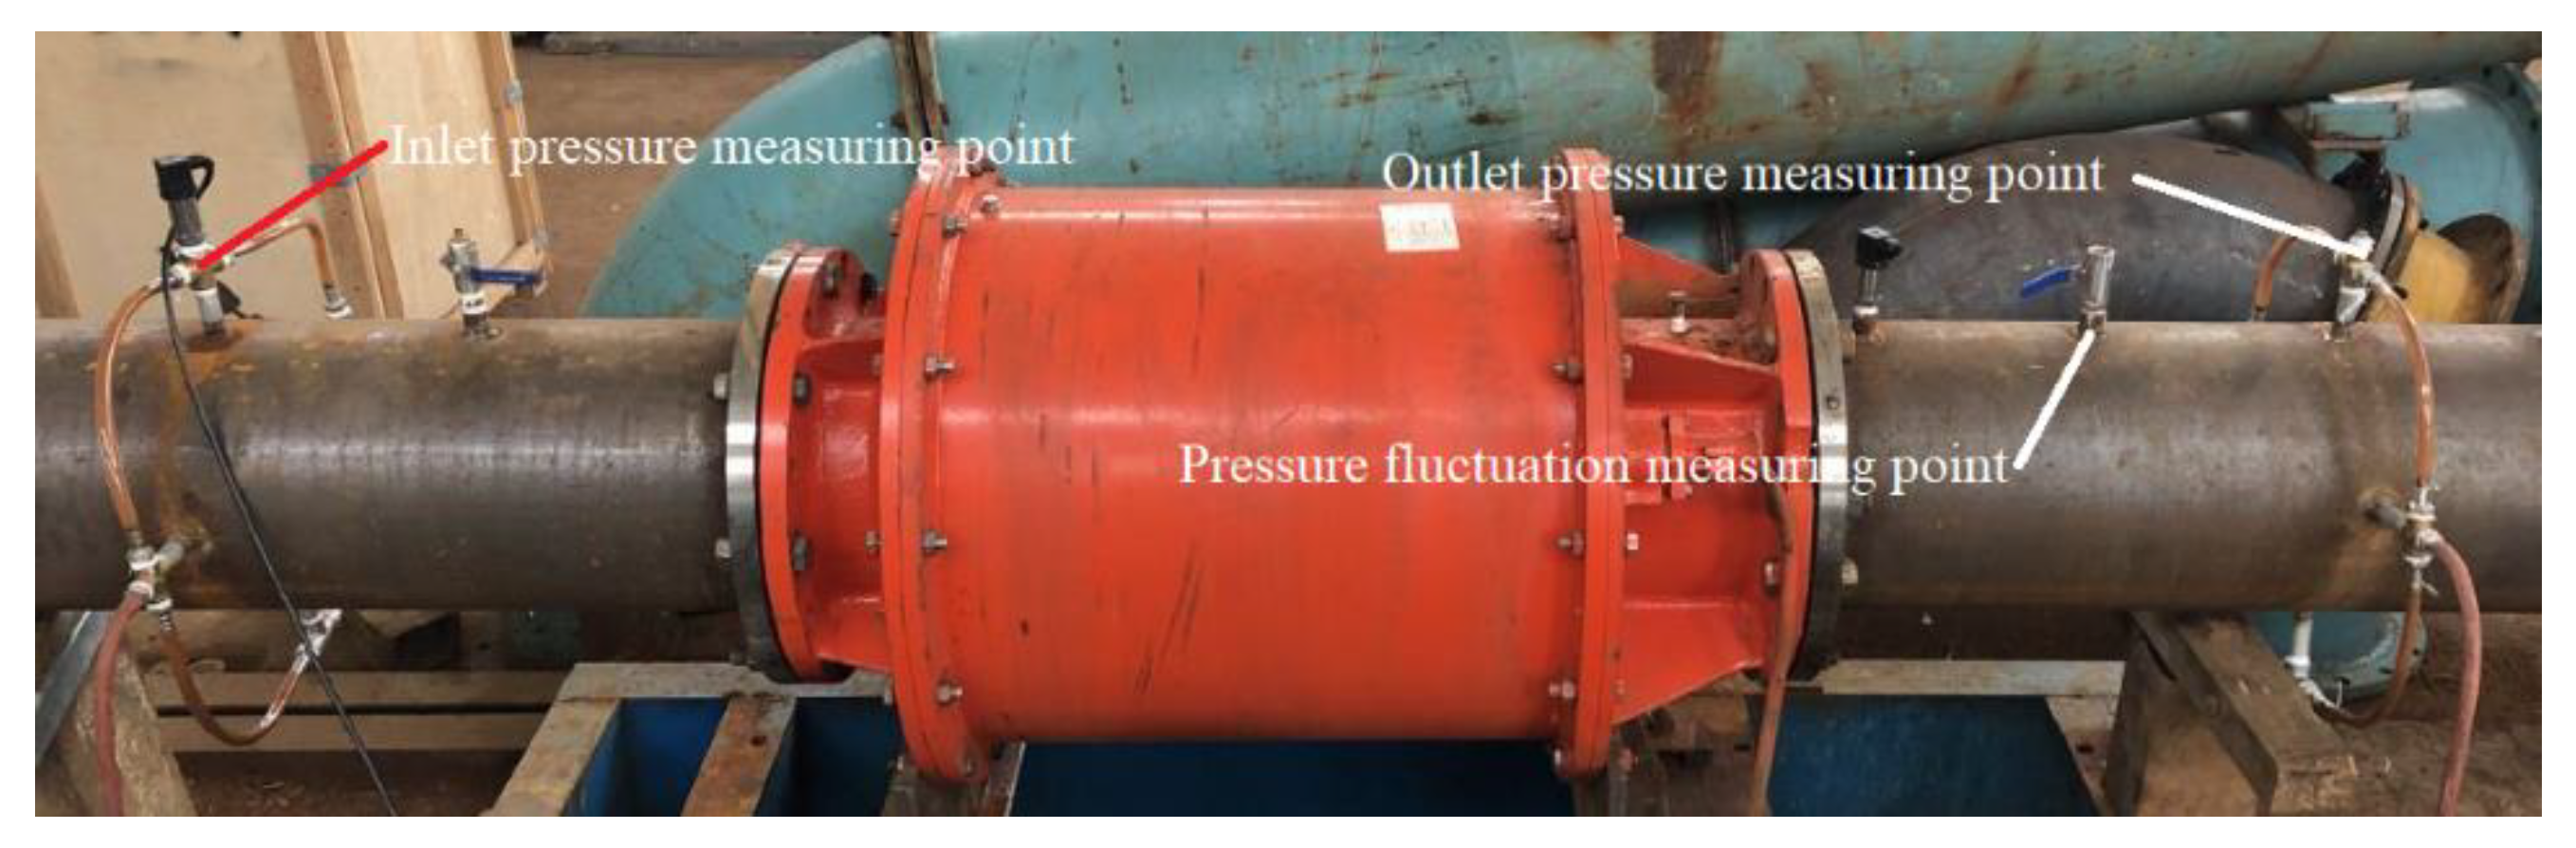
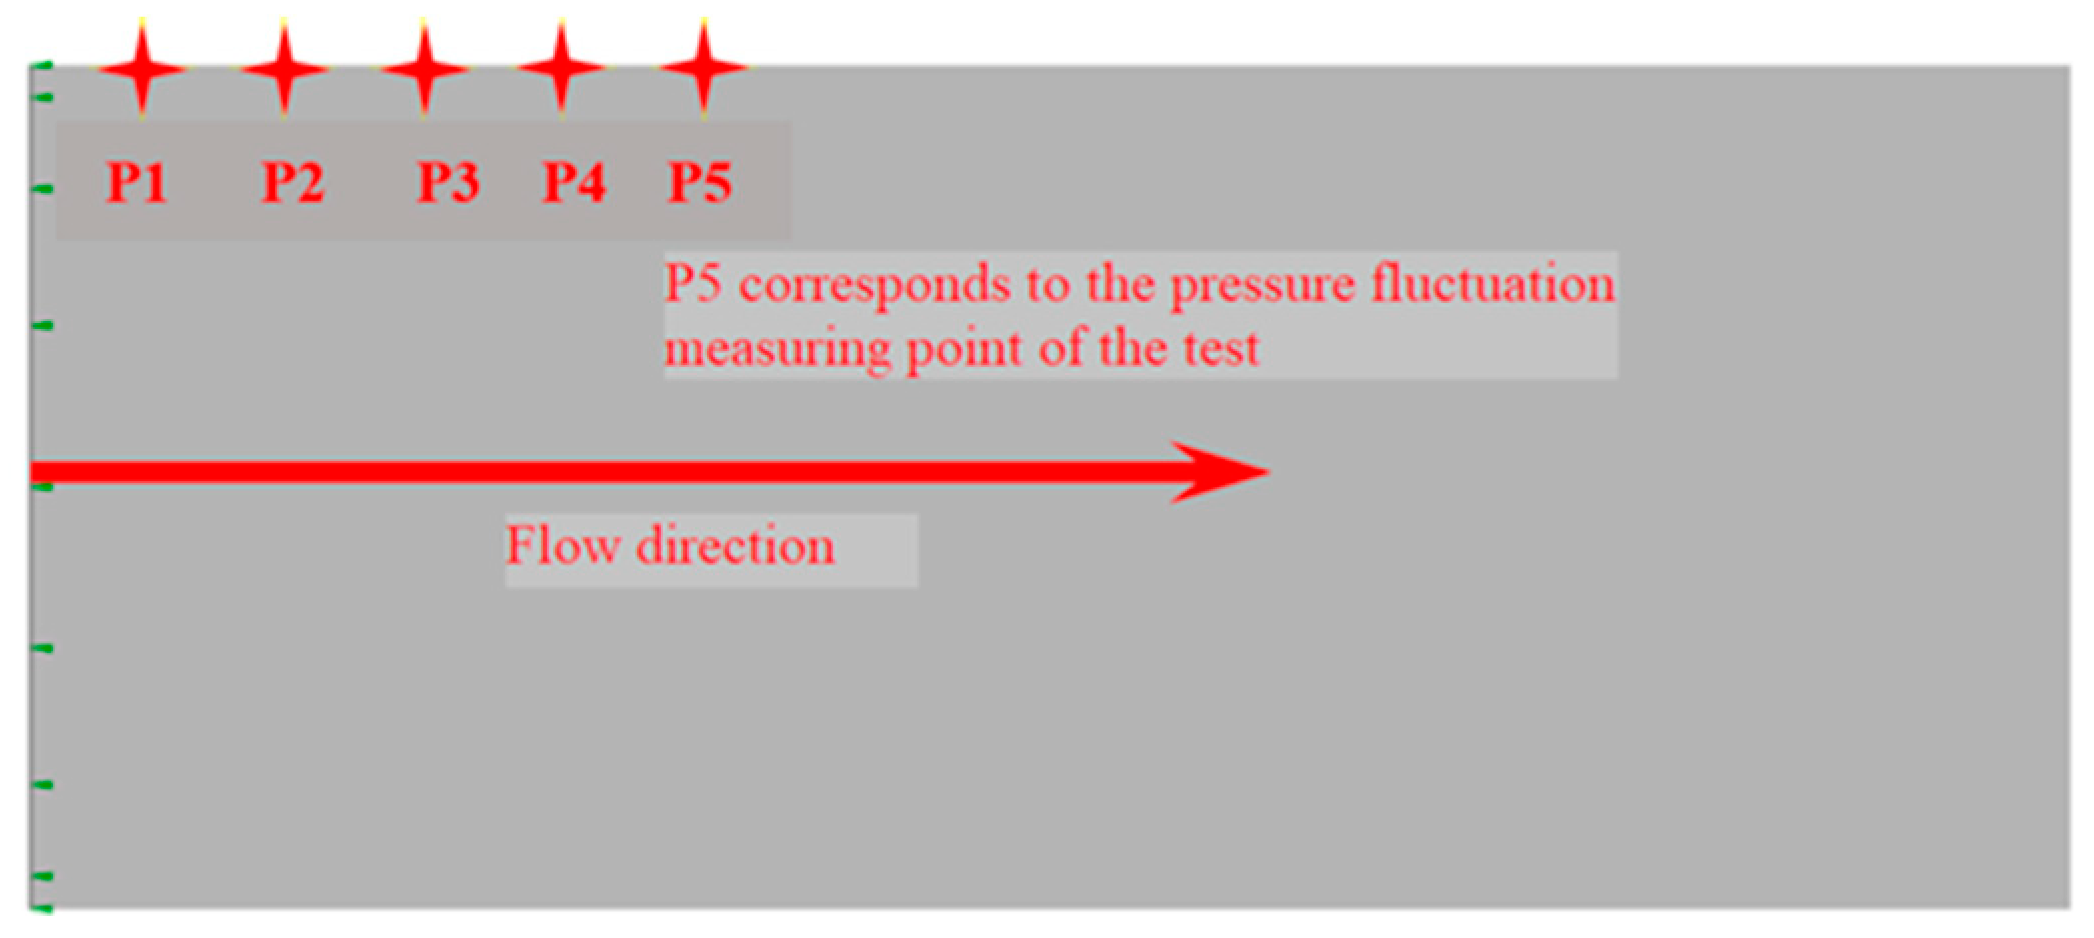
2.3. The Distribution of Pressure Measuring Points

Figure 3 shows the location of measuring points for inlet pressure P1, the outlet pressure P2 and the outlet pressure fluctuation Pout. The inlet pressure measuring point is located at 2D from the propulsion pump inlet and the measuring accuracy of inlet pressure is 0.5%. The outlet pressure measuring point is located at 2D from the propulsion pump outlet and the measuring accuracy of outlet pressure is 0.5%. The pressure fluctuation measuring point is located at 1D from the propulsion pump outlet and the measuring accuracy of pressure fluctuation is 0.25%.

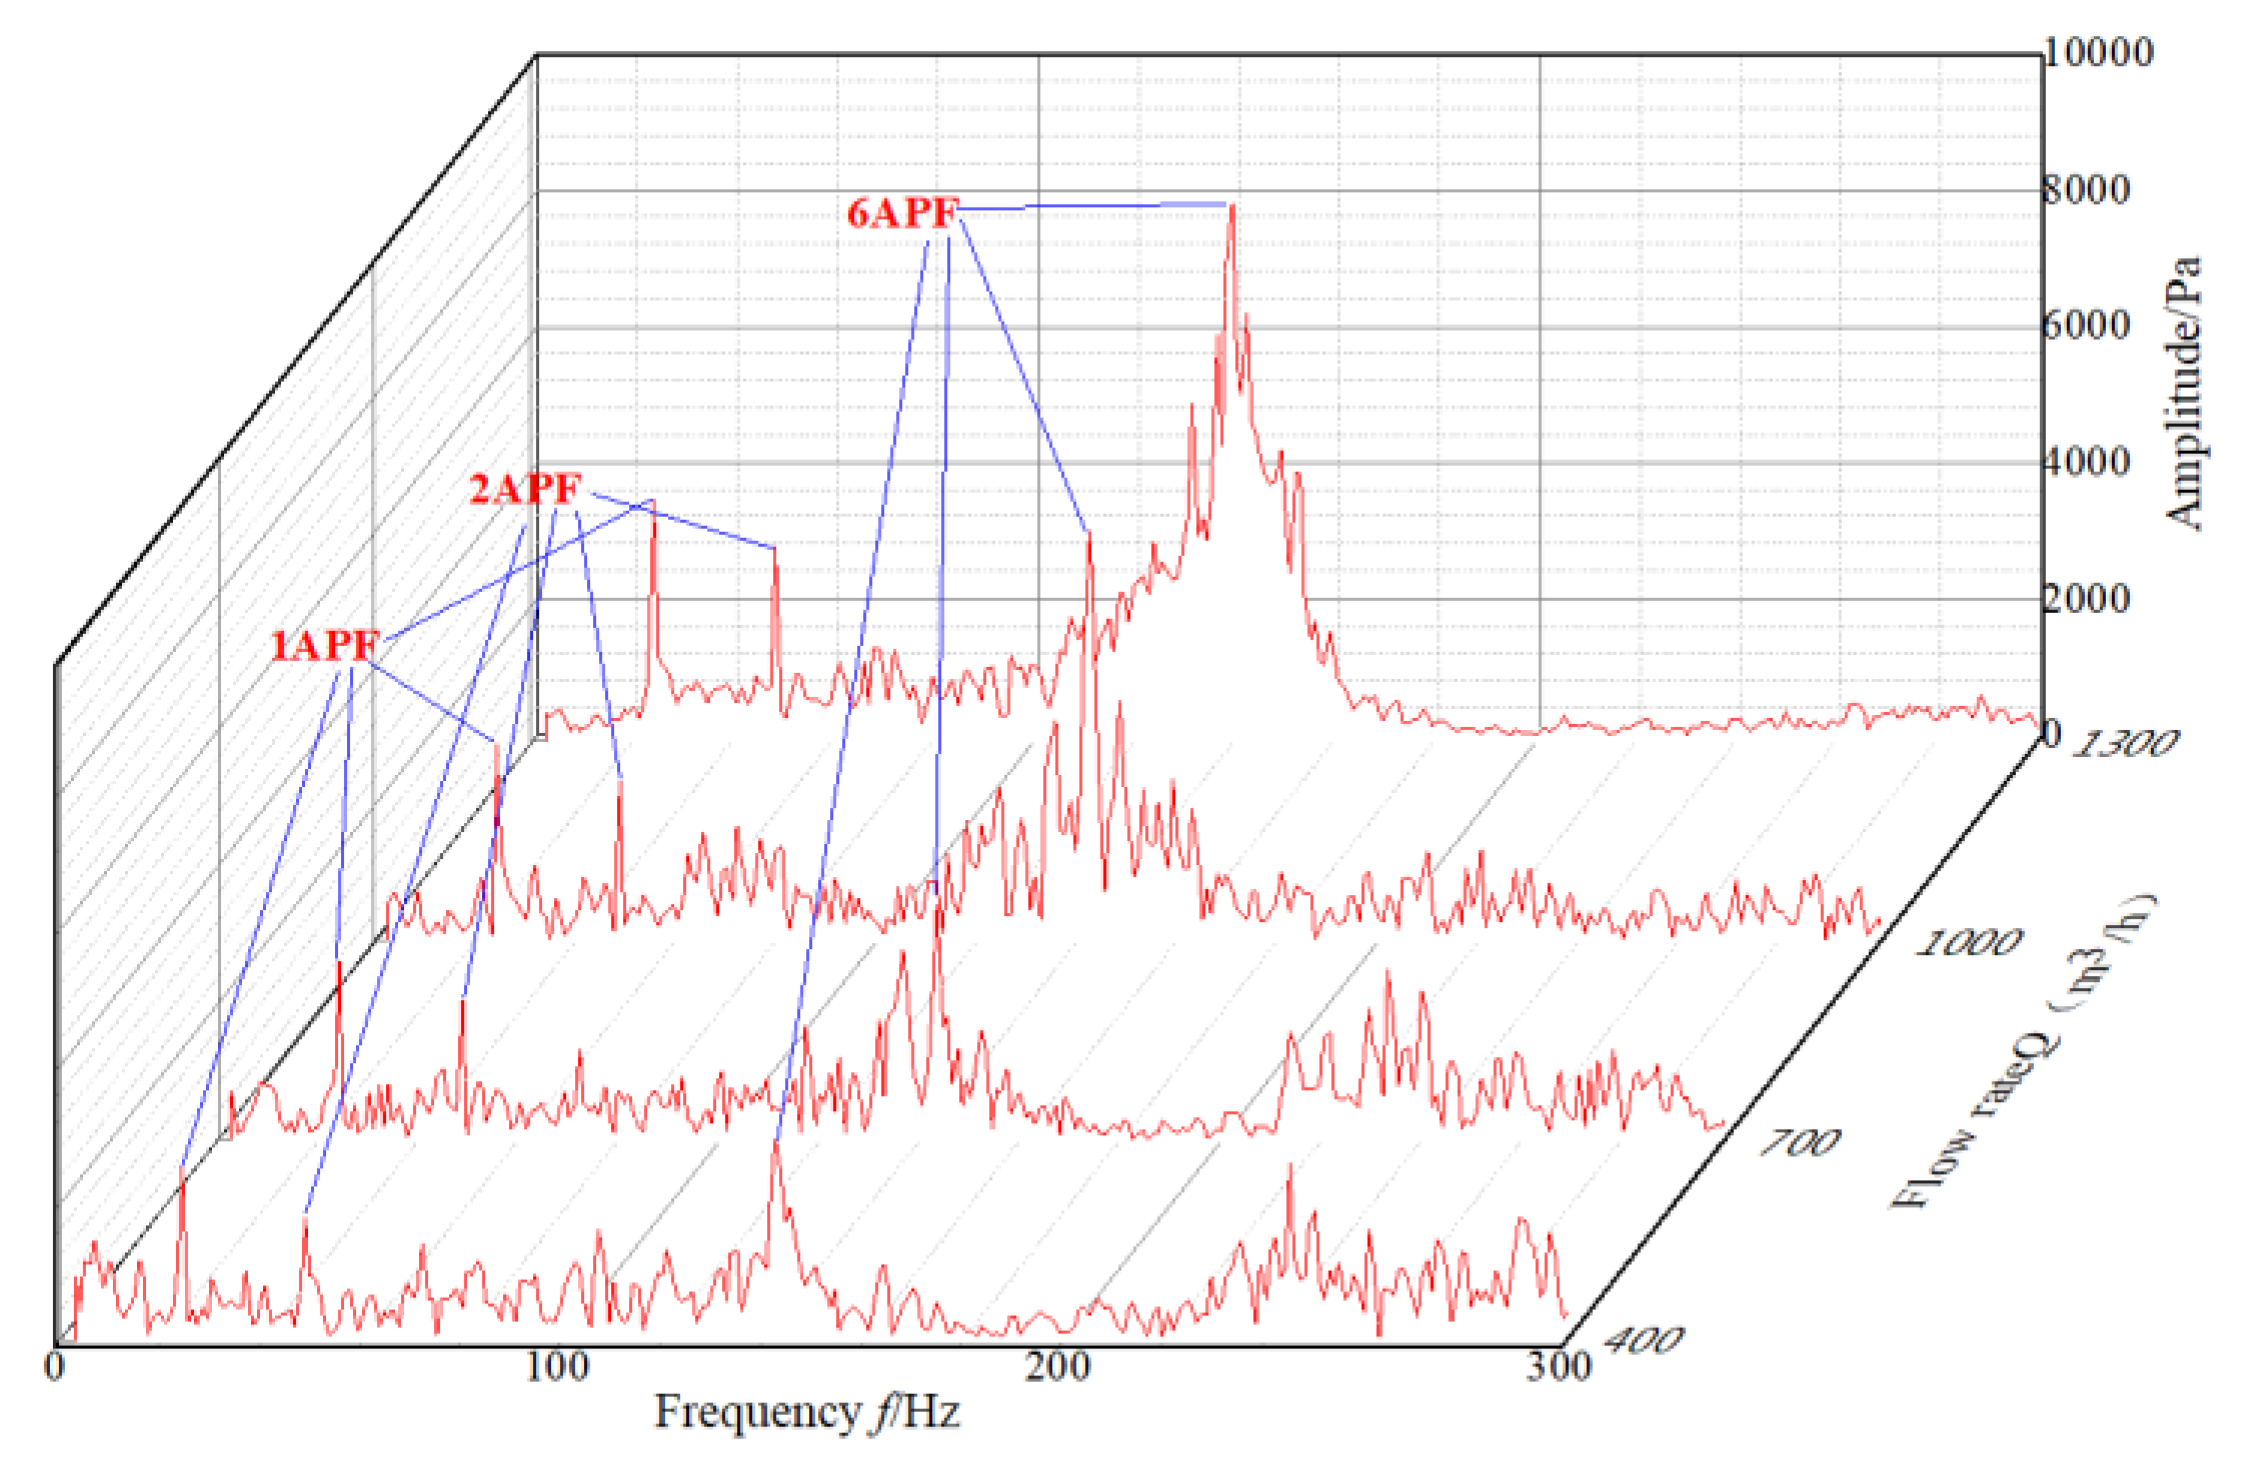
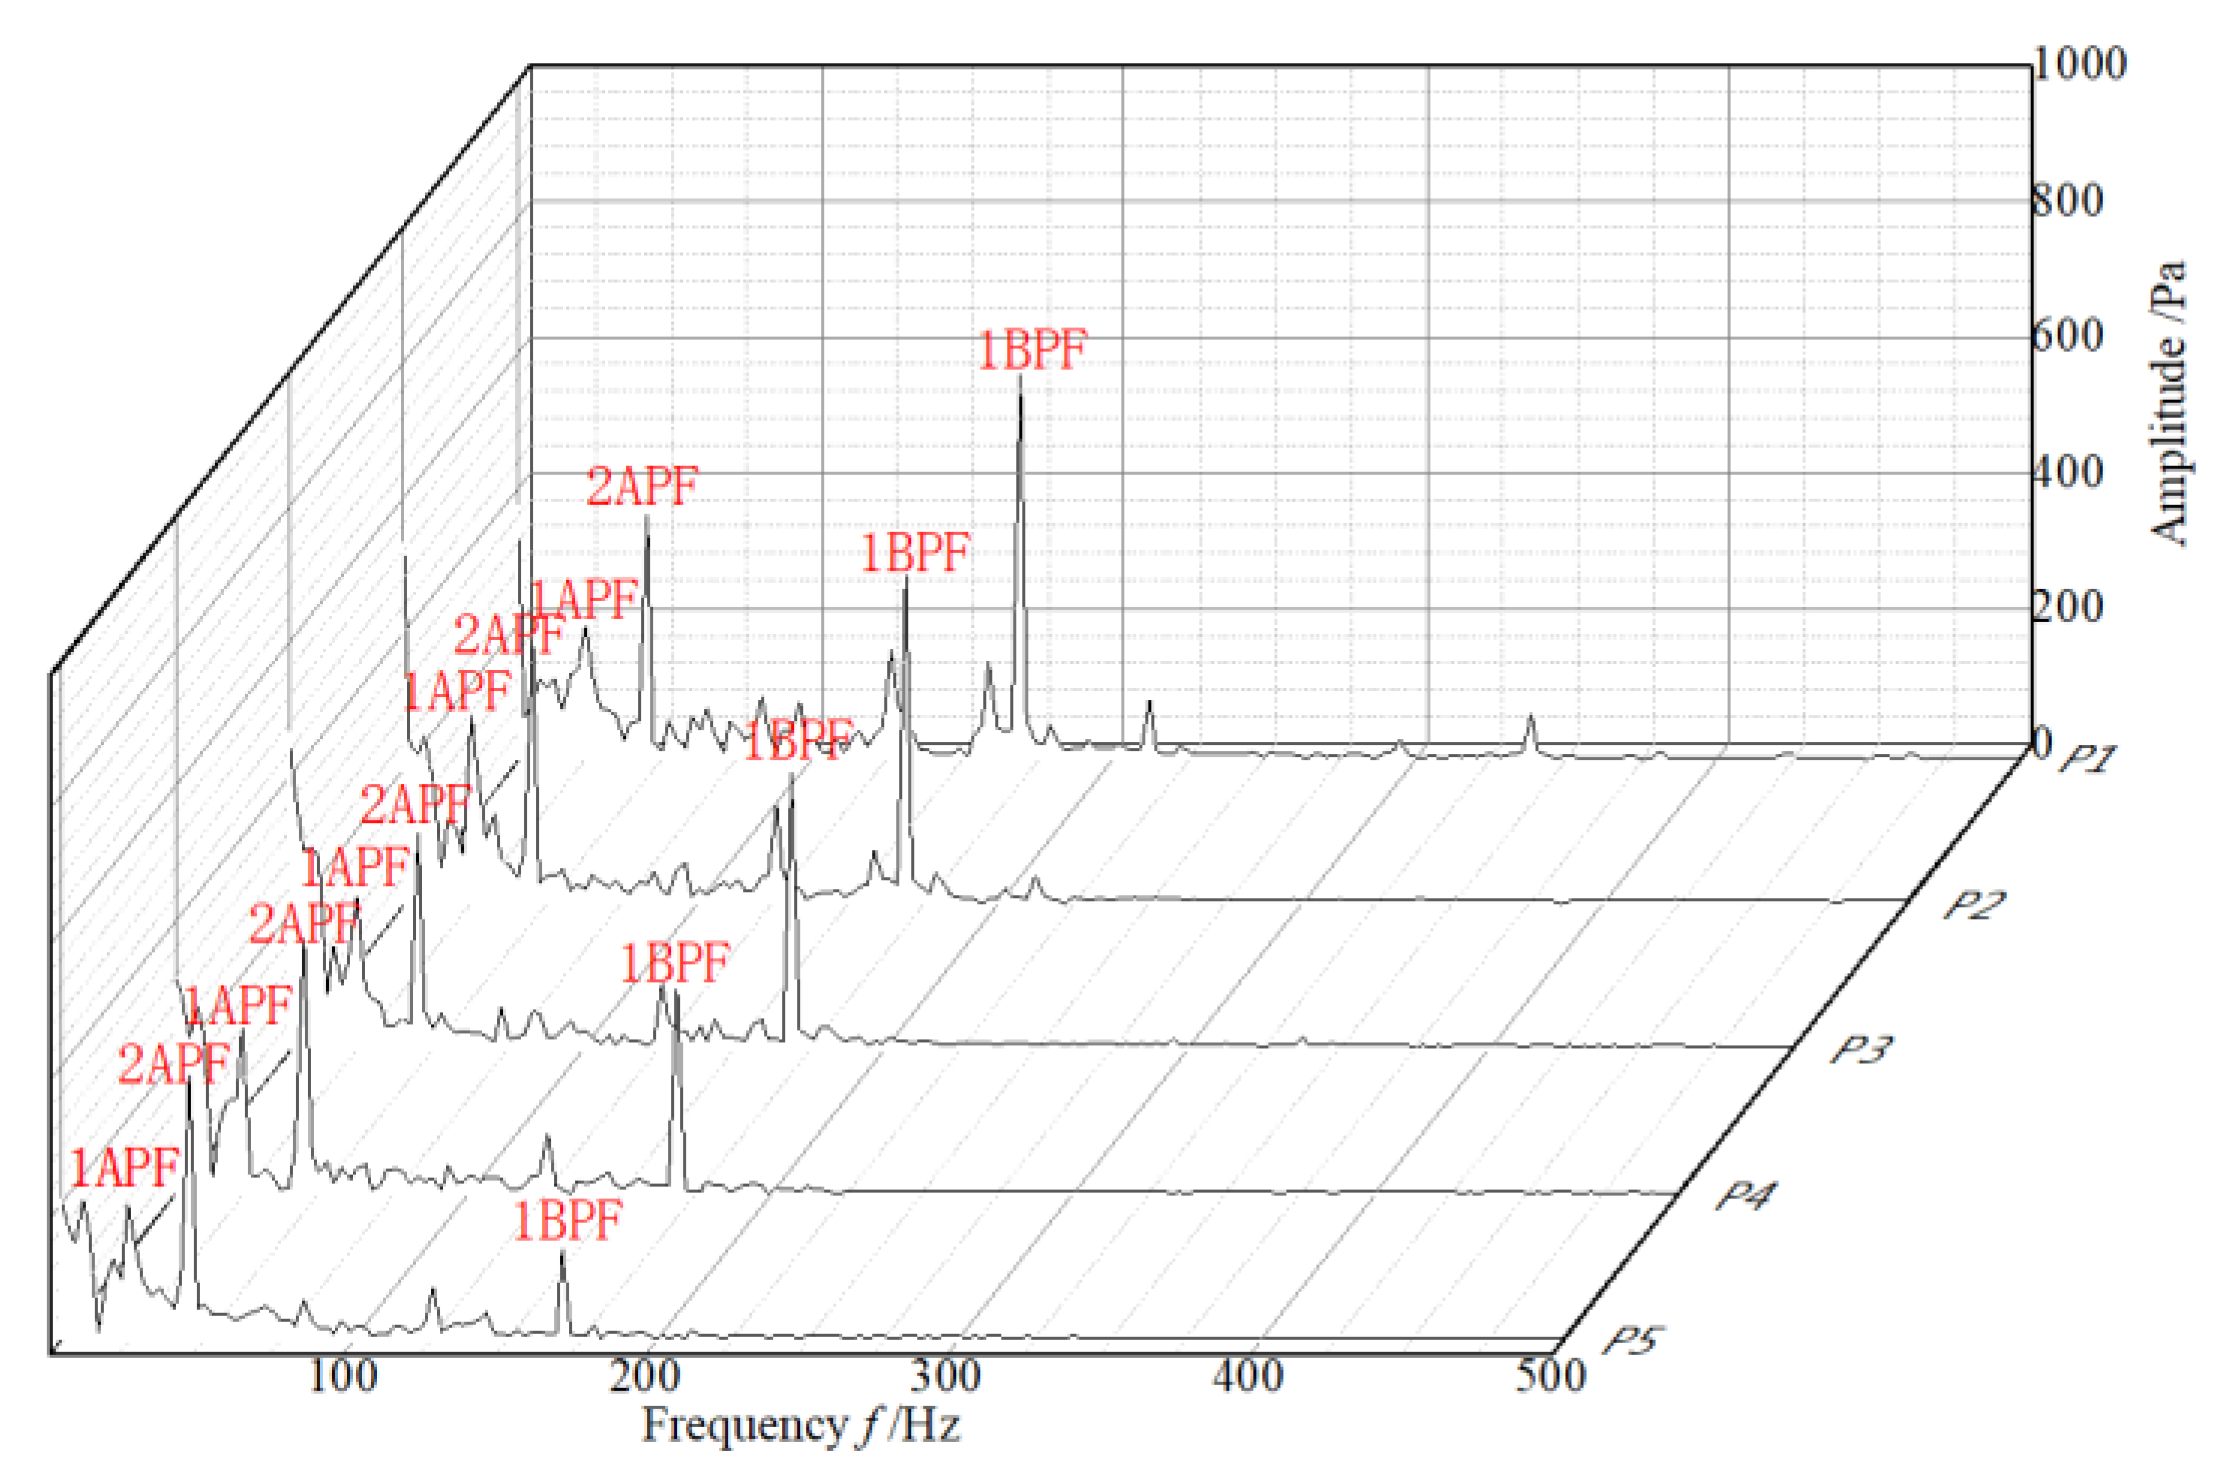
2.4. The Experimental Results of Pressure Fluctuation

Figure 4 shows the frequency distribution of pressure fluctuation at Pout under the flow rates Q = 1300 m3/h, 1000 m3/h, 700 m3/h and 400 m3/h. The rotating speed of the propulsion pump at the power frequency was 1450 rpm, and the corresponding axial passing frequency and blade passing frequencies were 24.2 Hz and 169.4 Hz, respectively.
It can be shown from Figure 4 that the main frequency of pressure frequency is 145 Hz under each flow rate, which is about 6APF. There are some discrete frequencies related to axial passing frequency, such as 1APF and 2APF.
The frequency of 6APF may come from a complex piping system. Generally, the pipeline system has its natural frequency, which does not change with the flow rate [24]. The literature shows the estimation method of pipeline pressure fluctuation [25]. A system with one end connected to the propulsion pump and one end connected to the surge tank has a natural frequency, which can be calculated by Formula (1).
f n = 1 2 π ( n π π / 2 l c ) 2 ( α 2 ρ 0 ) 2 ,   n = 1 ,   2 ,   3 · · ·
c is the speed of sound, m/s; l is the length of the pipe, m; α is the damping coefficient of water; ρ0 is the average density of the liquid, m3/h.
Knowing that the length of the outlet pipeline l = 2.8 m, the speed of sound in the water c = 1500 m/s and n = 1, the first-order frequency f1 = 144.2 Hz of the outlet pipeline of the propulsion pump is obtained by the introduction Formula (1), which is about 6APF and consistent with the dominant frequency of the pressure fluctuation obtained by the experiment. In addition, as the flow rate decreases, the fluctuation intensity in the piping system gradually decreases.

3. The Unsteady Numerical Simulation for Rim Driven Propulsion Pump

The pressure fluctuation of the propulsion pump was numerically simulated to study the unsteady internal flow characteristics of the rim driven propulsion pump by commercial software ANSYS-CFX, and to reveal the mechanism of pressure fluctuation.

3.1. Research Model and Numerical Simulation

3.1.1. Research Model

Figure 5 shows that the numerical calculation model of the rim driven propulsion pump consists of three parts: inlet extension, impeller and outlet extension. The length of the inlet extension is 3D, and the length of the outlet extension is 4D.

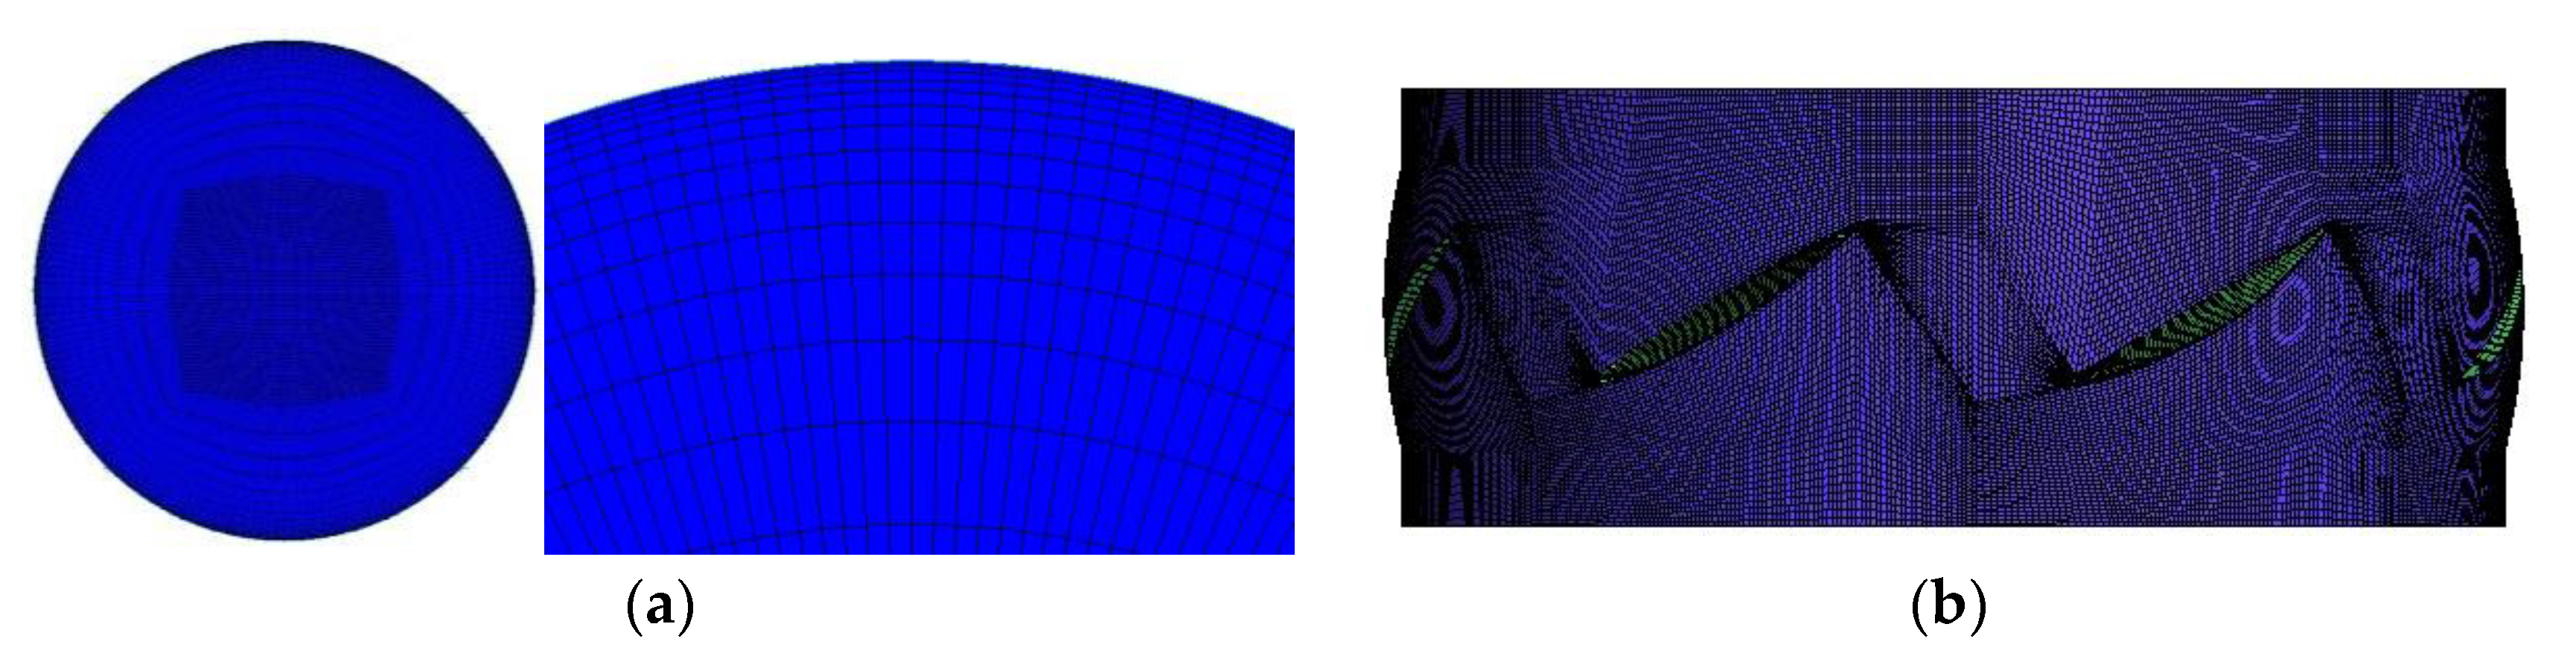
3.1.2. Mesh Division and Calculation Settings

The structured grid is used for grid division of the rim driven propulsion pump. The partial encryptions of the boundary layer are made at the pressure surface, the suction surface, the tip of the blade and the wall of inlet and outlet. The thickness of the first layer of every wall is 0.1 mm to ensure that the calculated Y+ value is between 10 and 100 and Figure 6 shows the grid schematic.
The flow velocity is set as the inlet boundary condition and the outlet boundary condition is 1 atm. The near wall area adopts the non-slip wall. The turbulence model is SST. The calculation time step is 0.000229885 s, which is 2°. The total time of calculation is 0.669 s, which is 16 rotation periods.

3.1.3. The Distribution of Pressure Monitors

In order to study the pressure fluctuation of the outlet axial flow, five pressure monitoring points are set in the outlet as shown in Figure 7, which are named as P1, P2, P3, P4 and P5. The axial distances of the 5 monitoring points from the impeller are 0.1 m, 0.15 m, 0.2 m, 0.25 m and 0.3 m, respectively.

3.1.4. Grid Independence Test

As shown in Table 1, taking the head of the propulsion pump as the standard, this manuscript divides the propeller into 5 sets of different numbers of grids to check the independence of the number of grids. Table 1 shows that the influence of the number of grids on the calculation results gradually decreases, and the deviation of the head prediction is within 3%, while the total of the grids is 4,690,310 when choosing the third for subsequent calculations after considering the calculation time and accuracy.

3.2. Analysis of Numerical Simulation

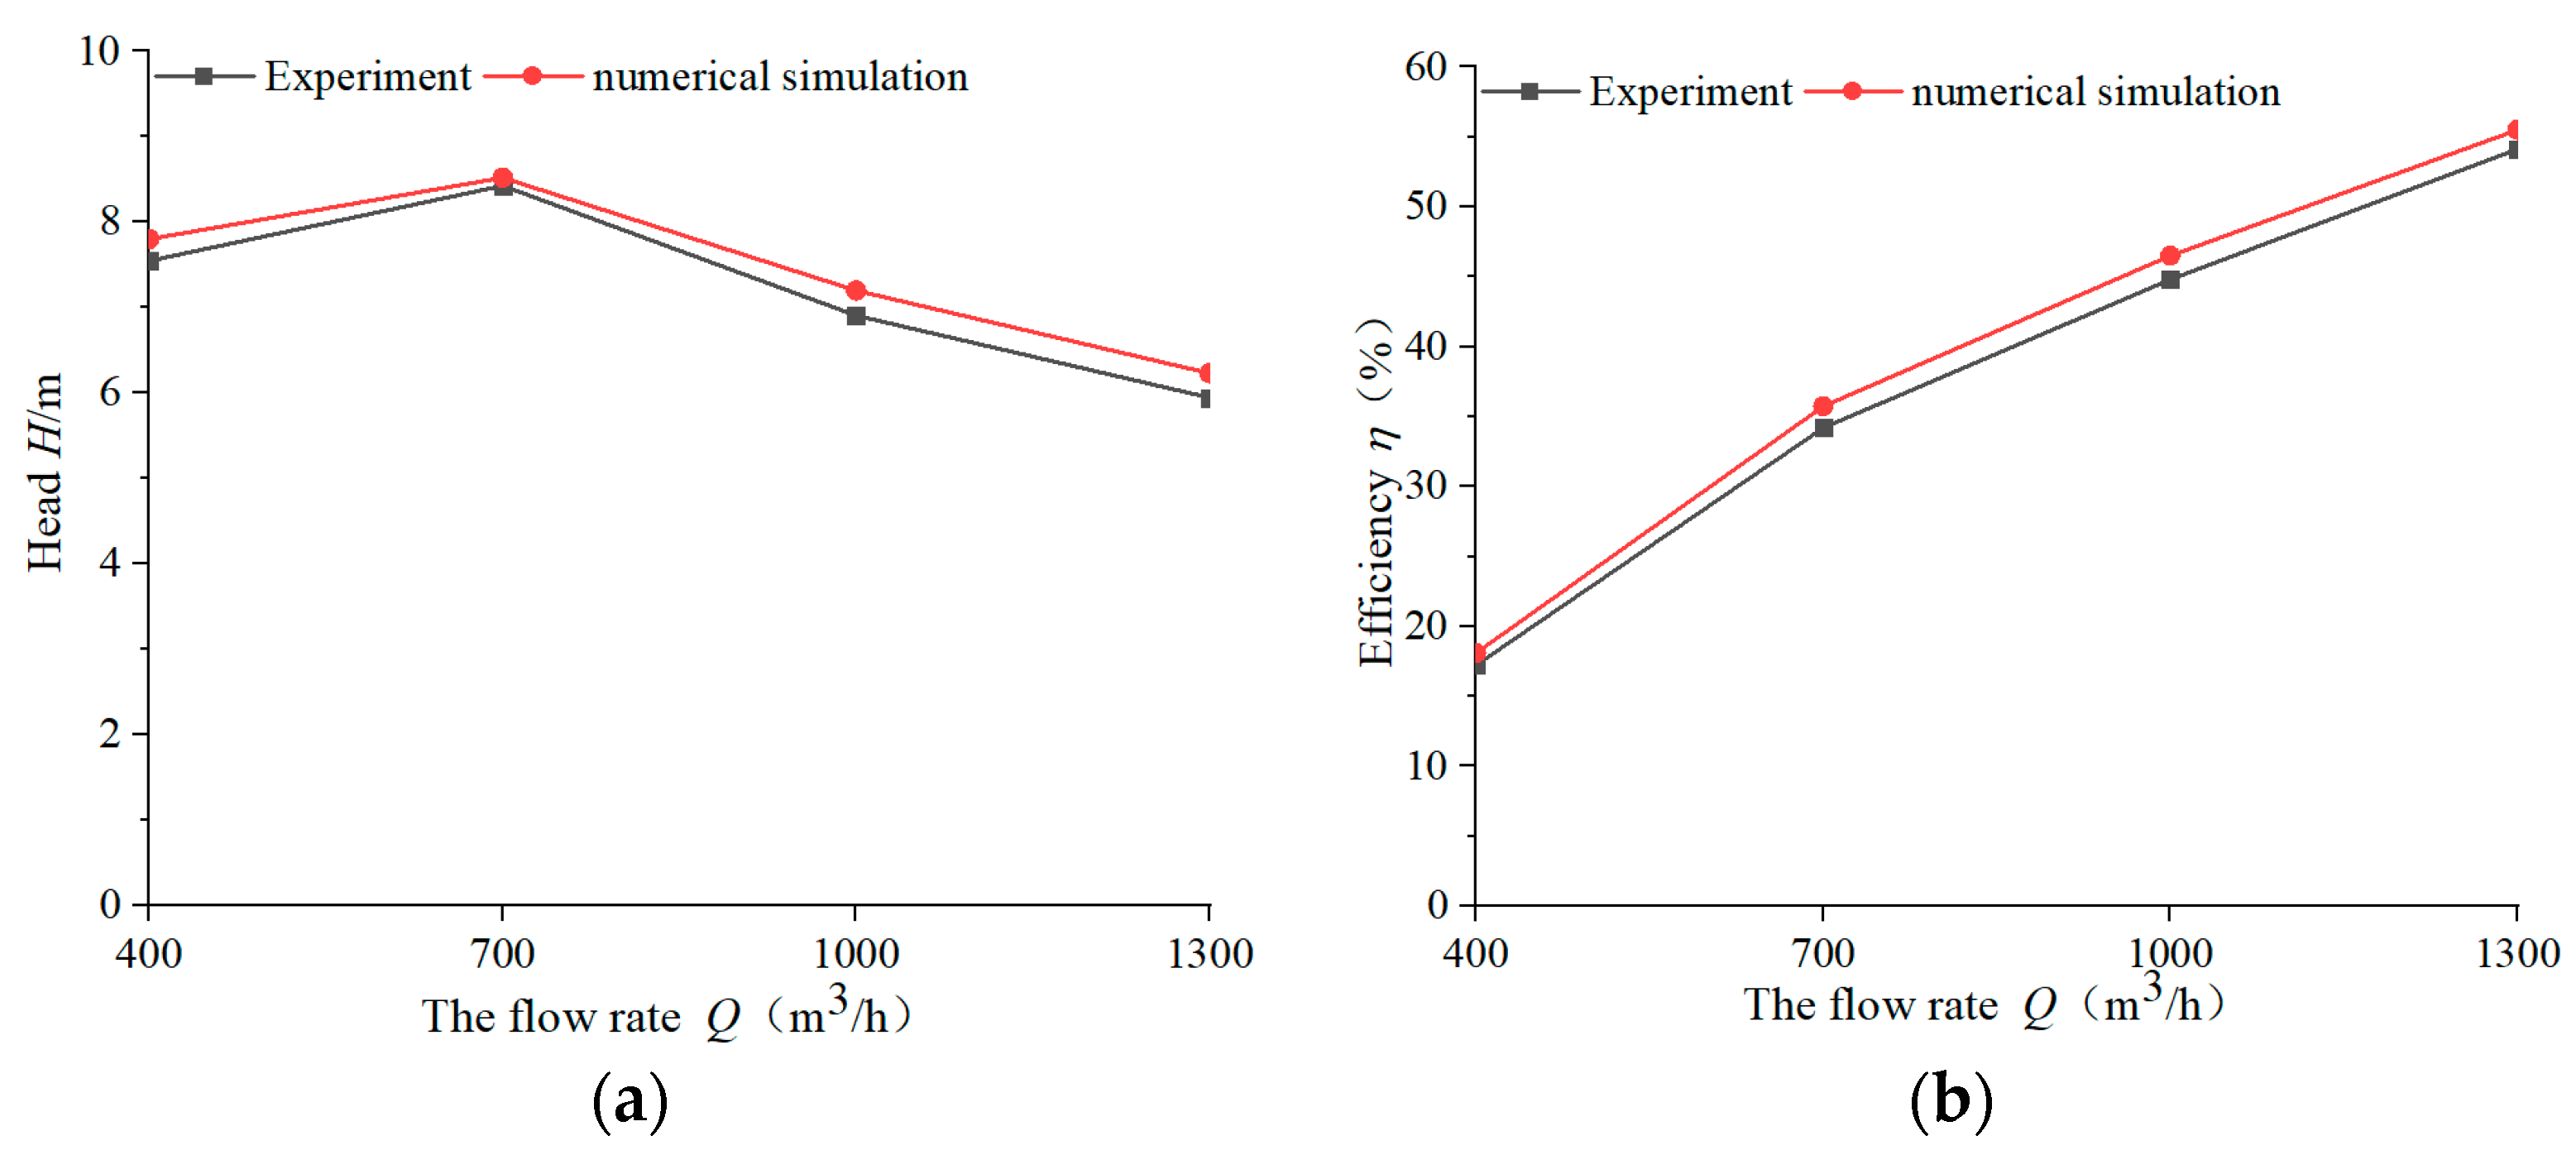
3.2.1. Analysis of External Characteristics

Figure 8 shows the comparison of the numerical simulation and experiment of external characteristics.
The head of the numerical simulation is larger than the experiment under the same flow rate condition. Meanwhile, the efficiency has a similar trend as the head. The head relative deviation of each flow rate condition is within 5% between the numerical simulation and experimental results. Therefore, the model established in this research is accurate and reliable.

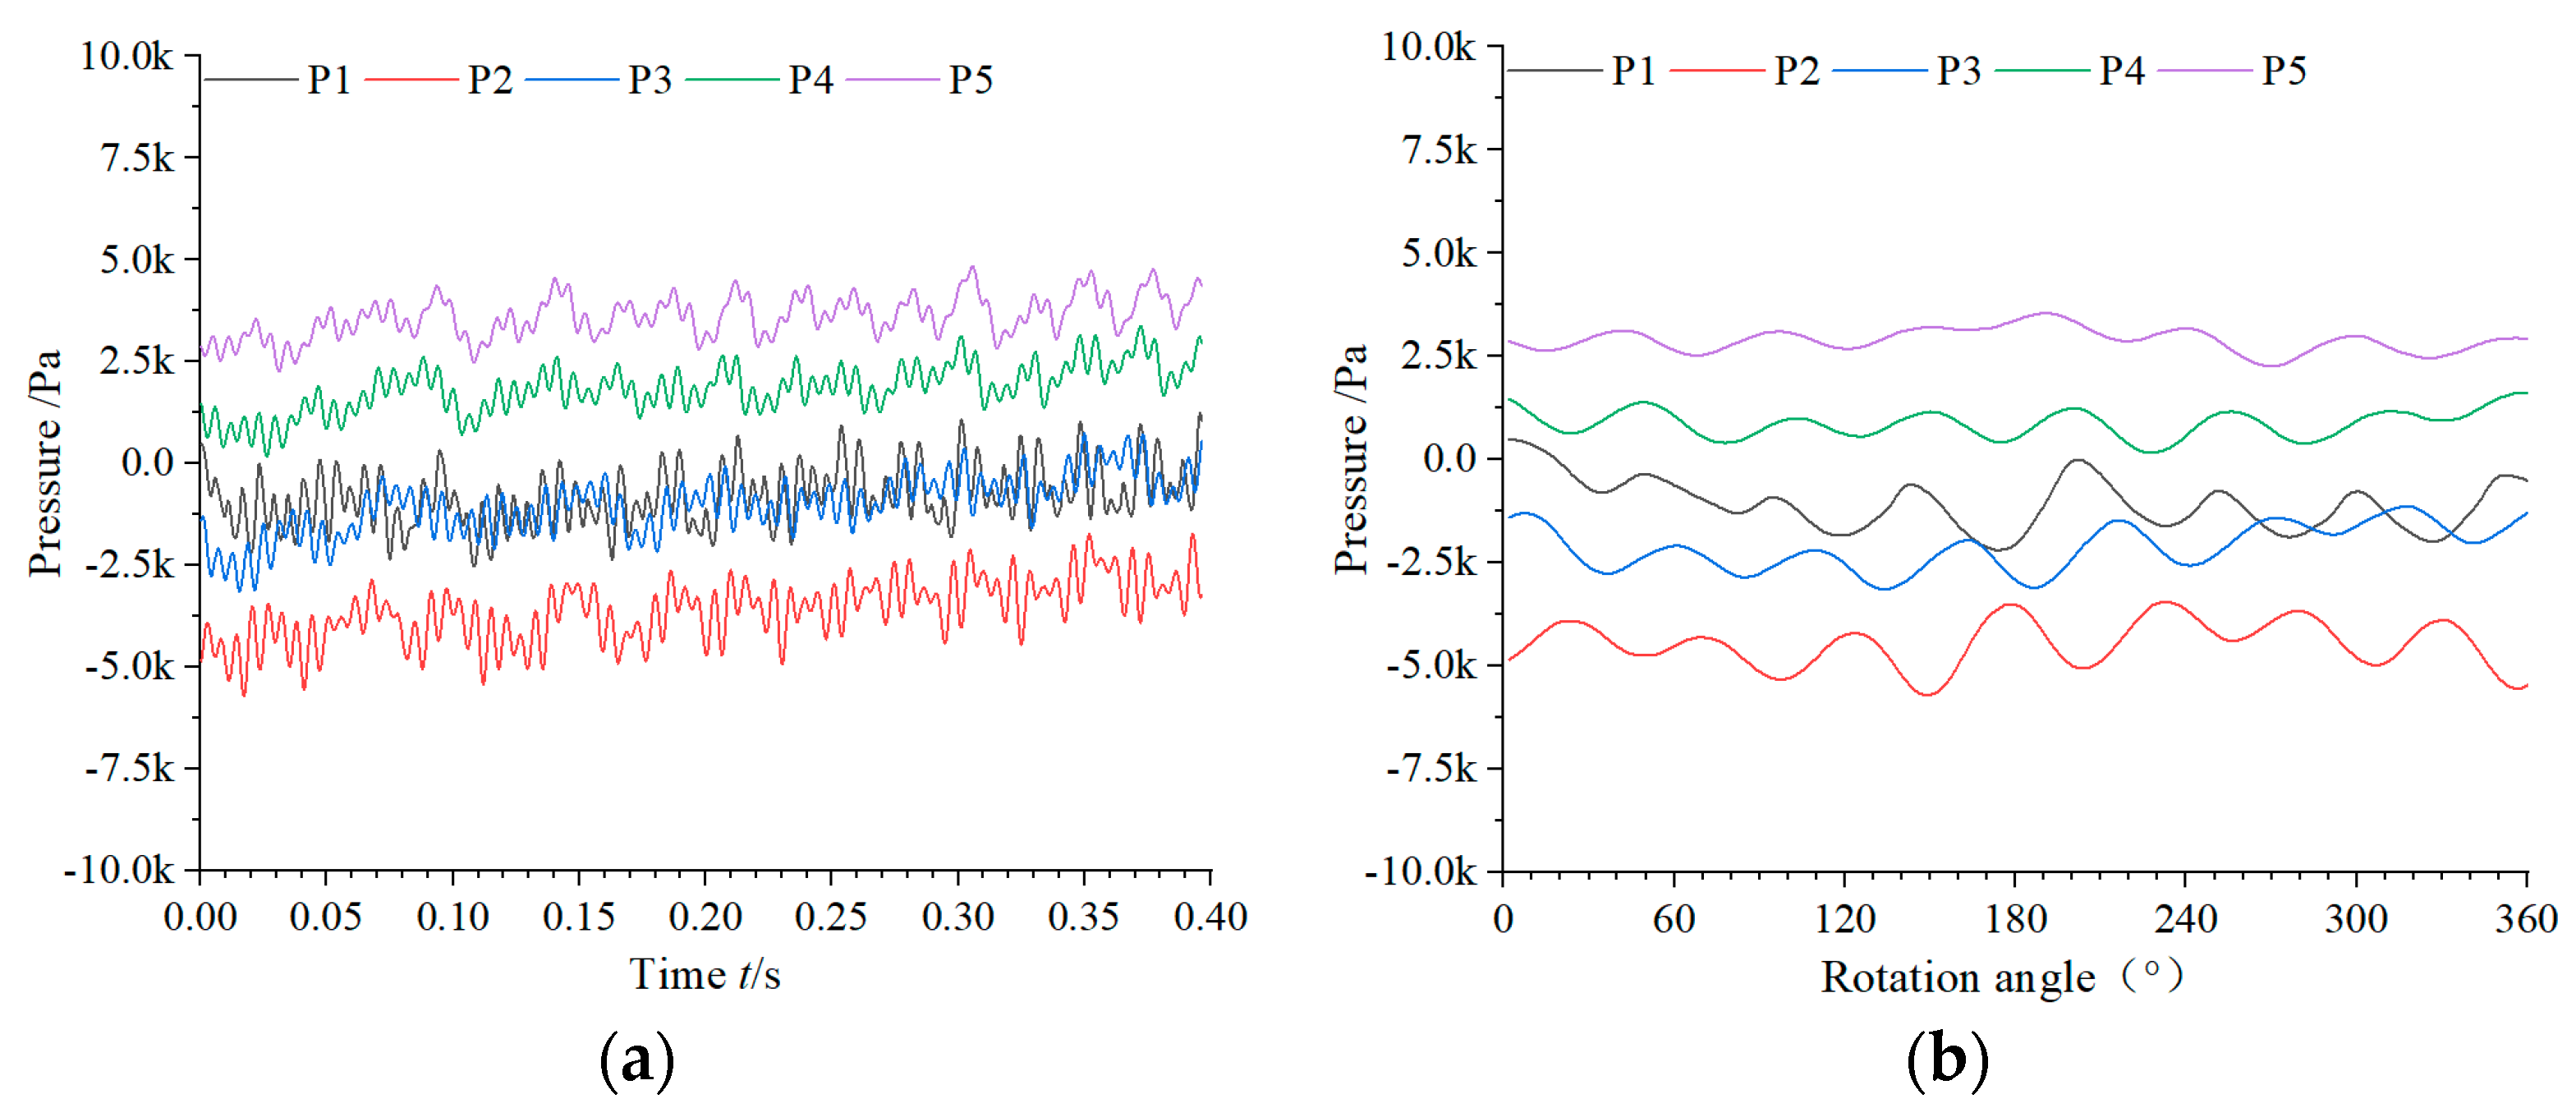
3.2.2. Analysis of Simulation for Pressure Fluctuation

(1) The time domain of pressure fluctuation
The pressure fluctuations of P1, P2, P3, P4, P5 are normalized to analyze the unsteady characteristics of the pressure fluctuation, and the pressure of the first rotating cycle is selected to typical analysis. Figure 9 shows the time domain of the pressure fluctuation at a flow rate of Q = 1300 m3/h.
It can be seen from Figure 9 that the pressure at each monitoring point exhibits periodic fluctuations, the pressure level firstly decreases and then increases along the axial direction, and the pressure level at P2 is the smallest. There are seven crests and troughs in one rotation period, indicating that two adjacent blades pass through the same measuring point, which will cause periodic pressure fluctuations at the measuring point. However, the pressure will be affected by some flow structures, destroying the periodicity of the waveform and resulting in an irregular sinusoidal waveform in the pressure–time domain. Along the outlet axis, the periodicity of the time domain waveform becomes weaker and weaker, which indicates that the energy of the blade wake structure gradually dissipates and its effect on the downstream flow field is gradually reduced.
(2) Frequency analysis of pressure fluctuation
The frequency domain of pressure fluctuation of every monitoring point under the designed flow rate conditions by FFT (Forward Fourier Transform) are shown in Figure 10.
The main frequency of P1, P2 and P3 is 7APF, which is 1BPF. The frequency corresponding to the secondary main frequency is 46.2 Hz, which is about 2APF, and is accompanied by a small amplitude of 1APF. With the increase in the axial distance from the impeller outlet, the main frequency becomes 2APF at P4 and P5, and the secondary main frequency is 1BPF, with a small amplitude of 1APF. It can be seen from the above that the amplitude of 1BPF decreases as the axial distance from the propeller outlet increases, indicating that the effect of the blade wake on the downstream flow becomes smaller and smaller. When the distance exceeds 1D, the BPF characteristics basically disappeared.
The pressure fluctuation at 1D from the impeller outlet is mainly characterized by 2APF and 1APF in the low frequency band. The frequency domain distribution of pressure fluctuation in the low frequency band is in good agreement with the experimental results.

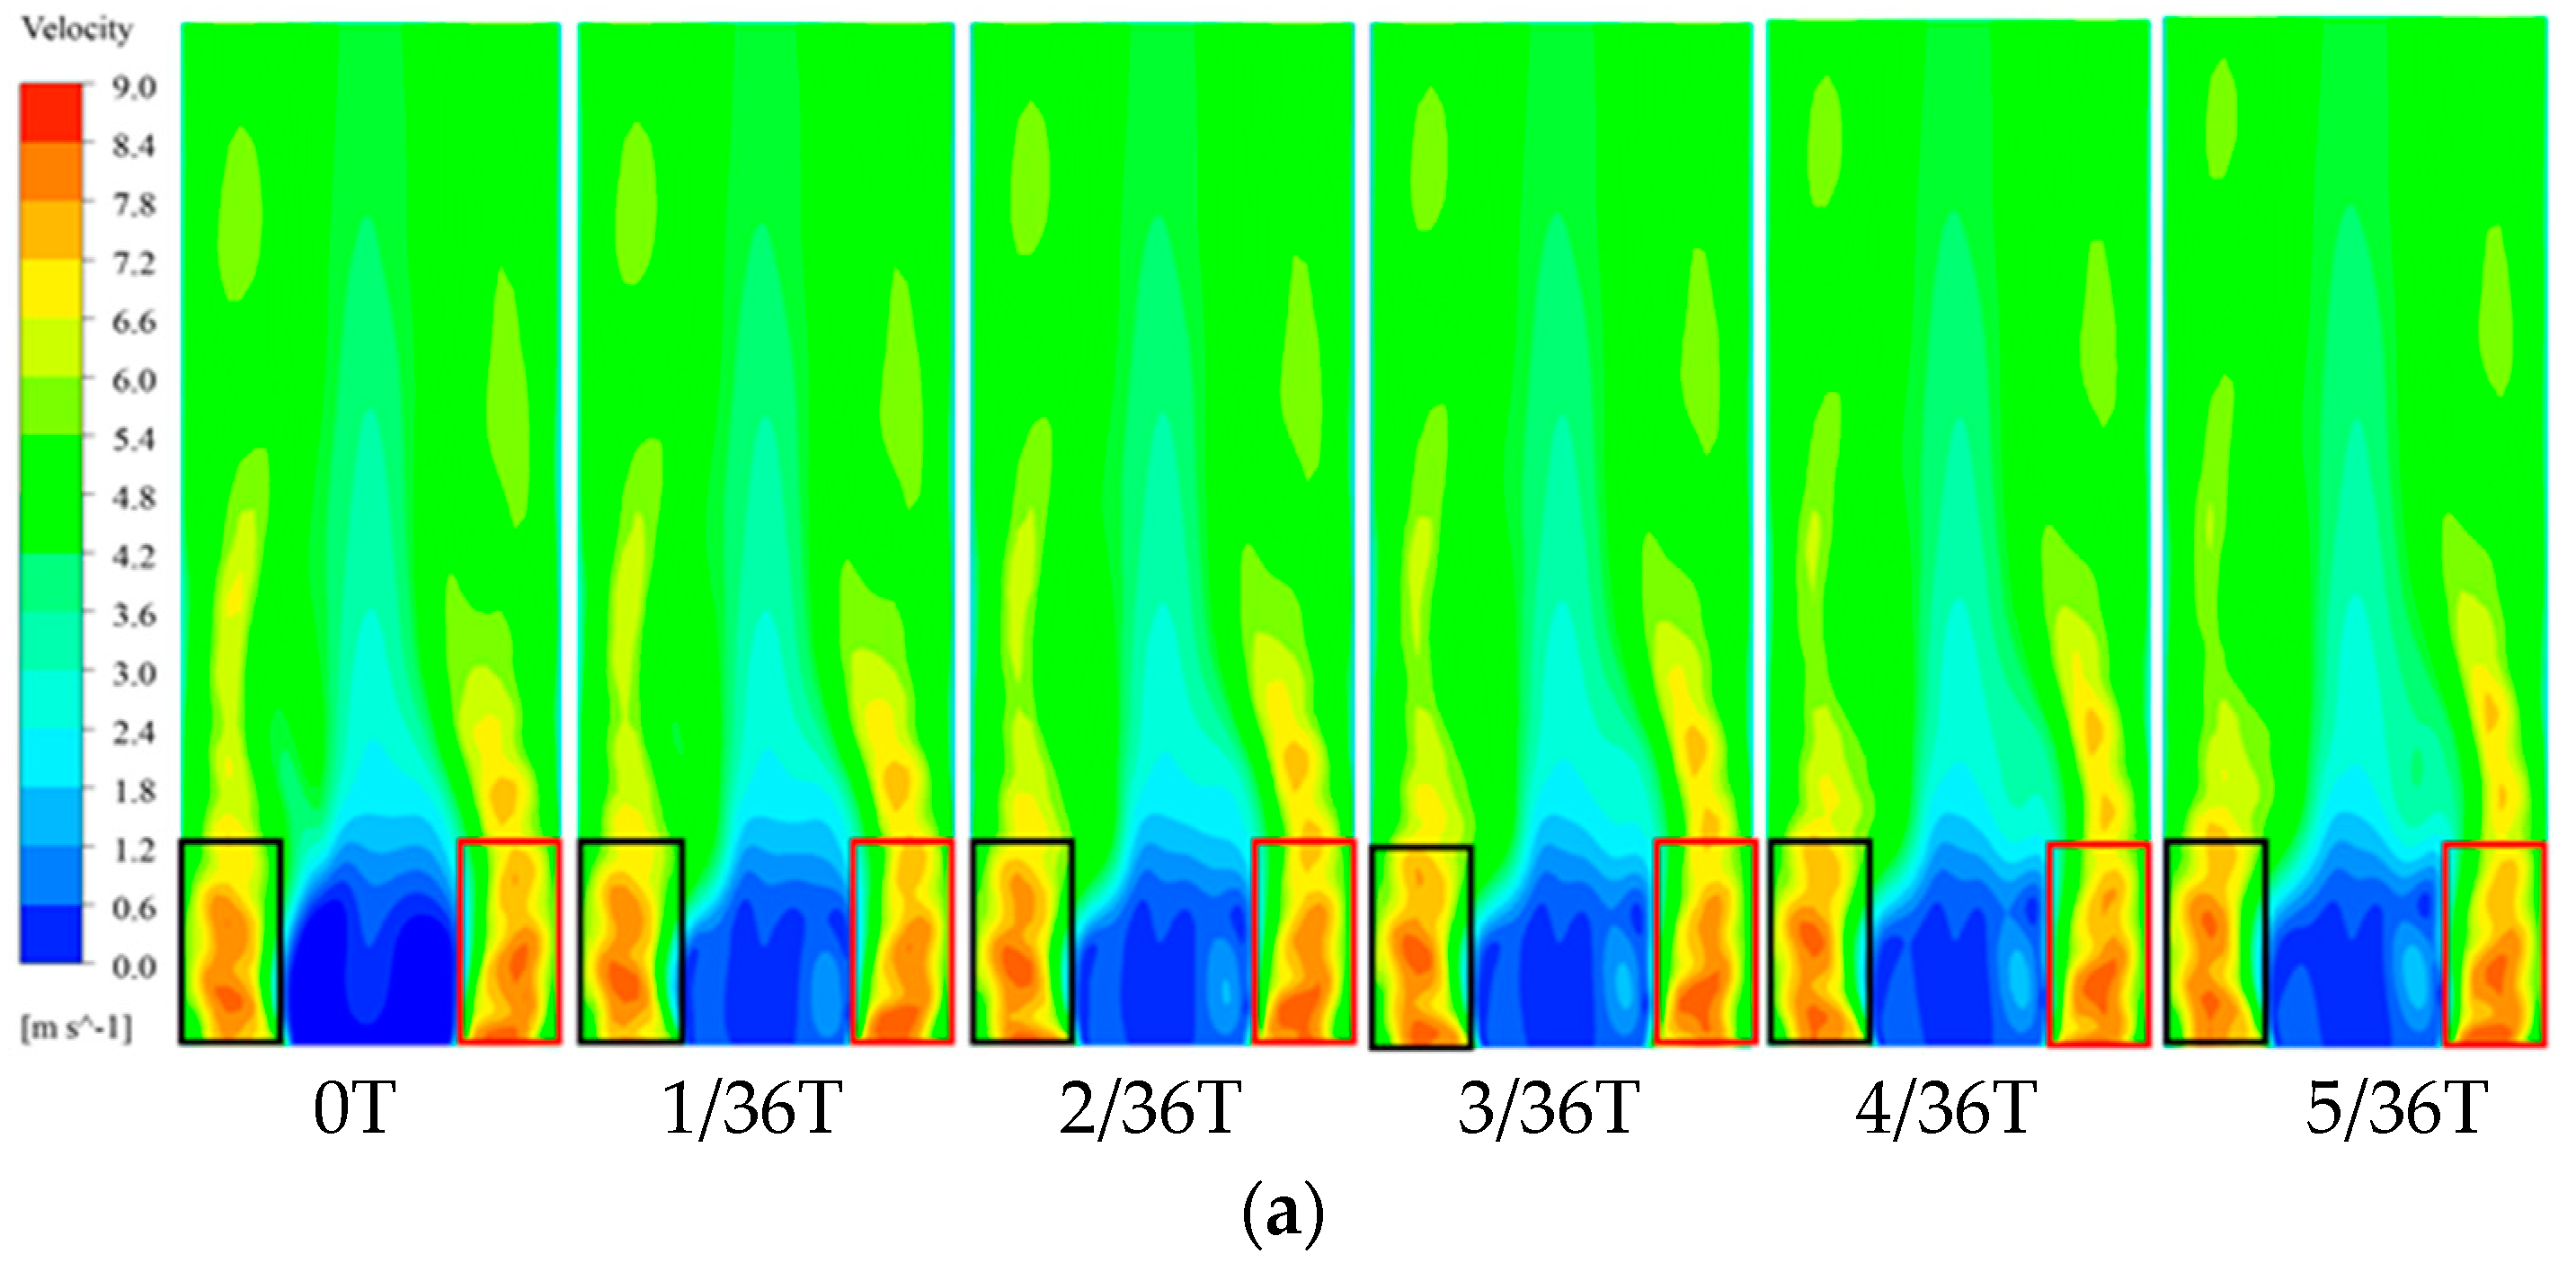
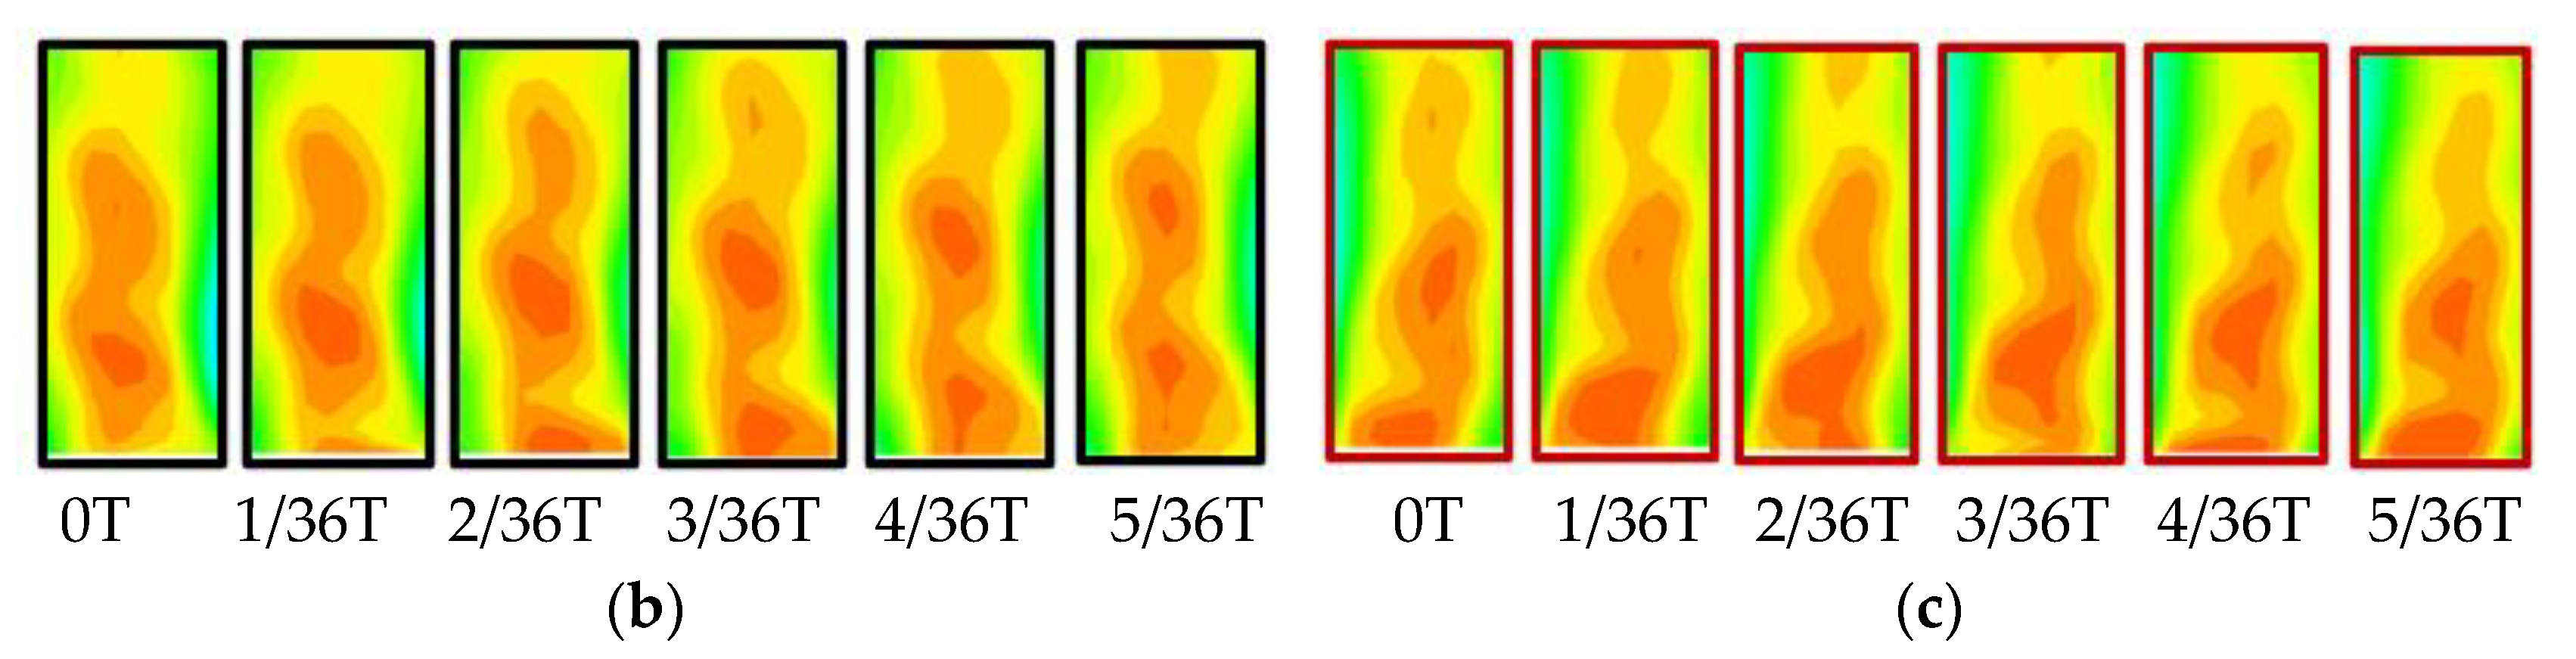
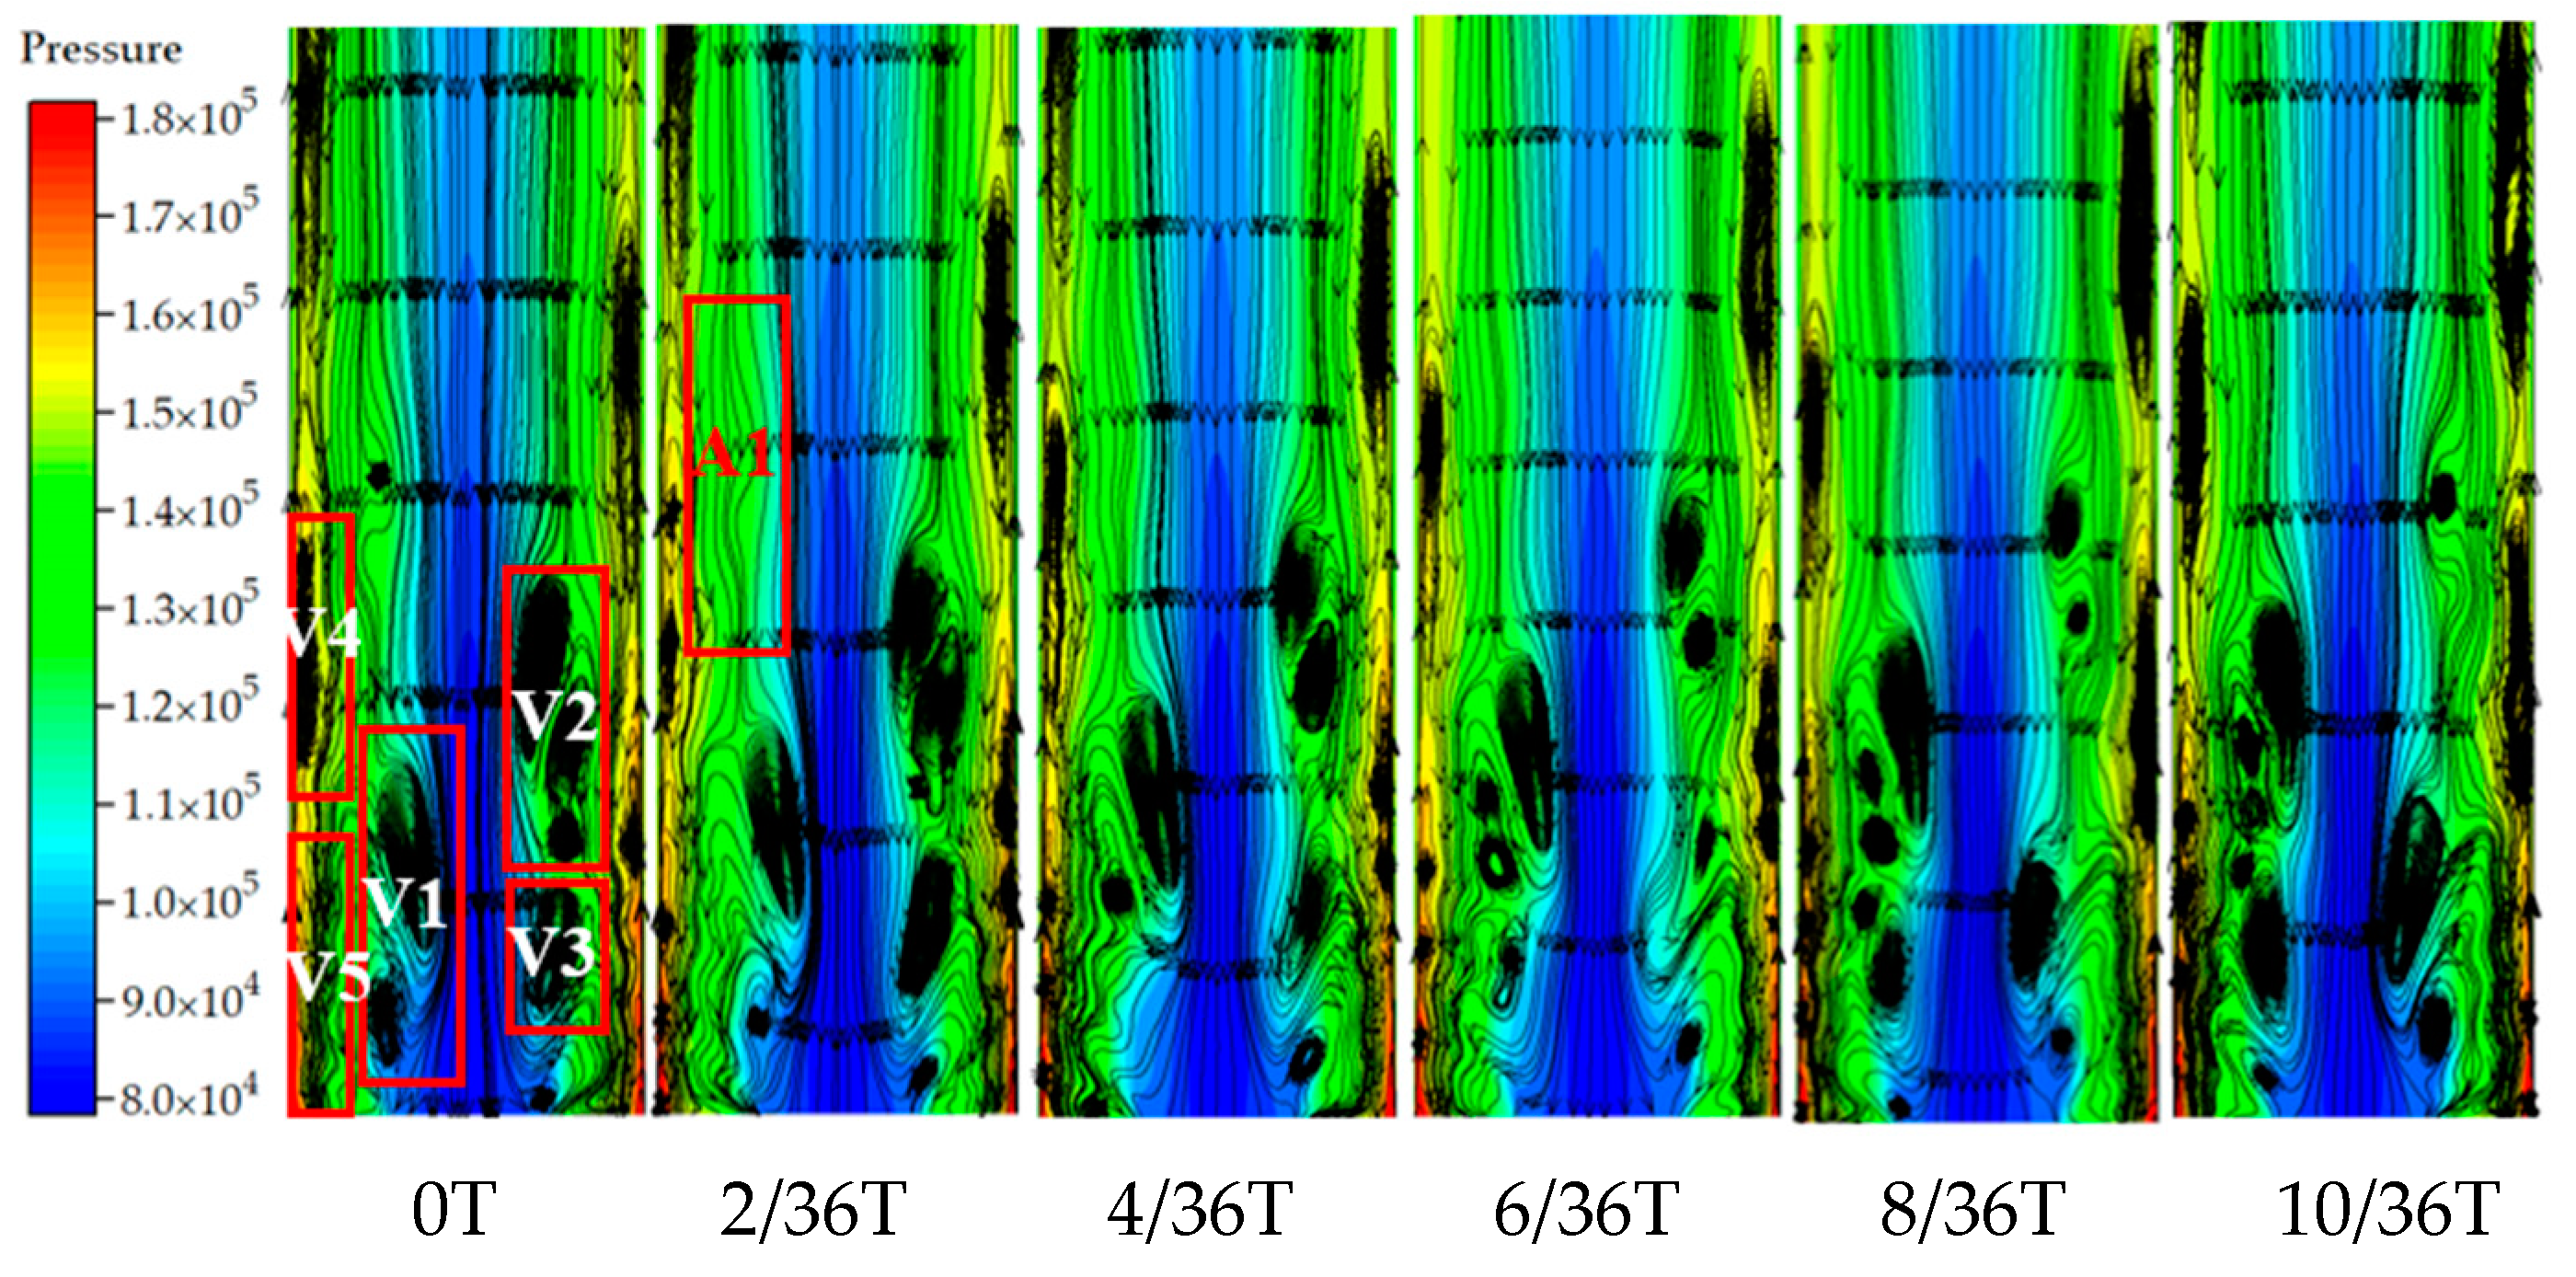
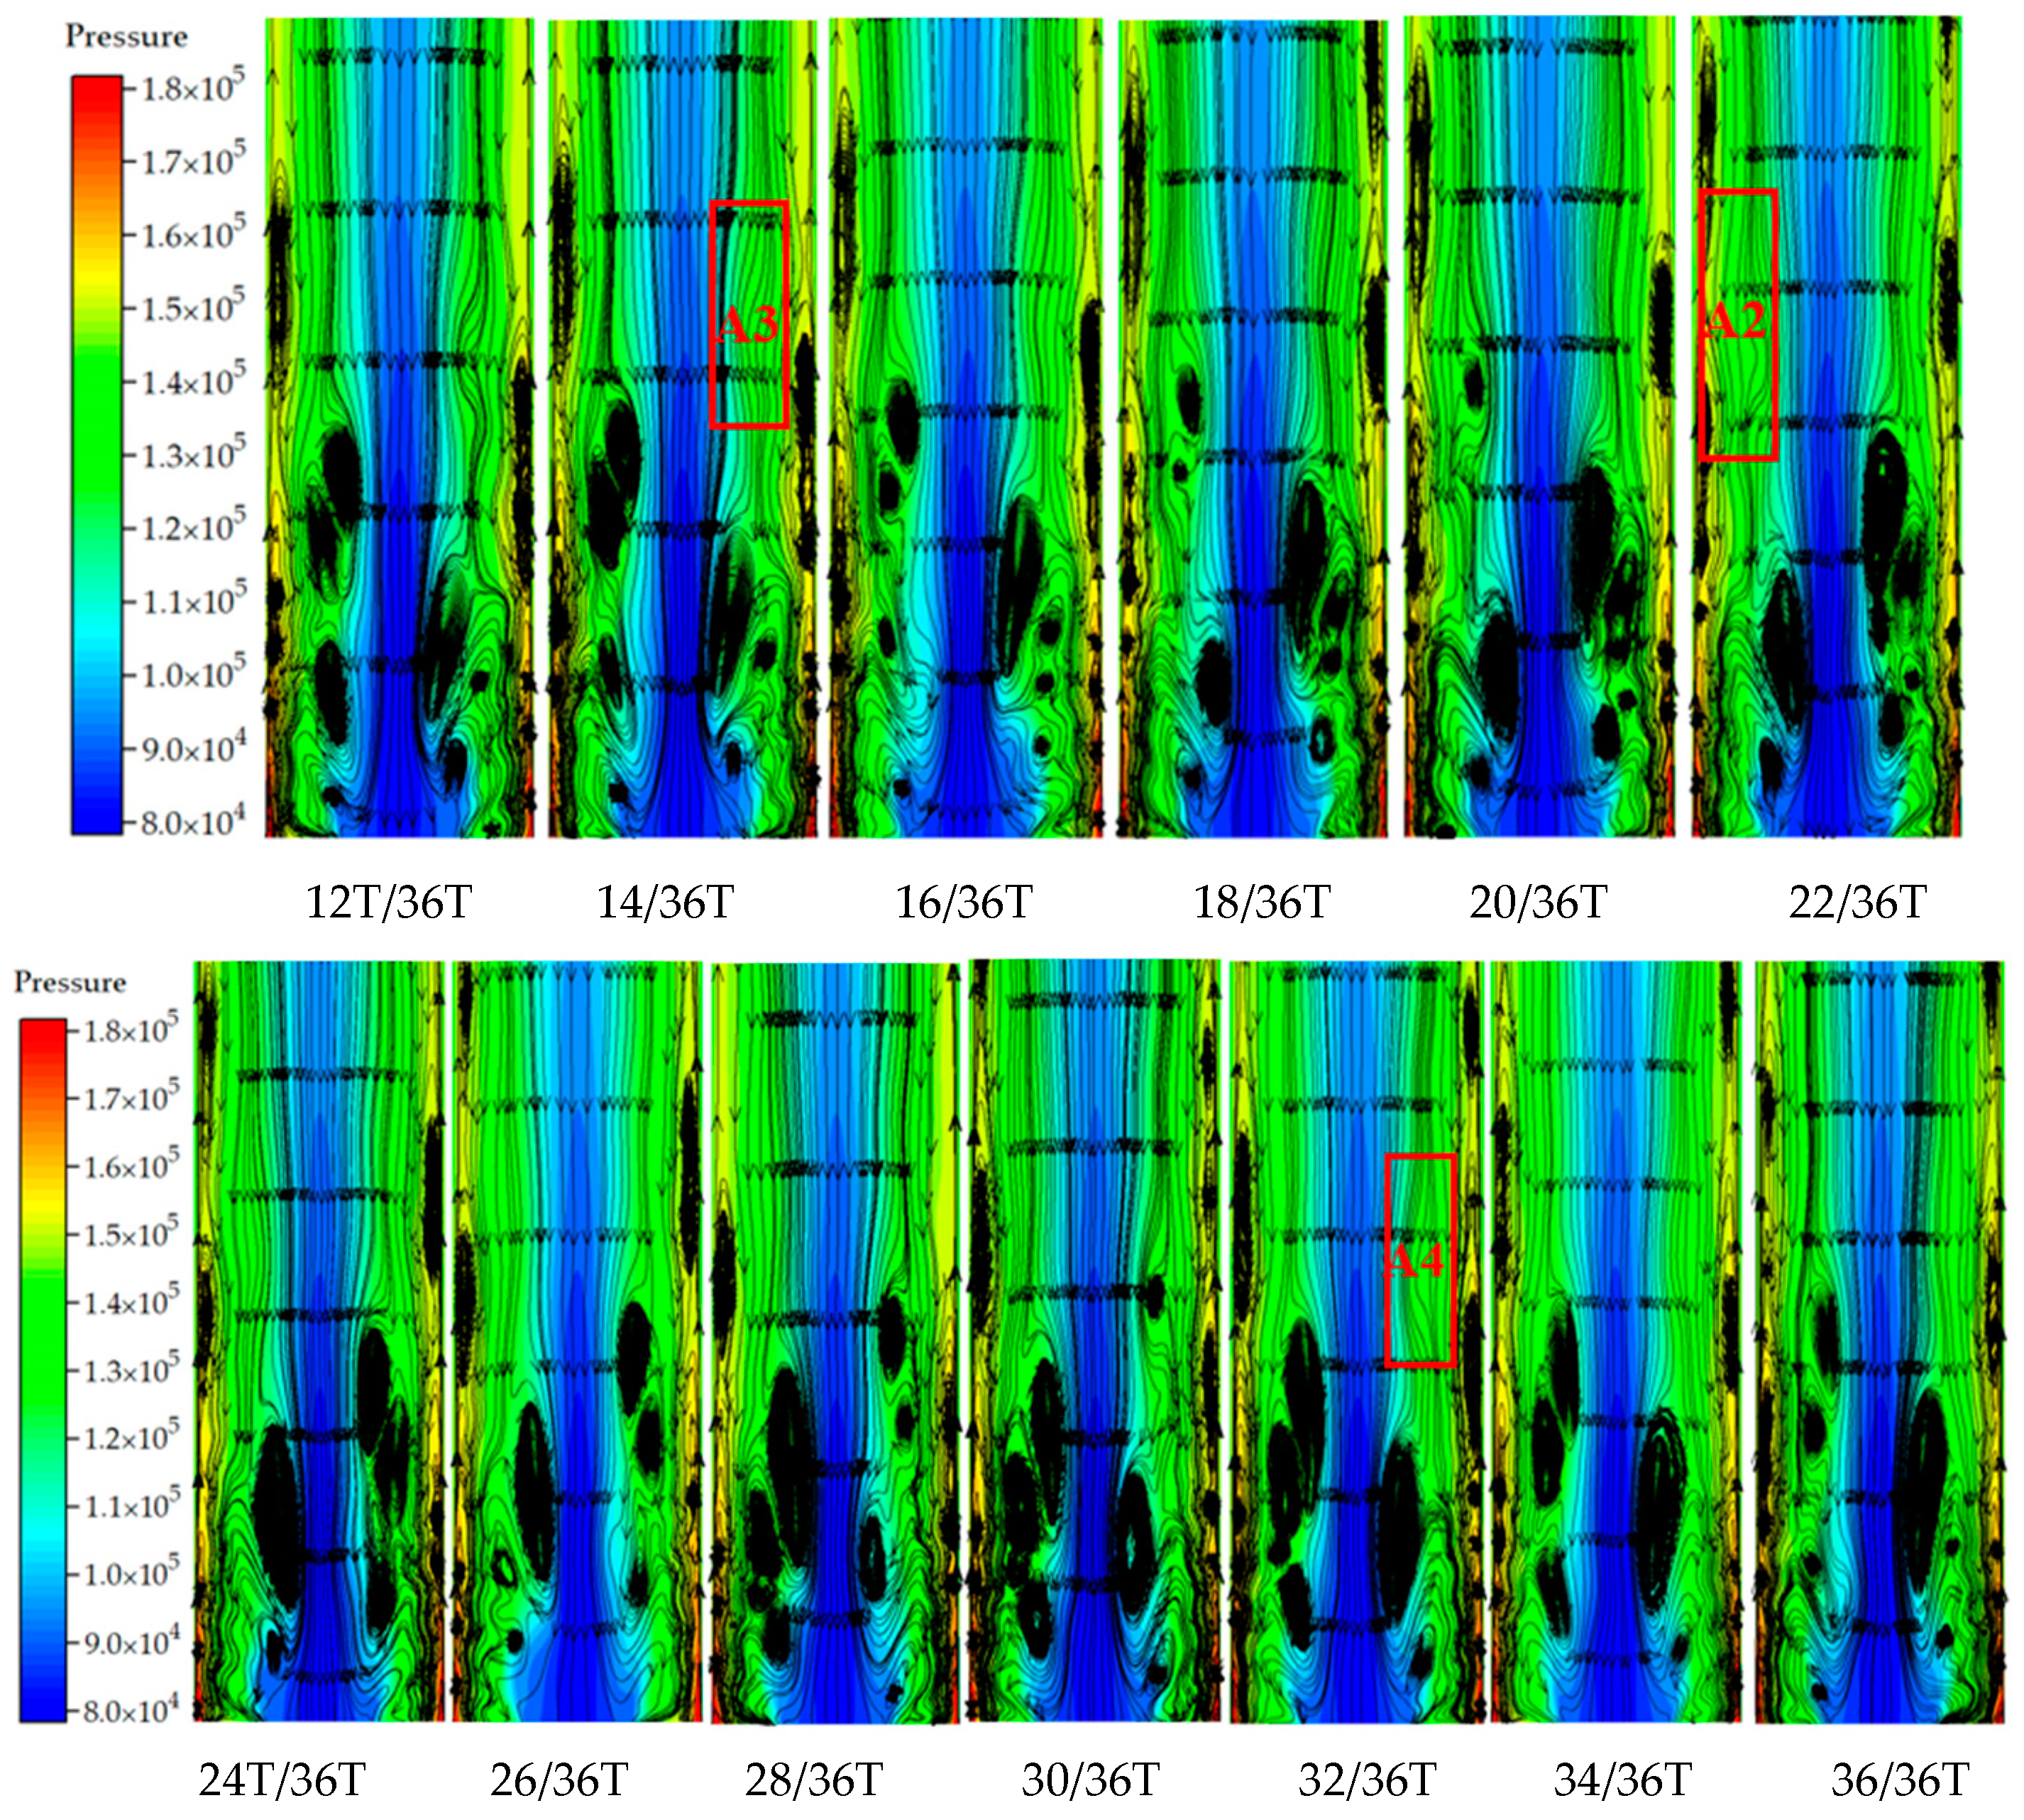
3.2.3. Analysis of Internal Flow

The evolution of internal flow for the propulsion pump can be studied, taking Q = 1300 m3/h as example, to reveal the generation mechanism of the frequency characteristics of the rim driven propulsion pump.
(1) The evolution analysis of velocity
Figure 11 shows that the velocity distribution of the cross section of the outlet under the flow rate Q = 1300 m3/h.
The fluid passing the blades has axial and circumferential speeds; meanwhile, the velocity distribution in the impeller channel is uneven, forming a relatively high-pressure and high-speed fluid. The high-pressure and high-speed fluid moves downstream and moves to the wall under the action of centrifugal force to form a high-speed group. As the blades pass through the middle section one by one, numerous high-speed clusters form a tandem high-speed zone near the downstream wall. The tandem high-speed zone moves downstream as does the rotating impeller, and its tail speed becomes smaller and smaller. The axial length of the tandem high-speed zone is about 1D. With the rotation of the impeller, the upstream part of the tandem high-speed zone shows obvious periodic changes, shown as the red and black boxes at t = 0T in Figure 11. Figure 11b,c shows the formation of a high-speed cluster and periodic changes. The shape of the velocity distribution in the red box area and the black box area at t = 0T and t = 5/36T, respectively, is basically the same. Therefore, the evolution of the morphology of the high-speed zone is produced periodically at a time of 5/36T approximately, indicating that the period of the high-speed zone’s downstream movement is 1BPF.
(2) The evolution analysis of pressure and vorticity
The pressure cloud diagram can intuitively express the pressure distribution of the analysis section. The low-pressure area cannot accurately reflect the position and scale of the vortex. The vorticity is defined as the curl of the fluid velocity vector, which is usually used to measure the intensity and direction of vortex. The vorticity is one of the important physical quantities describing vortex motion. The Equations (2)–(4) are applied to calculate the vorticity of X, Y and Z in three directions.
ω X = w Y v Z
ω Y = u Z w X
ω Z = v X u Y
The u, v and w are the sub-velocities in the three directions of X, Y and Z, respectively. ω is the vorticity, the subscript X, Y, Z indicates the variable direction.
The internal flow field at different time nodes was analyzed to study the movement and development of the vortex in the outlet of the rim driven propulsion pump, and Figure 12 shows the pressure and vorticity distribution at different times. The high-pressure fluid that passes through the blades moves toward the outlet wall and a tandem high-pressure zone is formed near the outlet wall as the blades rotate, which is shown as the V5 area at t = 0T. The tandem high-pressure zone induces periodic pressure fluctuations at P1~P5 and the pressure distribution at the tail end of the tandem high-pressure zone is relatively uniform, and the blade wake effect is weak. Therefore, the 1BPF amplitude of the P5 is relatively low. The wake of the blade moves downstream along the wall and, at the same time, it is subjected to viscous action, forming a vortex near the wall. As the blades rotate, a series of vortices is formed near the wall, which is called “tandem vortex” in this manuscript and is shown as the V5 area at t = 0T. The “tandem vortex” keeps moving downstream and with the effect of viscosity, the moving speed gradually slows down. The tandem vortex gathers at a position about 1D from the impeller to form a “vortex cluster”, which is named as “wall vortex cluster”, as shown in the V4 area at t = 0T in Figure 12. The fluid near the outlet wall of the propulsion pump has a higher pressure, and the pressure of the central fluid is lower. The larger-scale vortices on both sides of the central low-pressure zone are formed because of the energy exchange between the wall high-pressure zone and the central low-pressure zone, which is shown as the V1~V3 area at t = 0T.
Therefore, there are three main types of vortex structures in the outlet, named as the “tandem vortex” near the wall, the “wall vortex cluster” at about 1D from the impeller, and the large-scale vortices on both sides of the central low-pressure area. The flow structure exhibits periodic motion.
Figure 12 and Figure 13 show the pressure and vorticity distribution at different times in a rotating cycle. With the rotating of the impeller, an accompanying vortex is gradually generated upstream of the V1 vortex, and then a double vortex flow structure is formed as the scale of the vortex gradually increases. With the moving downstream of the double vortex, energy is continuously dissipated, until at t = 22/36T it completely disappears, shown as A2. V1 begins a new development cycle at t = 18/36T, until it completely disappears in the A1 area at t = 2/36T. It can be obtained that the development period of V1 is 18/36T, which is the frequency of occurrence of 2APF. V2 is a double vortex structure and it gradually flows downstream; its scale gradually decreases with the rotating of the impeller. At t = 14/36T, the double vortex structure disappears completely in A3 and the next generation cycle of the V2 vortex disappears at t = 32/36T. From the above, it can be obtained that the development period of the V2 vortex is 19/36T, which is also about 2APF. According to the evolution period of the vortex in the flow, the V3 vortex is the embryonic form of V2, and its generation and development period is also 2APF. The V4 vortex gradually moves downstream along the wall with the rotation of the impeller, and its development and generation period are about 1APF.
The movement of the vortex is accompanied by the exchange of energy, which interferes with the uniform distribution of pressure. The movement of V1, V2, V3 and V4 destroys the periodic fluctuations of the pressure at the monitoring points, causing the pressure fluctuation to appear at other frequency components, and these frequencies are closely related to whirlpool movement. Therefore, the 1BPF of pressure fluctuation is caused by the periodic movement of the tandem high-pressure and high-speed zone on the wall. The main reason for 2APF is the movement of the large-scale double vortex structure on both sides of the low-pressure zone in the middle section. The wall vortex cluster may be the main factor that induces the 1APF.
Comparing the numerical simulation and the test results of pressure fluctuation, the amplitude of 1APF is higher than 2BPF in the test results. The reason may be the superposition of 1APF induced by the structural vibration of the propeller and the pressure fluctuation induced by the wall vortex, which causes the 1APF to increase, and, finally, the amplitude of 1APF in the test is higher than 2APF.

4. Conclusions

Experiments for the rim driven propulsion pump have shown that the frequency of the outlet pressure fluctuation in the low frequency band is mainly 1APF and 2APF.
The pressure fluctuation of the propulsion pump was numerically simulated to study the unsteady internal flow characteristics of the rim driven propulsion pump, and to reveal the mechanism of outlet pressure fluctuation. The results show that:
(1)
The periodicity of pressure fluctuation gradually weakens as the distance from the impeller outlet increases. The main frequency of the pressure fluctuation closing to the impeller is 1BPF, and when the distance from the impeller exceeds 1D, the main frequency becomes 2APF.
(2)
The amplitude of 1BPF becomes smaller as the axial distance between the monitoring point and impeller increases. When the distance exceeds 1D, the BPF characteristics nearly disappeared. In the low frequency band, the results of the numerical simulation are in good agreement with the experimental results.
(3)
The 1BPF frequency of pressure fluctuation is caused by the periodic movement of the tandem high-pressure and high-speed zone near the wall. The main reason for 2APF is the movement of the large-scale double vortex structure on both sides of the low-pressure zone in the middle section. The wall vortex cluster may be the main factor that induces 1APF.

Author Contributions

Conceptualization, Z.Z. and H.L.; methodology, Z.Z.; software, Z.Z.; validation, Z.Z. and H.L.; formal analysis, Z.Z.; investigation, Z.Z.; resources, Z.Z.; data curation, Z.Z.; writing—original draft preparation, Z.Z.; writing—review and editing, Z.Z.; visualization, H.L.; supervision, H.L.; project administration, H.L.; funding acquisition, H.L. All authors have read and agreed to the published version of the manuscript.

Funding

This research was funded by the National Science Foundation (Grant No. 1601440040 and 51779108) and the second level of scientific research funding for the fifth phase of “333 Project” in Jiangsu.

Institutional Review Board Statement

Not applicable.

Informed Consent Statement

Not applicable.

Data Availability Statement

The data used in this study are openly available in the public domain.

Conflicts of Interest

The authors declare no conflict of interest.

References

  1. Tan, W.Z.; Yan, X.P.; Liu, Z.L. Technology Development and Prospect of Shaftless Rim-driven Propulsion System. J. Wuhan Univ. Technol. (Tran. Sci. Eng.) 2015, 39, 601–605. [Google Scholar]
  2. Kort, L. Elektrisch Angertriebene Schiffsschraube. German Patent 688,114, 13 February 1940. [Google Scholar]
  3. Li, Z.S. The Design of Rim-Driven Propeller and Flow Characteristics. Master’s Thesis, National Cheng Kung University, Tainan, Taiwan, 2005. [Google Scholar]
  4. Shi, Y.H. The Geometry Design and Performance Analysis of a Remotely Operated Vehicle’s Rim-Driven Propulsor. Master’s Thesis, National Cheng Kung University, Tainan, Taiwan, 2003. [Google Scholar]
  5. Chen, Y.H. The Design and Flow Field Analysis of a Ring-Driven Propeller a Remotely Operated Vehicle’s Rim-Driven Propulsor. Master’s Thesis, National Cheng Kung University, Tainan, Taiwan, 2003. [Google Scholar]
  6. Ye, Y.H. Integrated Design and Realization of a Hubless Rim-Driven Thruster. Master’s Thesis, National Cheng Kung University, Tainan, Taiwan, 2008. [Google Scholar]
  7. Andersen, T.P. Design of Rim Driven Waterjet Pump for Small Rescue Vessel. Master’s Thesis, Chalmers University of Technology, Goteborg, Sweden, 2014. [Google Scholar]
  8. John, A. Marine waterjet propulsion. Soc. Nav. Archit. Mar. Eng. Trans. 1993, 101, 275–335. [Google Scholar]
  9. Spence, R.; Amaral-Teixeira, J. A CFD parametric study of geometrical variations on the pressure pulsations and performance characteristics of a centrifugal pump. Comput. Fluids 2009, 38, 1243–1257. [Google Scholar]
  10. González, J.; Santolaria, C. Unsteady flow structure and global variables in a centrifugal pump. J. Fluids Eng. 2006, 128, 937–946. [Google Scholar]
  11. Wang, H.; Long, B.; Wang, C.; Han, C.; Li, L. Effects of the impeller blade with a slot structure on the centrifugal pump performance. Energies 2020, 13, 1628. [Google Scholar]
  12. Miyabe, M.; Maeda, H.; Umeki, I.; Jittani, Y. Unstable head-flow characteristic generation mechanism of a low specific speed mixed flow pump. Int. J. Therm. Sci. 2006, 15, 115–120. [Google Scholar]
  13. Miyabe, M.; Furukawa, A.; Maeda, H.; Umeki, I.; Jittani, Y. A behavior of the diffuser rotating stall in a low specific speed mixed-flow pump. Int. J. Fluid Mach. Syst. 2009, 2, 31–39. [Google Scholar]
  14. Wang, Y.; Lv, Y.; Wu, X.F.; Liu, H.L. Measurement and analysis of pressure pulsation in mixed flow pump. Water Resour. Power 2017, 10, 5. [Google Scholar]
  15. Zhang, L.; Wang, C.; Zhang, Y.; Xiang, W.; He, Z.; Shi, W. Numerical study of coupled flow in blocking pulsed jet impinging on a rotating wall. J. Braz. Soc. Mech. Sci. Eng. 2021, 43, 508. [Google Scholar]
  16. Wang, H.; Qian, Z.; Zhang, D.; Wang, T.; Wang, C. Numerical study of the normal impinging water jet at different impinging height, based on Wray–Agarwal turbulence model. Energies 2020, 13, 1744. [Google Scholar]
  17. Shi, L.; Zhu, J.; Tang, F.; Wang, C. Multi-Disciplinary optimization design of axial-flow pump impellers based on the approximation model. Energies 2020, 13, 779. [Google Scholar]
  18. Yakovlev, A.Y.; Sokolov, M.A.; Marinich, N.V. Numerical design and experimental verification of a rim-driven thruster. In Proceedings of the Second International Symposium on Marine Propulsors, Hamburg, Germany, 15–17 June 2011. [Google Scholar]
  19. Song, B.W.; Wang, Y.; Tian, W. Open water performance comparison between hub-type and hubless rim driven thrusters based on CFD method. Ocean Eng. 2015, 103, 55–63. [Google Scholar]
  20. Su, B. Research on Flow Characteristics and Structure Optimization of Small-Scale Shaftless Hydraulic Propeller. Master’s Thesis, North University of China, Taiyuan, China, 2018. [Google Scholar]
  21. Zhou, J.; Zhao, M.; Wang, C.; Gao, Z. Optimal design of diversion piers of lateral intake pumping station based on orthogonal test. Shock Vib. 2021, 2021, 6616456. [Google Scholar] [CrossRef]
  22. Wang, H.; Hu, Q.; Yang, Y.; Wang, C. Performance differences of electrical submersible pump under variable speed schemes. Int. J. Simul. Modell. 2021, 20, 76–86. [Google Scholar]
  23. Dubas, A.J.; Bressloff, N.W.; Sharkh, S.M. Numerical modelling of rotor–stator interaction in rim driven thrusters. Ocean Eng. 2015, 106, 281–288. [Google Scholar]
  24. Shi, J.Q. Research on the Influence of Fluid Parameters on the Vibration Characteristics of Pipeline Fluid-Solid Coupling. Master’s Thesis, Yanshan University, Qinhuangdao, China, 2016. [Google Scholar]
  25. Zhou, H.; Liu, Y.T.; Yue, Z.F. Calculation Analyze of Pressure Pulsation in Fluid Flowing Pipeline. Mech. Sci. Technol. 2011, 9, 1435–1438. [Google Scholar]
Figure 1. The rim driven propulsion pump impeller for test.
Machines 09 00293 g001
Figure 2. Schematic diagram of the rim drive propulsion pump performance test rig.
Machines 09 00293 g002
Figure 3. The test rig of performance characteristics for the rim driven propulsion pump.
Machines 09 00293 g003
Figure 4. Frequency distribution of pressure fluctuation under different flow rate conditions.
Machines 09 00293 g004
Figure 5. The calculation model of rim drive propulsion pump.
Machines 09 00293 g005
Figure 6. Structured grid and enlarged view of wall encryption. (a) The inlet mesh. (b) The impeller mesh.
Machines 09 00293 g006
Figure 7. The distribution of pressure monitors in the outlet.
Machines 09 00293 g007
Figure 8. The result comparison of numerical simulation and experiment. (a) Flow rate, head curve. (b) Flow rate, efficiency curve.
Machines 09 00293 g008
Figure 9. Time domain of pressure fluctuation. (a) Time domain plot of 10 rotation cycles. (b) Time domain plot of 1 rotation cycle.
Machines 09 00293 g009
Figure 10. The frequency domain of pressure fluctuation.
Machines 09 00293 g010
Figure 11. Velocity distribution of the cross section of outlet and partial enlarged view. (a) Velocity distribution of the cross section of outlet. (b) Partial enlarged view of black box. (c) Partial enlarged view of red box.
Machines 09 00293 g011aMachines 09 00293 g011b
Figure 12. The pressure and vorticity distribution at different times.
Machines 09 00293 g012
Figure 13. The pressure and vorticity distribution at different times.
Machines 09 00293 g013
Table 1. Grid independence test.
SchemeInletImpellerOutletTotalHead/m
1405,6731,480,526564,0322,450,2316.31
2695,2641,953,263925,6643,574,1916.12
3897,6322,496,3521,296,3264,690,3105.96
41,156,9433,037,9641,596,4535,791,3615.91
51,469,3691,465,2311,809,7594,744,3595.90
Publisher’s Note: MDPI stays neutral with regard to jurisdictional claims in published maps and institutional affiliations.

