Optimization of Honing Surface Roughness of Carburized Holes Based on GRA-RSM


Abstract
:1. Introduction
2. Experiment and Method
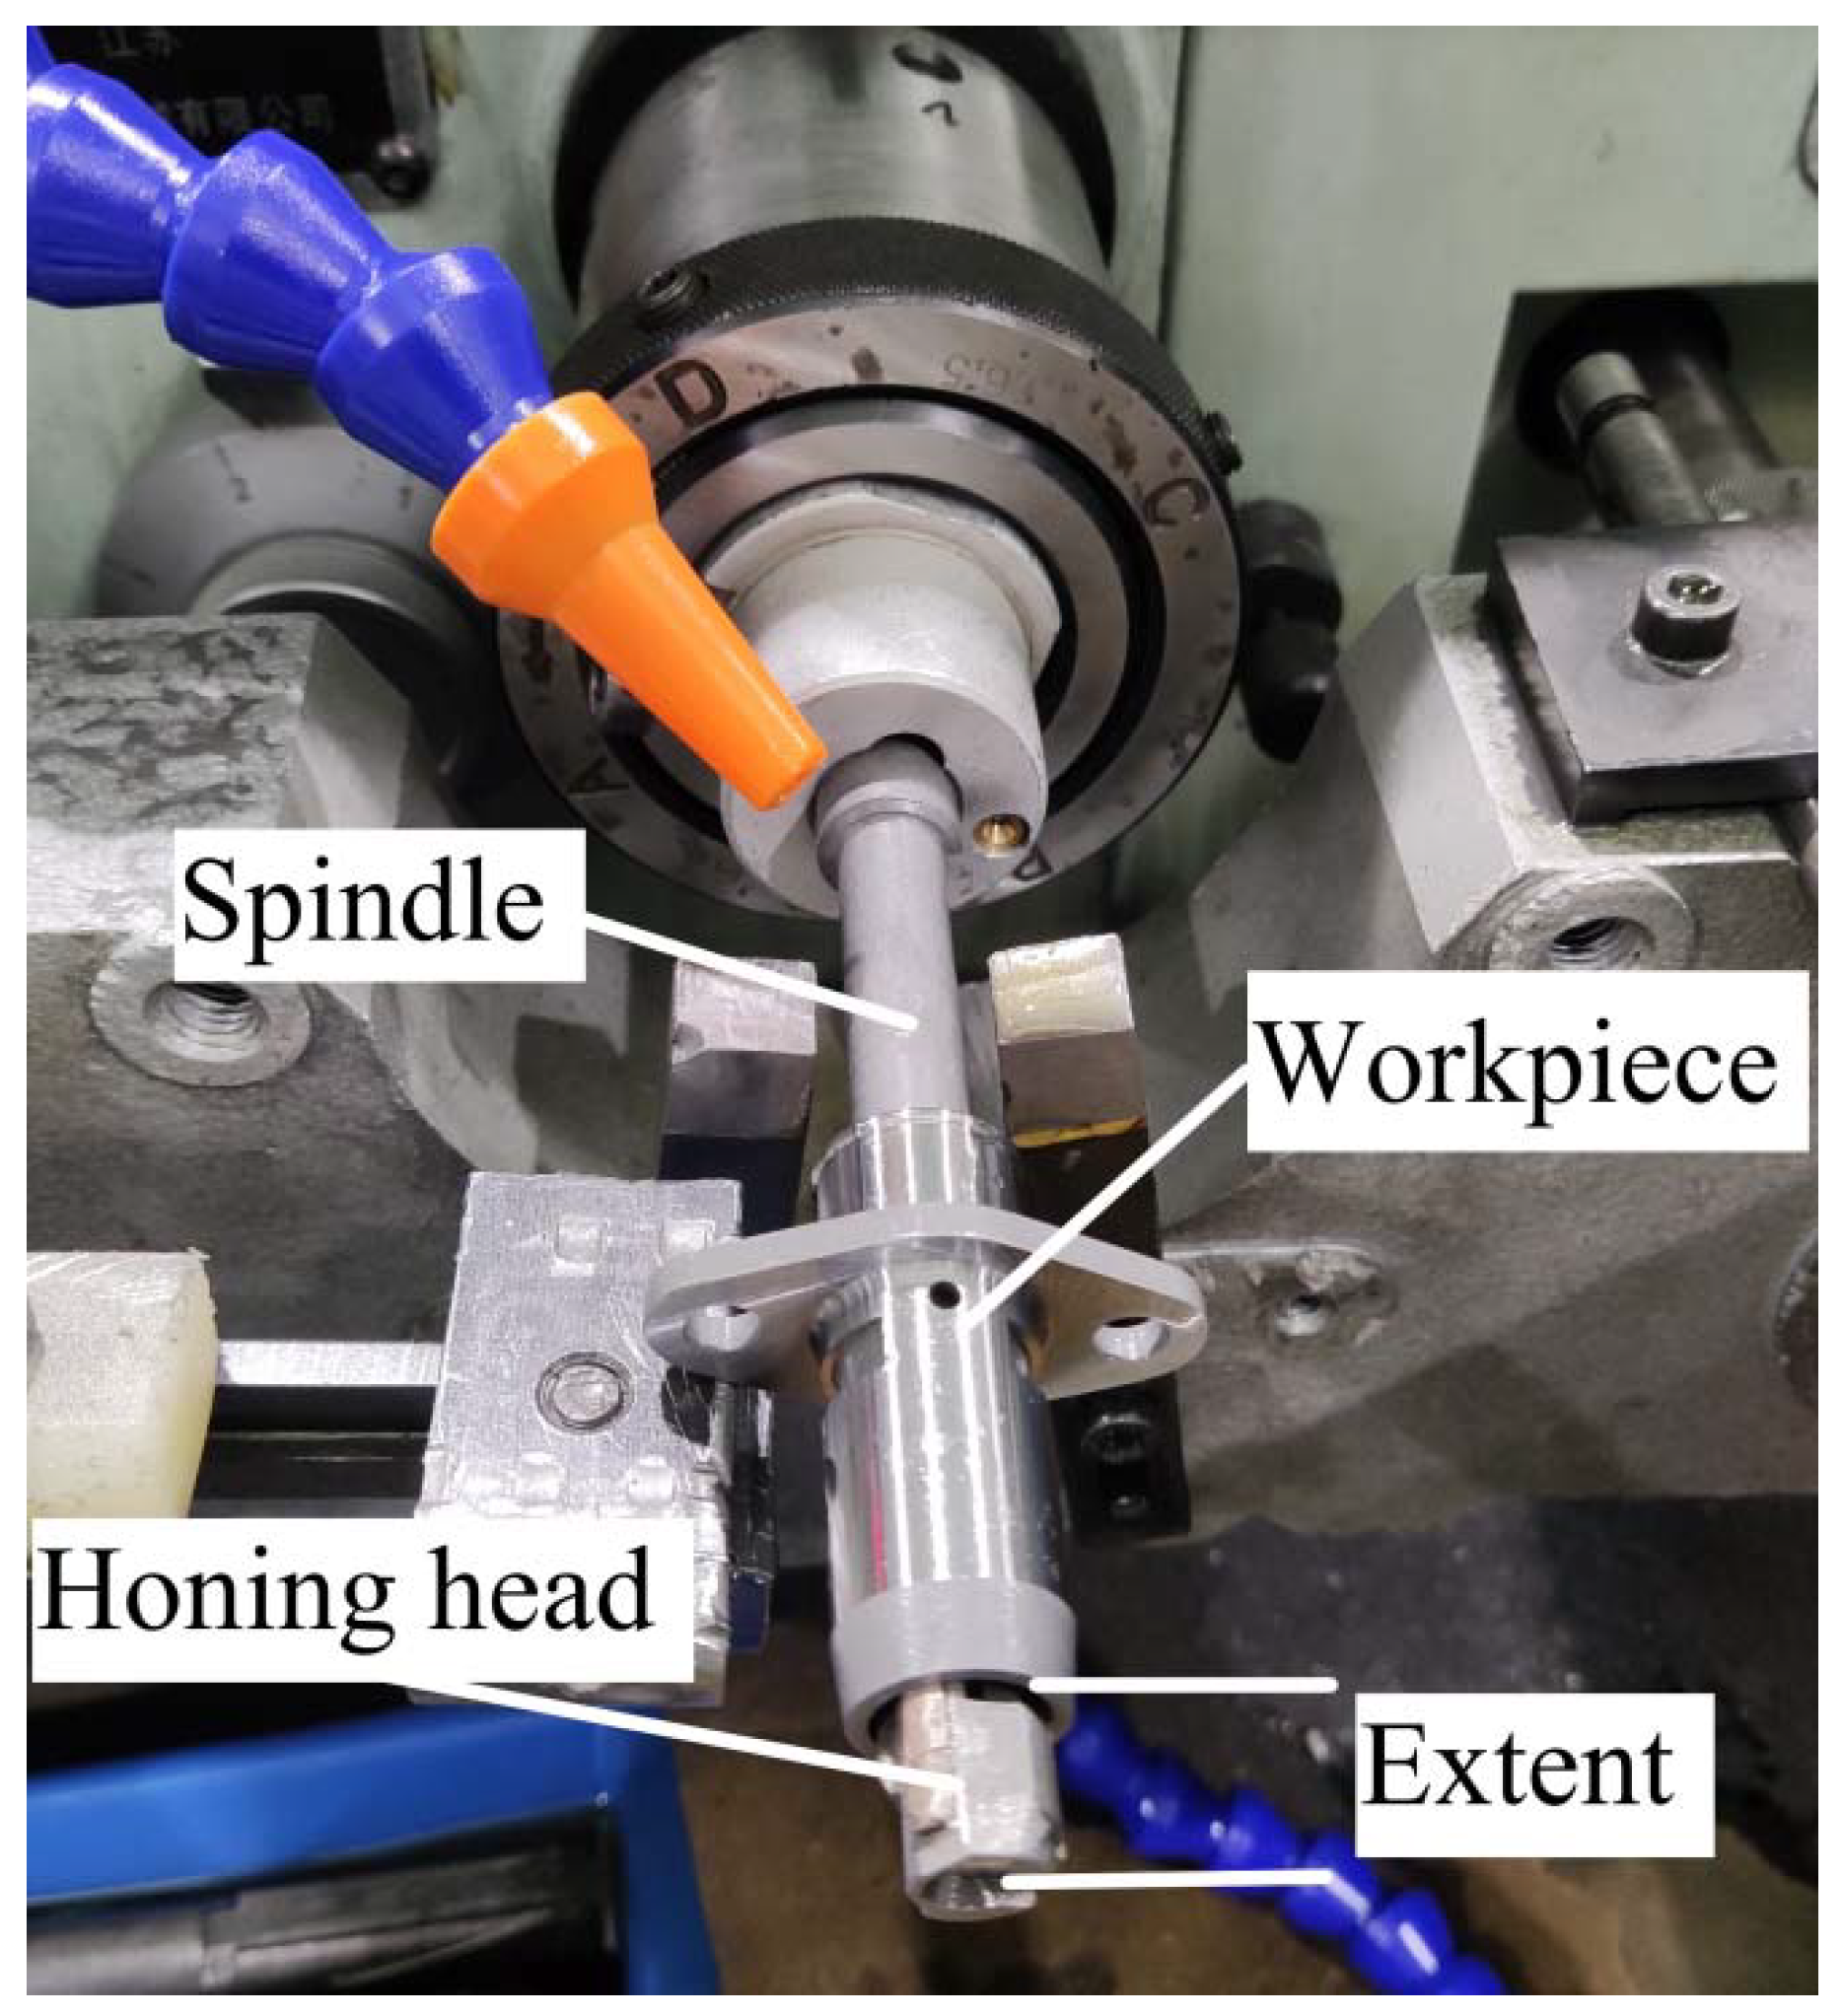
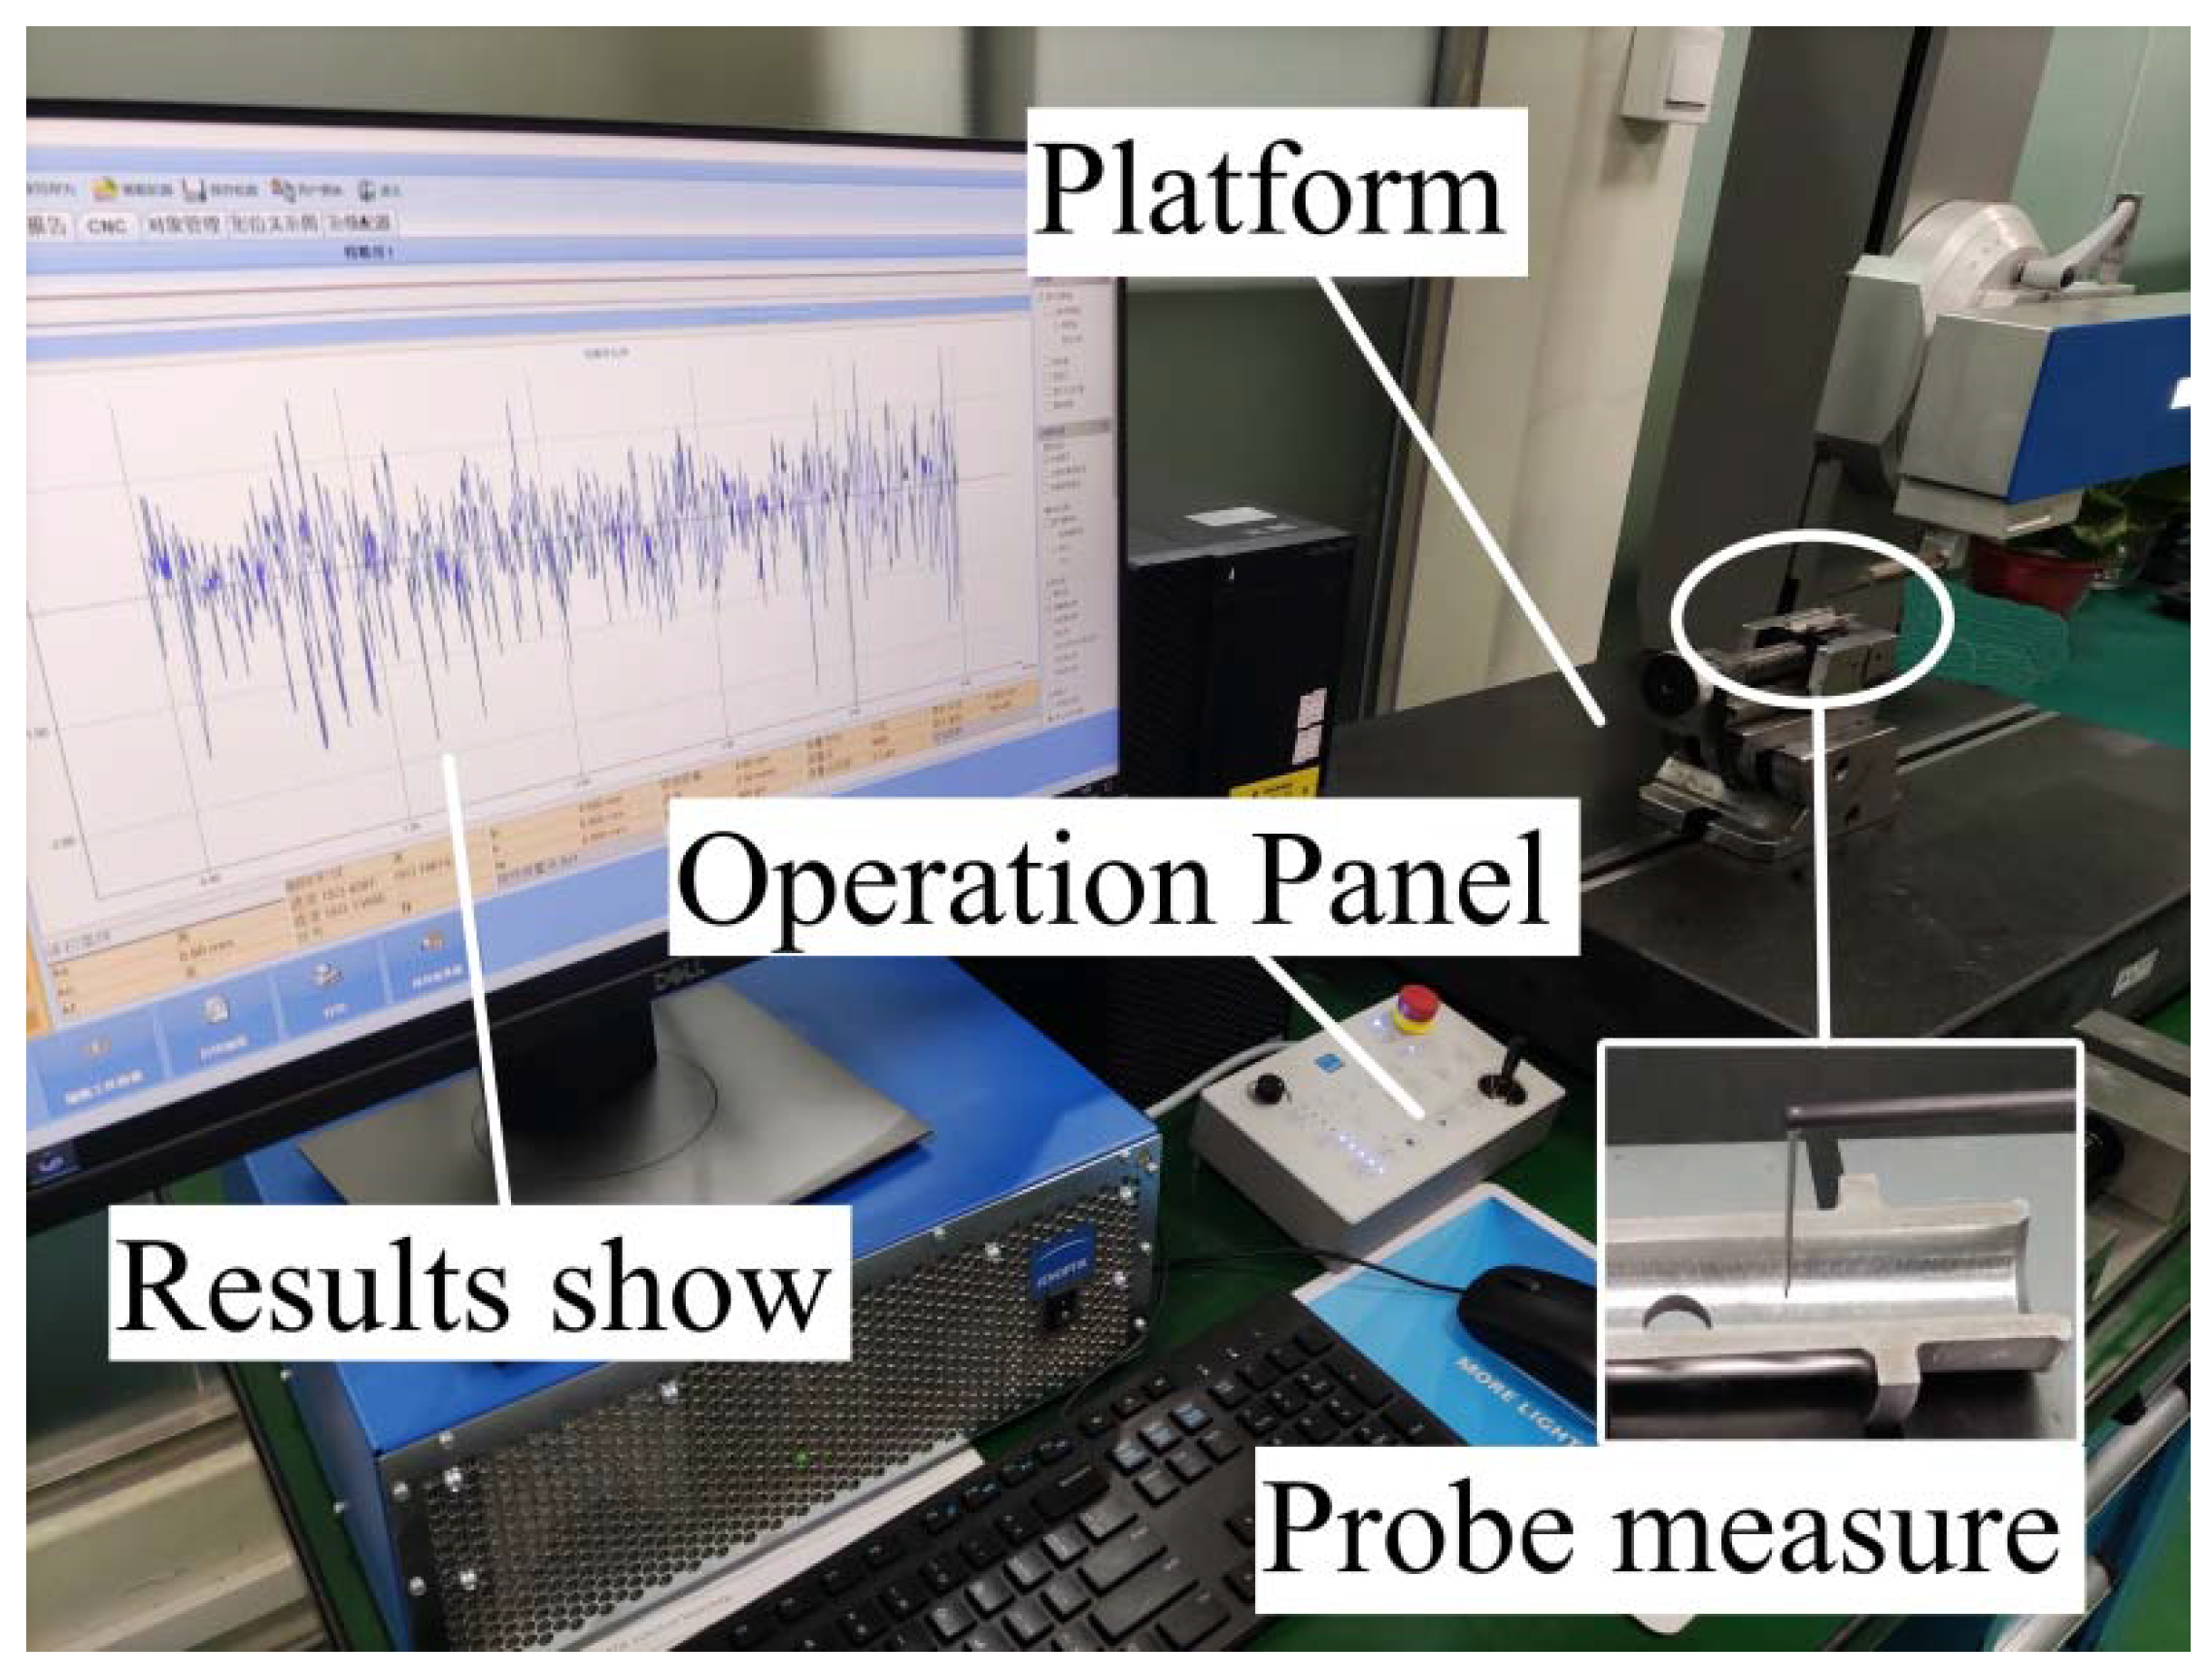
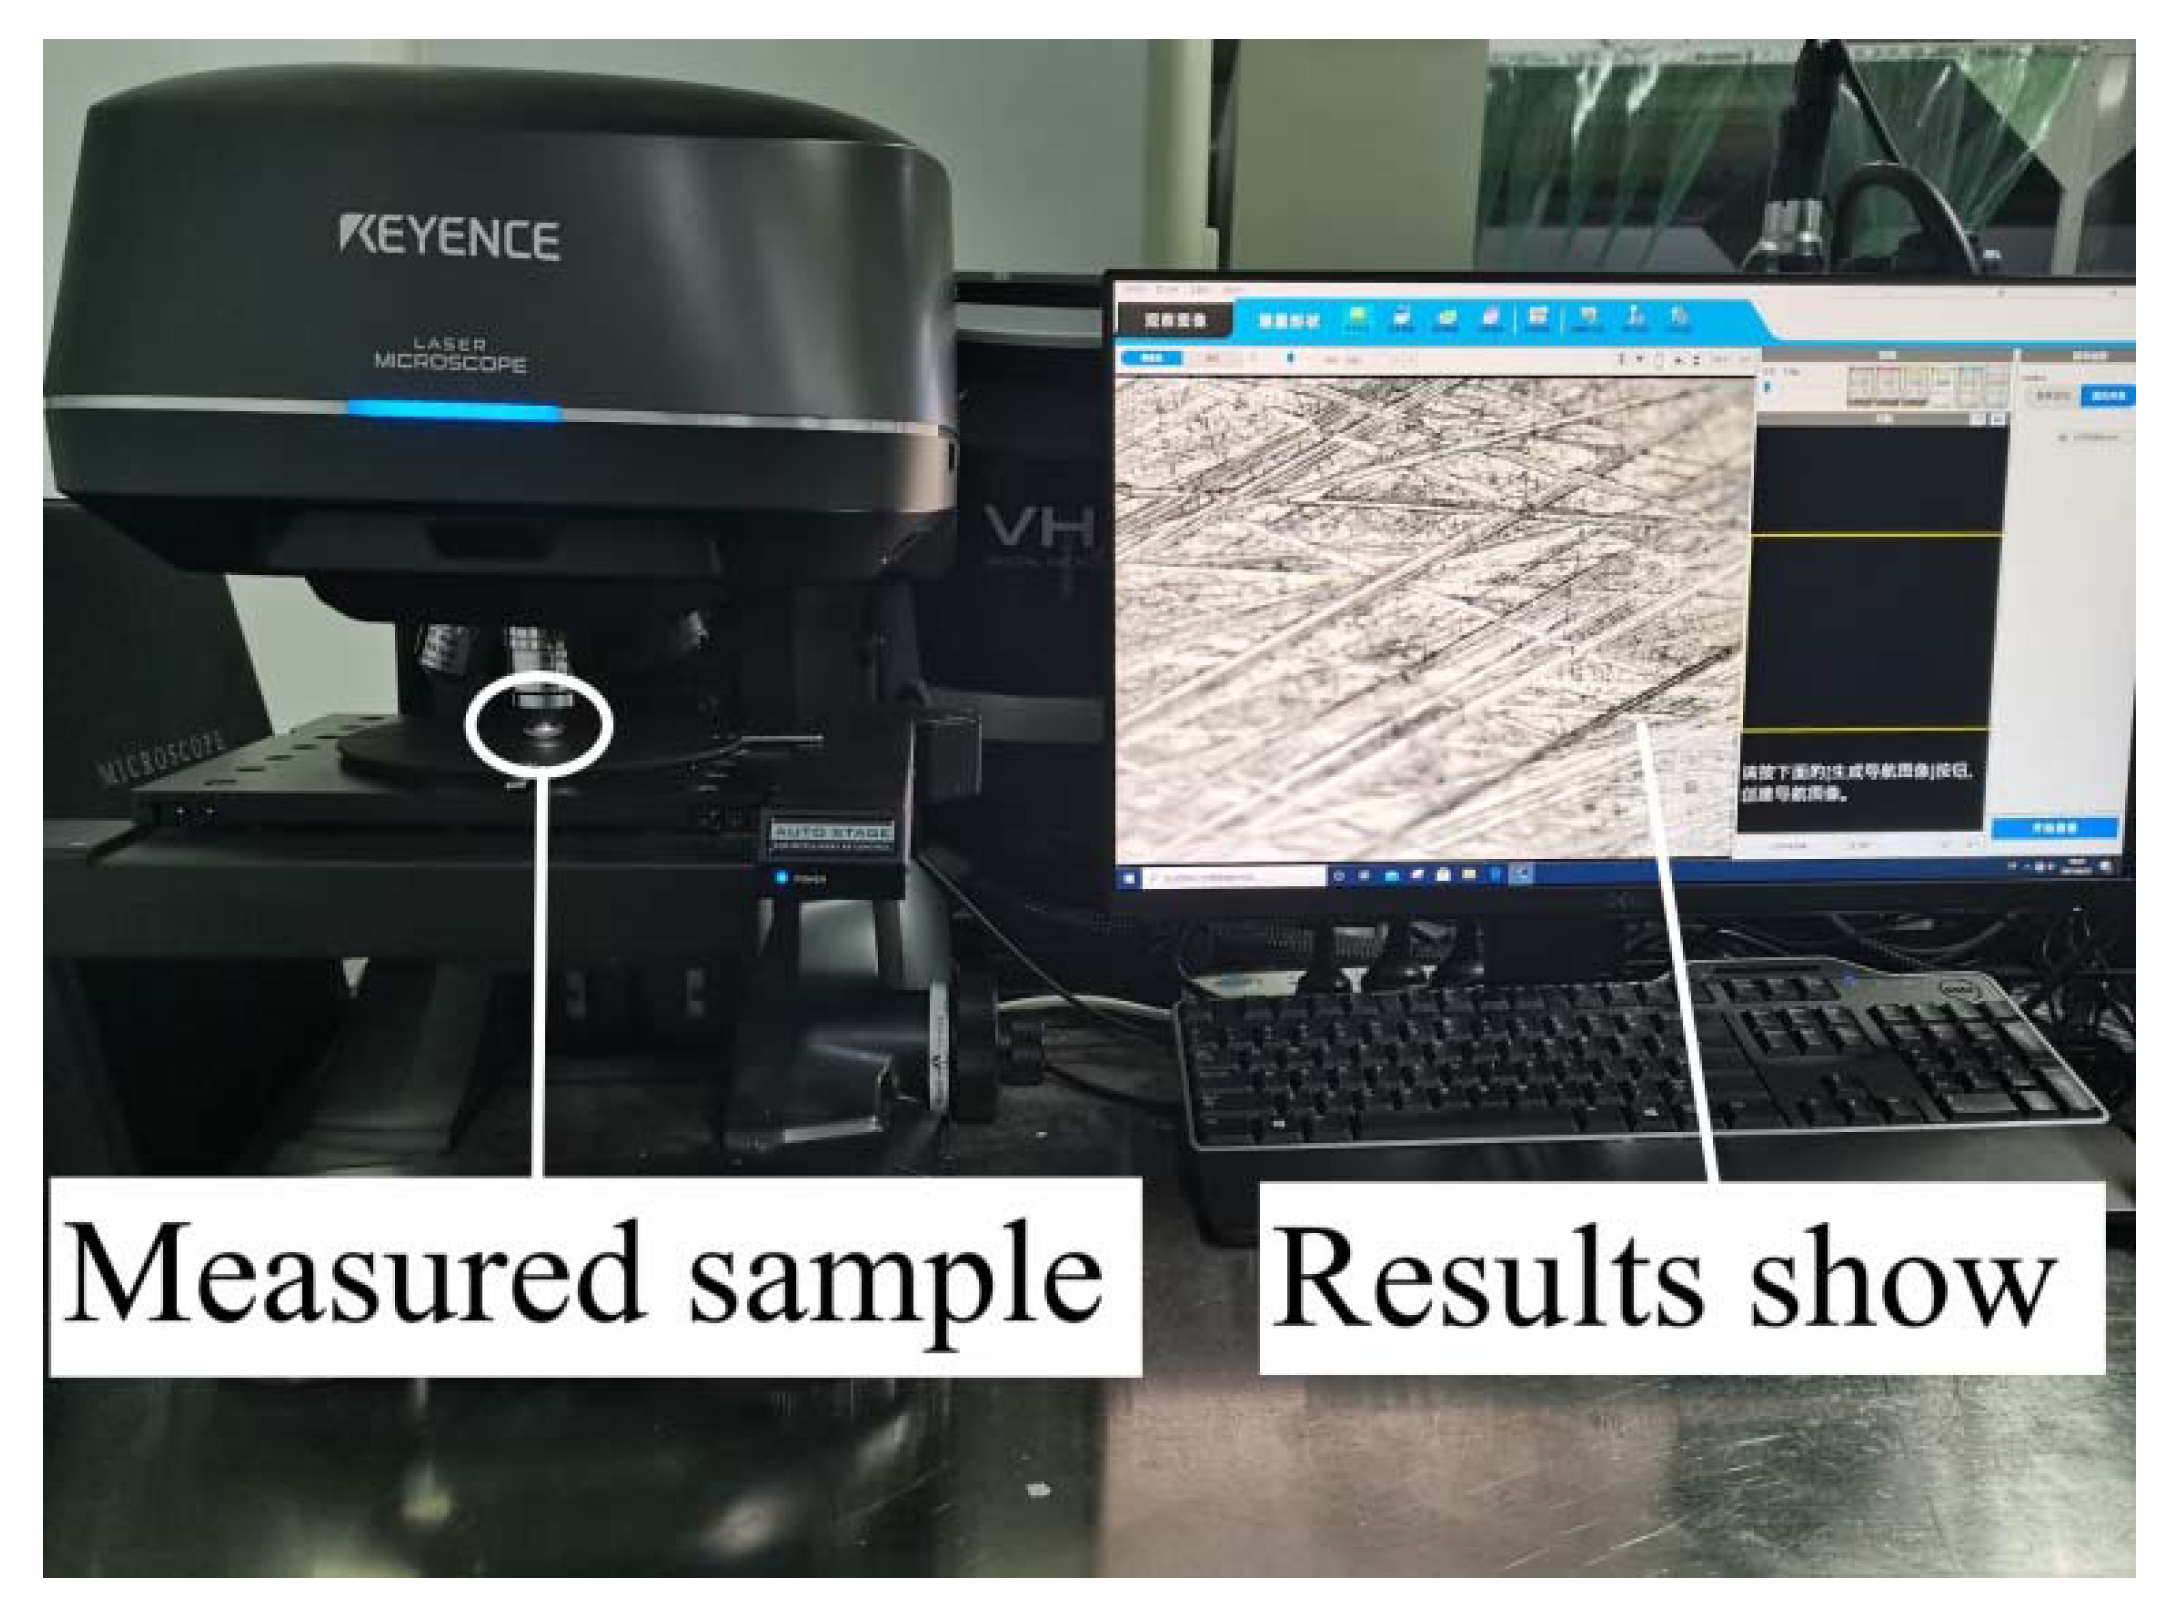
2.1. Experimental Subject and Instruments
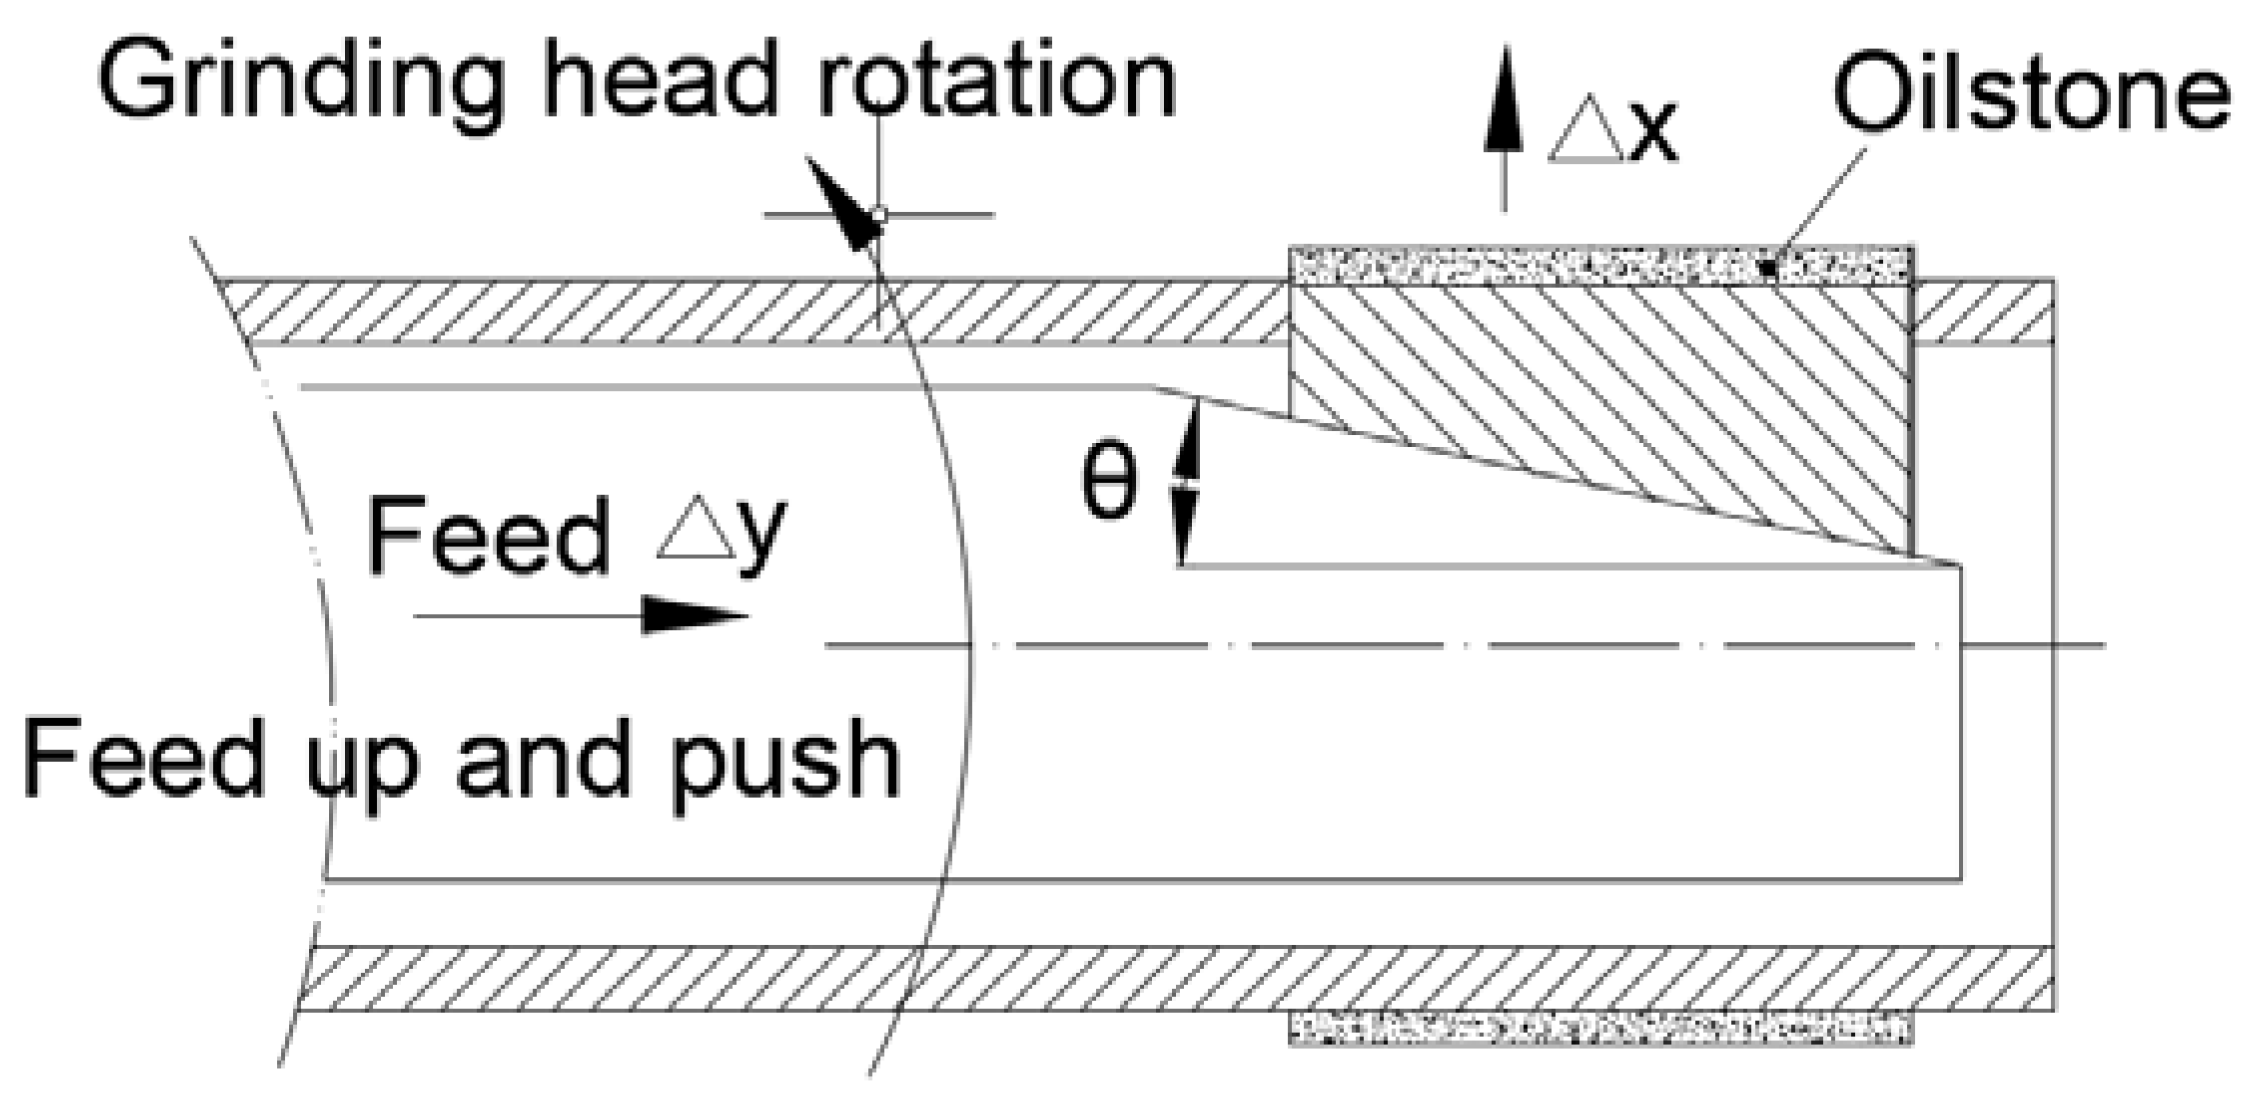
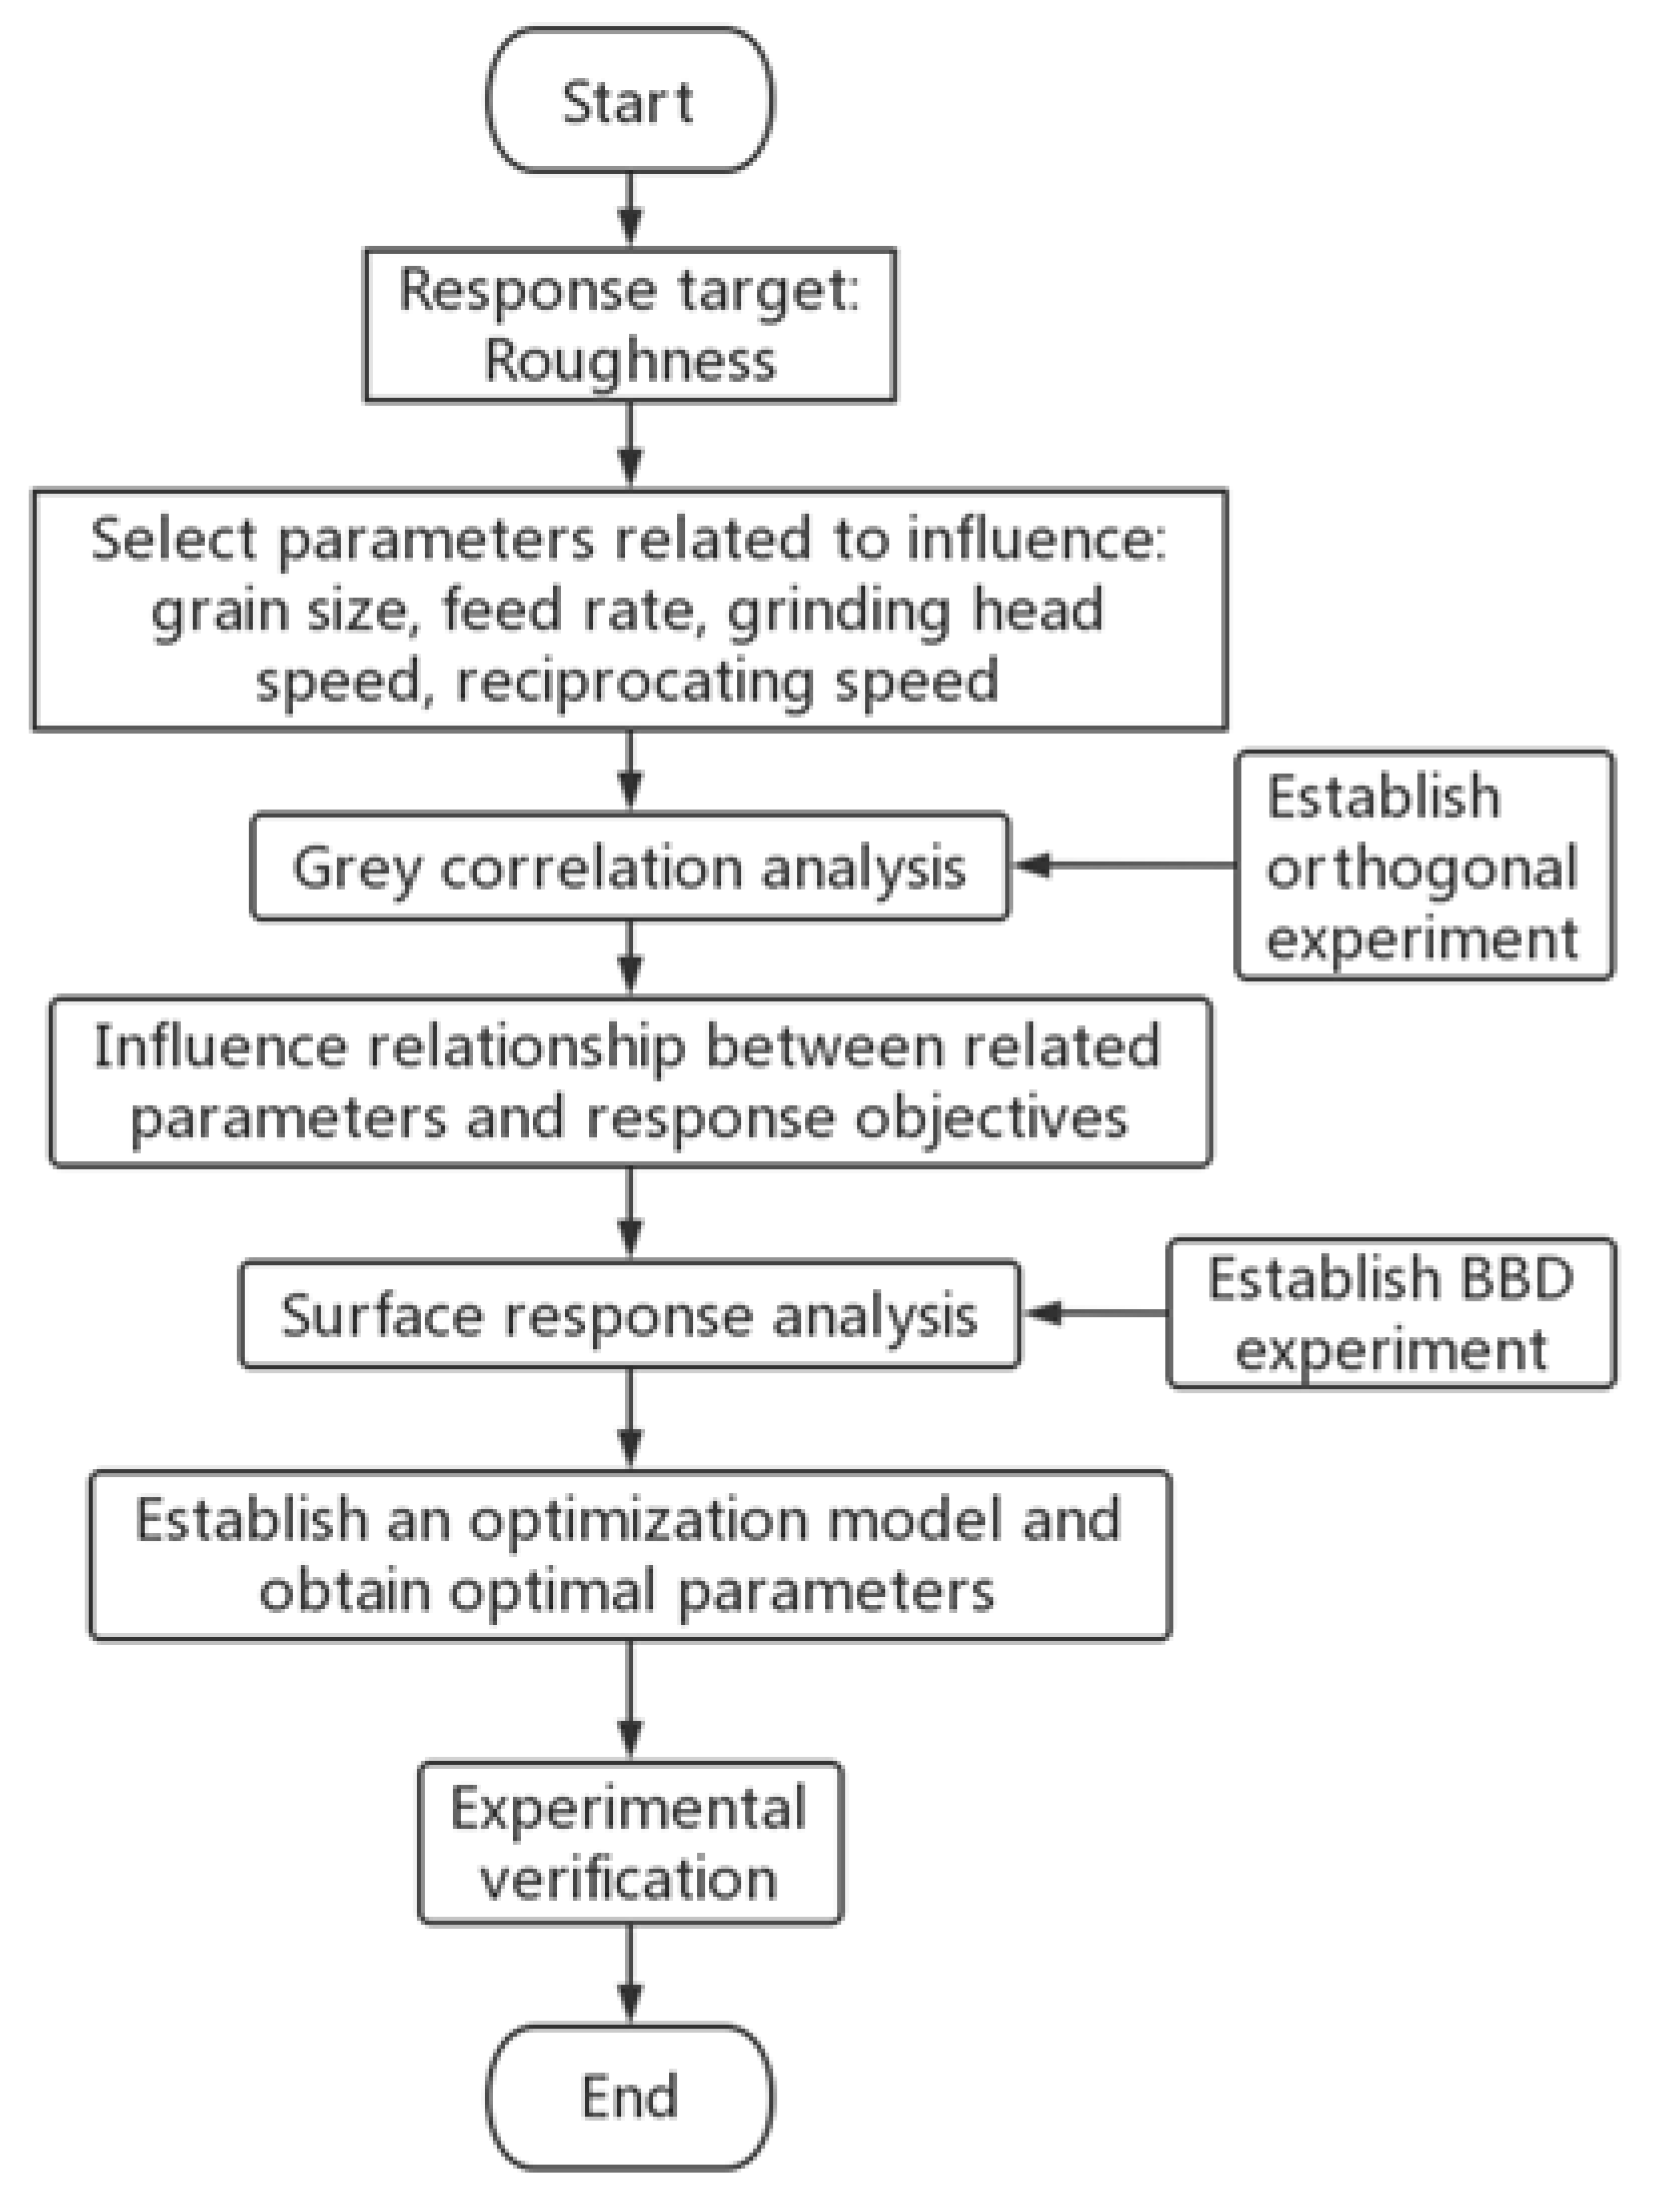
2.2. Experimental Method
3. Grey Relational Analysis
3.1. The Calculation of SNR
3.2. Grey Relational Degree Calculation
3.3. Data Analysis and Discussion
4. Response Surface Regression
4.1. Theoretical Analysis
4.2. BBD Experimental Design and Discussion
4.3. Build Optimization Model
5. Optimization Results and Experimental Verification
6. Conclusions
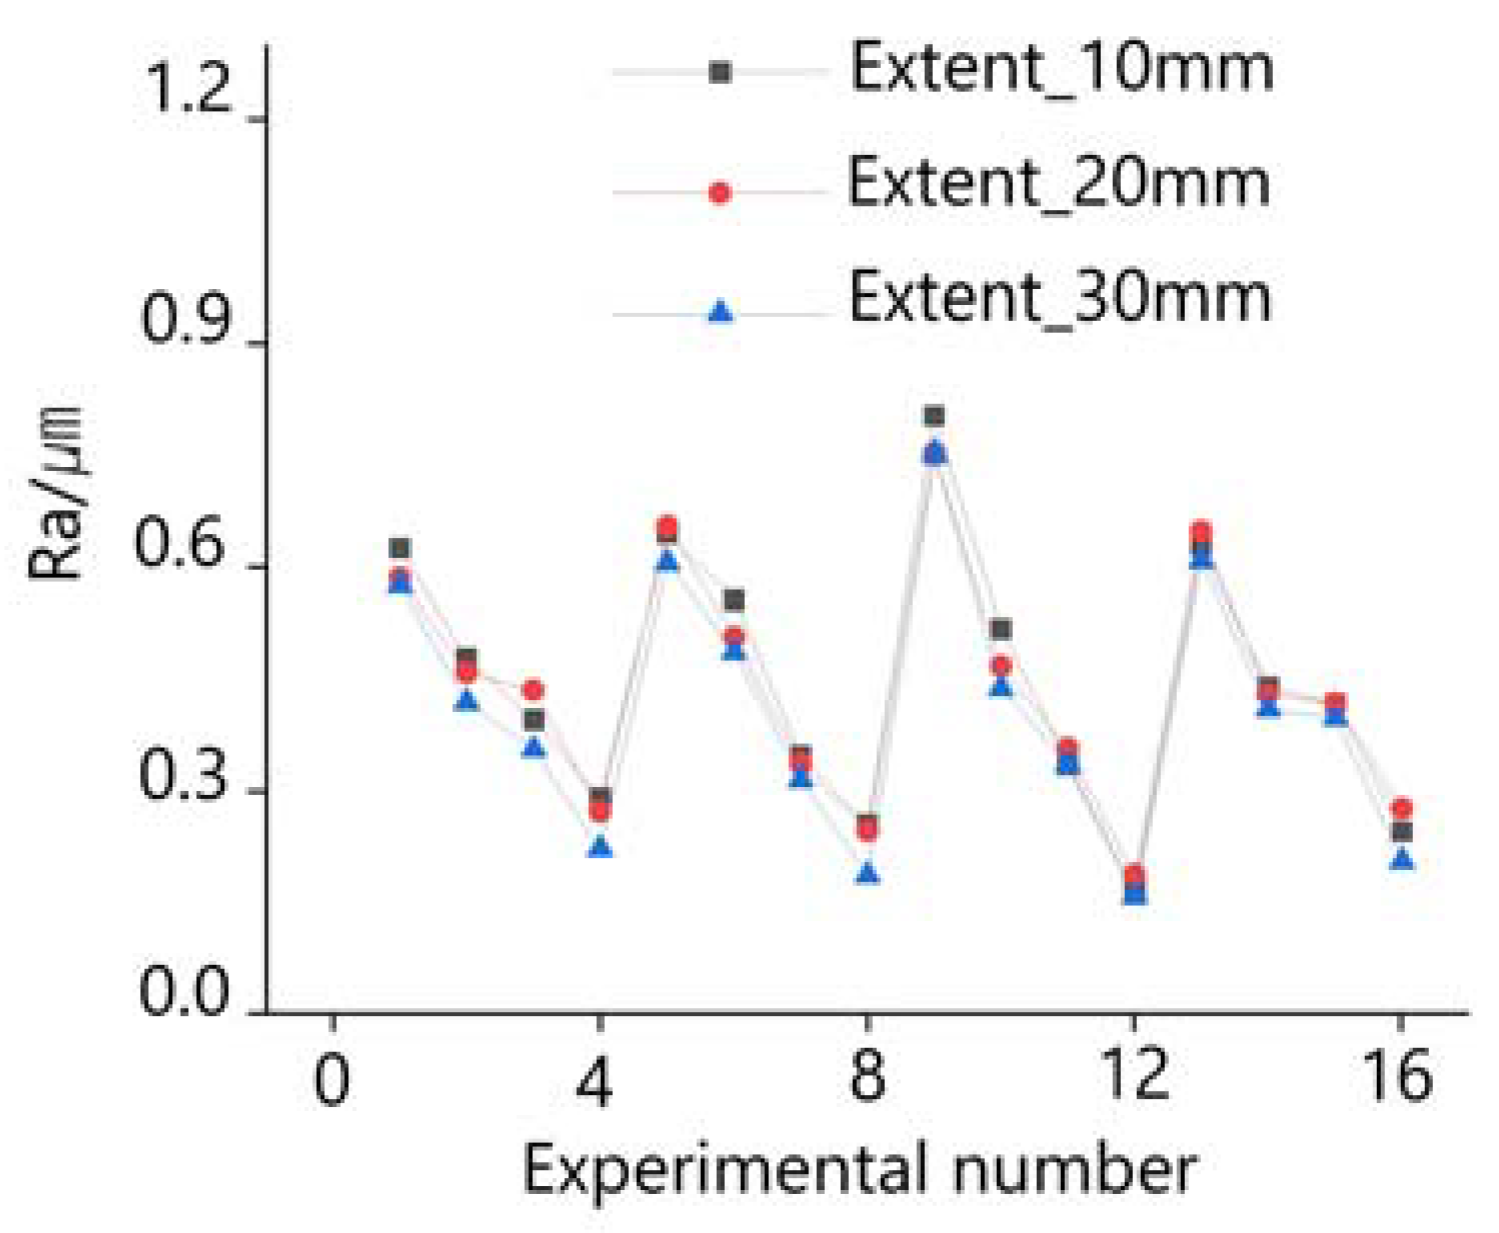
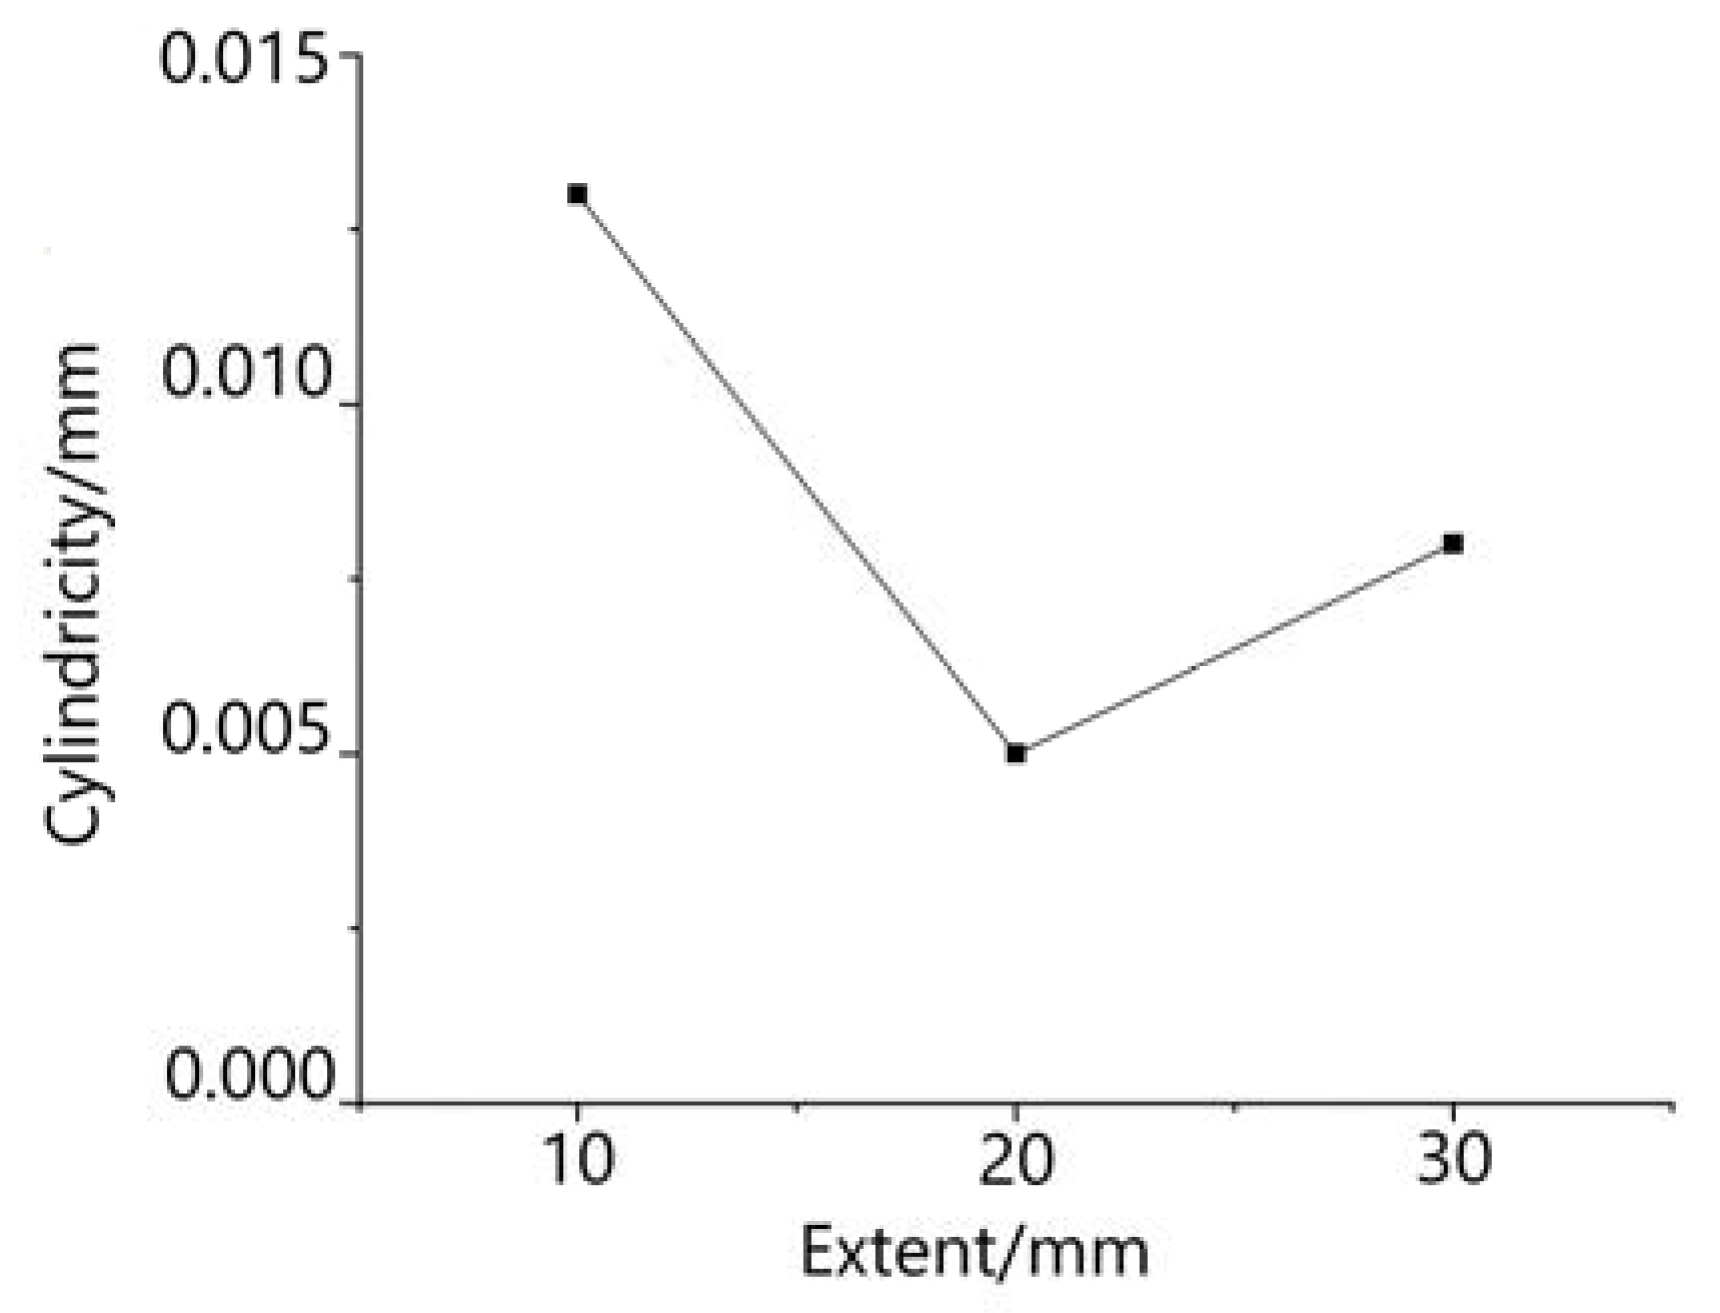
- (i)
- Analysis by orthogonal experiments showed that the surface roughness Ra value of the carburized hole decreased with the increase of the honing head extension. When the extension was 20 mm, the cylinder of the carburized hole was the best, and there was no problem with waist bulge and bell mouth.
- (ii)
- Based on grey relational grade, the SNR of surface roughness (Ra) for different parameter combinations was analyzed, and the order of influence on roughness (Ra) was: average grain size of oilstone > single grinding depth > grinding head speed > workpiece reciprocating speed.
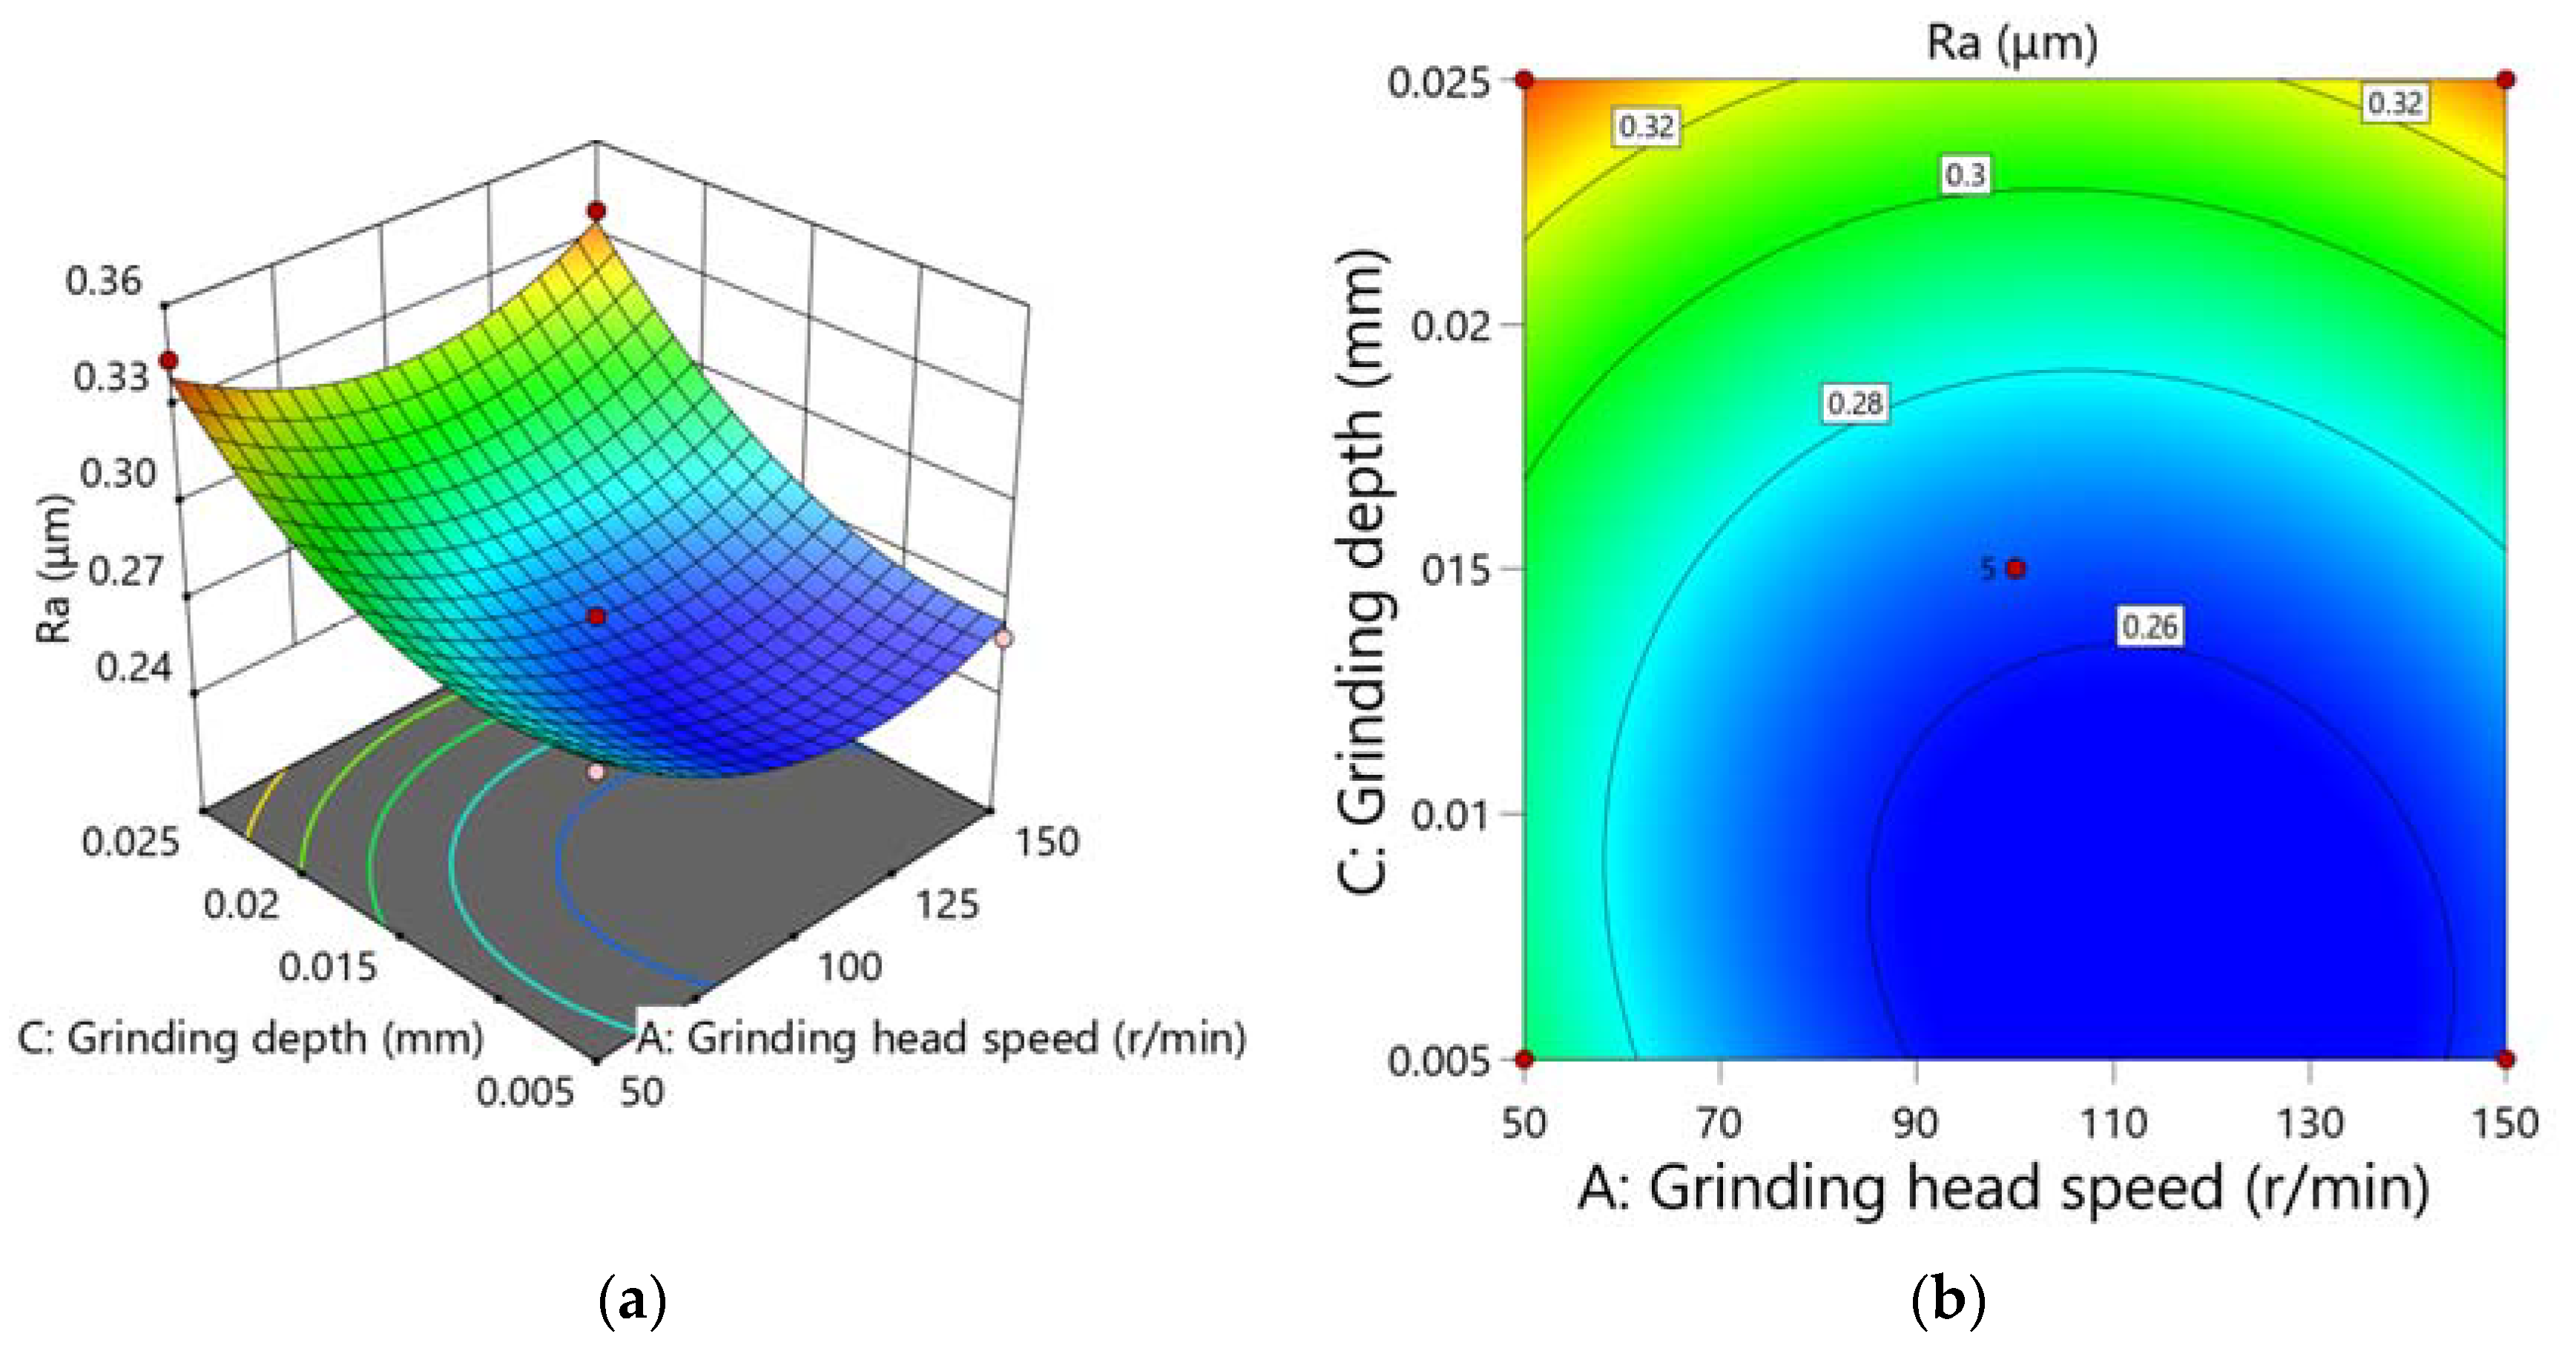
- (iii)
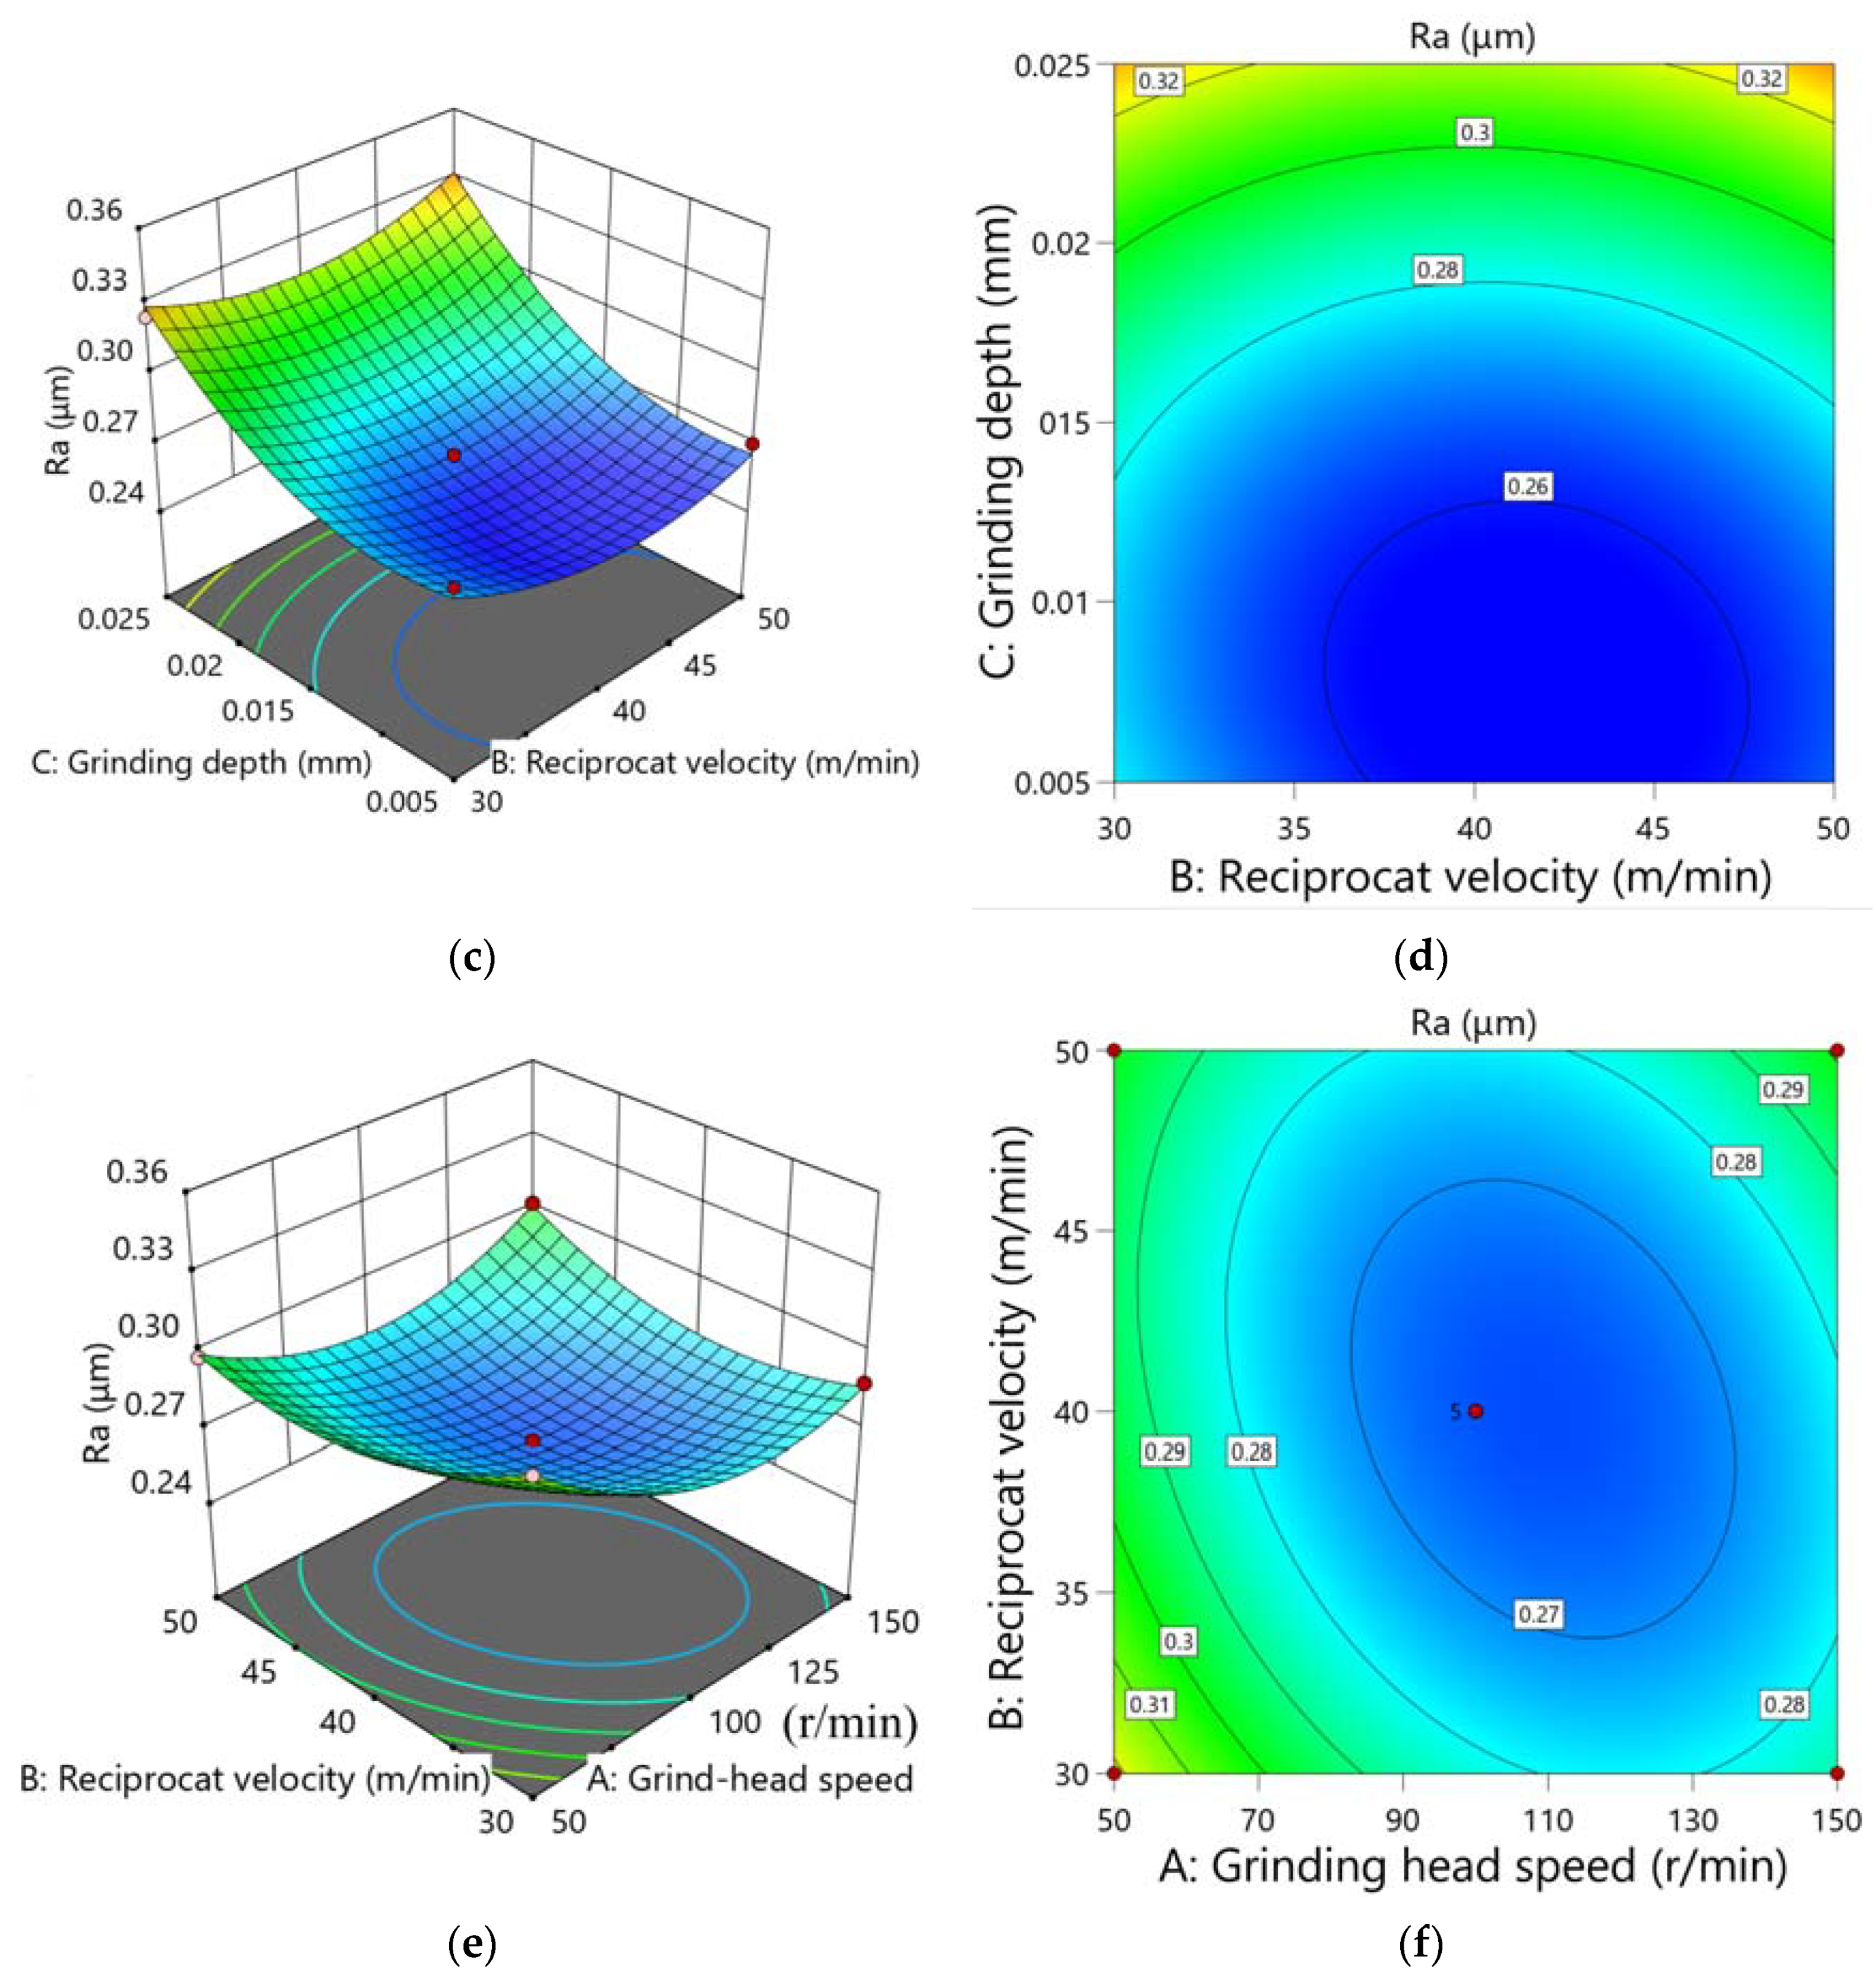
- The BBD experiments based on the response surface method showed that the roughness Ra value decreased with the decrease of the single grinding depth. It decreased with the increase of the grinding head speed and then tended to stabilize dynamically. The interaction effect of grinding head speed and reciprocating speed was significant.
- (iv)
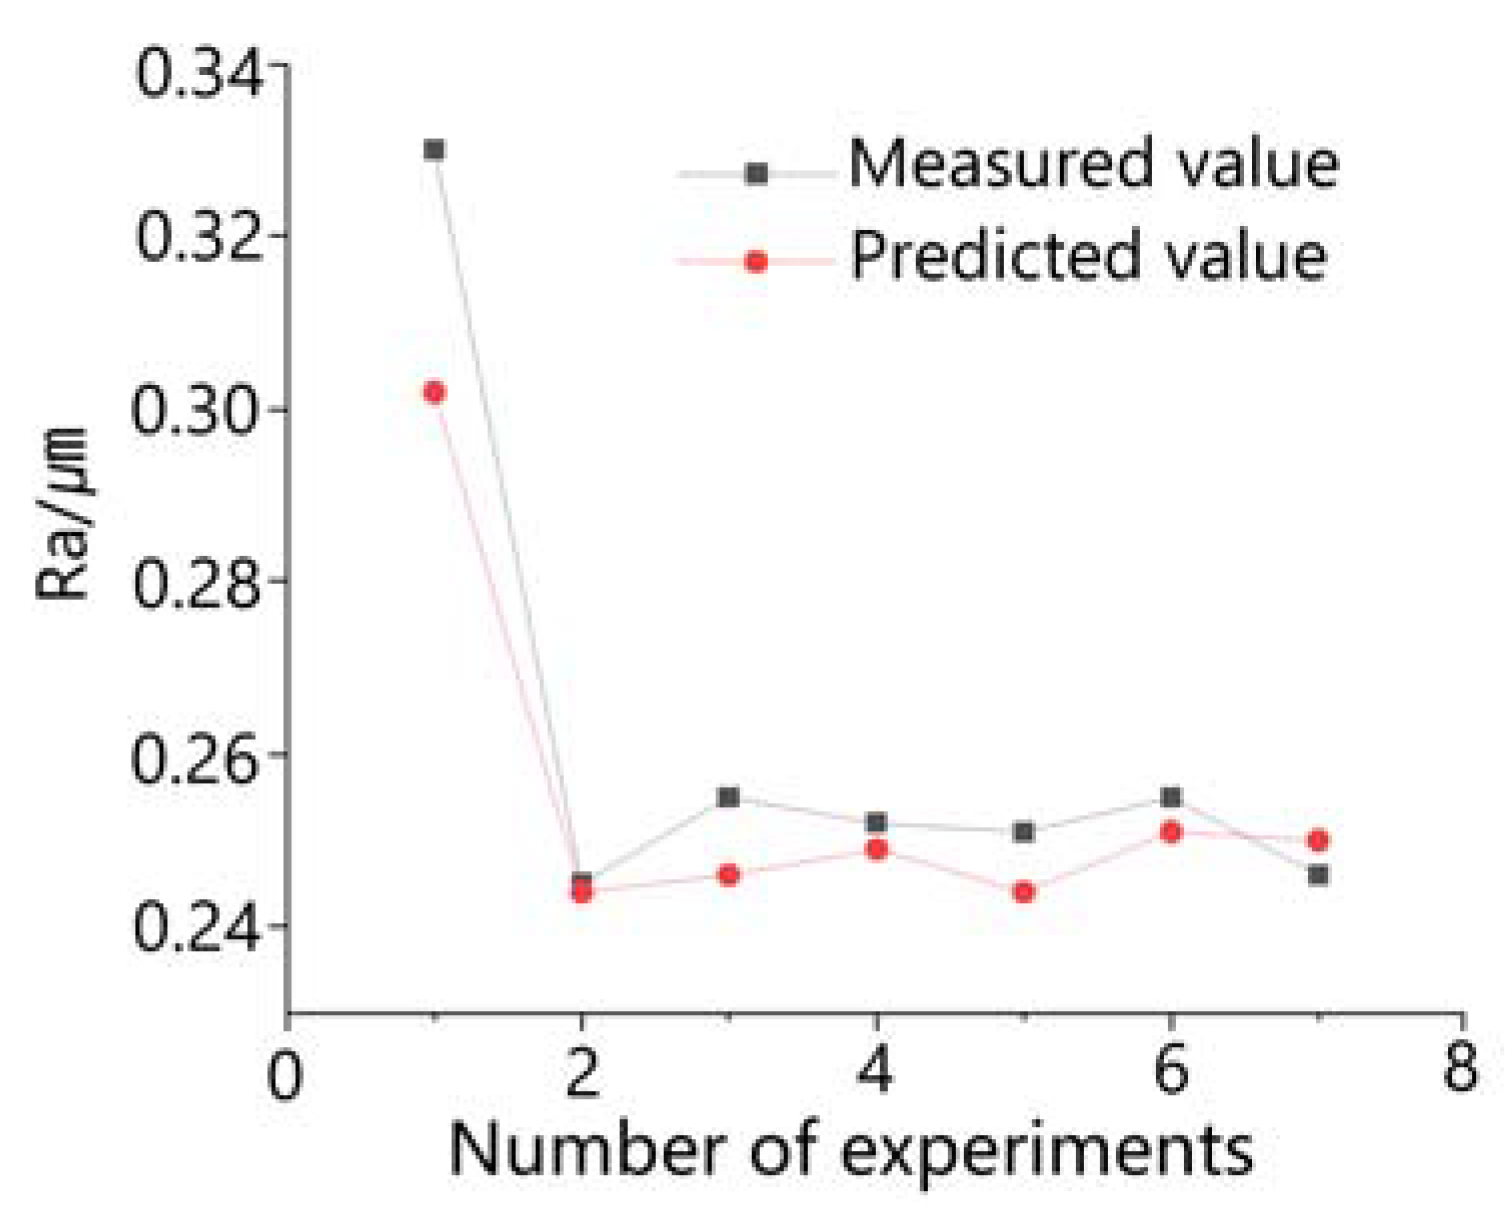
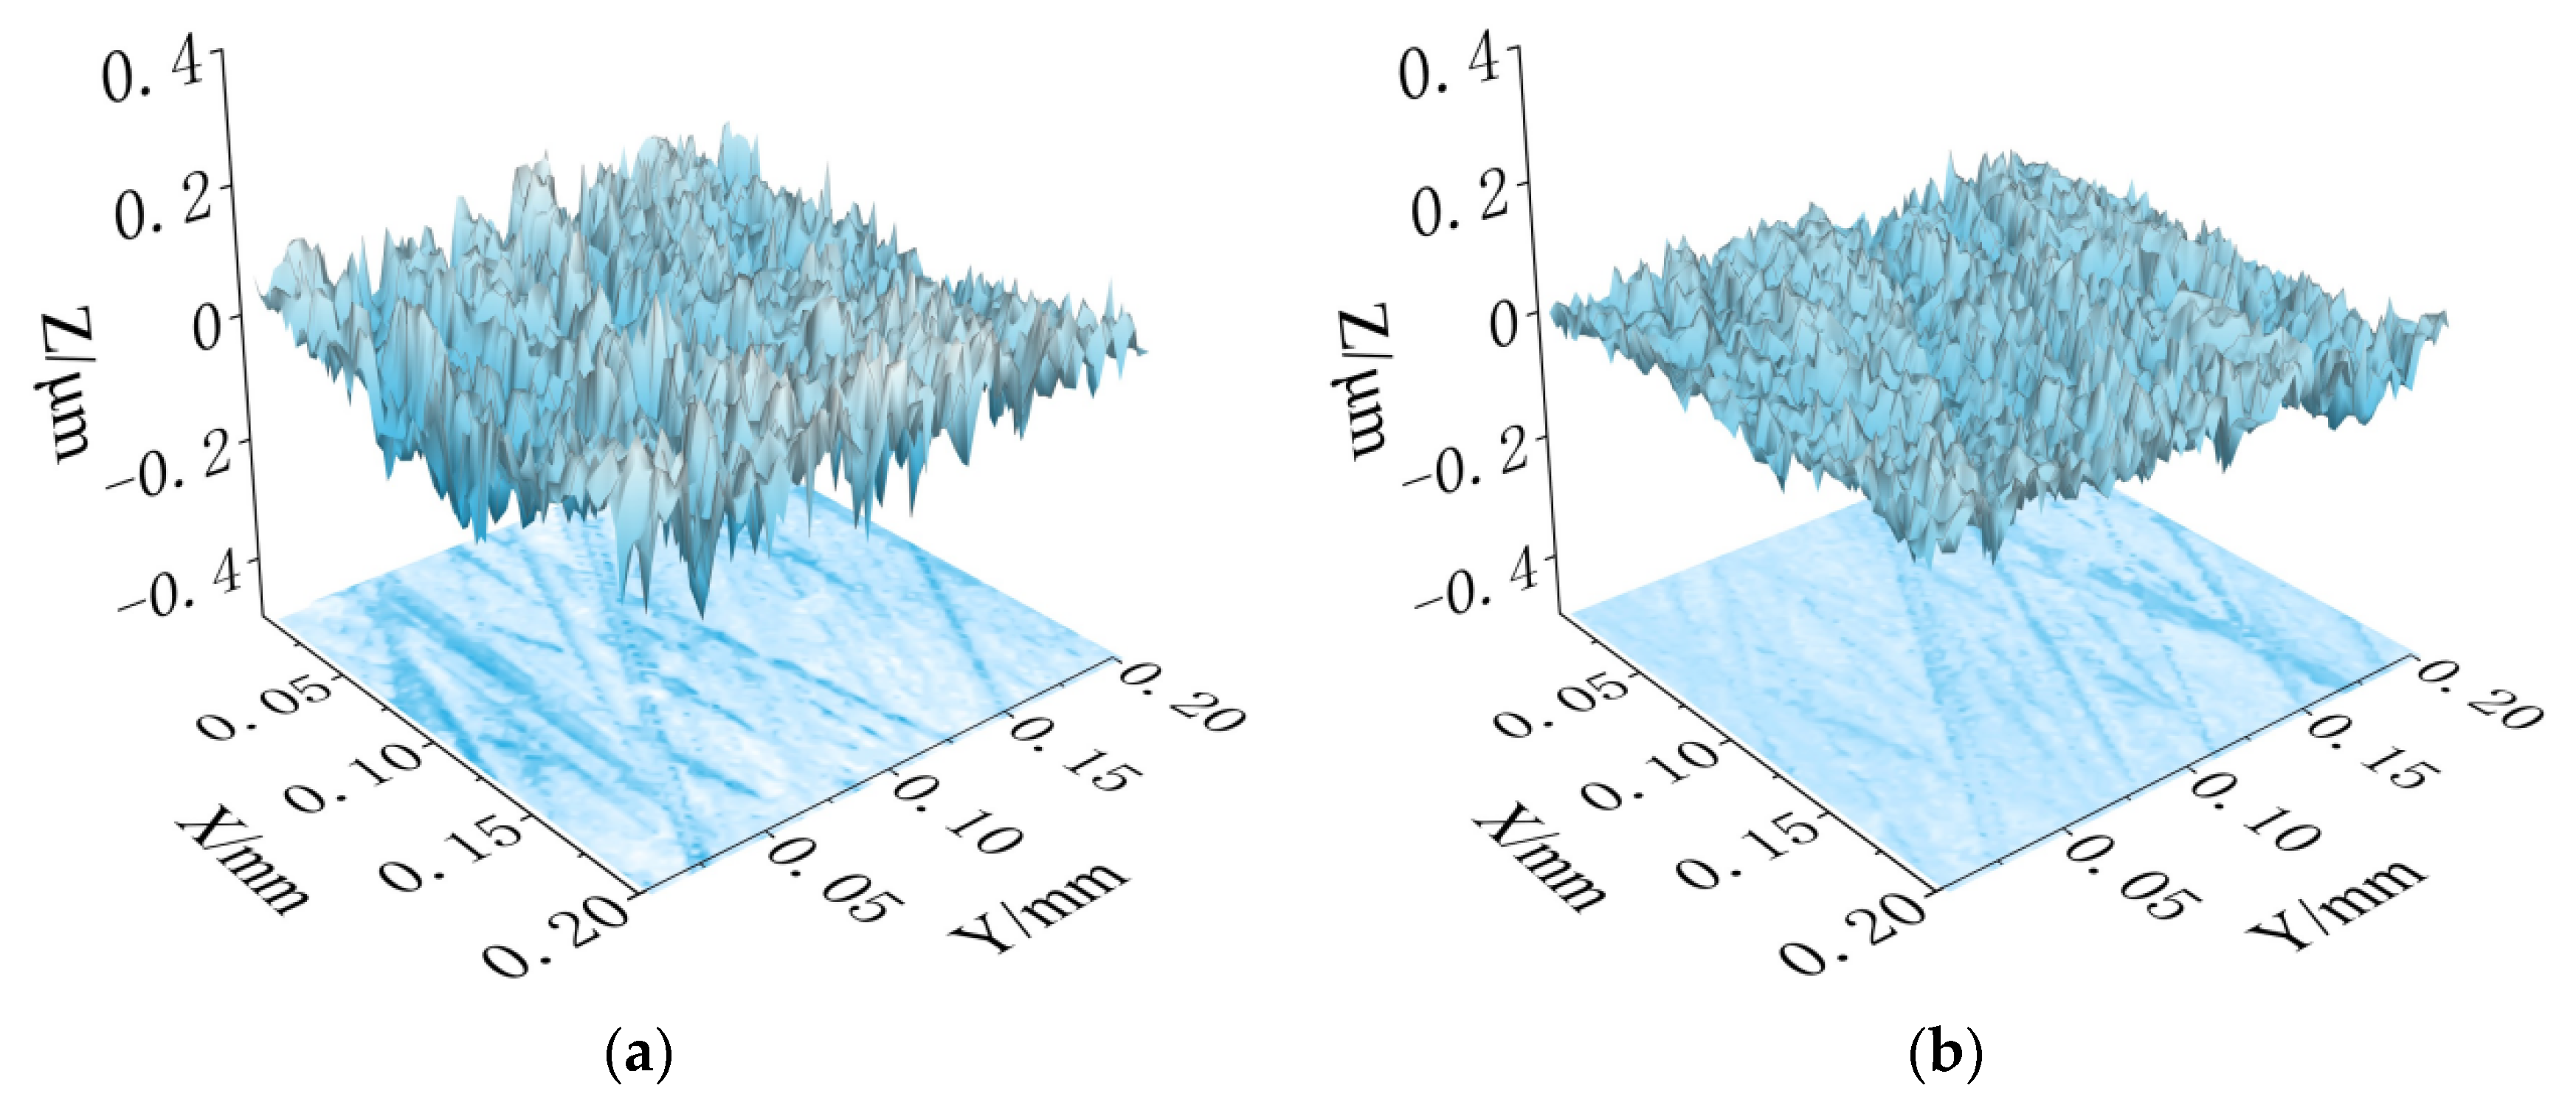
- The optimized mathematical model of Ra was established under the condition of 20 mm extension and 600 mesh oilstone, and the combination of parameters (V1 = 113 r/min, V2 = 41 m/min, and ∆x = 0.007 mm) with minimum Ra (0.244 μm) was calculated. Compared with that before optimization, the roughness quality was improved by 25.8%.
Author Contributions
Funding
Institutional Review Board Statement
Informed Consent Statement
Data Availability Statement
Conflicts of Interest
References
- Huang, X. Research on the Grinding Burn of the Ultrahigh Strength Steel AerMet100. Chin. J. Mech. Eng. 2015, 51, 184–190. [Google Scholar] [CrossRef]
- Zahouani, H.; EL Mansori, M. Multi-scale and multi-fractal analysis of abrasive wear signature of honing process. Wear 2017, 376, 178–187. [Google Scholar] [CrossRef] [Green Version]
- Klocke, F. Manufacturing Processes 2: Grinding, Honing, Lapping; Springer: Berlin/Heidelberg, Germany, 2009. [Google Scholar]
- Moos, U.; Bähre, D. Analysis of Process Forces for the Precision Honing of Small Bores. Procedia CIRP 2015, 31, 387–392. [Google Scholar] [CrossRef] [Green Version]
- Lu, Q.; Zhou, G.; Zhao, F.; Ren, Y.; Li, L.; Luan, X.; Sutherland, J.W. Topology optimization of oilstone components considering carbon emissions associated with honing processes. J. Clean. Prod. 2019, 225, 181–195. [Google Scholar] [CrossRef]
- Grover, V.; Singh, A.K. Improved magnetorheological honing process for nanofinishing of variable cylindrical internal surfaces. Mater. Manuf. Process. 2017, 33, 1177–1187. [Google Scholar] [CrossRef]
- Droeder, K.; Hoffmeister, H.-W.; Grosse, T. Force-controlled form honing using a piezo-hydraulic form honing system. CIRP Ann. 2017, 66, 317–320. [Google Scholar] [CrossRef]
- Buj-Corral, I.; Álvarez-Flórez, J.; Domínguez-Fernández, A. Acoustic emission analysis for the detection of appropriate cutting operations in honing processes. Mech. Syst. Signal Process. 2018, 99, 873–885. [Google Scholar] [CrossRef]
- Buj-Corral, I.; Vivancos-Calvet, J.; Setien, I.; Sebastian, M.S. Residual stresses induced by honing processes on hardened steel cylinders. Int. J. Adv. Manuf. Technol. 2017, 88, 2321–2329. [Google Scholar] [CrossRef]
- Ma, S.; Liu, Y.; Wang, Z.; Wang, Z.; Huang, R.; Xu, J. The Effect of Honing Angle and Roughness Height on the Tribological Performance of CuNiCr Iron Liner. Metals 2019, 9, 487. [Google Scholar] [CrossRef] [Green Version]
- Barros, G.H.C.; Schramm, C.R.; Franco, S.D.; Arantes, L.J.; Arencibia, R.V. Effect of grain size and number of strokes on Rk parameters and emptiness coefficient in honing process. Int. J. Adv. Manuf. Technol. 2019, 103, 3717–3734. [Google Scholar] [CrossRef]
- Muratov, R.A.; Muratov, K.R.; Gashev, E.A.; Ablyaz, T.R. Control of Surface Roughness in Raster Honing. Russ. Eng. Res. 2021, 41, 442–444. [Google Scholar] [CrossRef]
- Yang, C.; Su, H.; Gao, S.; Fu, Y.; Ding, W.; Xu, J. Surface quality and geometric accuracy control of fuel nozzle single-pass honing. Int. J. Adv. Manuf. Technol. 2021, 114, 3325–3336. [Google Scholar] [CrossRef]
- Box, G.E.P.; Wilson, K.B. On the Experimental Attainment of Optimum Conditions; Springer: New York, NY, USA, 1992. [Google Scholar]
- Nguyen, T.-T.; Vu, T.-C.; Duong, Q.-D. Multi-responses optimization of finishing honing process for surface quality and production rate. J. Braz. Soc. Mech. Sci. Eng. 2020, 42, 604. [Google Scholar] [CrossRef]
- Sadizade, B.; Araee, A.; Oliaei, S.N.B.; Farshi, V.R. Plateau honing of a diesel engine cylinder with special topography and reasonable machining time. Tribol. Int. 2020, 146, 106204. [Google Scholar] [CrossRef]
- Lawrence, K.D.; Ramamoorthy, B. Multi-surface topography targeted plateau honing for the processing of cylinder liner surfaces of automotive engines. Appl. Surf. Sci. 2016, 365, 19–30. [Google Scholar] [CrossRef]
- Liu, D.; Huang, C.; Wang, J.; Zhu, H.; Yao, P.; Liu, Z. Modeling and optimization of operating parameters for abrasive waterjet turning alumina ceramics using response surface methodology combined with Box–Behnken design. Ceram. Int. 2014, 40, 7899–7908. [Google Scholar] [CrossRef]
- Ciggin, A.S.; Sarica, E.S.; Doğruel, S.; Orhon, D. Impact of ultrasonic pretreatment on Fenton-based oxidation of olive mill wastewater—Towards a sustainable treatment scheme. J. Clean. Prod. 2021, 313, 127948. [Google Scholar] [CrossRef]
- Sindhu, D.; Thakur, L.; Chandna, P. Parameter Optimization of Rotary Ultrasonic Machining on Quartz Glass Using Response Surface Methodology (RSM). Silicon 2019, 12, 629–643. [Google Scholar] [CrossRef]
- Kanchana, J.; Prasath, V.; Krishnaraj, V. Multi response optimization of process parameters using grey relational analysis for milling of hardened Custom 465 steel. Procedia Manuf. 2019, 30, 451–458. [Google Scholar] [CrossRef]
- Wu, X.; Yang, Y.; Tong, X.; Shu, X.; Li, Y. The Grey Theory Combining the Taguchi Method for the Best Parameters: A Case Study of Polishing M300 Steel. Math. Probl. Eng. 2019, 2019, 7306841. [Google Scholar] [CrossRef]
- Tung, L.A.; Pi, V.N.; Lien, V.T.; Hong, T.T.; Hung, L.X.; Long, B.T. Optimization of dressing parameters of grinding wheel for 9CrSi tool steel using the taguchi method with grey relational analysis. In Proceedings of the IOP Conference Series: Materials Science and Engineering, Bangkok, Thailand, 21–23 January 2019. [Google Scholar]
- Wang, Q.; Yang, J. Experimental Design and Analysis, 2nd ed.; China Agricultural Press: Beijing, China, 2007. [Google Scholar]
- Wang, R. Experimental Design and Analysis, 3rd ed.; China Statistics Press: Beijing, China, 1998. [Google Scholar]
- Zhang, Z.; Yao, P.; Huang, C.; Wang, J.; Xue, D.; Deng, W.; Zhang, Z. Investigation and modeling of microgrooves generated on diamond grinding wheel by abrasive waterjet based on Box–Behnken experimental design. Int. J. Adv. Manuf. Technol. 2018, 100, 321–332. [Google Scholar] [CrossRef]
- Gao, S.; Yang, C.; Xu, J.; Fu, Y.; Zhou, X.; Yan, W.; Zou, P. Study on Surface Roughness of Nickel-based Supperalloy during Honing. China Mech. Eng. 2017, 28, 223–232. [Google Scholar] [CrossRef]
- El Mansori, M.; Goeldel, B.; Sabri, L. Performance impact of honing dynamics on surface finish of precoated cylinder bores. Surf. Coat. Technol. 2013, 215, 334–339. [Google Scholar] [CrossRef] [Green Version]
- Mezghani, S.; Demirci, I.; Yousfi, M.; El Mansori, M. Mutual influence of crosshatch angle and superficial roughness of honed surfaces on friction in ring-pack tribo-system. Tribol. Int. 2013, 66, 54–59. [Google Scholar] [CrossRef] [Green Version]


| Items | Material Trademark | Surface Heat Treatment | Ra Value (μm) | Pore Size before Honing (mm) | Pore Size after Honing (mm) |
|---|---|---|---|---|---|
| Parameters | 12Cr2Ni4A | Carburizing + quenching (HRC ≥ 60) | ≤0.8 | Φ20 ± 0.005 | Φ20.05 ± 0.005 |
| Experiment | Grinding Head Rotation Speed, V1 (r/min) | Average Particle Size of Oilstone, P (mesh) | Workpiece Reciprocating Speed, V2 (m/min) | Single Grinding Depth, ∆x (mm) |
|---|---|---|---|---|
| 1 | 50 | 60 | 20 | 0.005 |
| 2 | 50 | 100 | 30 | 0.008 |
| 3 | 50 | 400 | 40 | 0.015 |
| 4 | 50 | 600 | 50 | 0.025 |
| 5 | 100 | 60 | 30 | 0.015 |
| 6 | 100 | 100 | 20 | 0.025 |
| 7 | 100 | 400 | 50 | 0.005 |
| 8 | 100 | 600 | 40 | 0.008 |
| 9 | 150 | 60 | 40 | 0.025 |
| 10 | 150 | 100 | 50 | 0.015 |
| 11 | 150 | 400 | 20 | 0.008 |
| 12 | 150 | 600 | 30 | 0.005 |
| 13 | 200 | 60 | 50 | 0.008 |
| 14 | 200 | 100 | 40 | 0.005 |
| 15 | 200 | 400 | 30 | 0.025 |
| 16 | 200 | 600 | 20 | 0.015 |
| Experiment | Average Roughness of 10 mm Extension | Average Roughness of 20 mm Extension | Average Roughness of 30 mm Extension | γ | ||||||
|---|---|---|---|---|---|---|---|---|---|---|
| δ | x | ξ | δ | x | ξ | δ | x | ξ | ||
| 1 | −4.082 | 0.722 | 0.409 | −4.657 | 0.705 | 0.415 | −4.807 | 0.703 | 0.416 | 0.413 |
| 2 | −6.411 | 0.491 | 0.505 | −6.783 | 0.481 | 0.510 | −7.576 | 0.440 | 0.532 | 0.516 |
| 3 | −8.090 | 0.358 | 0.582 | −7.250 | 0.438 | 0.533 | −9.020 | 0.332 | 0.601 | 0.572 |
| 4 | −10.722 | 0.197 | 0.718 | −11.341 | 0.150 | 0.769 | −13.112 | 0.109 | 0.821 | 0.769 |
| 5 | −3.809 | 0.753 | 0.399 | −3.675 | 0.829 | 0.376 | −4.365 | 0.753 | 0.399 | 0.391 |
| 6 | −5.099 | 0.613 | 0.449 | −5.917 | 0.565 | 0.469 | −6.267 | 0.554 | 0.475 | 0.464 |
| 7 | −9.244 | 0.281 | 0.640 | −9.499 | 0.263 | 0.655 | −10.034 | 0.267 | 0.652 | 0.649 |
| 8 | −11.869 | 0.140 | 0.781 | −12.217 | 0.104 | 0.827 | −14.657 | 0.049 | 0.911 | 0.840 |
| 9 | −1.917 | 1.000 | 0.333 | −2.476 | 1.000 | 0.333 | −2.476 | 1.000 | 0.333 | 0.333 |
| 10 | −5.730 | 0.552 | 0.475 | −6.614 | 0.496 | 0.502 | −7.190 | 0.471 | 0.515 | 0.497 |
| 11 | −9.499 | 0.266 | 0.653 | −8.995 | 0.299 | 0.626 | −9.499 | 0.300 | 0.625 | 0.635 |
| 12 | −15.598 | 0.000 | 1.000 | −14.610 | 0.000 | 1.000 | −16.138 | 0.000 | 1.000 | 1.000 |
| 13 | −4.041 | 0.726 | 0.408 | −3.768 | 0.816 | 0.380 | −4.322 | 0.758 | 0.397 | 0.395 |
| 14 | −7.151 | 0.429 | 0.538 | −7.351 | 0.429 | 0.538 | −7.766 | 0.424 | 0.541 | 0.539 |
| 15 | −7.618 | 0.393 | 0.560 | −7.618 | 0.406 | 0.552 | −8.046 | 0.403 | 0.554 | 0.555 |
| 16 | −12.217 | 0.124 | 0.801 | −11.213 | 0.157 | 0.761 | −13.765 | 0.082 | 0.859 | 0.807 |
| Levels | Grinding Head Rotation Speed (r/min) | Grind Grain Size (mesh) | Workpiece Reciprocating Speed (m/min) | Single Grinding Depth (mm) |
|---|---|---|---|---|
| K1 | 0.568 | 0.383 | 0.58 | 0.65 |
| K2 | 0.586 | 0.504 | 0.616 | 0.597 |
| K3 | 0.616 | 0.603 | 0.571 | 0.567 |
| K4 | 0.574 | 0.854 | 0.578 | 0.53 |
| Q | 0.048 | 0.471 | 0.045 | 0.12 |
| Factors | Grinding Head Rotation Speed, V1 (r/min) | Workpiece Reciprocation Speed, V2 (m/min) | Single Grinding Depth, ∆x (mm) |
|---|---|---|---|
| Level 1 | 50 | 30 | 0.005 |
| Level 2 | 100 | 40 | 0.015 |
| Level 3 | 150 | 50 | 0.025 |
| Items | Sum of Squares (10−3) | df | Mean Square (10−3) | F-Value | p-Value | Significance |
|---|---|---|---|---|---|---|
| Model | 13.395 | 9 | 1.488 | 68.0925 | <0.0001 | Extremely significant |
| A—Grinding rotation speed | 0.545 | 1 | 0.545 | 24.9118 | <0.0001 | |
| B—Reciprocating velocity of workpiece | 0.032 | 1 | 0.032 | 1.4641 | 0.2656 | Not significant |
| C—Single grinding depth | 6.962 | 1 | 6.962 | 318.522 | <0.0001 | |
| AB | 0.342 | 1 | 0.342 | 15.6585 | 0.0055 | |
| AC | 0.156 | 1 | 0.156 | 7.1487 | 0.0318 | |
| BC | 0.056 | 1 | 0.056 | 2.5735 | 0.1527 | Not significant |
| A2 | 2.015 | 1 | 2.015 | 92.1805 | <0.0001 | |
| B2 | 0.995 | 1 | 0.995 | 45.5379 | 0.0003 | |
| C2 | 1.748 | 1 | 1.748 | 79.9721 | <0.0001 | |
| Residual | 0.153 | 7 | 0.022 | |||
| Lack of Fit | 0.153 | 3 | 0.051 | |||
| Pure Error | <0.0001 | 4 | <0.0001 | |||
| Cor Total | 13.548 | 16 |
| Experiment | Grinding Head Speed (r/min) | Reciprocating Velocity (m/min) | Single Grinding Depth (mm) | Ra (μm) |
|---|---|---|---|---|
| 1 | 100 | 30 | 0.025 | 0.33 |
| 2 | 113 | 41 | 0.007 | 0.245 |
| 3 | 120 | 45 | 0.008 | 0.255 |
| 4 | 120 | 35 | 0.008 | 0.252 |
| 5 | 120 | 45 | 0.01 | 0.251 |
| 6 | 100 | 40 | 0.005 | 0.255 |
| 7 | 100 | 35 | 0.01 | 0.246 |
Publisher’s Note: MDPI stays neutral with regard to jurisdictional claims in published maps and institutional affiliations. |
© 2021 by the authors. Licensee MDPI, Basel, Switzerland. This article is an open access article distributed under the terms and conditions of the Creative Commons Attribution (CC BY) license (https://creativecommons.org/licenses/by/4.0/).
Share and Cite
Tang, T.; Liu, C.; Wang, R. Optimization of Honing Surface Roughness of Carburized Holes Based on GRA-RSM. Machines 2021, 9, 291. https://doi.org/10.3390/machines9110291
Tang T, Liu C, Wang R. Optimization of Honing Surface Roughness of Carburized Holes Based on GRA-RSM. Machines. 2021; 9(11):291. https://doi.org/10.3390/machines9110291
Chicago/Turabian StyleTang, Tao, Chi Liu, and Rong Wang. 2021. "Optimization of Honing Surface Roughness of Carburized Holes Based on GRA-RSM" Machines 9, no. 11: 291. https://doi.org/10.3390/machines9110291