Article

Research on Thermal Error Modeling of Motorized Spindle Based on BP Neural Network Optimized by Beetle Antennae Search Algorithm

1
Key Laboratory of Advanced Manufacturing Intelligent Technology of Ministry of Education, Harbin University of Science and Technology, Harbin 150080, China
2
School of Mechanical and Power Engineering, Harbin University of Science and Technology, Harbin 150080, China
*
Author to whom correspondence should be addressed.
Machines 2021, 9(11), 286; https://doi.org/10.3390/machines9110286
Submission received: 12 October 2021 / Revised: 10 November 2021 / Accepted: 11 November 2021 / Published: 12 November 2021
(This article belongs to the Special Issue Optimal Design of a High-Speed Motor)

Abstract

:
High-speed motorized spindle heating will produce thermal error, which is an important factor affecting the machining accuracy of machine tools. The thermal error model of high-speed motorized spindles can compensate for thermal error and improve machining accuracy effectively. In order to confirm the high precision thermal error model, Beetle antennae search algorithm (BAS) is proposed to optimize the thermal error prediction model of motorized spindle based on BP neural network. Through the thermal characteristic experiment, the A02 motorized spindle is used as the research object to obtain the temperature and axial thermal drift data of the motorized spindle at different speeds. Using fuzzy clustering and grey relational analysis to screen temperature-sensitive points. Beetle antennae search algorithm (BAS) is used to optimize the weights and thresholds of the BP neural network. Finally, the BAS-BP thermal error prediction model is established. Compared with BP and GA-BP models, the results show that BAS-BP has higher prediction accuracy than BP and GA-BP models at different speeds. Therefore, the BAS-BP model is suitable for prediction and compensation of spindle thermal error.

1. Introduction

High-speed cutting is the main development direction of machining in the future. As a key part of a high-speed CNC machine tool, the performance of the motorized spindle affects the ability of the machine tool [1]. Thermal error caused by thermal drift accounts for 40–70% of the total error of machine tools [2,3]. Motorized spindles at high-speed will generate a lot of heat because they are not easy to heat, resulting in thermal deformation and reducing the machining accuracy of machine tools. Therefore, effective prediction and control of thermal error of motorized spindle is an important method to improve the machining accuracy of machine tools. At present, thermal error prevention and thermal error compensation are the main methods to solve the thermal error problem. Since there is no need to change the structure of the spindle, the thermal error compensation method is widely used at present [4,5]. In thermal error compensation, in order to obtain a good compensation effect, it is very important to establish a high-precision thermal error prediction model to accurately predict thermal error.
Firstly, the selection of temperature-sensitive points is the basis of establishing a thermal error model. It determines the accuracy and robustness of the model. Too many temperature sensitive points will increase the calculation amount and cost, while too few temperature sensitive points can not accurately reflect the change of temperature field, which affects the accuracy of the thermal error compensation model. Therefore, it is particularly important to select reasonable temperature-sensitive points. Ma et al. [6] based on fuzzy clustering theory and statistical correlation analysis, proposed a grouping and selection method for typical temperature variables. This method reduces the number of temperature measurement points, eliminates multicollinearity between temperature variables, and improves the accuracy of the thermal error model. Li et al. [7] proposed a temperature-sensitive point selection method based on integrated temperature information (STI), which solved the problem of incomplete clustering and the same number of temperature-sensitive points with different errors. Chiu et al. [8] used the Pearson correlation coefficient method to remove the temperature point with low correlation. Li et al. [9] used the method of combining fuzzy clustering with average influence value (FCM-MIV) to group temperature variables and select temperature sensitive points. Zhou et al. [10] used the K-means algorithm to cluster the temperatures of measuring points at different positions, and Pearson correlation coefficient was used to calculate the correlation between the temperature and the thermal error of the spindle. The selected temperature-sensitive points showed a significant linear relationship with the thermal error. Therefore, the optimization of temperature measuring points requires the selected temperature sensitive points to simplify the number of temperature variables as much as possible on the premise of reflecting the temperature change of the motorized spindle, which provides convenience for the subsequent thermal error modeling and at the same time improves the robustness of thermal error modeling.
The core of thermal error compensation technology is the thermal error prediction model. The thermal error prediction model with high accuracy and good robustness can effectively improve the machining accuracy of CNC machine tools. Domestic and foreign scholars have done a lot of research on thermal error modeling. Thermal error modeling methods mainly include multiple regression, least square method, support vector machine, neural network, grey system, mixed model and so on. Based on the regression analysis method, Chen and Lei [11,12] established an autoregressive model with temperature, thermal displacement and velocity as input variables. The results show that the prediction accuracy of the displacement-based model is higher, which has good effectiveness and robustness. However, the design of multiple regression models is both time-consuming and complex. Yang, Jiang and Zhao [13,14,15] established the least squares support vector machine (LS-SVM) model. The results show that the least squares support vector machine model not only has high prediction accuracy, but also has good robustness and generalization ability, which can well predict thermal errors. However, thermal deformation will reduce the prediction accuracy of the model due to the influence of the machining process and environment. As the most basic artificial neural network, error back propagation (BP) neural network is widely used in thermal error modeling of motorized spindles. Su and Liu [16,17] thermal error model is established by using the BP neural network. The results show that the BP neural network model can compensate for most of the thermal deformation. The parameters of the BP network are uncertain, so the convergence speed is slow and the local minimum is easy to fall into, which is difficult to obtain the global optimal solution. Huang and Li [18,19] use bat algorithm (BA), genetic algorithm (GA), mind evolution algorithm (MEA) and particle swarm optimization (PSO) to optimize the weights and thresholds of BP neural network, which is used to overcome these shortcomings. In Cui et al. [20] multiple linear regression (MLR) method, back propagation (BP) neural network method and radial basis function (RBF) neural network method were used to establish the thermal error prediction model of motorized spindle. The results show that the RBF neural network has the highest prediction accuracy. As a result of the number of hidden layer neurons being uncertain, the weight learning ability of the hidden layer is weak, which leads to the decline of learning ability and prediction accuracy. Zhang and Fu [21,22] improve the prediction accuracy of the RBF neural network by optimizing the base function center, width, hidden layer and output layer weights of RBF neural network based on genetic algorithm, particle swarm algorithm and chicken flock algorithm. Wang et al. [23] combine grey theory and neural network, and put forward a grey system model for thermal error prediction. The comparison of thermal error experiments shows that the grey system model has a good prediction effect. In order to establish a thermal error prediction model with high precision and strong anti-interference ability, Yao et al. [24] combined the grey model with least squares support vector machine, and proposed a new optimal and effective compound model (OM) for thermal error prediction of spindle. Abdulshahed and Dai [25,26] combined the learning rule of artificial neural networks with fuzzy logic theory, and established the thermal error prediction model of adaptive neural fuzzy inference system (ANFIS). The results show that the combined method can improve the accuracy and robustness of thermal error prediction.
BP neural network has strong linear mapping ability, strong generalization ability and high prediction accuracy.However, BP neural network is easy to fall into local extremum, which leads to slow convergence and low efficiency. Therefore, a large number of scholars closely combine the population evolution algorithm with BP neural network method, making full use of the advantages of population diversity of evolutionary algorithm and the self-adaptive and self-learning characteristics of BP network, so that the optimized model can obtain better prediction effect.Beetle antennae search algorithm is a monomer search algorithm which has the advantages of simple principle, fewer parameters and less computation, and has great advantages in dealing with low-dimensional optimization objectives. The biggest difference between the Beetle antennae search algorithm and other intelligent algorithms is the quantity. Other heuristic algorithms are basically based on groups, which cooperate with each other to obtain information. However, the Beetle antennae search algorithm relies on a single individual to optimize in space, and it has obvious advantages in optimization speed and calculation amount. In this paper, the BAS-BP neural network thermal error prediction model is established by combining the Beetle antennae search algorithm with BP neural network. Firstly, fuzzy clustering is used to cluster the temperature of measuring points at different positions, and the correlation between temperature and spindle thermal error is calculated by grey correlation degree, so as to screen out temperature sensitive points. The weight and threshold of the BP neural network are optimized by the Beetle antennae search algorithm, which improves the optimization ability of BP neural network, improves the prediction accuracy and reduces the prediction error. In order to verify the performance of the BAS-BP neural network model, it is compared with the GA-BP model.The thermal error model of A02 motorized spindle was verified at different rotational speeds. The results show that the prediction accuracy of the BAS-BP thermal error model is higher than that of the GA-BP model, and the amount of calculation is small. Therefore, this paper provides a feasible method for thermal error modeling of motorized spindles.

2. Experiment on Temperature Field and Thermal Error of Motorized Spindle

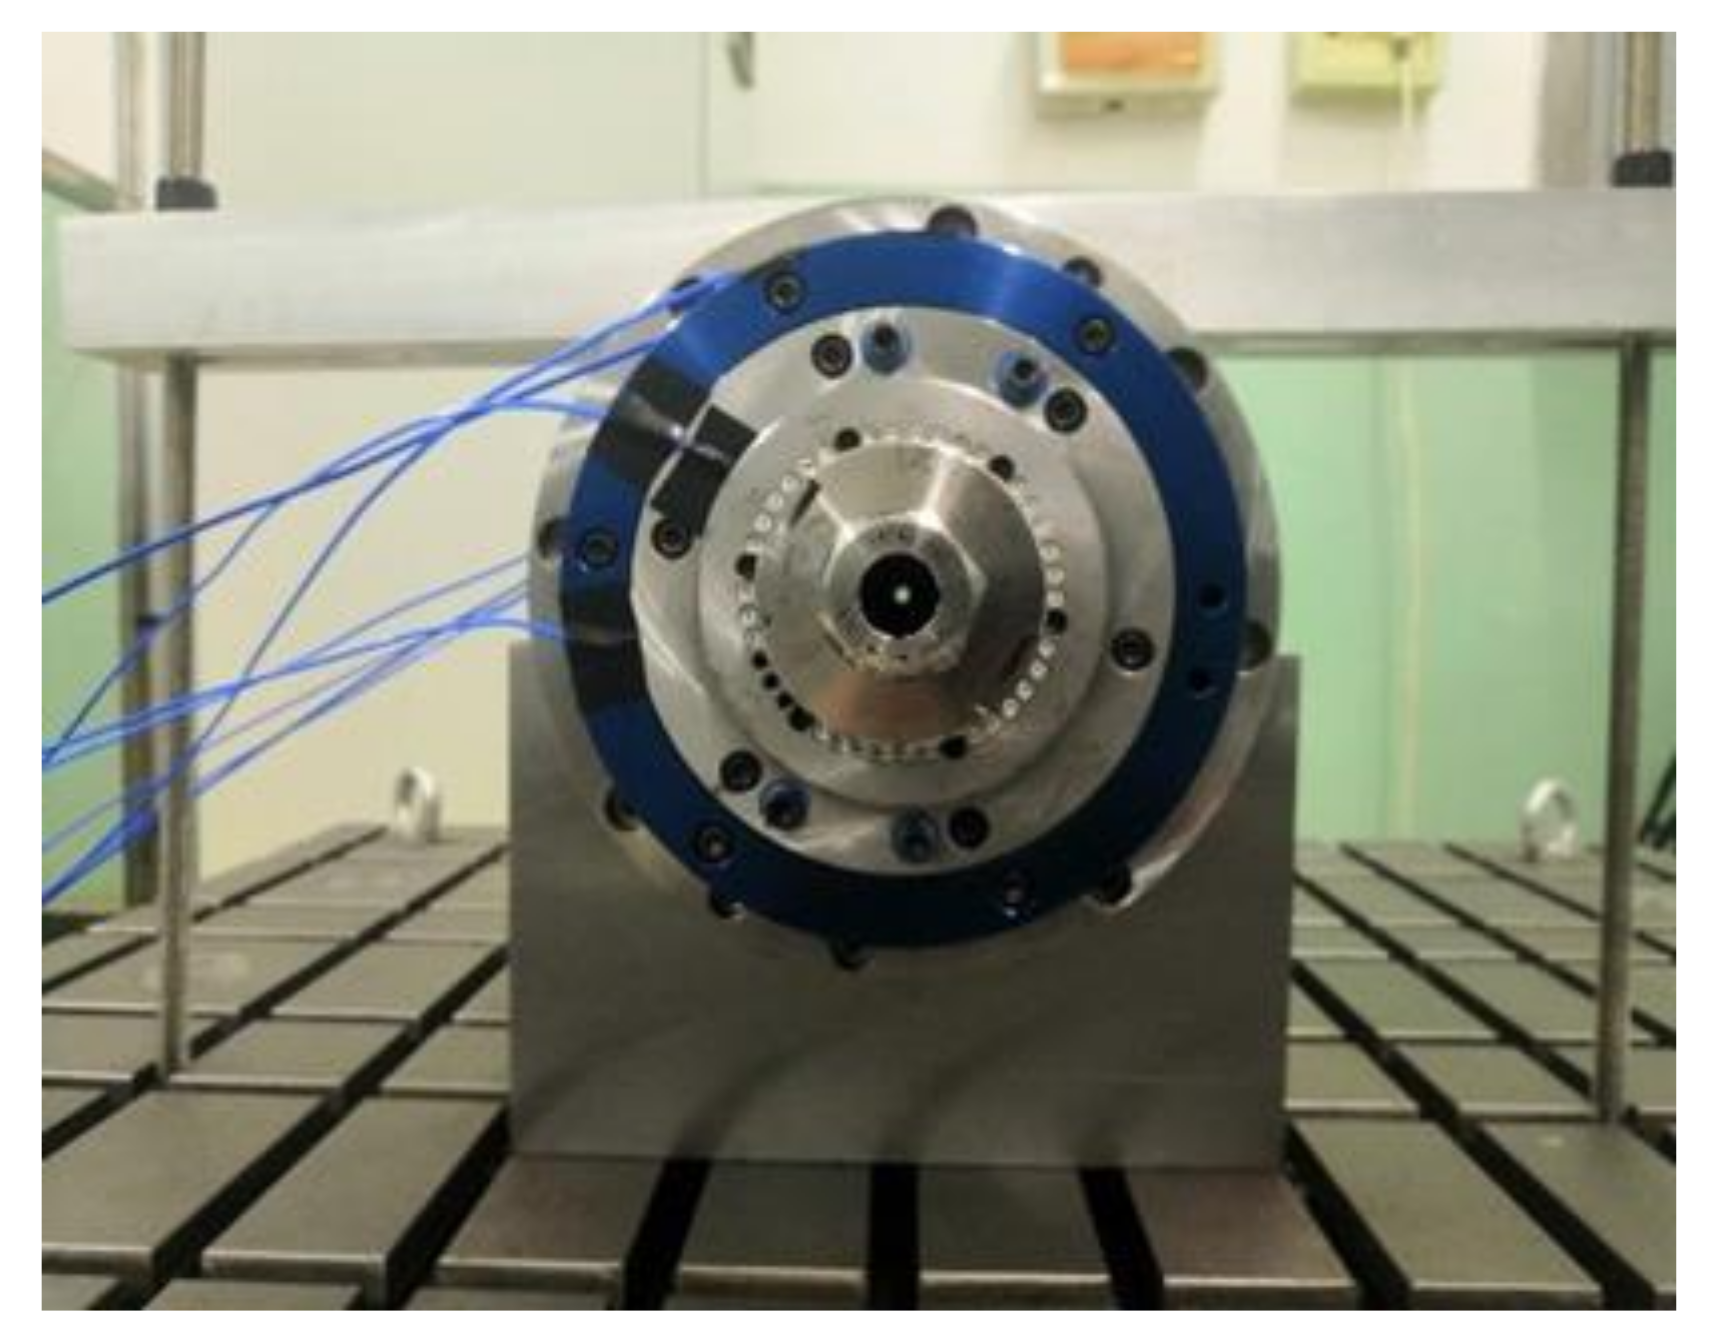
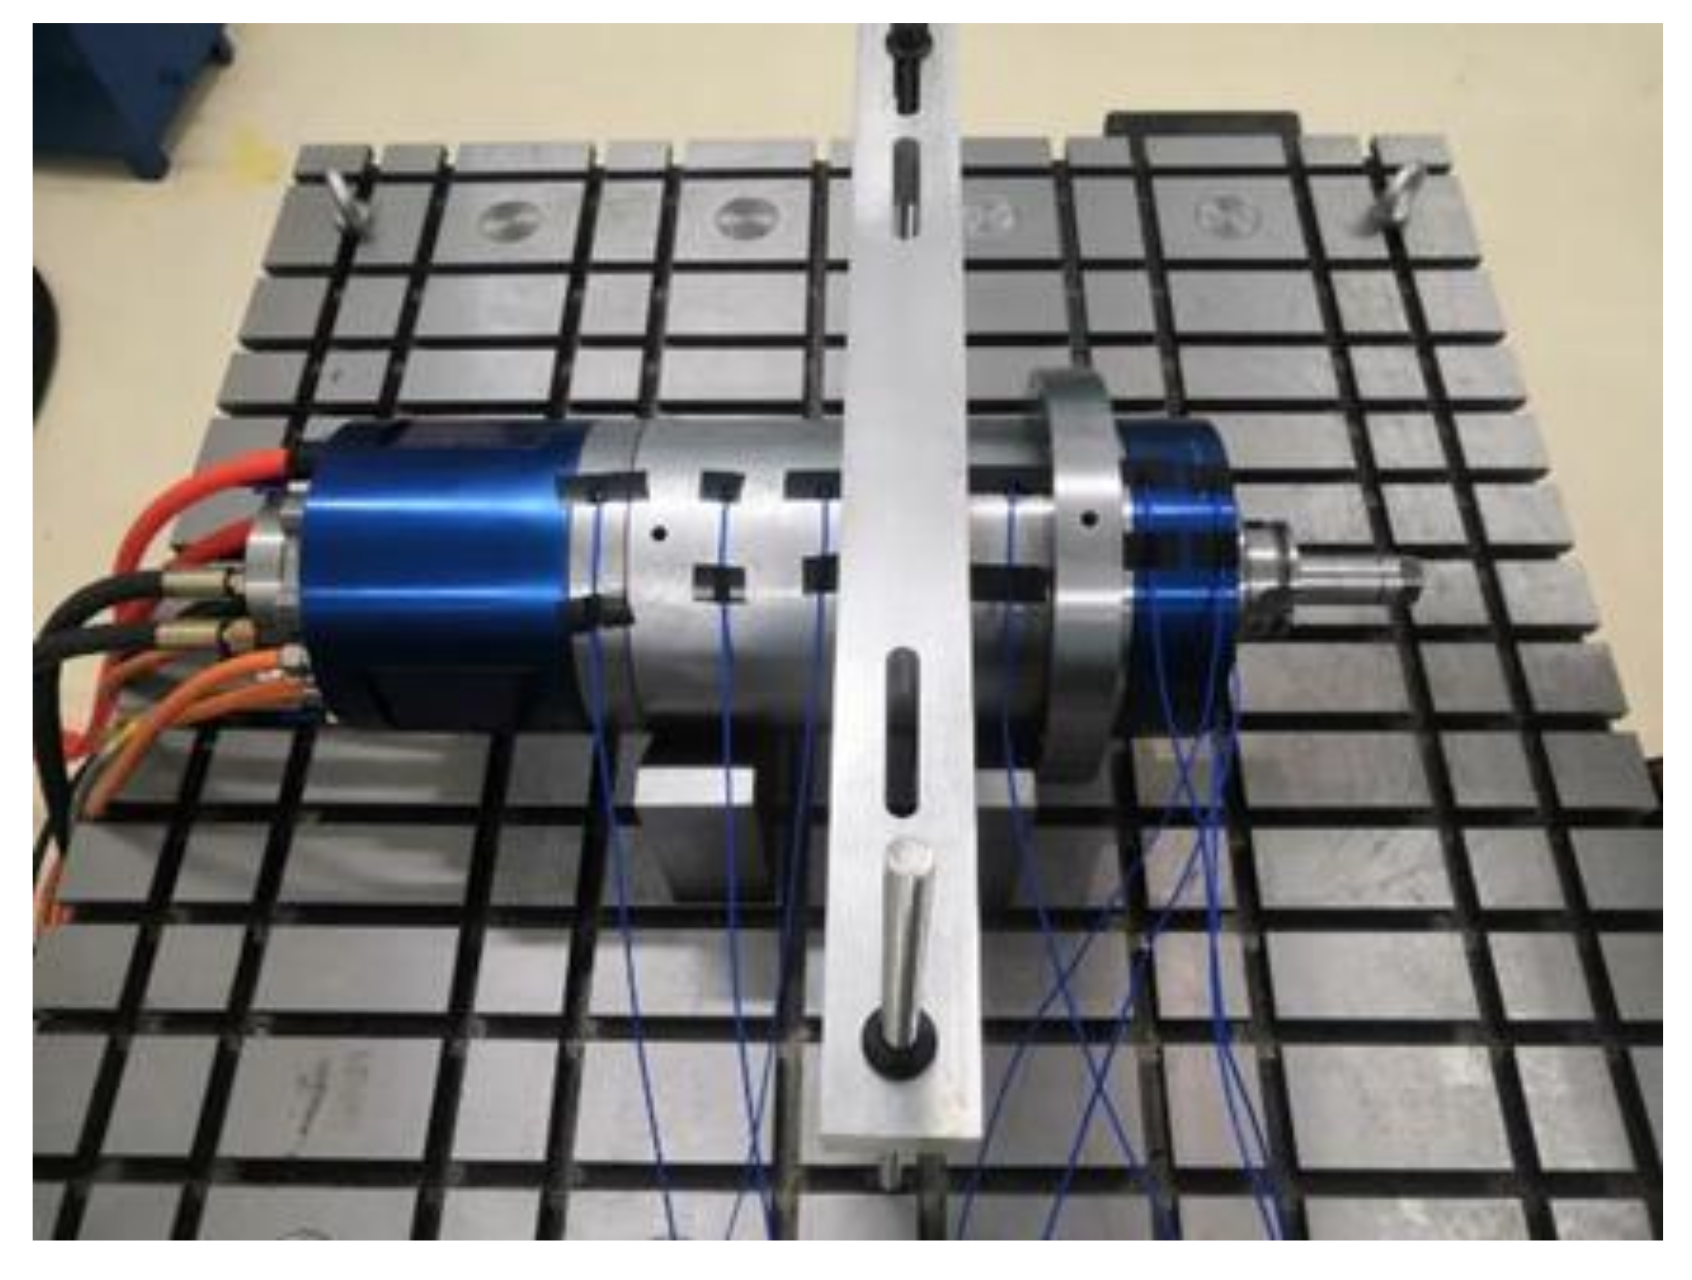
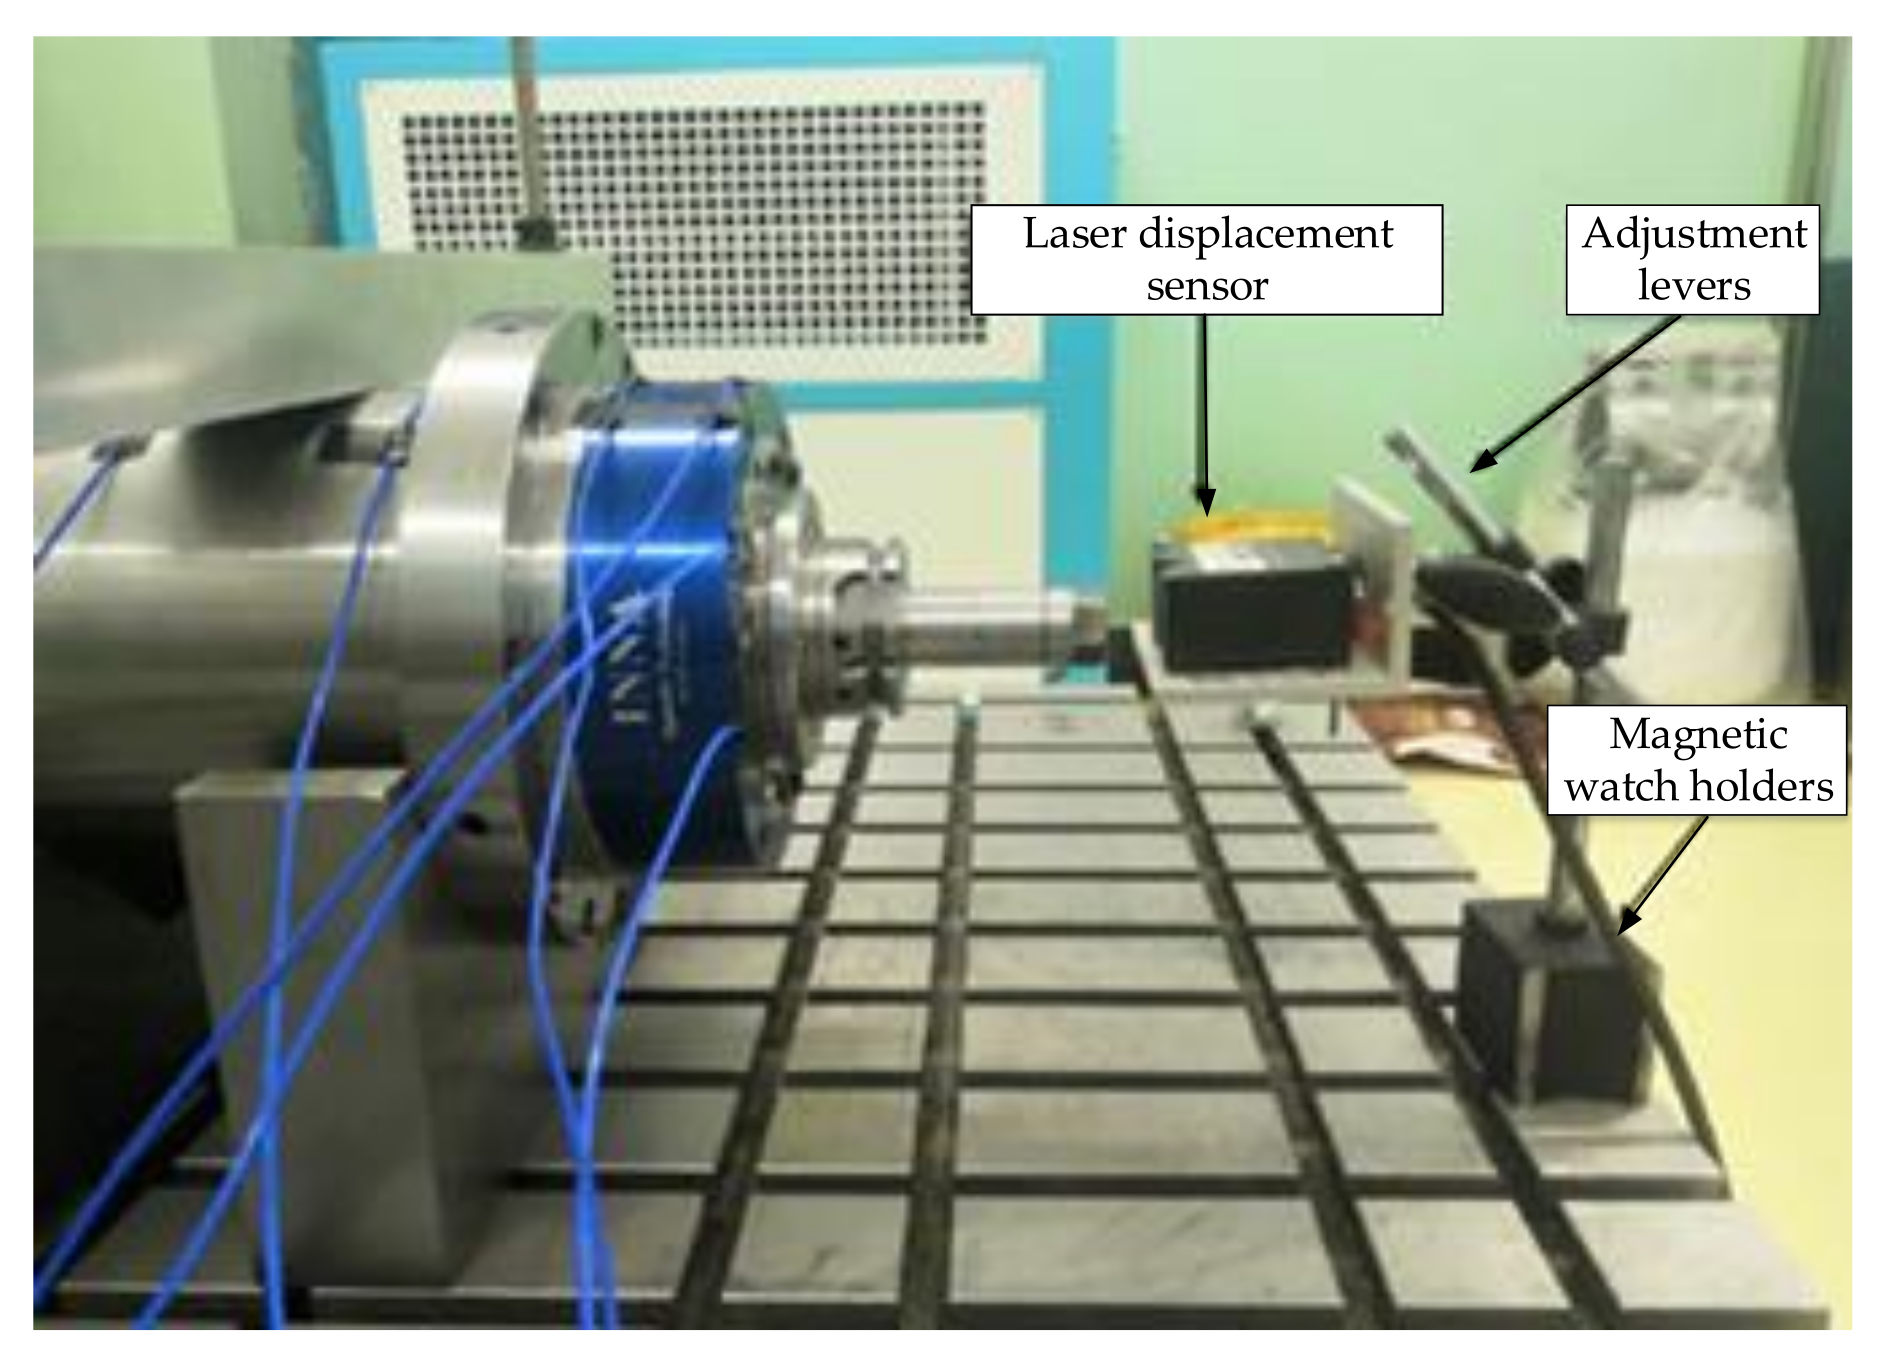
2.1. Experimental Platform Construction

In this paper, the thermal error measurement experiment is carried out on the A02 motorized spindle which is used in the joint laboratory of SKY NC High Speed Motorized Spindle of Harbin University of Science and Technology. K type thermocouple is used to measure the surface temperature of a motorized spindle. PT100 thermal resistor measures the internal temperature of the motorized spindle. K type thermocouple temperature measurement range 0–1300 °C. The allowable margin of error is ±0.75%t. t is the measured temperature value of the temperature sensing element. It has the advantages of relatively stable performance, simple structure and good dynamic response. The temperature measuring range of PT100 thermal resistor is −200–850 °C. The allowable margin of error is 0.15 + 0.002 × |t|. It has the advantages of high sensitivity, strong stability, good interchangeability and accuracy.
The layout of temperature measuring points should meet the following conditions: the temperature points should be near the heat source; the temperature points should be able to describe the temperature field; the temperature points should be closely related to the thermal error. Based on laboratory research of A02 motorized spindles and the published literature [26], 10 temperature measurement points are selected in this paper. The installation location of the temperature sensors is shown in Figure 1 and Figure 2. The layout diagram is shown in Figure 3. Table 1 shows the layout scheme of temperature sensors.
The motorized spindle has axial and radial thermal drift at different speeds. Compared with axial thermal drift, radial thermal drift is very small to be ignored [27,28]. In this paper, the LK-H020 laser displacement sensor is used to collect axial thermal error data of the motorized spindle. The sensor is installed on the experimental platform by magnetic table. The red laser beam is aligned with the front end of the spindle shank. The red laser is reflected back to the CCD linear camera inside the sensor through the front end of the spindle shank. According to the angle of laser emission and reflection and the distance between the laser and the camera, the distance between the sensor and the measured object can be calculated using the digital signal processor. It can accurately obtain the axial thermal drift data of the motorized spindle during high-speed rotation. The installation of the laser displacement sensor is shown in Figure 4.

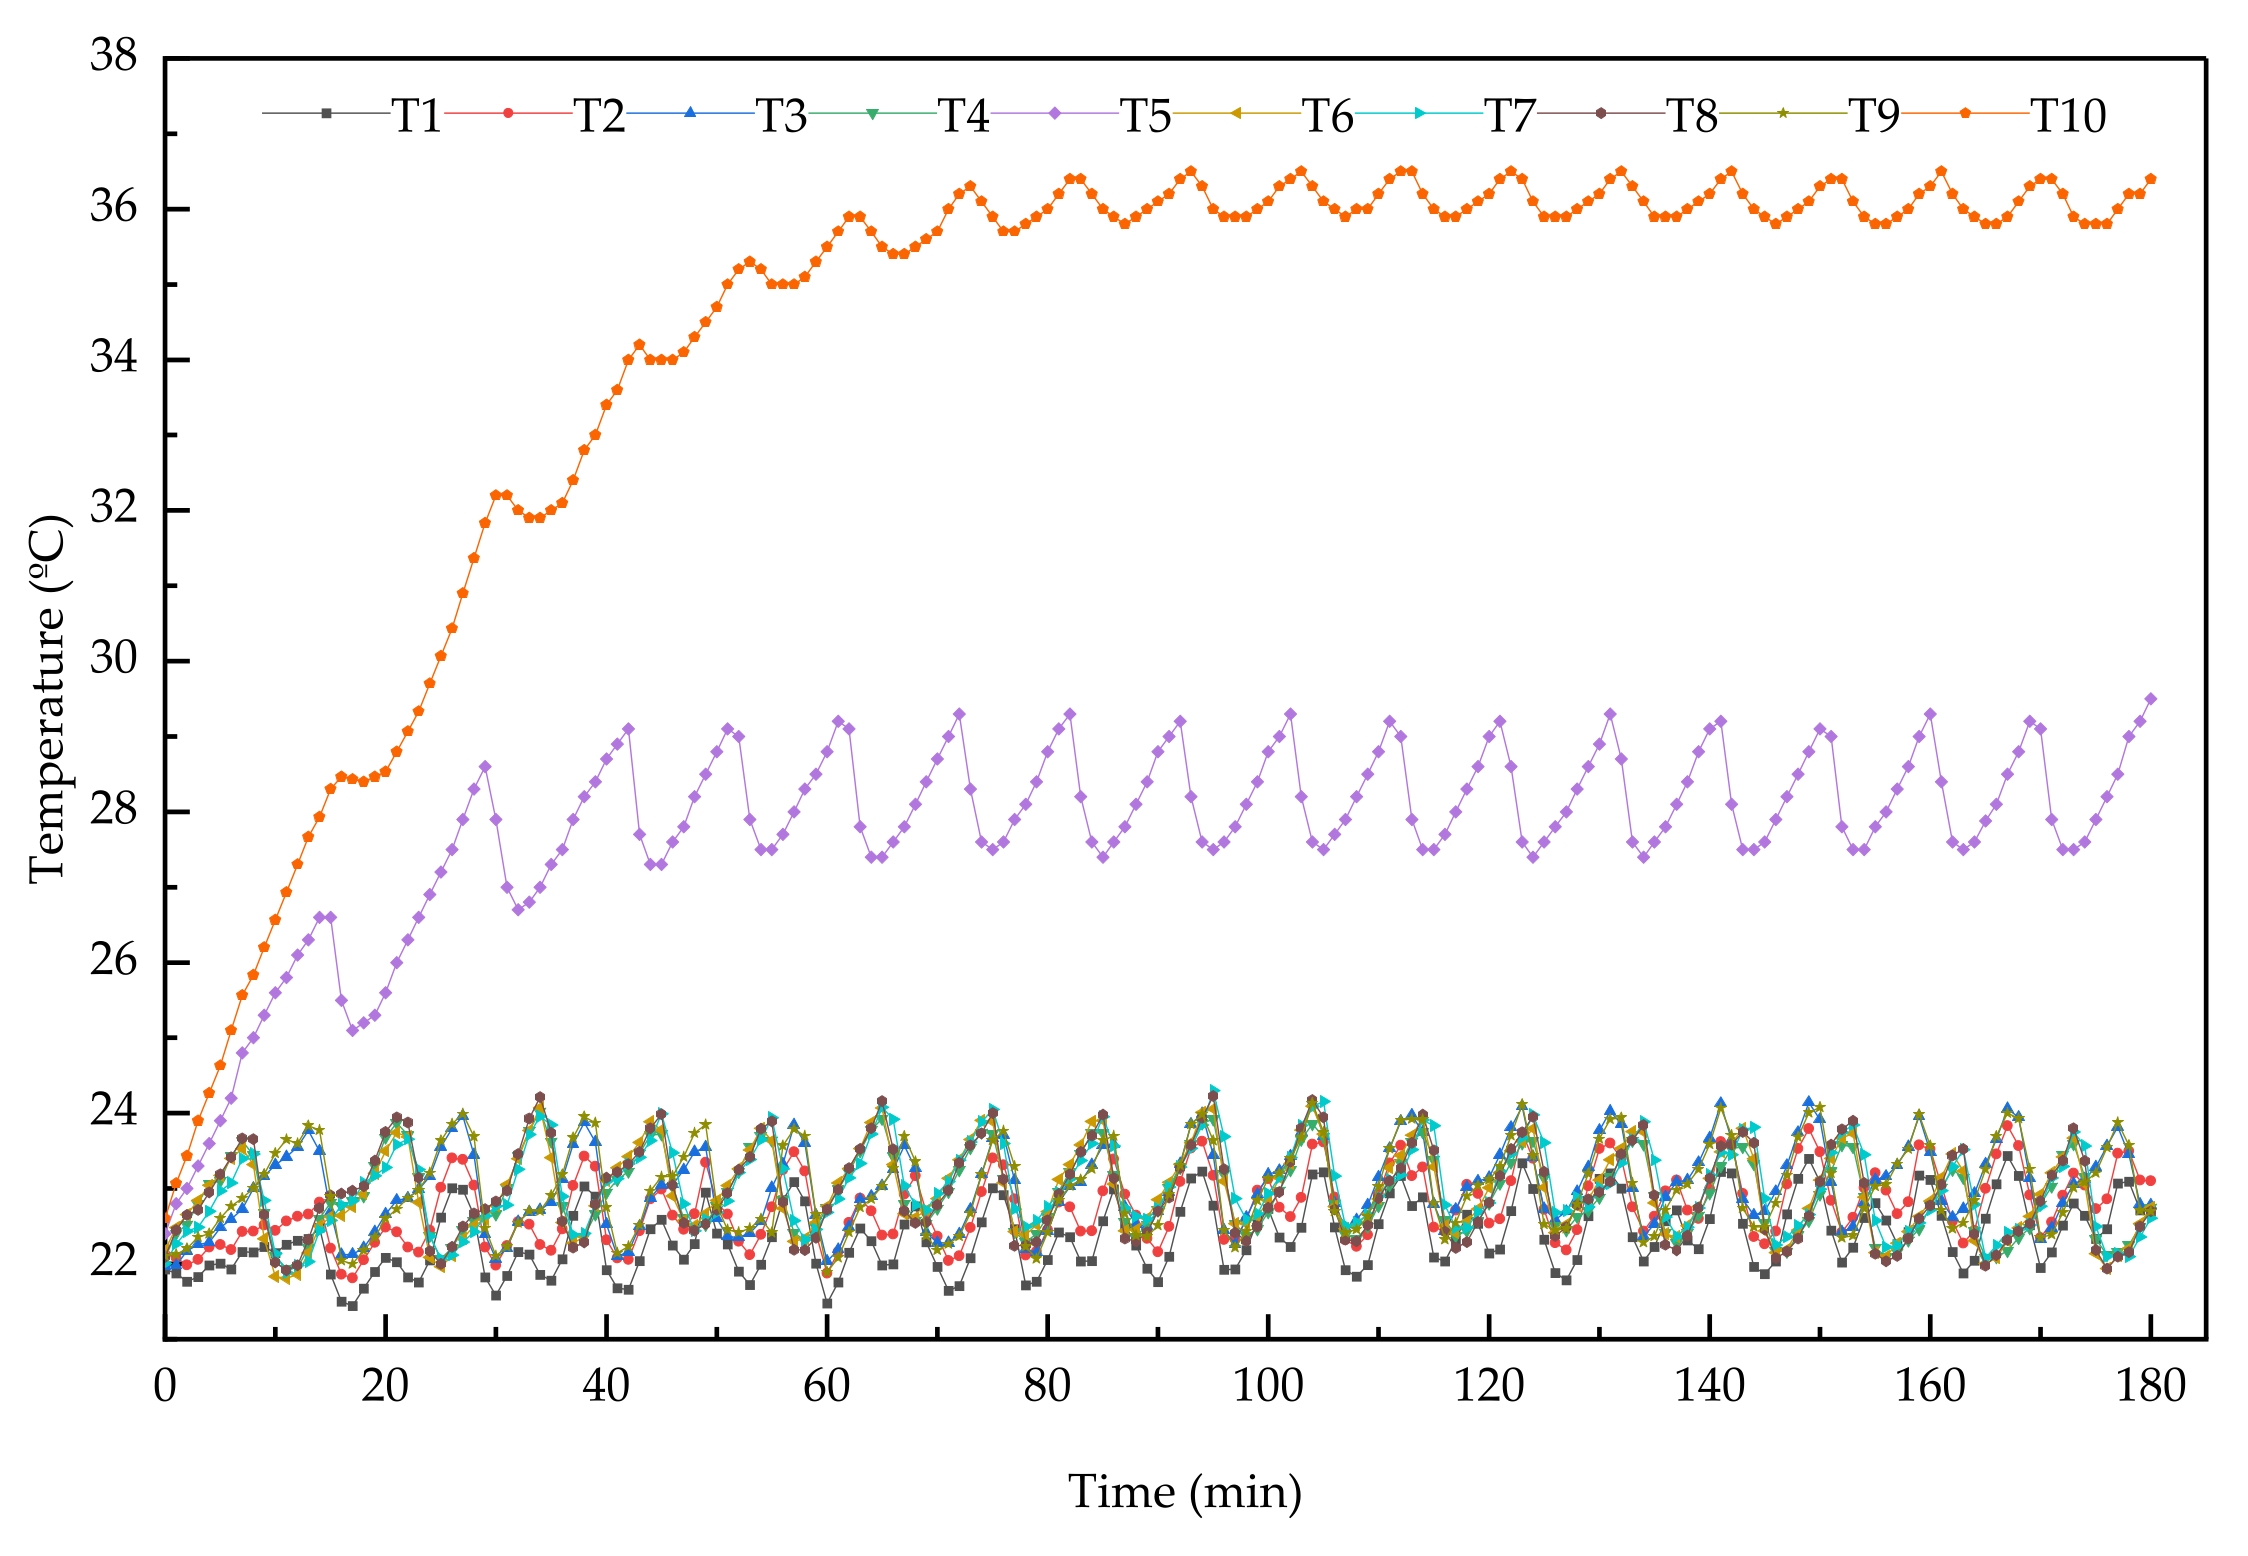
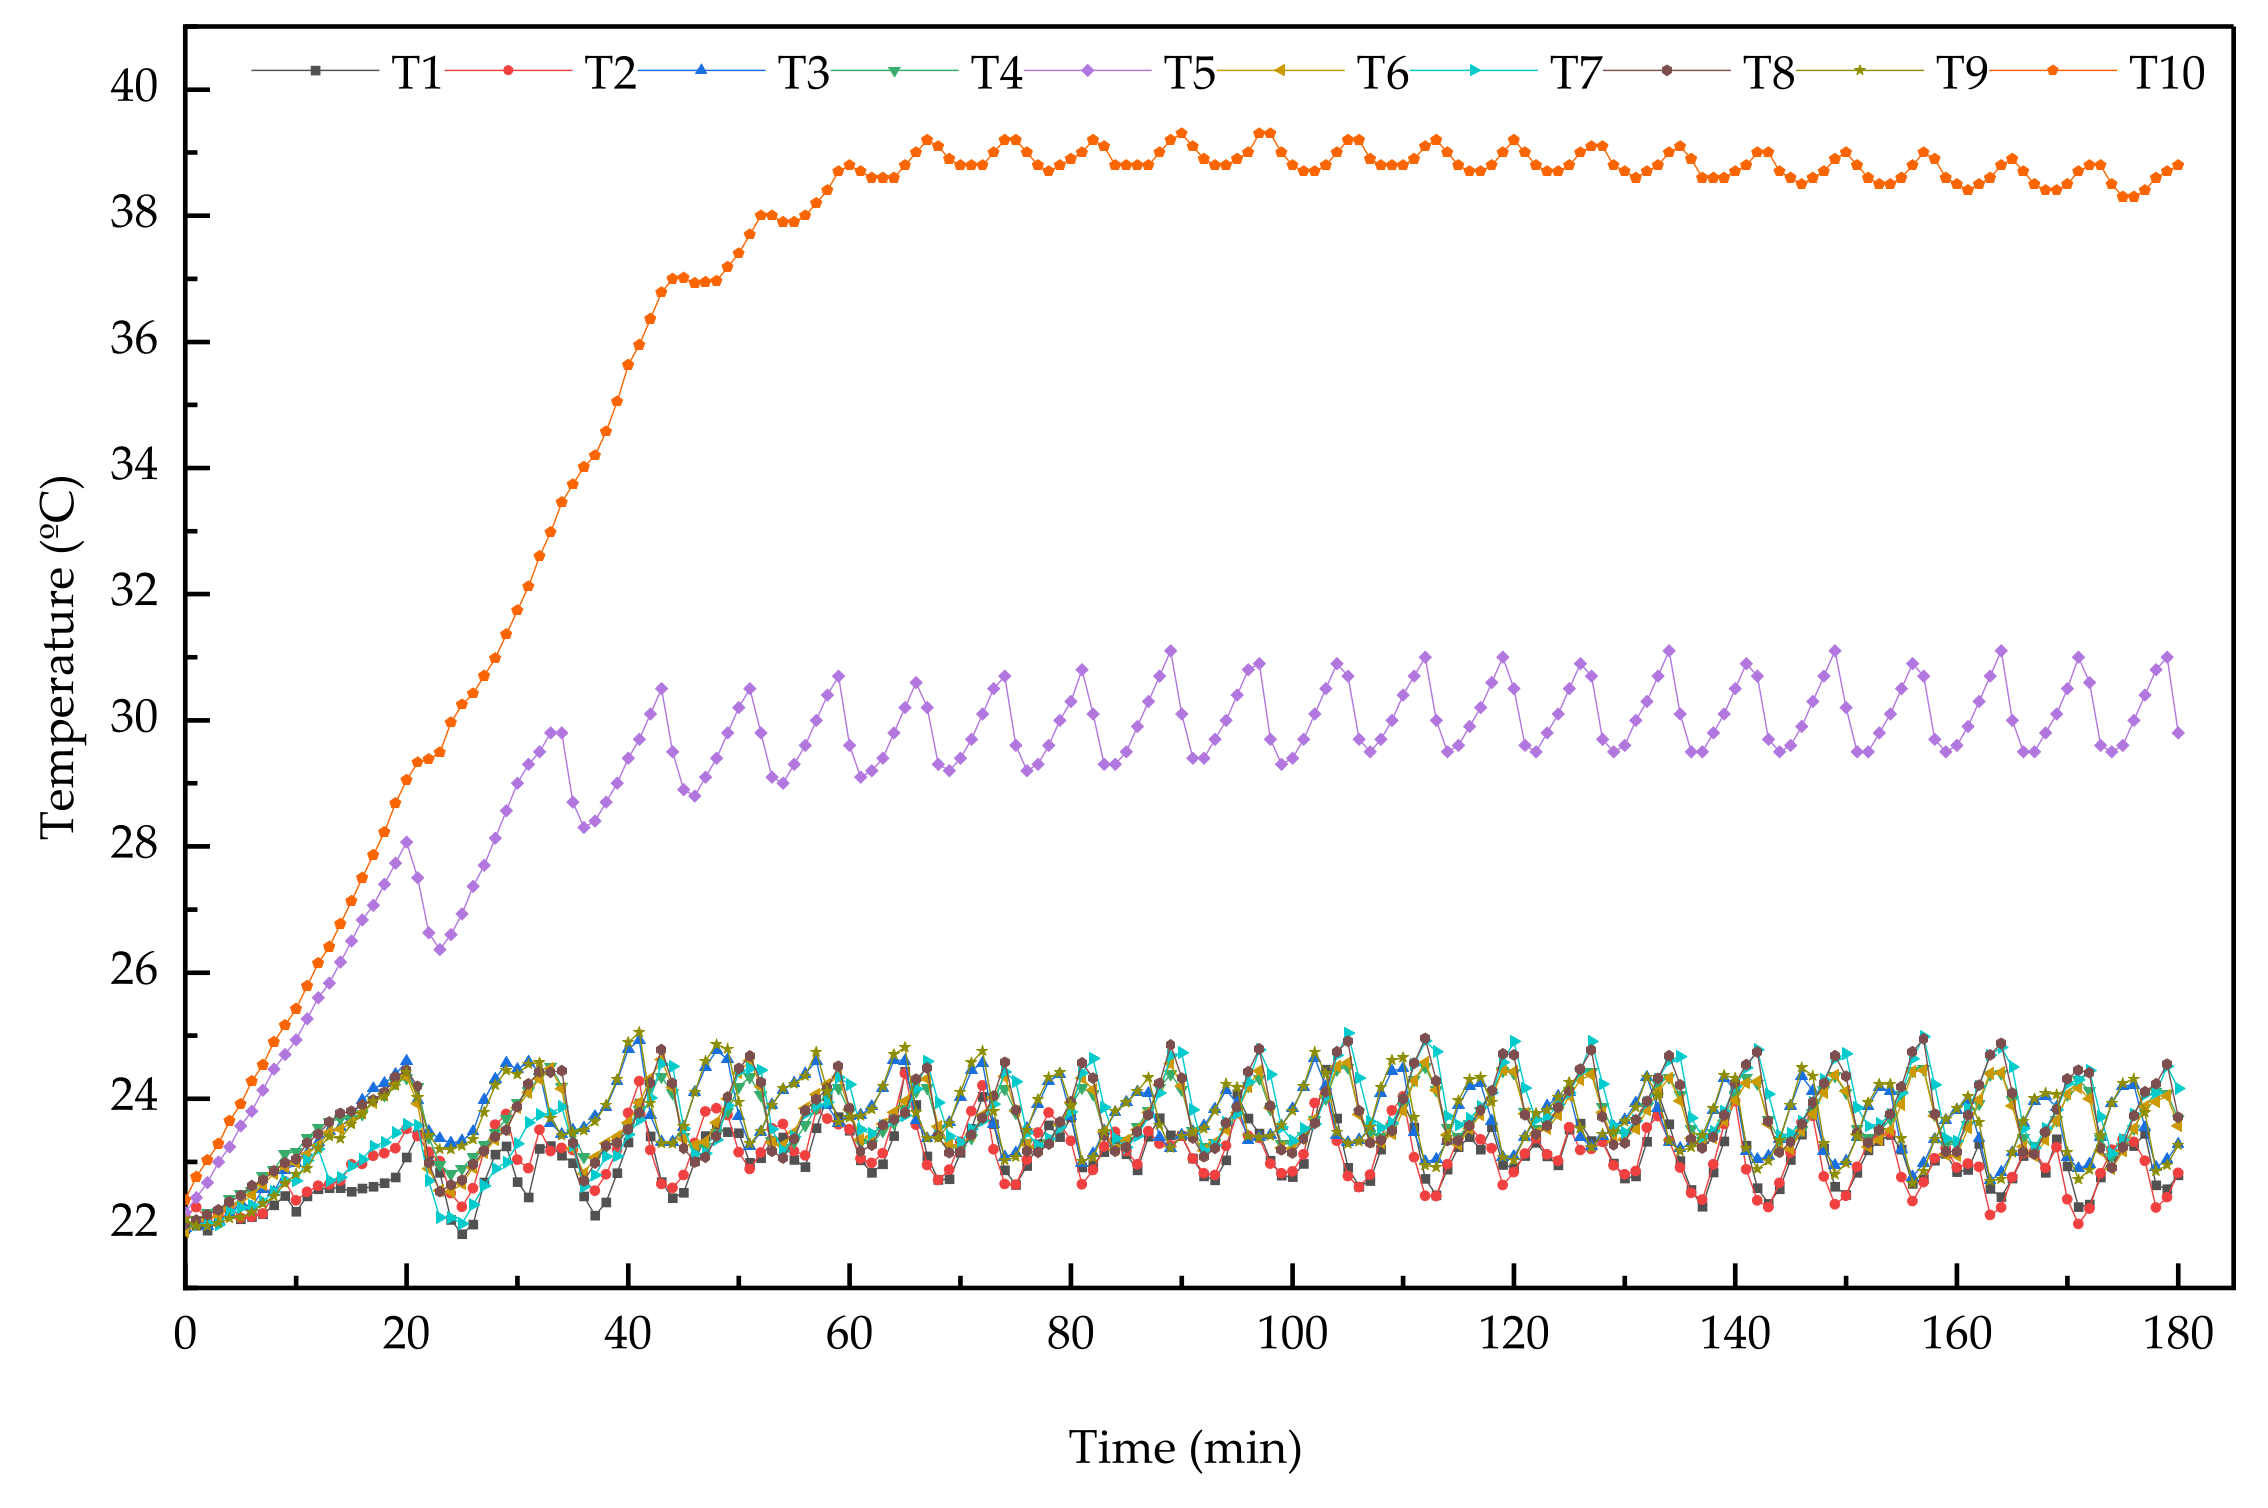
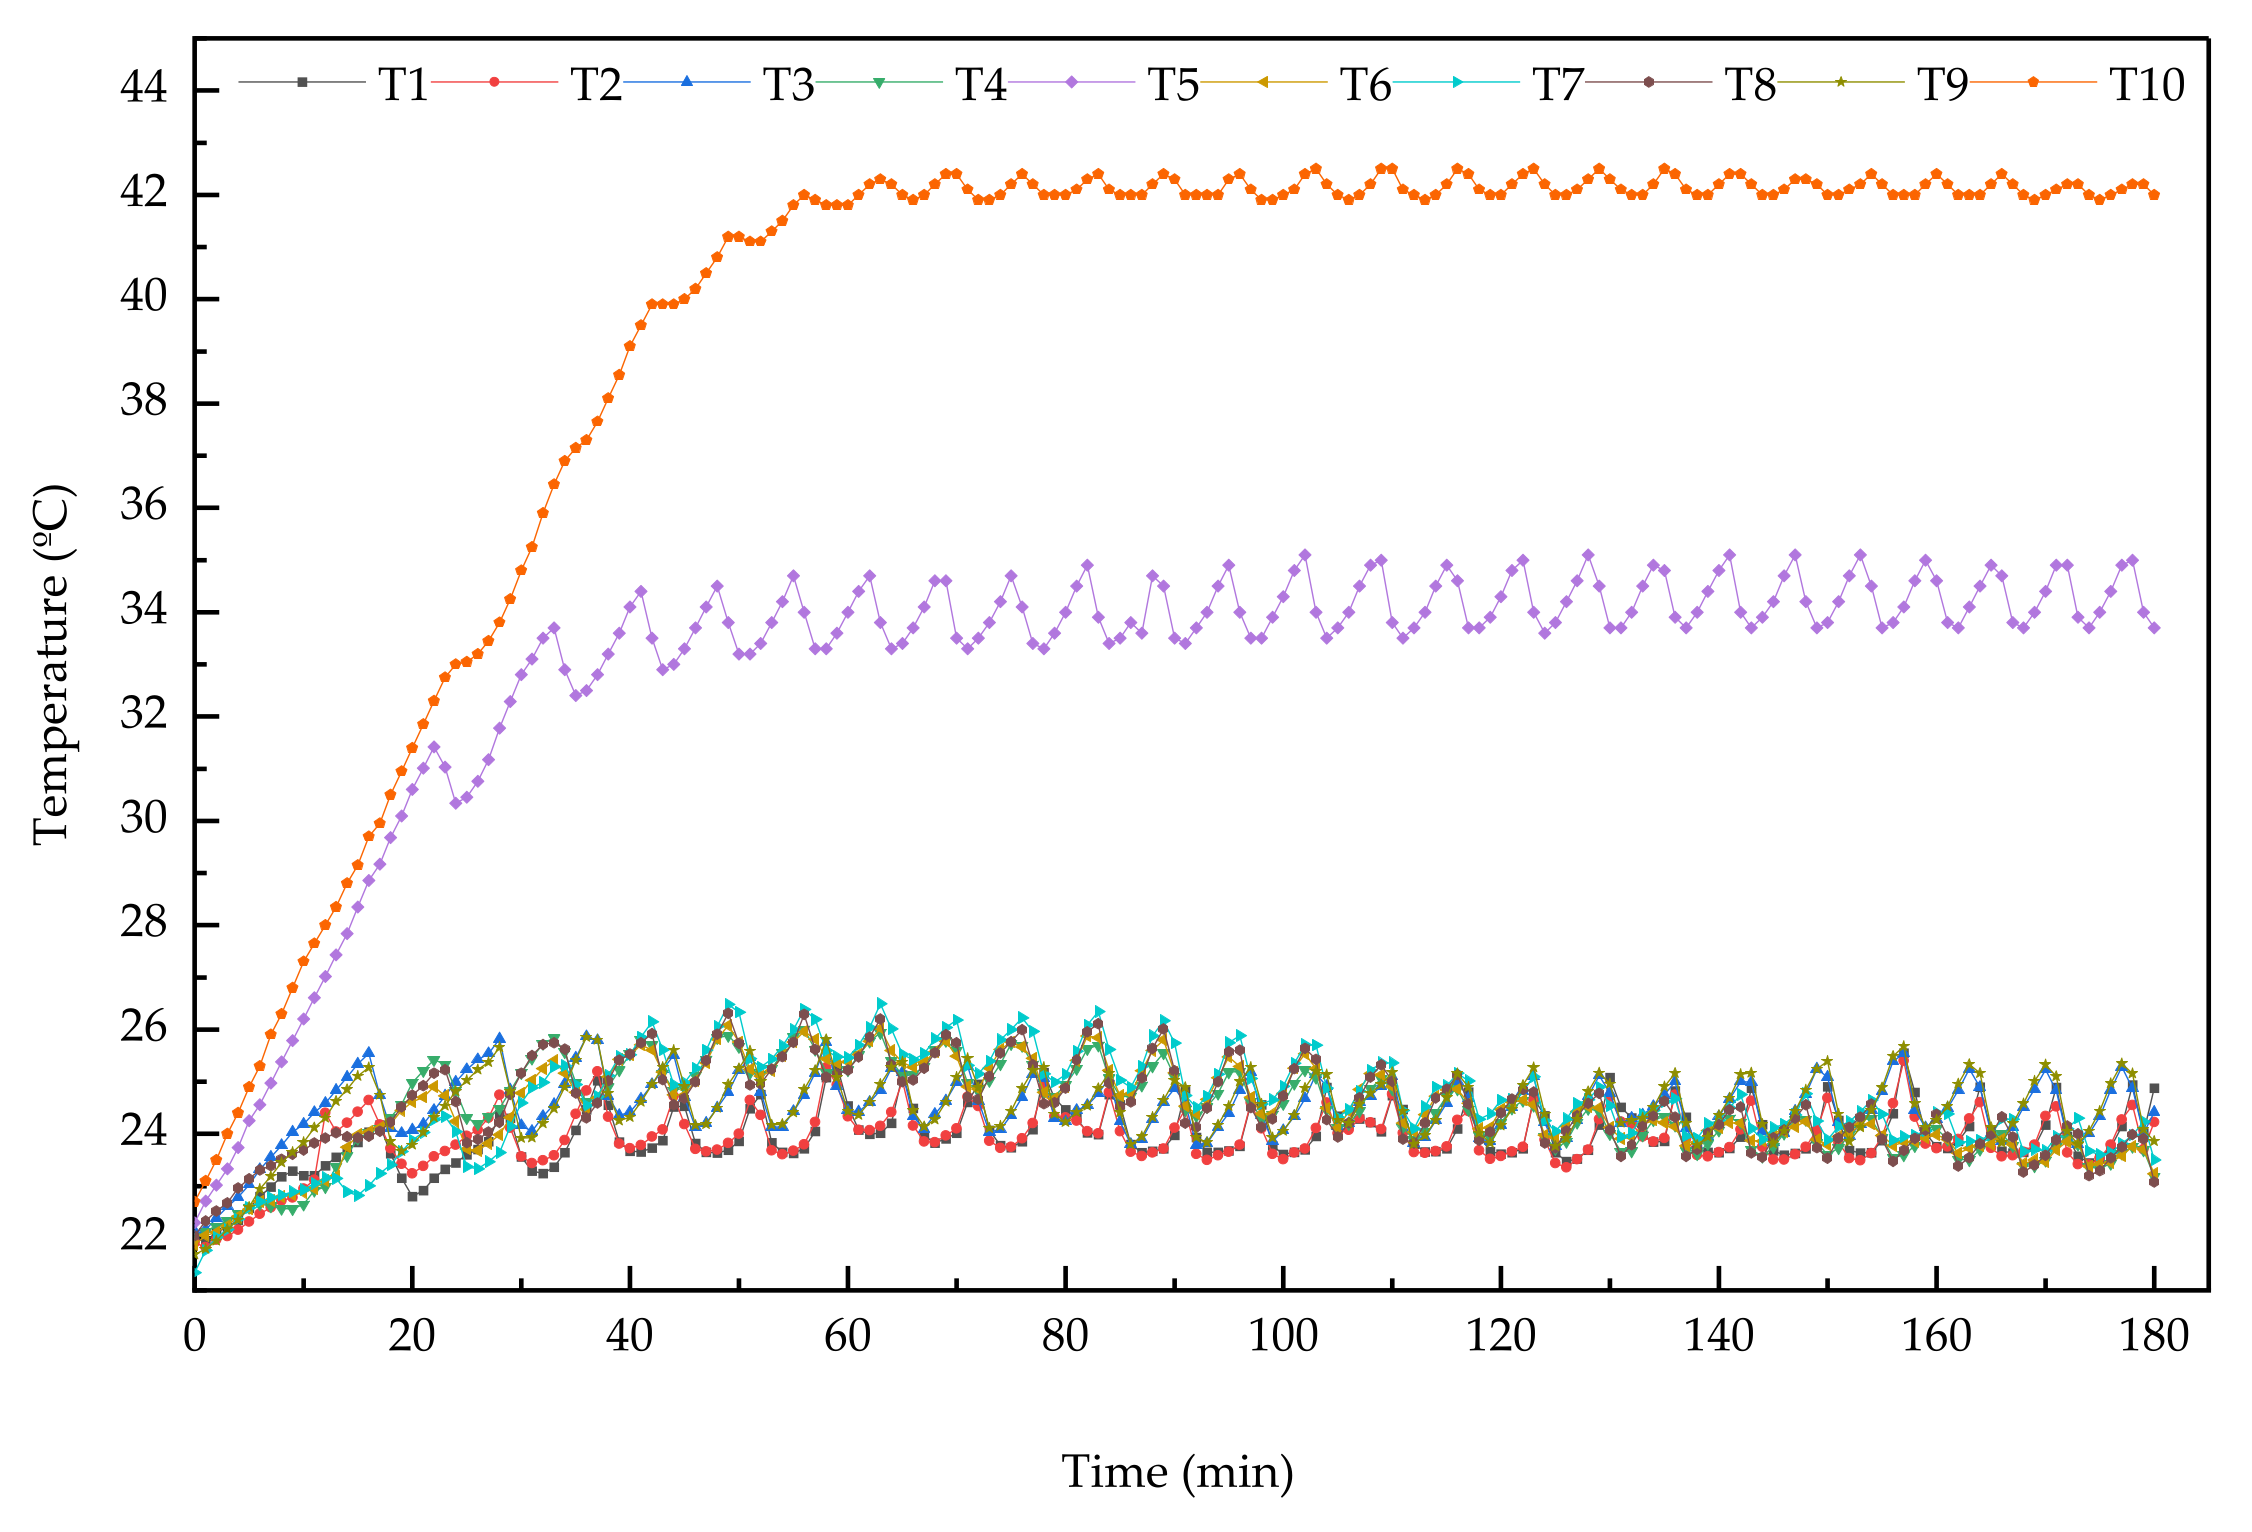
2.2. Analysis of Experimental Results

In actual processing, high-speed motorized spindles often work at a constant speed for a long time. Moreover, the rated speed of A02 high-speed motorized spindle is 9900 r/min. The experiment was divided into three groups according to the rotation speed from 4000 r/min to 8000 r/min. The working time of each group was 180 min. Collect the data of temperature and thermal error of the motorized spindle. In order to minimize the influence of ambient temperature on experimental data, the ambient temperature of the laboratory was set to 22 °C. Motorized spindle internal structure is tight and not easy to heat. In order to reduce the interaction between the three experiments, the interval of each experiment was 12 h. The next group of experiments was performed after the motorized spindle was completely cooled. The temperature and thermal error data of the three groups were collected according to the above scheme, as shown in Figure 5, Figure 6, Figure 7 and Figure 8.
It can be seen from Figure 5, Figure 6 and Figure 7 that the temperature at each measuring point gradually rises over time and reaches dynamic equilibrium. The temperature variation of each measuring point is similar under different rotational speeds. Temperature measurement points T5 and T10 are higher due to their proximity to the internal heat source. The motorized spindle cooling water used in the experiment did not cool the rear bearing, so the temperature of the rear bearing T10 was higher than that of the front bearing T5. Other temperature measuring points are located on the surface of the motorized spindle, resulting in allowed temperature. It can be seen from Figure 8 that the axial thermal error variation trend of motorized spindles at different speeds is roughly the same. The thermal error of the spindle increases with the increase of rotational speed. The temperature and thermal error data obtained from the experiment provide data support for the temperature measurement point optimization and thermal error modeling of the motorized spindle.

3. Optimization of Temperature Measuring Point of Motorized Spindle

The temperature-sensitive points of the motorized spindle should not only reflect the temperature field distribution of the motorized spindle, but also consider the correlation and co-linearity among temperature measuring points. In this paper, fuzzy clustering and grey correlation analysis are used to optimize temperature measuring points and screen out temperature sensitive points. This method eliminates the colinearity of temperature variables and ensures the robustness of the thermal error model.

3.1. Fuzzy Clustering

In this paper, the fuzzy clustering method is used to analyze temperature measurement points. Fuzzy clustering analysis is to establish fuzzy relations according to the correlation between temperature variables. It constructs fuzzy similarity matrices and temperature variables for cluster analysis. The methods and steps are as follows:
(1)
Determine the category of object. Set X = {x1,x2,...,xn} is the set of n temperature variables. Where, xi = {xi1,xi2,...,xim} (i = 1,2,...,n) is the m observed values of the i temperature variable.
(2)
Data normalization. In order to make the data easy to compare, the data normalization method is used to normalize the temperature samples. Mi = max{xi1,xi2,...,xim} is the maximum value of each column of matrix X. Calculate x’ij = xij/Mi (i = 1,2,⋯,n, j = 1,2,⋯,m).
(3)
Solve the fuzzy similarity matrix. Fuzzy similarity matrix is established by the correlation coefficient method. The correlation coefficient can be calculated as a Formula (1):
r ij = k = 1 m x ik x i ¯ x jk x j ¯ k = 1 m x ik x i ¯ 2 k = 1 m x jk x j ¯ 2
(4)
Solve the fuzzy equivalent matrix. Only when the matrix satisfies three conditions of reflexivity, symmetry and transitivity can it be classified reasonably. The fuzzy similarity matrix R is not necessarily transitive. Therefore, the fuzzy similar matrix R should be constructed as a fuzzy equivalent matrix. The transitive closure t(R) of R is found by the flat method. The existence of k after a finite number of operations makes. Let t(R) = R2k (k ≥ 1), t(R) is the fuzzy equivalent matrix.
(5)
Fuzzy clustering. According to the fuzzy equivalence matrix t(R), the threshold λ is selected in [0, 1]. Let the element value of Rij > λ be 1, otherwise 0, so as to achieve the purpose of temperature variable classification.

3.2. Grey Relational Analysis

Grey relational analysis is a systematic analysis based on mathematical theory according to the close degree of each characteristic parameter series in the system. Grey relational analysis was used to determine the tightness of the relationship between thermal error and temperature measurement points of the motorized spindle. The analysis steps are as follows:
(1)
Standardized data. The interval value method is used for dimensionless data, and its calculation is shown in Equation (2):
x k = x 0 k min   x 0 k max   x 0 k min   x 0 k
where, x (k) is the temperature data after normalized processing. x(0) (k) is the original data.
(2)
Calculate the correlation coefficient. Set the thermal error data as x0 = {x0(k)|k = 1,2,...,m} and the temperature measurement point data as xi = {xi(k)|i = 1,2,...,n; k = 1,2,...,m}. Then the correlation coefficient of x0 to xi at the k point is Equation (3):
ξ oi k = min i min k x o k x i k + ρ max i max k x o k x i k x o k x i k + ρ max i max k x o k x i k
where, ρ is the resolution coefficient, generally ρ = 0.5. In practical calculation, the ρ value can be adjusted appropriately to improve the resolution.
(3)
Find the correlation degree. The correlation between the thermal error series and the temperature measurement point series can be calculated as the average of the correlation coefficients at each moment of the two series. The calculation is shown in Equation (4).
r oi = 1 m k = 1 m ξ oi k

3.3. Selection of Temperature-Sensitive Points

According to the measured temperature data, fuzzy clustering was performed on the data of each temperature measurement point at 6000 r/min. According to the formulas in Section 3.1, MATLAB is used to solve the fuzzy equivalent matrix t(R), t(R) is
t ( R )   =   1.0000 0.8865 0.8585 0.5771 0.5771 0.5771 0.5771 0.5771 0.8585 0.5771 0.8865 1.0000 0.8585 0.5771 0.5771 0.5771 0.5771 0.5771 0.8585 0.5771 0.8585 0.8585 1.0000 0.5771 0.5771 0.5771 0.5771 0.5771 0.9862 0.5771 0.5771 0.5771 0.5771 1.0000 0.8228 0.9802 0.8881 0.9775 0.5771 0.8228 0.5771 0.5771 0.5771 0.8228 1.0000 0.8228 0.8228 0.8228 0.5771 0.9284 0.5771 0.5771 0.5771 0.9802 0.8228 1.0000 0.8881 0.9775 0.5771 0.8228 0.5771 0.5771 0.5771 0.8881 0.8228 0.8881 1.0000 0.8881 0.5771 0.8228 0.5771 0.5771 0.5771 0.9775 0.8228 0.9775 0.8881 1.0000 0.5771 0.8228 0.8585 0.8585 0.9862 0.5771 0.5771 1.85771 0.5771 0.5771 1.0000 0.5771 0.5771 0.5771 0.5771 0.8228 0.9284 0.8228 0.8228 0.8228 0.5771 1.0000
According to the fuzzy equivalent matrix, fuzzy clustering is carried out according to the threshold λ. The elements of t(R) were sorted as 0.9862, 0.9802, 0.9775, 0.9284, 0.8881, 0.8865, 0.8585, 0.8228, 0.5771. Different clustering results are obtained when λ is the above values, respectively. The clustering results are shown in Table 2.
After the completion of fuzzy clustering, choosing the optimal classification number is the research content of clustering effectiveness, and using λ to judge the similarity. The closer to 1, the more similar. In order to achieve accurate grouping with fewer measuring points, this paper selects four categories as the optimal classification, that is, the clustering with λ = 0.8865 as the optimal clustering result, as shown in Table 3.
Through the grey relational analysis, the grey relational degree of each temperature measuring point and axial thermal error of the motorized spindle at 6000 r/min is obtained, as shown in Table 4.
According to the grey relational degree of temperature measurement points and axial thermal error, the clustering results of temperature measurement points were combined and selected as the temperature sensitive points with the largest grey relational degree from the optimal clustering groups. T1 of group 1, T9 of group 2, T7 of group 3 and T10 of group 4 are obtained as temperature-sensitive points of the motorized spindle system.

4. Thermal Error Modeling and Validation

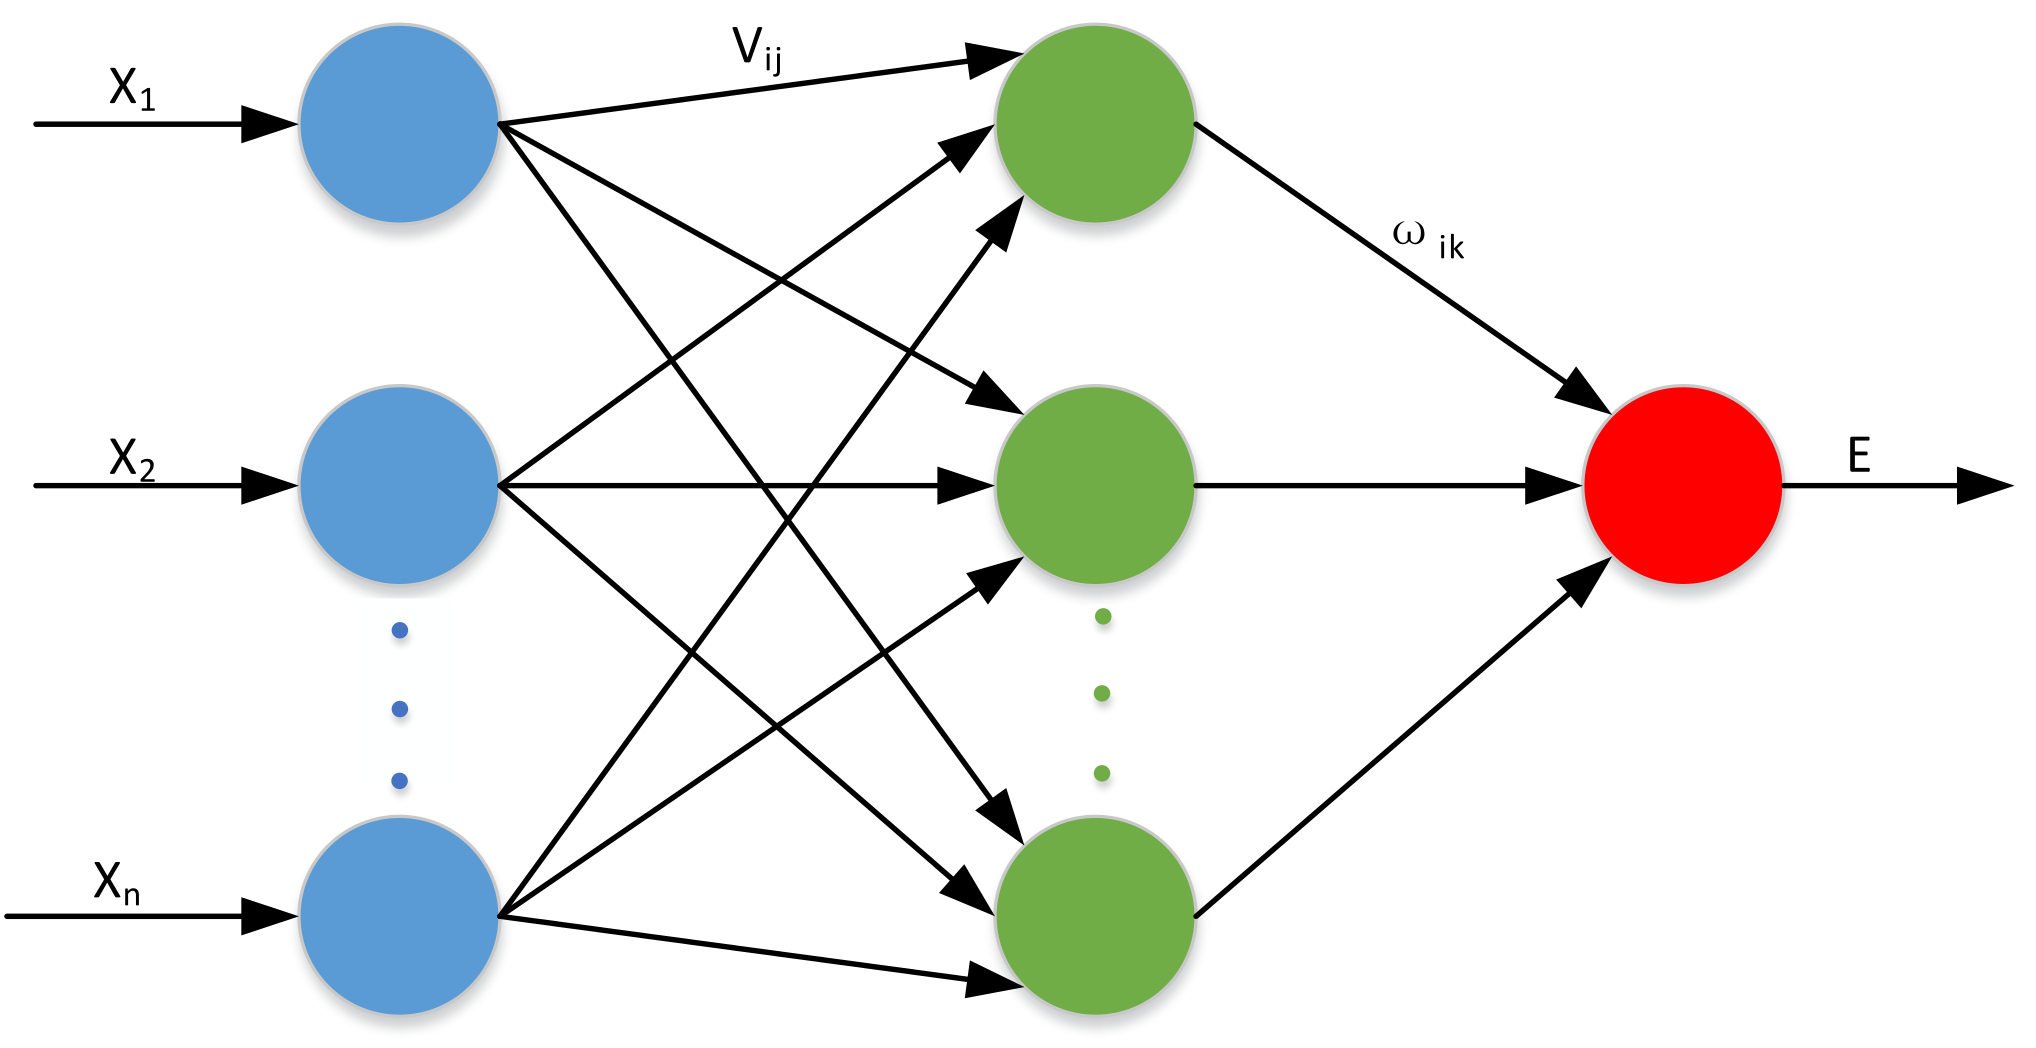
4.1. Construction of BP Neural Network

BP is a multi-layer feedforward neural network with forward propagation of signals and backward propagation of errors. A three-layer BP neural network with temperature sensitive points as input and axial thermal error as output was used to establish a thermal error prediction model. The tangent S-type transfer function tansig and the linear transfer function purelin are used as functions for the hidden and output layers. The structure of the BP neural network is shown in Figure 9.

4.2. Principle of BAS

The BAS algorithm is suitable for the optimization of multi-objective functions. The biological mechanism for Beetle antennae’s foraging is to obtain the strength of its food from the sense of smell. The Beetle antennae fly to the side where food smells high in the left and right antennae. BAS has the advantage that Beetle Antennae lookup does not need to know the specific form of the function. It also does not require information about effective gradients for function optimization. In addition, only one beetle is needed to search, which can greatly reduce the amount of calculation, thus significantly improving the search speed. The modeling steps are as follows:
(1)
Create a random vector for Beetle Antennae that gets normalized
b = rands k , 1 rands k , 1
where, rands() is a random function; k is the spatial dimension.
(2)
Create Beetle left and right antennae space coordinates
x rt = x t + d 0 b / 2 x lt = x t d 0 b / 2 t = 0 , 1 , 2 , , n
where, xrt and xlt represent the position coordinates of the right and left whisker of Longicorn beetle in the t iteration, respectively. xt represents the centroid coordinates of Beetle at the t iteration. d0 represents the distance between the whiskers.
(3)
According to the fitness function, that is, the intensity of f(xl) and f(xr), the intensity of left and right beard odor can be judged. F is a fitness function.
(4)
Update the position of Beetle iteratively
x t + 1 = x t δ t b sign f x rt f x lt
where, δt represents the step factor at iteration t. Sign() is a symbolic function.

4.3. BAS-BP Neural Network Model

In the training process, the BP network completely depends on the adjustment of initial weight and thresholds by error function. The initial weight threshold is usually obtained by random initialization. Improper selection of it will greatly affect the training results. BAS is used to optimize the initial weights and thresholds of the BP neural network. It can train the network and greatly improve the performance of the network. In this way, the problem of the network falling into local optimum caused by random initialization can be greatly avoided.
The modeling procedure is as follows.
(1)
Determine the structure of the BP network. The BAS-BP model is adopted in this paper. Four nodes in its input layer are temperature-sensitive points T1, T7, T9 and T10. One node in the output layer is the axial thermal error of the motorized spindle. The empirical formula H = (m + n) 1/2 + a is usually used to determine the number of hidden layer nodes. Where, m is the number of nodes at the input layer. N is the number of nodes at the output layer. A is an integer between 1 to 10. According to the number of hidden layer nodes in the range of empirical formulae, training is carried out through a training set. The hidden layer node corresponding to the minimum training error is selected as the optimal number of hidden layer nodes. The initial weights and thresholds of the BP neural network are random in each training, so the number of optimal hidden layer nodes in each training is not fixed.
(2)
Initialize beetle parameters. The positions of the left and right antennae of the beetle are Xl and Xr. The initial step δ0 = 25, the number of iterations T = 100.
(3)
Determine the fitness function. Beetle assigns weights and thresholds to the network structure. BP neural network is used to train the training set. The root mean square error (MSE) of training data was used as a fitness evaluation function. The fitness function is:
fitness = MSE = 1 N = i = 1 N y ¯ i y i 2
where, N is the number of samples in the training set. y ¯ i is the predicted value of the i sample. yi is the actual value of the i sample. Therefore, when the algorithm iteration stops, the position with the minimum fitness function value is the optimal solution.
(4)
Initialize Beetle position and calculate its fitness function. It is stored in best X (the best Beetle start position) and best Y (the best fitness function value for the start position).
(5)
Update the spatial coordinates of the Beetle antennae, calculate the value of the fitness function between the antennae and compare them. At this time, if the value of the fitness function is better than best Y, update best y and best X. The update of beetle position is to adjust the weights and thresholds of the BP neural network.
(6)
Judge whether the fitness function value has reached the set accuracy or the maximum iteration number. If it is full, then step (7). Otherwise, return to step (5) to continue the iteration.
(7)
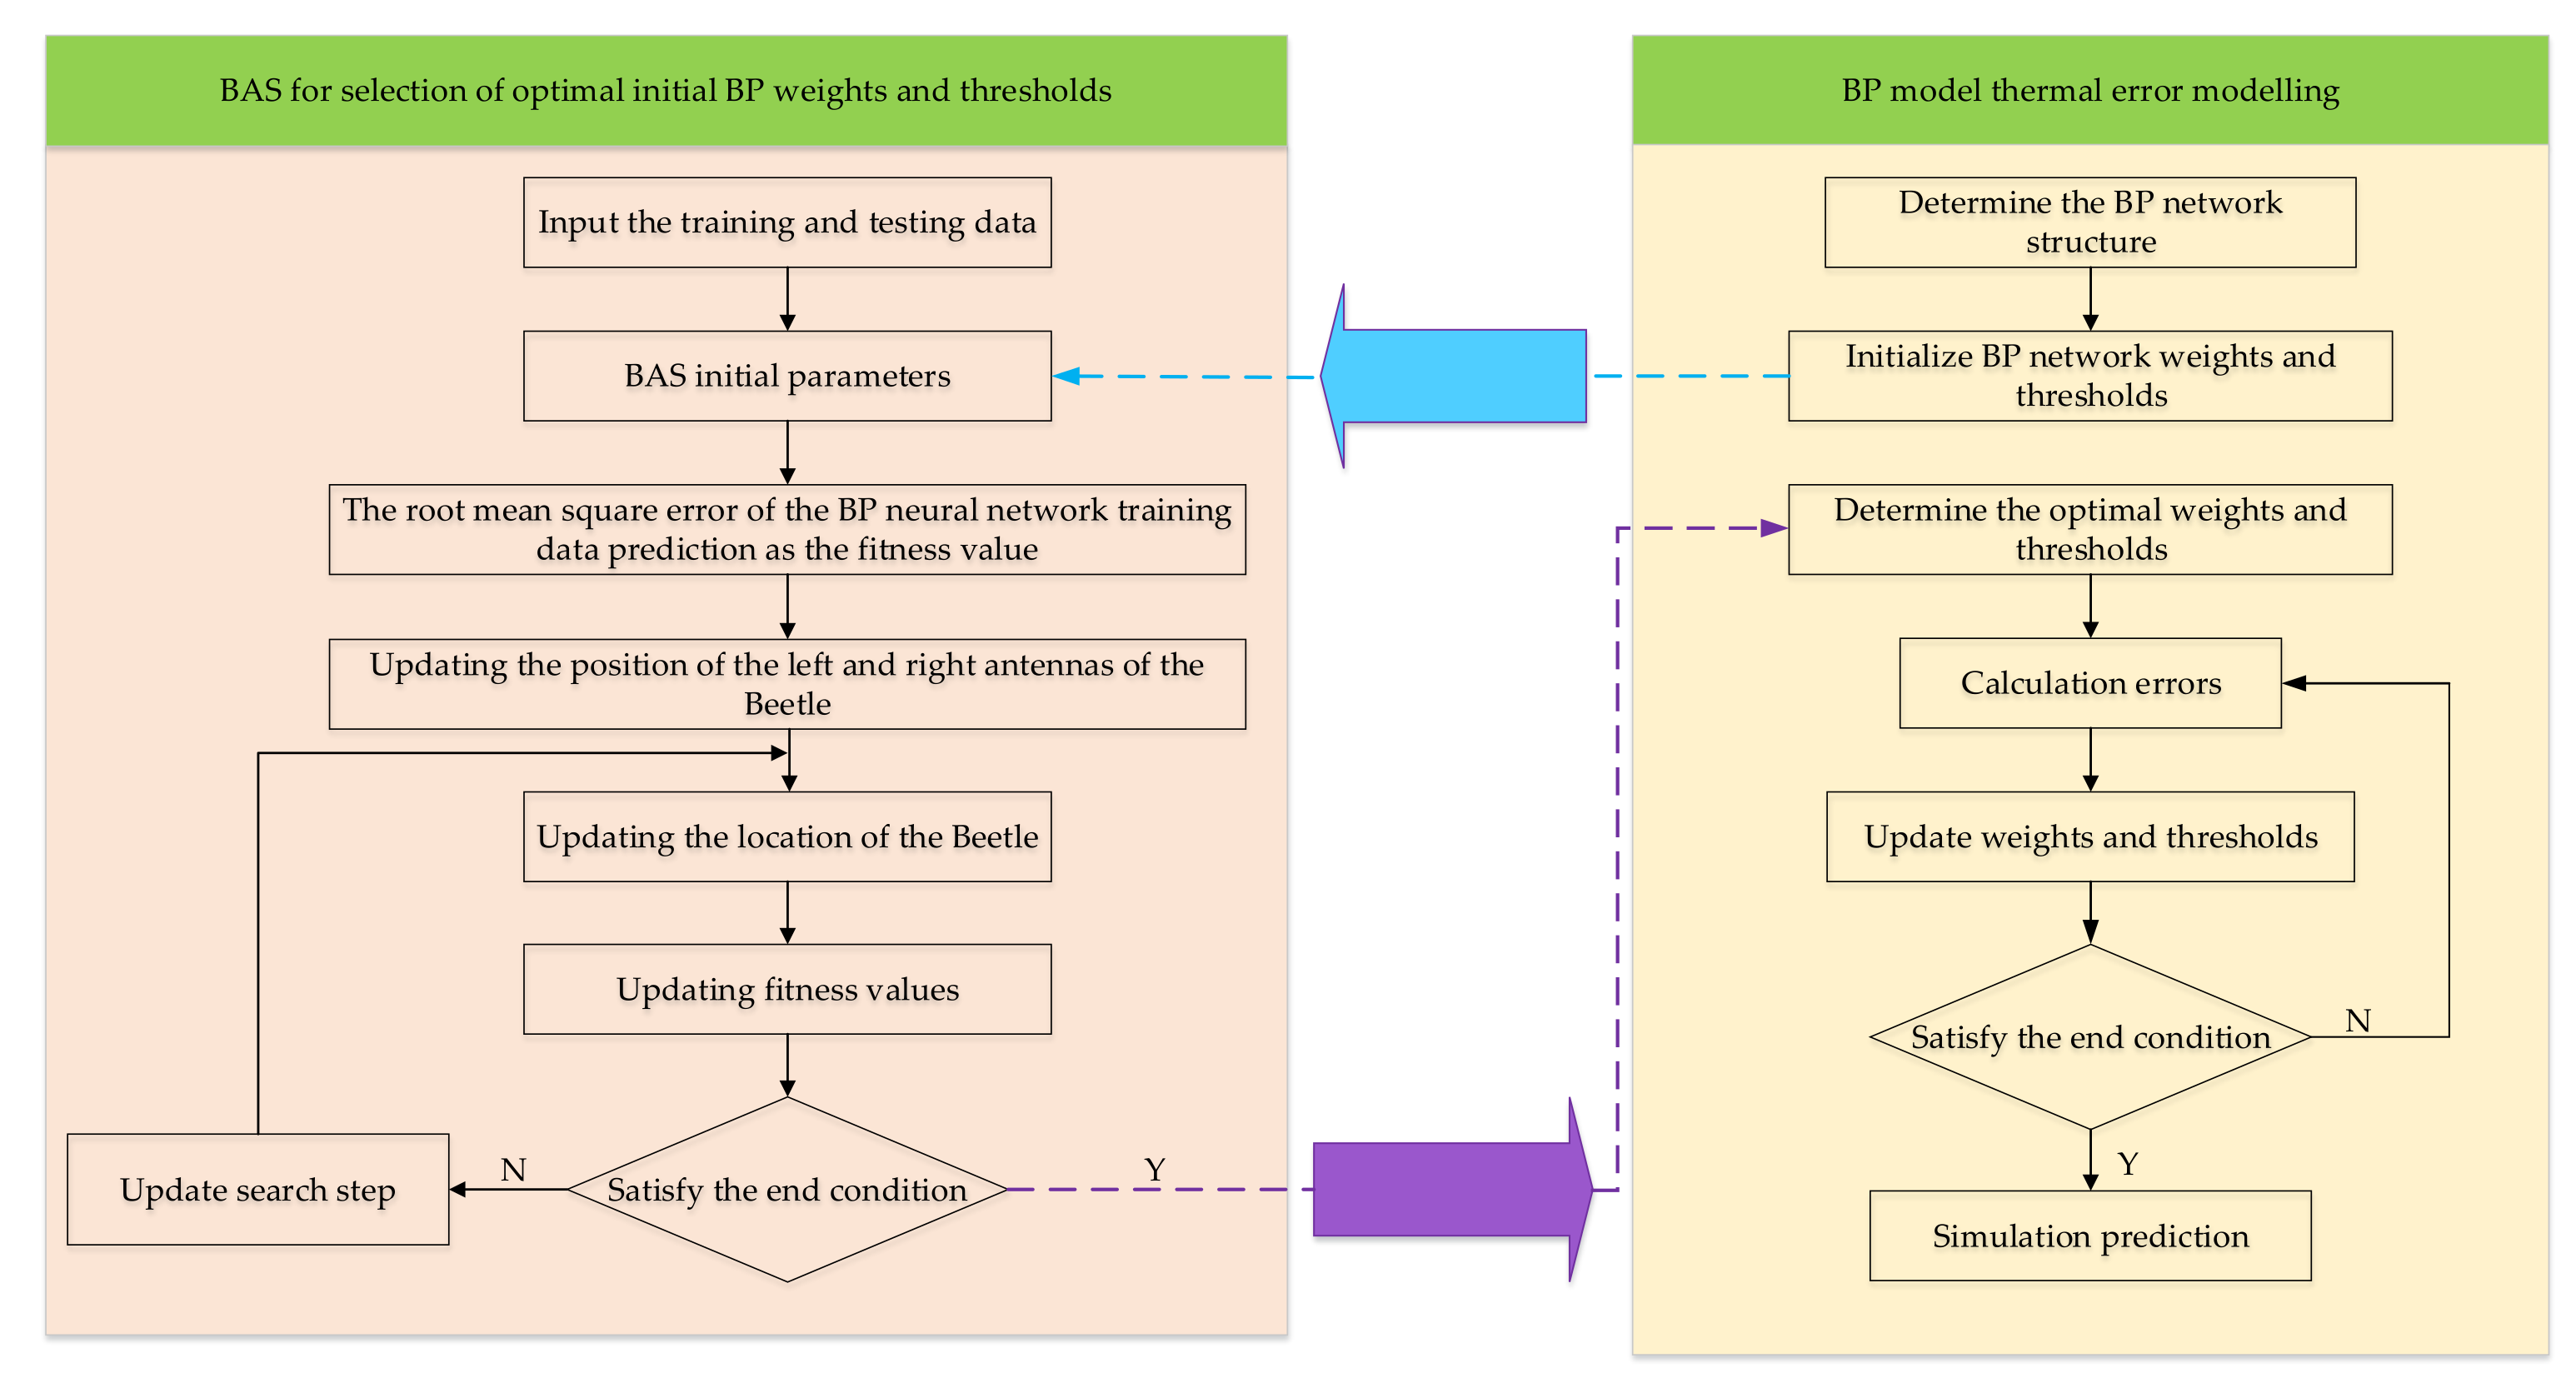
Generate the optimal solution. When the algorithm stops iterating, the solution in best X is the optimal solution for training. That is, the optimal initial weight and threshold of the BP neural network. The optimal solution is put into the BP neural network for secondary training and learning. Finally, the thermal error prediction model of the motorized spindle is formed. Based on the above discussion, the specific process of the BAS-BP regression prediction model is given, as shown in Figure 10.

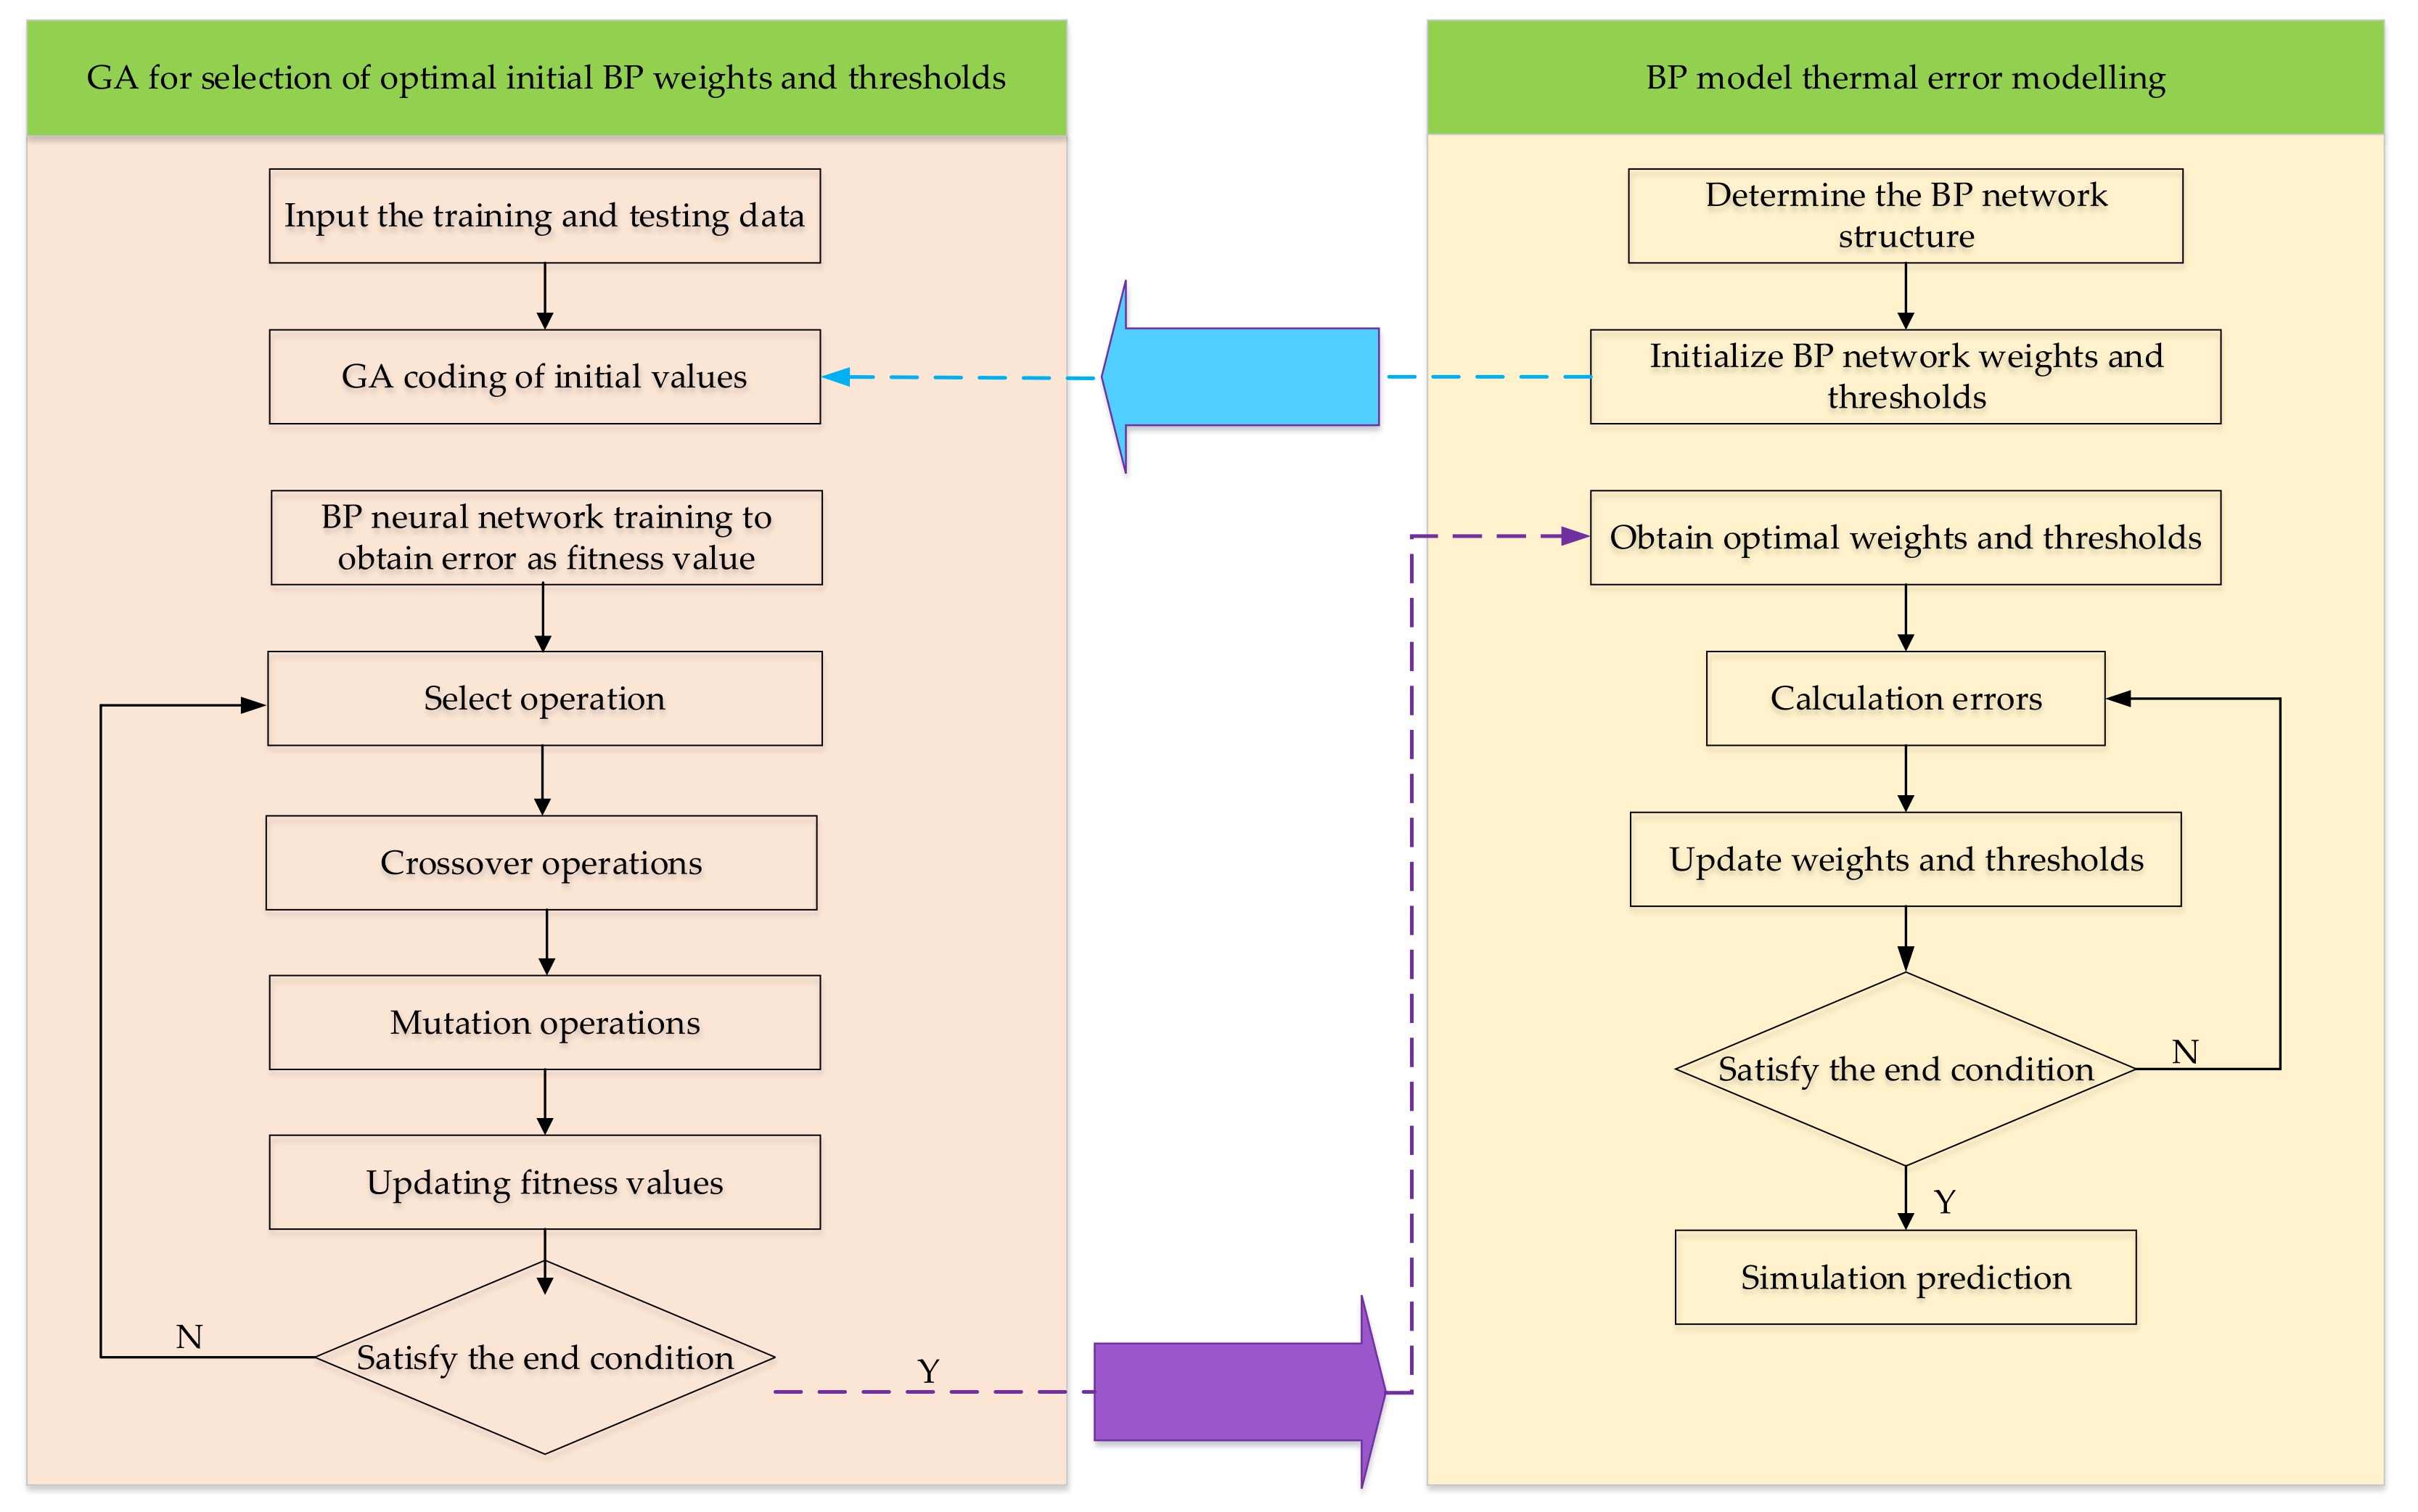
4.4. GA-BP Neural Network Model

In order to improve the performance of the BAS-BP model, it was compared with GA-BP. The Genetic algorithm has the advantages of global optimization and automatic acquisition of search space. The topology, weights and thresholds of the BP neural network are optimized by using the characteristics of genetic algorithms, which improves the convergence speed and precision of BP neural network.GA-BP thermal error modeling process is shown in Figure 11. The traditional trial-and-error method is used to find the optimal value of the model performance index, and the model parameters are determined by the optimal performance index. Parameters of genetic algorithms are shown in Table 5.

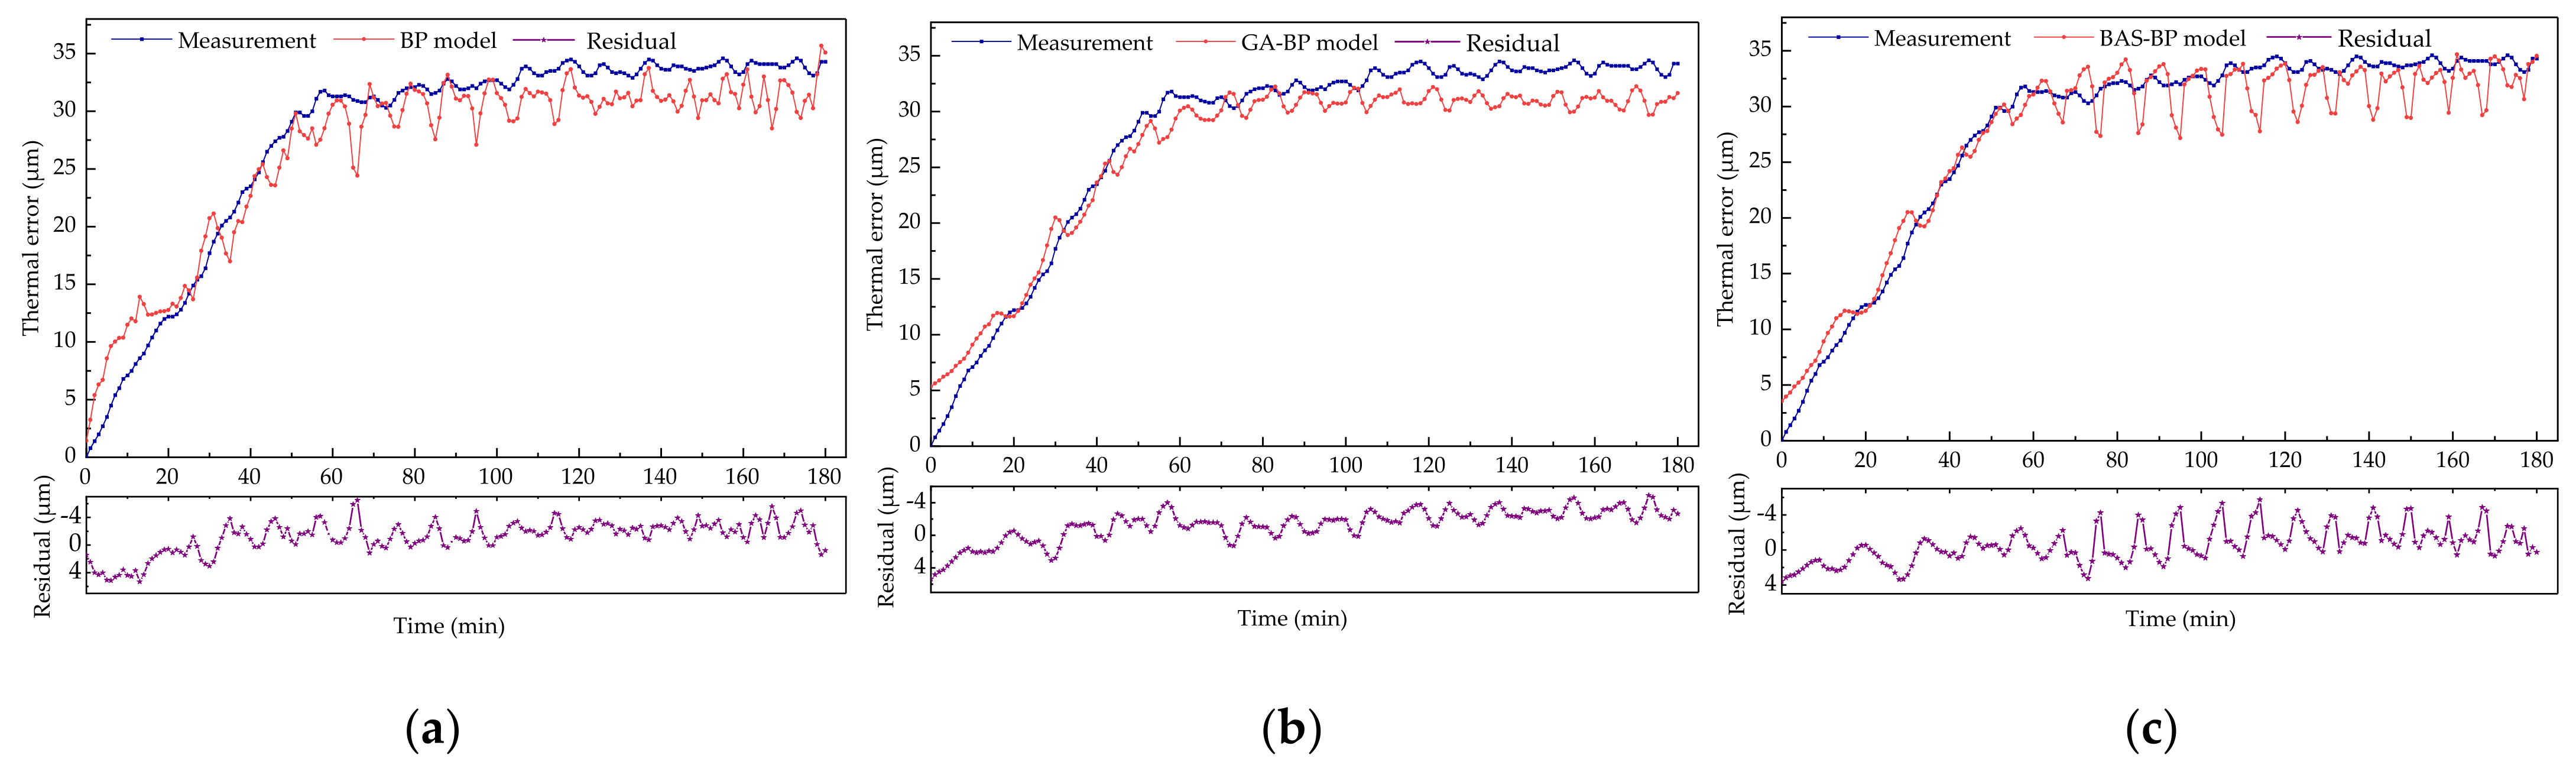
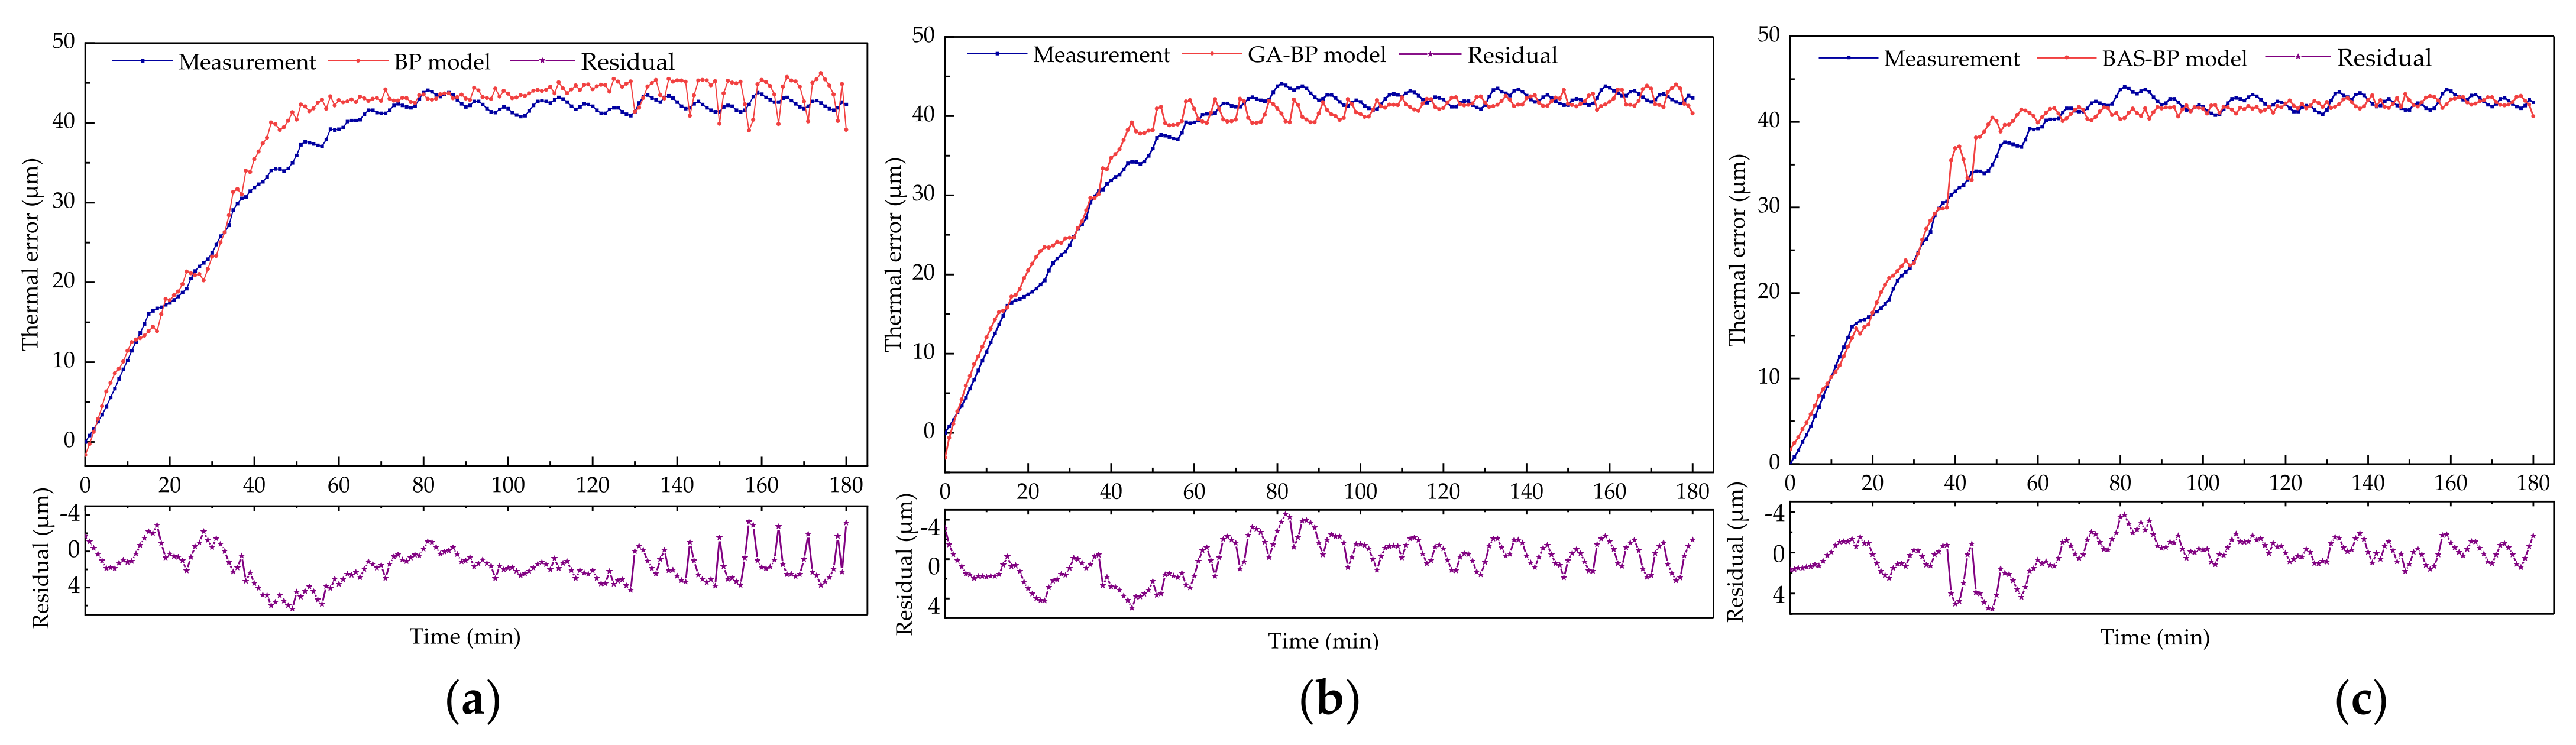
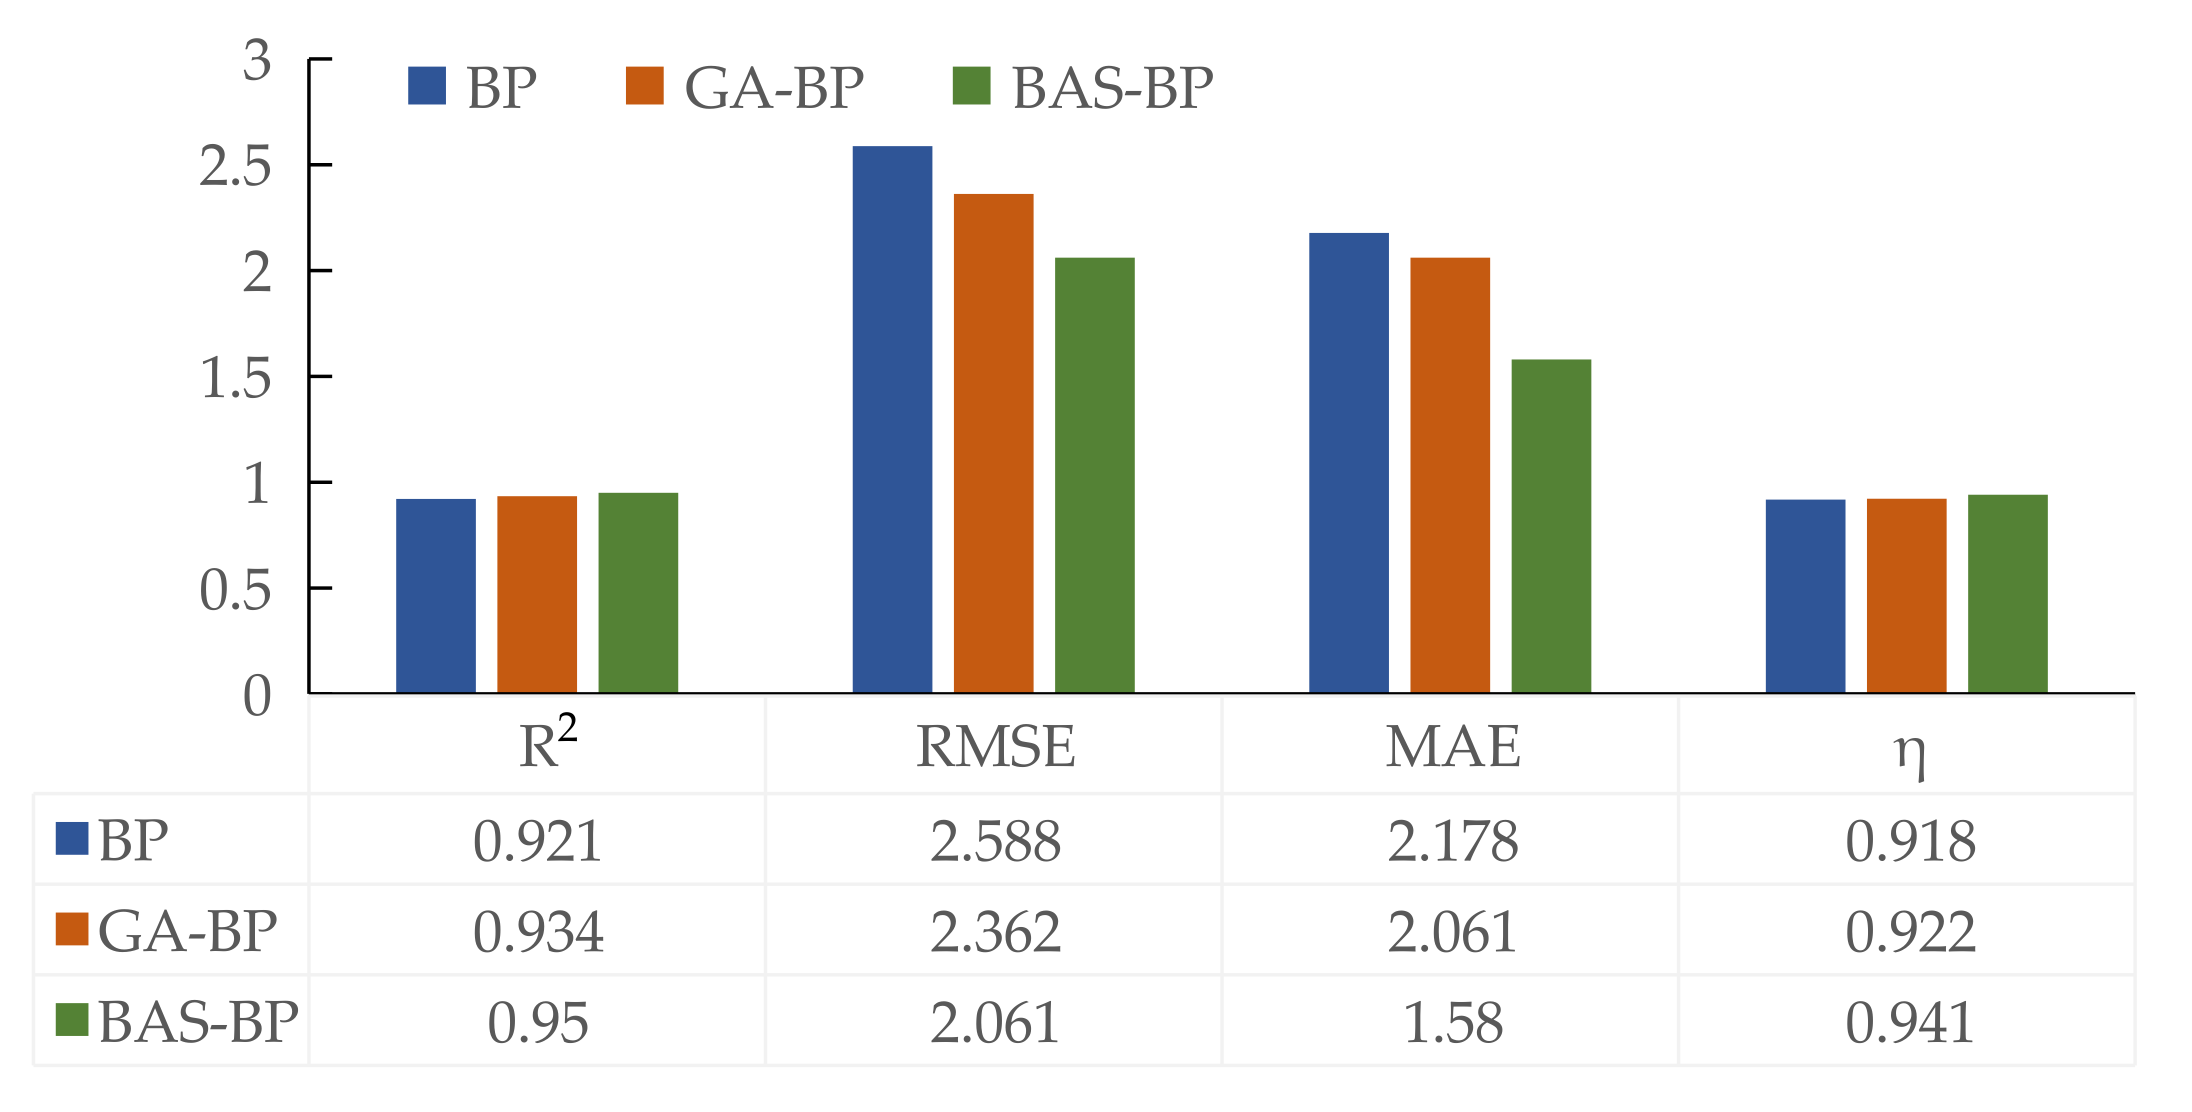
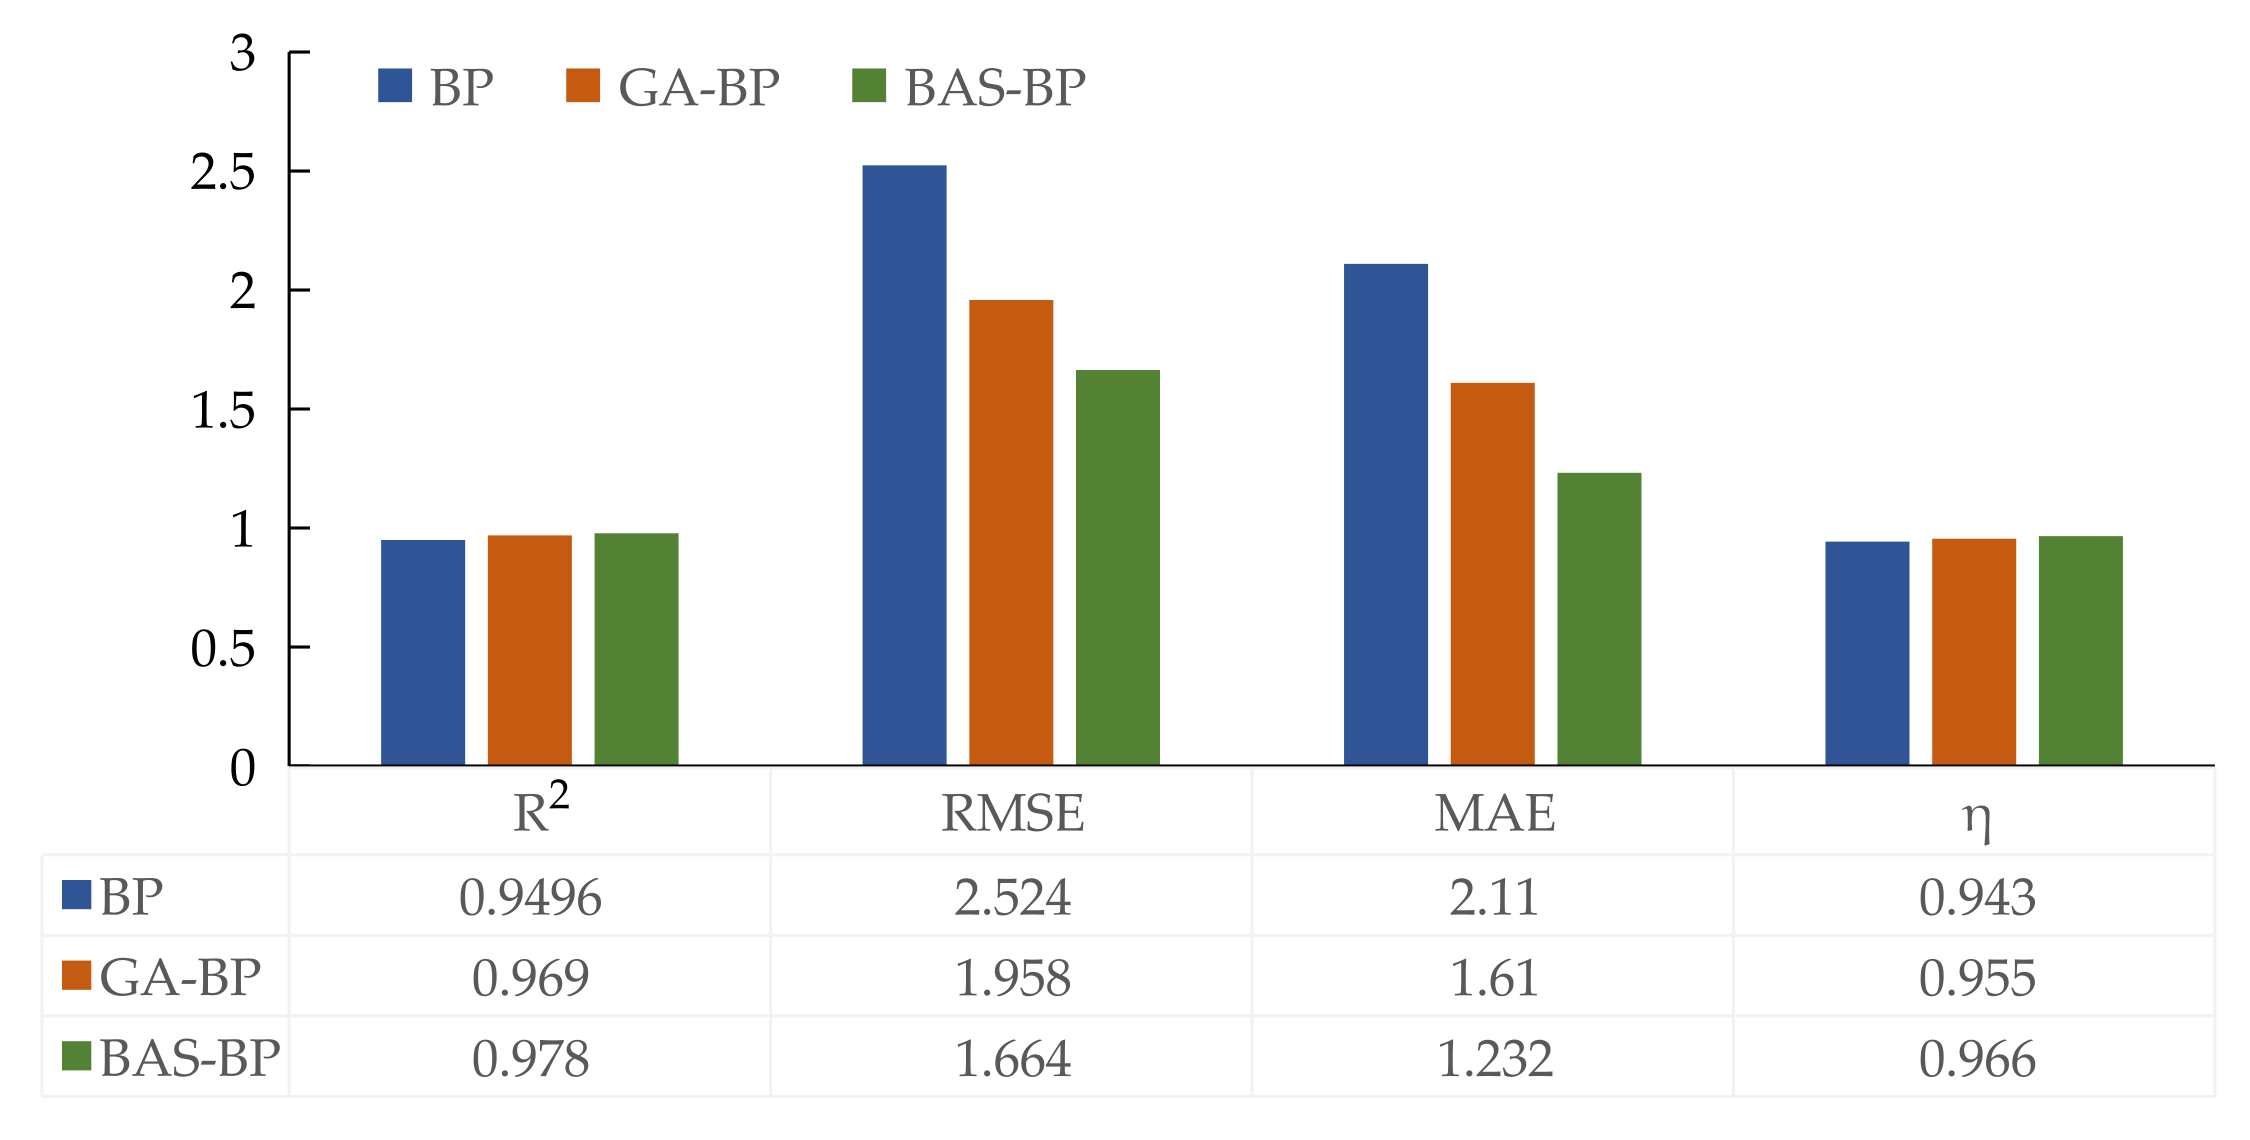
4.5. Verification and Comparison of Thermal Error Models

In this paper, 6000 r/min experimental data were used as training data sets, and 4000 r/min and 8000 r/min experimental data were used as validation data sets. Temperature-sensitive points T1, T7, T9 and T10 were used as inputs and axial thermal errors as outputs for the prediction model. The BAS-BP model was compared with the BP model and GA-BP model. The comparison between the predicted value and the actual value of each model is shown in Figure 12 and Figure 13.
As shown in Figure 12 and Figure 13, at 4000 r/min, the residual variation range of the BP neural network prediction model was −6.48–5.31 μm, and the mean residual was 2.19 μm. The residual variation range of the GA-BP neural network prediction model was −4.91–5.35 μm, and the mean residual was 2.07 μm. The range of residual error of the BAS-BP neural network prediction model was −5.73–3.55 μm, and the mean residual error was 1.60 μm. At 8000 r/min, the residual variation range of the BP neural network prediction model was −3.27–6.35 μm, and the mean residual was 2.12 μm. The residual variation range of the GA-BP neural network prediction model was −4.58–4.95 μm, and the mean residual was 1.62 μm. The residual of the BAS-BP neural network prediction model ranged from −3.68 μm to 5.50 μm, and the mean residual was 1.25 μm. Compared with BP and GA-BP neural network prediction models, the variation range and mean value of the residual error of the BAS-BP prediction model are reduced. The method reduces the instability of the prediction effect and improves the accuracy and robustness of the prediction model. The three models have high prediction accuracy, and the prediction accuracy of the BAS-BP model is higher than the GA-BP model at 8000 r/min. Although these three models have good prediction accuracy at 4000 r/min. However, there is still a small gap between it and the thermal error model corresponding to 8000 r/min. Therefore, the robustness of the model needs to be further improved at 4000 r/min.
In order to evaluate the thermal error prediction model, the determination coefficient (R2), root mean square error (RMSE), mean absolute error (MAE) and modeling accuracy (η) were used as evaluation indexes. The results are shown in Figure 14 and Figure 15.
BAS-BP models have the best performance at different speeds. Compared with the BP model, the RMSE of the BAS-BP and GA-BP models at 4000 r/min and 8000 r/min were reduced by 20.36% and 8.73%, and 34.07% and 22.42%, respectively; the prediction accuracy was improved by 2.3%, 0.4% and 2.3%, 1.2%. The BAS-BP model also outperforms the BP and GA-BP models in R2 and MAE indexes. Therefore, the BAS-BP model can improve the prediction accuracy of the BP model and is superior to the GA-BP model.
The running time of Beetle antennae search algorithm and Genetic algorithm is shown in Figure 16. It can be seen from the figure that at 4000 r/min, the running time of the Beetle antennae search algorithm is 20.766 s, and that of the Genetic algorithm is 31.408 s. At 8000 r/min, the running time of the Beetle antennae search algorithm and the Genetic algorithm is 21.408 s and 30.478 s, respectively. The running time of the Beetle antennae search algorithm is shorter than that of the Genetic algorithm at different rotational speeds.
Compared with the Genetic algorithm, the Beetle antennae search algorithm has faster search speed and better search performance. This is because the Beetle antennae search algorithm does not have crossover, mutation and other Genetic operations. Its computational complexity is lower than that of the Genetic algorithm. This method does not need to know gradient information to achieve the purpose of optimization. Only a single Beetle is required during iteration, which greatly reduces the amount of computation and is more efficient. Therefore, the BAS-BP model has advantages besides high prediction accuracy and small computation.

5. Conclusions

In this paper, the temperature field and thermal error of the A02 high speed motorized spindle are measured. Fuzzy clustering method and grey relational analysis method are used to optimize temperature measuring points. The BAS-BP thermal error prediction model of the motorized spindle was established. The main conclusions are as follows:
(1)
Fuzzy clustering and grey relational analysis were used to optimize the temperature measuring points, which reduced the number of temperature measuring points from 10 to 4, and screened out the temperature-sensitive points, effectively eliminating the co-linearity among temperature variables. It is of great significance to improve the robustness and modeling accuracy of thermal error models.
(2)
The weights and thresholds of the BAS optimization BP neural network are used to train the root mean square error of data as the fitness function of BAS. This method effectively avoids the shortcomings of the BP neural network model, such as poor convergence, low prediction accuracy and easy to fall into the local extremum.
(3)
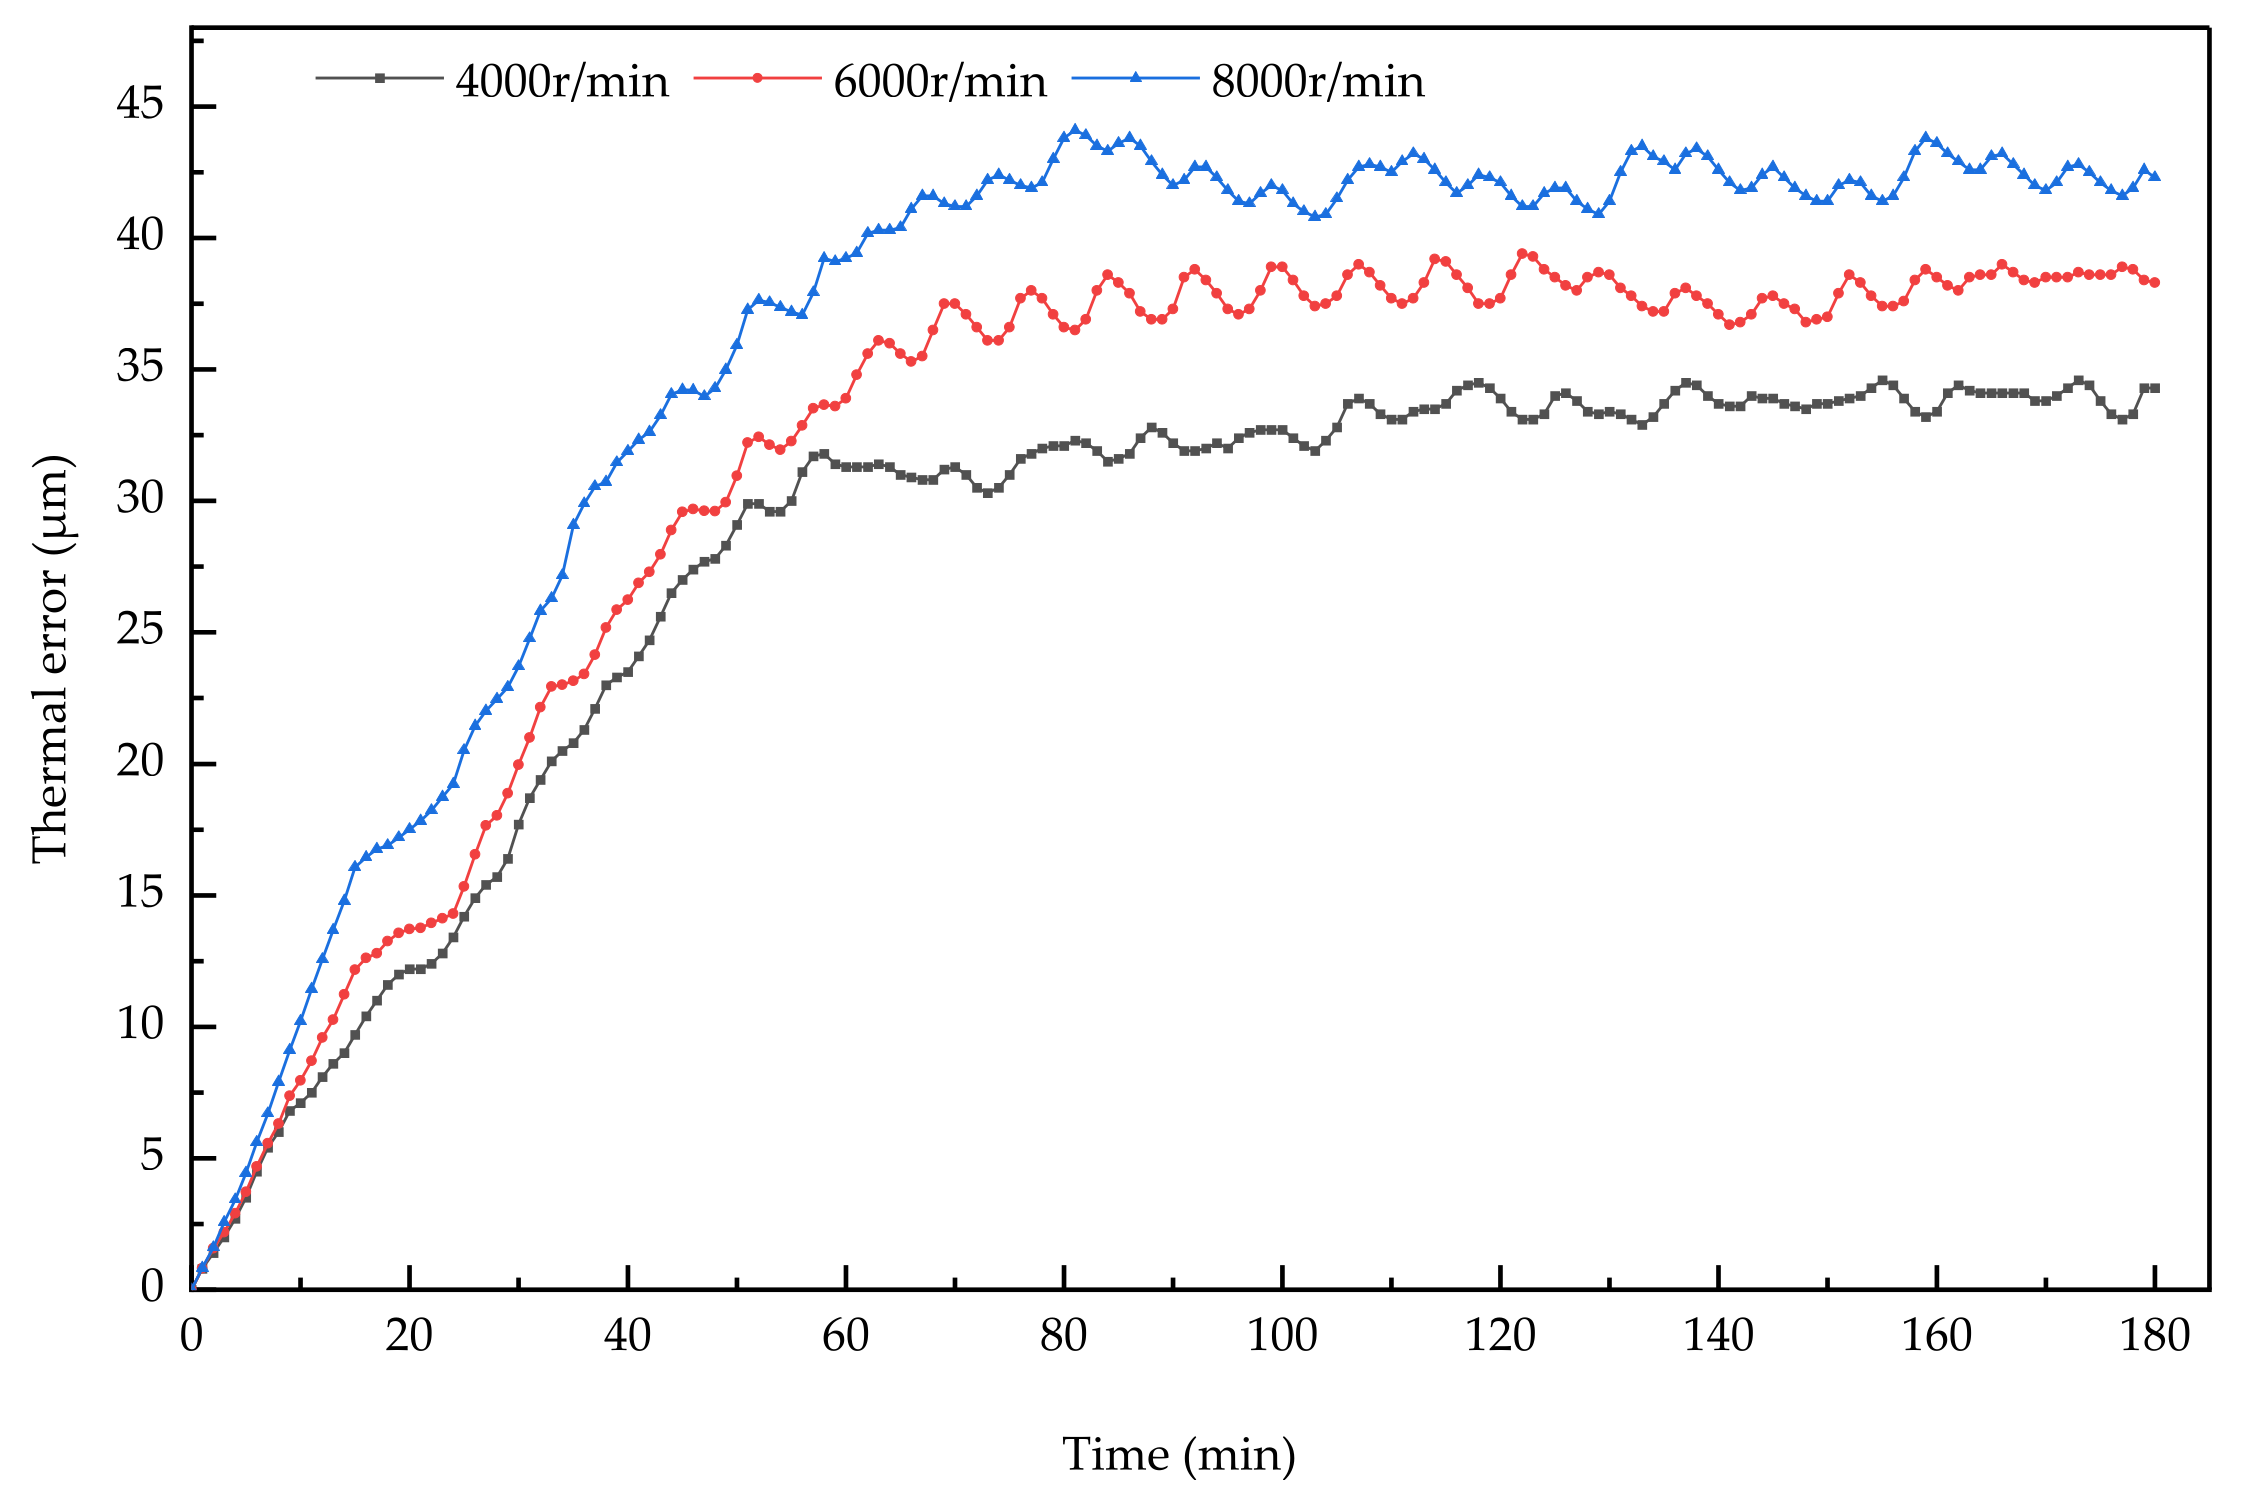
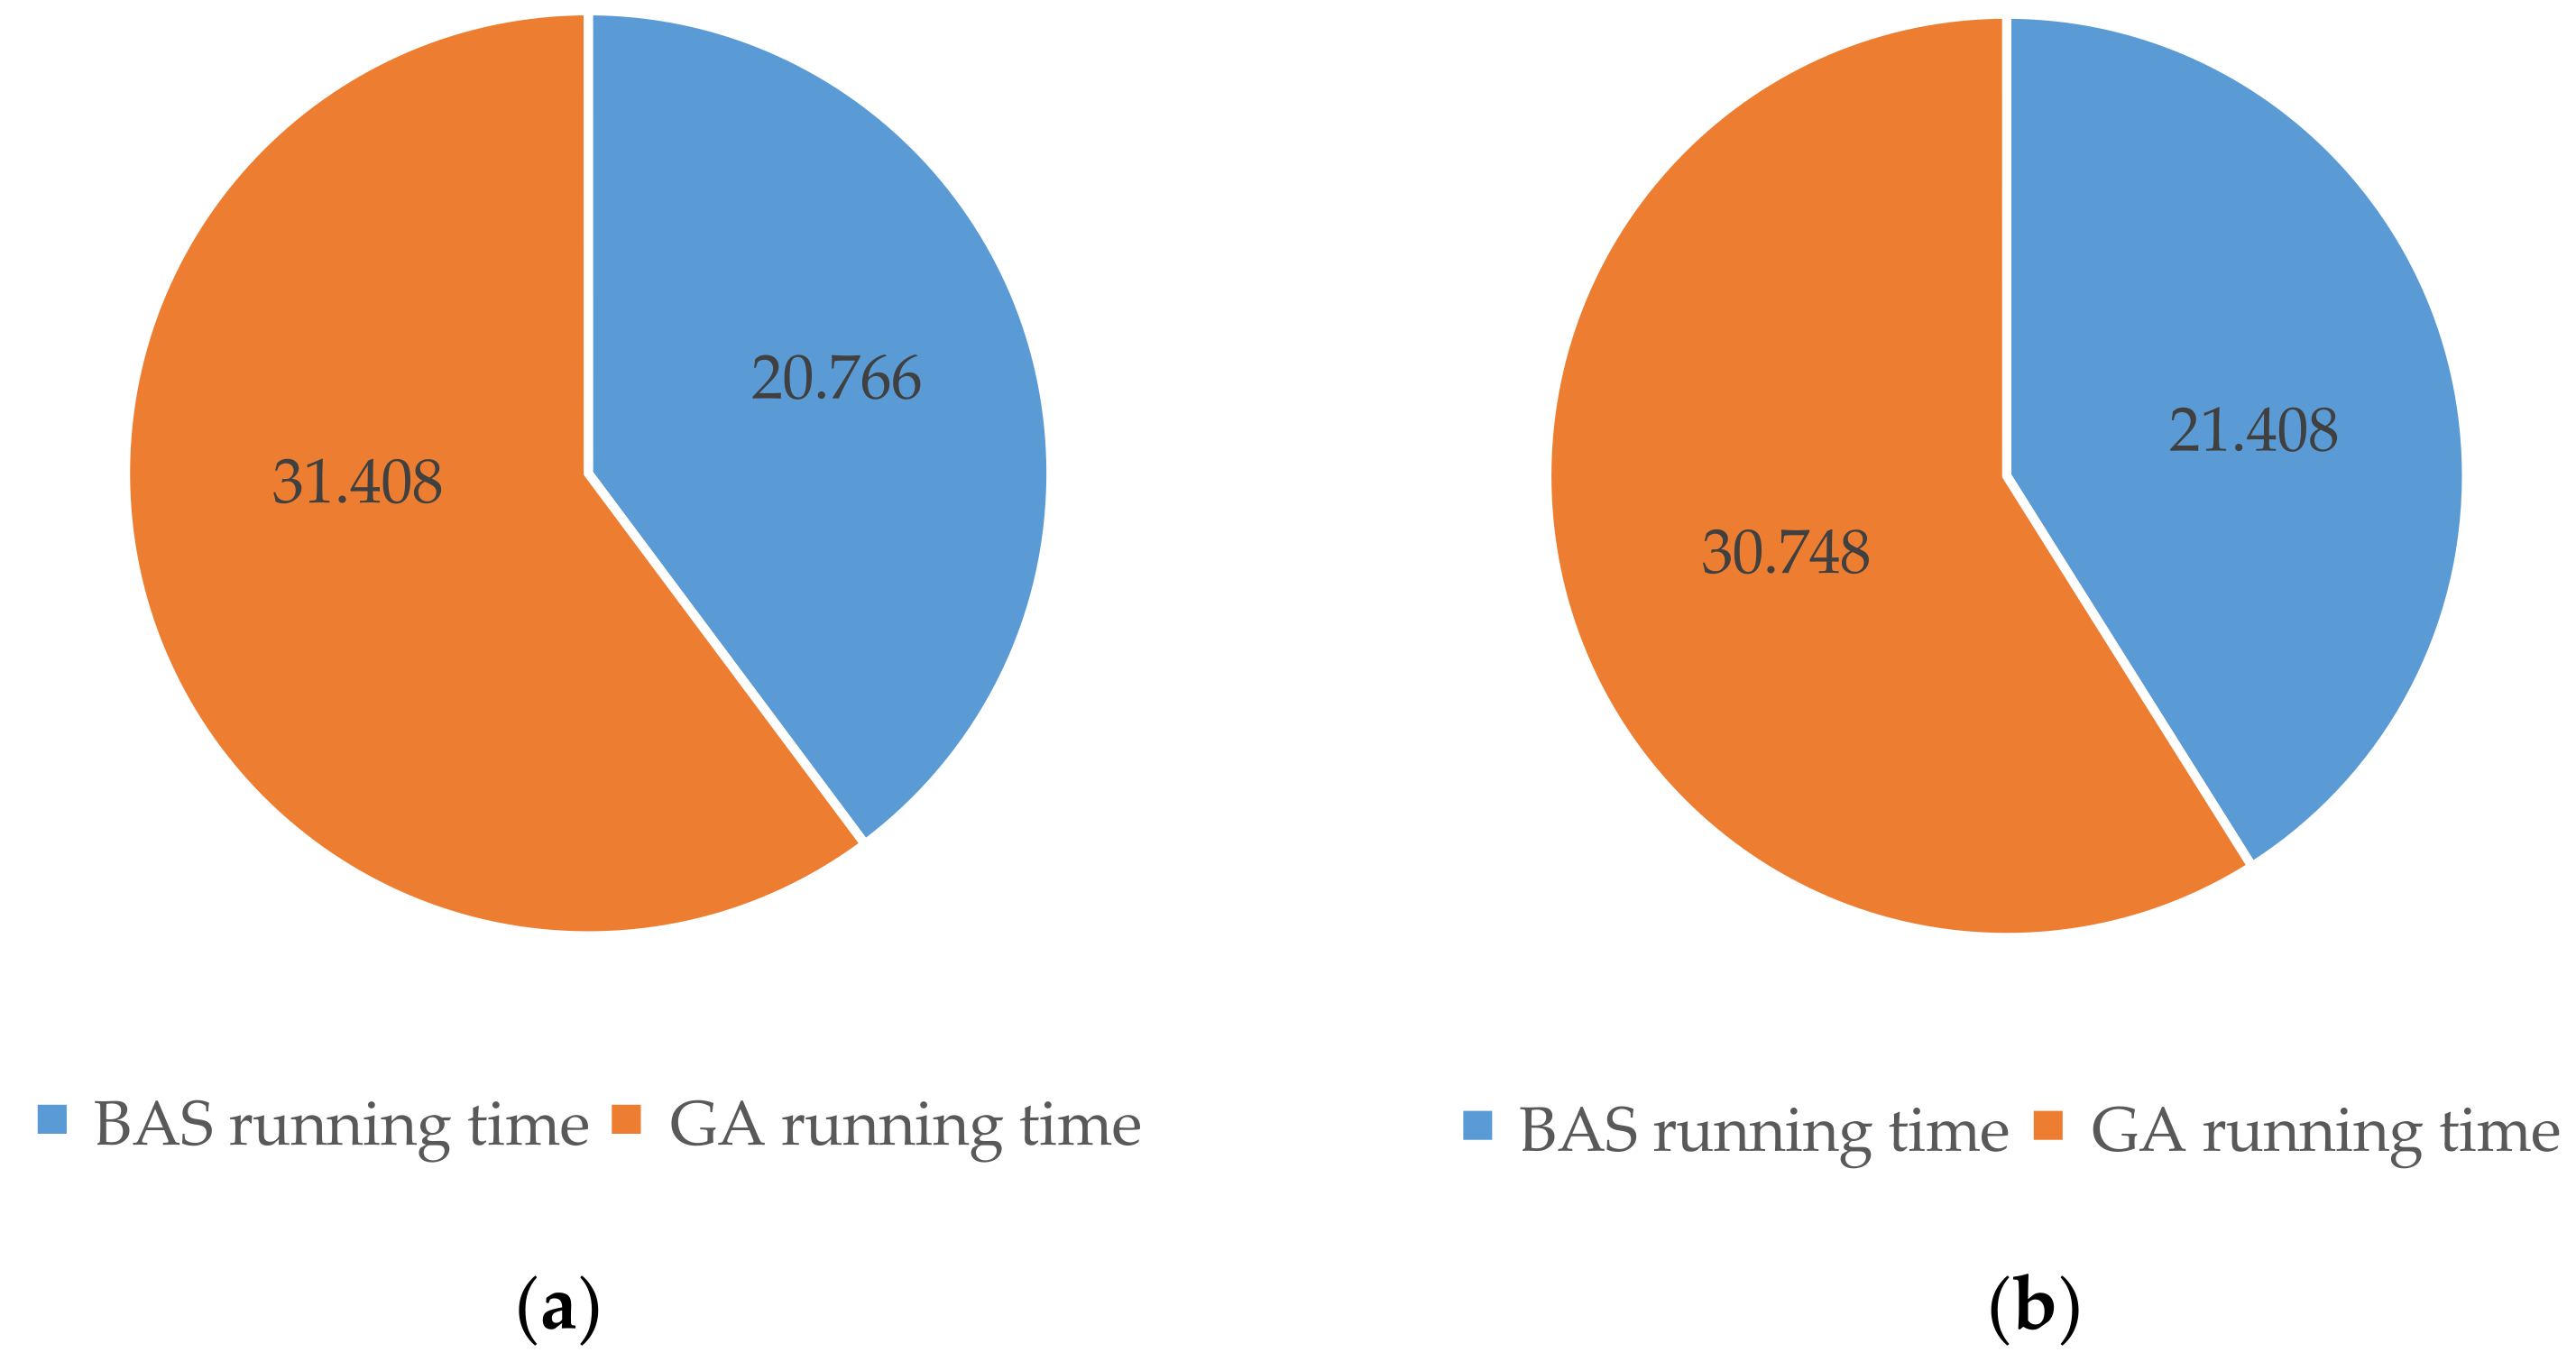
A BAS-BP thermal error prediction model was established. The robustness and prediction accuracy of the BAS-BP model were verified at different rotational speeds. The mean axial absolute errors of the BAS-BP neural network prediction model at 4000 r/min and 8000 r/min are 1.58 μm and 1.232 μm, respectively, and the prediction accuracy is 94.1% and 96.6%, respectively. They are better than BP and GA-BP neural network prediction models. Compared with the GA-BP thermal error prediction model, the BAS-BP prediction model has the advantages of high precision and small computation. Therefore, the GA-BP model is suitable for the prediction and compensation of spindle thermal error, which is significant to improving the machining accuracy of machine tools.

Author Contributions

Conceptualization, Z.L., Y.D. and B.Z.; methodology, Z.L., Y.D. and B.Z.; validation, Z.L., Y.D. and B.Z.; formal analysis, Z.L., Y.D. and B.Z.; investigation, Z.L., Y.D. and B.Z.; resources, Z.L., Y.D. and B.Z.; data curation, Z.L. and B.Z.; writing—original draft preparation, Z.L. and B.Z.; writing—review and editing, Z.L. and B.Z.; visualization, Z.L. and B.Z.; supervision, Z.L., B.Z., W.Z., Q.W. and B.W.; project administration, Z.L. and Y.D.; funding acquisition, Z.L. and Y.D. All authors have read and agreed to the published version of the manuscript.

Funding

This work was supported by the National Natural Science Foundation of China, grant number 52075134, and research was funded by Natural Science Foundation of Heilongjiang Province, grant numberLH2019E062, and research was funded byHeilongjiang Province Postdoctoral Research Startup Funding Project, grant numberLBH-Q20097.

Institutional Review Board Statement

Not applicable.

Informed Consent Statement

Not applicable.

Data Availability Statement

Not applicable.

Acknowledgments

The authors would like to thank Key Laboratory of Advanced Manufacturing Intelligent Technology of the Ministry of Education for helpful discussions on topics related to this work. The authors are grateful to Bo Zhu for his help with the preparation of figures in this paper.

Conflicts of Interest

The authors declare no conflict of interest.

References

  1. Dai, Y.; Wang, J.H.; Li, Z.L. Thermal performance analysis and experimental study of high-speed motorized spindle based on the gradient descent method. Case Stud. Therm. Eng. 2021, 26, 101056. [Google Scholar] [CrossRef]
  2. Liu, K.; Han, W.; Wang, Y.Q. Review on Thermal Error Compensation for Axes of CNC Machine Tools. J. Mech. Eng. 2021, 57, 156–173. [Google Scholar]
  3. Wang, H.T.; Li, T.M.; Wang, L.P. Review on Thermal Error Modeling of Machine tools. J. Mech. Eng. 2015, 51, 119–128. [Google Scholar] [CrossRef]
  4. Zhang, T.; Ye, W.H.; Shan, Y.C. Application of sliced inverse regression with fuzzy clustering for thermal error modeling of CNC machine tool. Int. J. Adv. Manuf. Technol. 2016, 85, 2761–2771. [Google Scholar] [CrossRef]
  5. Shen, J.H.; Yang, J.G. Application of Partial Least Squares Neural Network in Thermal Error Modeling for CNC Machine Tool. Key Eng. Mater. 2009, 392, 30–34. [Google Scholar] [CrossRef]
  6. Ma, C.; Zhao, L.; Mei, X.S. Thermal errorcompensation of high-speed spindle system based on a modified BP neural network. Int. J. Adv. Manuf. Technol. 2017, 89, 3071–3085. [Google Scholar] [CrossRef]
  7. Li, Z.Y.; Li, G.L.; Xu, K. Temperature-sensitive point selection and thermal error modeling of spindle based on synthetical temperature information. Int. J. Adv. Manuf. Technol. 2021, 113, 1029–1043. [Google Scholar] [CrossRef]
  8. Chiu, Y.C.; Wang, P.H.; Hu, Y.C. The Thermal Error Estimation of the Machine Tool Spindle Based on Machine Learning. Machines 2021, 9, 184. [Google Scholar] [CrossRef]
  9. Li, Y.; Zhao, J.; Ji, S.J. Thermal positioning error modeling of machine tools using a bat algorithm-based back propagation neural network. Int. J. Adv. Manuf. Technol. 2018, 97, 2575–2586. [Google Scholar] [CrossRef]
  10. Zhou, C.Y.; Zhuang, L.Y.; Yuan, J. Optimization and Experiment of Temperature Measuring Points for Machine Tool Spindle Based on K-means Algorithm. Mach. Des. Manuf. 2018, 5, 41–47. [Google Scholar]
  11. Chen, J.S.; Hsu, W.Y. Characterizations and models for the thermal growth of a motorized high speed spindle. Int. J. Mach. Tools Manuf. 2003, 43, 1163–1170. [Google Scholar] [CrossRef]
  12. Lei, C.L.; Rui, Z.Y.; Liu, J. Thermal Error Robust Modeling for High-Speed Motorized Spindle. Adv. Mater. Res. 2012, 466, 961–965. [Google Scholar] [CrossRef]
  13. Yang, J.; Shi, H.; Feng, B. Thermal error modeling and compensation for a high-speed motorized spindle. Int. J. Adv. Manuf. Technol. 2015, 77, 1005–1017. [Google Scholar] [CrossRef]
  14. Jiang, H.; Yang, J.G.; Yao, X.D. Modeling of CNC Machine Tool Spindle Thermal Distortion with LS-SVM Based on Bayesian Inference. J. Mech. Eng. 2013, 49, 115–121. [Google Scholar] [CrossRef]
  15. Zhao, C.L.; Guan, X.S. Parameter Optimization of Thermal Error of NC Machine. Modul. Mach. Tool Autom. Manuf. Tech. 2013, 655–657, 34–36. [Google Scholar]
  16. Su, Y.F.; Yuan, W.X.; Liu, D.P. A Thermal Errors Compensation Model for High-speed MotorizedSpindle Based on BP Neural Network. Modul. Mach. Tool Autom. Manuf. Tech. 2013, 1, 36–41. [Google Scholar]
  17. Liu, Y.; Wang, X.F.; Zhu, X.G. Thermal error prediction of motorized spindle for five-axis machining center based on analytical modeling and BP neural network. J. Mech. Sci. Technol. 2021, 35, 281–292. [Google Scholar] [CrossRef]
  18. Huang, Y.Q.; Zhang, J.; Li, X. Thermal error modeling by integrating GA and BP algorithms for the high-speed spindle. Int. J. Adv. Manuf. Technol. 2014, 71, 1669–1675. [Google Scholar] [CrossRef]
  19. Li, B.; Tian, X.T.; Zhang, M. Thermal error modeling of machine tool spindle based on the improved algorithm optimized BP neural network. Int. J. Adv. Manuf. Technol. 2019, 105, 1497–1505. [Google Scholar] [CrossRef]
  20. Cui, L.Y.; Zhang, D.W.; Gao, W.G. Thermal errors simulation and modeling of motorized spindle. Adv. Mater. Res. 2011, 154, 1305–1309. [Google Scholar] [CrossRef]
  21. Zhang, H.N. Research on Modeling of Machining Center Spindle Thermal Error Based on Improved RBF Network. Tech. Autom. Appl. 2019, 38, 60–74. [Google Scholar]
  22. Fu, G.Q.; Gong, H.W.; Gao, H.L. Integrated thermal error modeling of machine tool spindle using a chicken swarm optimization algorithm-based radial basic function neural network. Int. J. Adv. Manuf. Technol. 2019, 105, 2039–2055. [Google Scholar] [CrossRef]
  23. Wang, Y.D.; Zhang, G.X.; Moon, K.S. Compensation for the thermal error of a multi-axis machining center. J. Mater. Process. Technol. 1998, 75, 45–53. [Google Scholar] [CrossRef]
  24. Yao, X.P.; Hu, T.; Yin, G.F. Thermal error modeling and prediction analysis based on OM algorithm for machine tool’s spindle. Int. J. Adv. Manuf. Technol. 2020, 106, 3345–3356. [Google Scholar] [CrossRef]
  25. Abdulshahed, A.M.; Longstaff, A.P.; Fletcher, S. The application of ANFIS prediction models for thermal error compensation on CNC machine tools. Appl. Soft Comput. J. 2015, 27, 158–168. [Google Scholar] [CrossRef]
  26. Dai, Y.; Yin, X.M.; Wei, W.Q. Thermal error modeling of high-speed motorized spindle based on ANFIS. Chin. J. Sci. Instrum. 2020, 41, 50–58. [Google Scholar]
  27. Yue, H.T.; Guo, C.G.; Li, Q. Thermal error modeling of CNC milling machining spindle based on an adaptive chaos particle swarm optimization algorithm. J. Braz. Soc. Mech. Sci. Eng. 2020, 42, 1–13. [Google Scholar] [CrossRef]
  28. Zheng, J.Y.; Liu, B.G.; Feng, W. Machine tool spindle thermal error modeling basedon genetic algorithm optimization grey neural network. J. Mech. Electr. Eng. 2019, 36, 602–607. [Google Scholar]
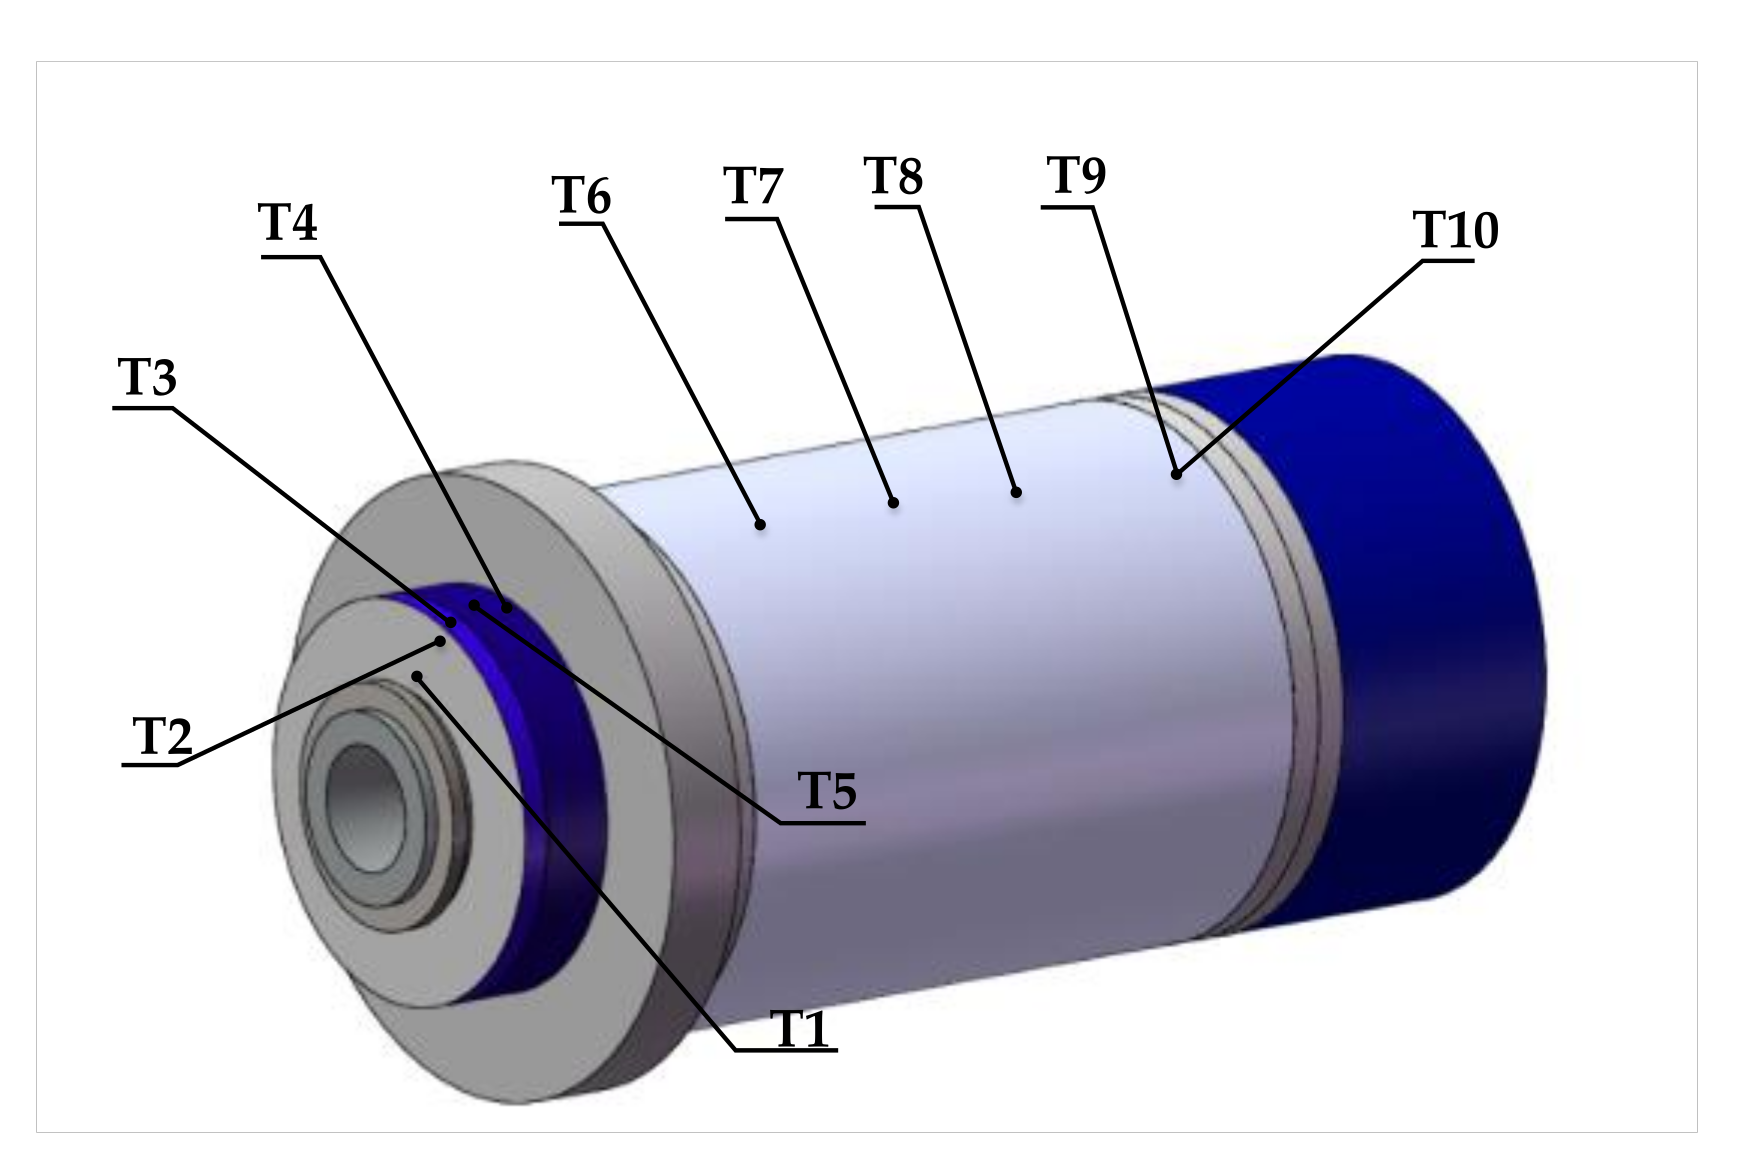
Figure 1. Front end temperature sensor.
Machines 09 00286 g001
Figure 2. Axial temperature sensor.
Machines 09 00286 g002
Figure 3. Schematic diagram of temperature sensor layout.
Machines 09 00286 g003
Figure 4. Installation of laser displacement sensor.
Machines 09 00286 g004
Figure 5. Temperature measuring point curve of motorized spindle at 4000 r/min.
Machines 09 00286 g005
Figure 6. Temperature measuring point curve of motorized spindle at 6000 r/min.
Machines 09 00286 g006
Figure 7. Temperature measuring point curve of motorized spindle at 8000 r/min.
Machines 09 00286 g007
Figure 8. Axial thermal drift curve of motorized spindle.
Machines 09 00286 g008
Figure 9. Structure of BP neural network.
Machines 09 00286 g009
Figure 10. BAS-BP neural network optimization flow chart.
Machines 09 00286 g010
Figure 11. GA-BP neural network optimization flow chart.
Machines 09 00286 g011
Figure 12. Prediction curves of each model at 4000 r/min: (a) BP prediction curve; (b) GA-BP prediction curve; (c) BAS-BP prediction curve.
Machines 09 00286 g012
Figure 13. Prediction curves of each model at 8000 r/min: (a) BP prediction curve; (b) GA-BP prediction curve; (c) BAS-BP prediction curve.
Machines 09 00286 g013
Figure 14. Evaluation results of each model at 4000 r/min.
Machines 09 00286 g014
Figure 15. Evaluation results of each model at 8000 r/min.
Machines 09 00286 g015
Figure 16. Running time of Beetle antennae search algorithm and genetic algorithm at different rotational speeds. (a) 4000 r/min running time. (b) 8000 r/min running time.
Machines 09 00286 g016
Table 1. Design of temperature measuring point scheme.
Temperature Sensor No.Position
T1,T2Front
T3,T4Front bearing outside housing
T5Inside front bearing
T6,T7,T8Inside the motor housing
T9Rear bearing outside shell
T10Inside rear bearing
Table 2. Clustering results.
λCategoriesClustering Results
1.00010[T1],[T2],[T3],[T4],[T5],[T6],[T7],[T8],[T9],[T10]
0.98629[T1],[T2],[T3,T9],[T4],[T5],[T6],[T7],[T8],[T10]
0.98028[T1],[T2],[T3,T9],[T4,T6],[T5],[T7],[T8],[T10]
0.97757[T1],[T2],[T3,T9],[T4,T6,T8],[T5],[T7], [T10]
0.92846[T1],[T2],[T3,T9],[T4,T6,T8],[T5,T10],[T7]
0.88815[T1],[T2],[T3,T9],[T4,T6,T7,T8],[T5,T10]
0.88654[T1,T2],[T3,T9],[T4,T6,T7,T8],[T5,T10]
0.85853[T1,T2,T3,T9],[T4,T6,T7,T8],[T5,T10]
0.82282[T1,T2,T3,T9],[T4,T5,T6,T7,T8,T10]
0.57711[T1,T2,T3,T4,T5,T6,T7,T8,T9,T10]
Table 3. Optimal clustering results.
Grouping1234
Temperature measurement pointsT1,T2T3,T9T4,T6,T7,T8T5,T10
Table 4. Grey relational degree between axial thermal error and temperature measurement points.
Temperature Measurement PointsGray Relational DegreeTemperature Measurement PointsGray Relational Degree
T10.4074T60.4124
T20.4066T70.4171
T30.4129T80.4125
T40.4133T90.4142
T50.5174T100.7226
Table 5. Parameters of GA algorithm.
Size of GroupGenerations of EvolutionIntersecting RateVariation Rate
10500.30.01
Publisher’s Note: MDPI stays neutral with regard to jurisdictional claims in published maps and institutional affiliations.

