1. Introduction
Coal mine roadways are not only important living environments for underground workers but also provide paths for mineral lifting, transmission, drainage, ventilation, and mining machinery excavations [
1]. Moreover, bolt supports have an important impact on coal mining. Due to their ability to strengthen the surrounding rock and their low cost, bolt supports can accelerate the speed of roadway formation, improve labor intensity and the working environment, and make coal mining more efficient with a higher yield. Bolt support has thus become the main type of support form in all countries, especially in developed countries such as Australia, the United States, and Britain [
2].
The roof of a coal roadway is composed of a sedimentary layered rock mass, and the lithology of each layer is different. Most of these roof rocks are sandstone, siltstone, sandy mudstone, mudstone, sandy shale, and limestone, and the unconfined compressive strength of each layer is very different [
3]. The drilling process for roof anchor holes is sometimes fast and sometimes slow, the efficiency of drilling is not high [
4]. Drilling speed not only affects the speed and efficiency of hole formation, for the anchoring hole, but also has an important influence on the construction management and project schedule of the coal roadway [
5]. There are many factors affecting variations in the drilling speed of the bolt drill; these factors are related not only to drilling parameters such as thrust, propulsion speed, torque, and rotation speed but also to the unconfined compressive strength of the roof rock [
6].
As early as the 1950s, scholars of the former Soviet Union applied the DIRECT current method to detect the small structure of a coal seam and evaluate the stability of a roof. In 1965, Teale first put forward the concept of using specific techniques for drilling and crushing rock [
7]. In this method, the energy consumed per unit volume by crushing rock is used to establish a mathematical model connecting the drilling parameters and formation characteristics, based on drilling parameters such as thrust, propulsion speed, torque, and rotation speed. Drilling process monitoring technology (MWD) provides improved measurements over drilling technology based on earlier drilling parameter recording technology in the field of oil drilling. MWD is usually used to measure, monitor, and record the drilling parameters of a drill. In the 1970s, foreign companies developed several systems, including Analogue Drilling Parameters (ADP) and Automated Drill Monitors (ADM). Using microprocessor-based drilling-process monitoring technology, the formations were identified, and the blasting parameters were optimized using the drilling parameters. Tiryaki and Dikmen [
8], Christine N, and Beattie M noted an obvious correlation between the specific work of rock crushing and the uniaxial compressive strength index of the rock. Some scholars have [
9,
10] noted that different rock strata have different petrological, physical, and mechanical properties when drilling the anchoring hole, and their drilling vibration characteristics are also different. Therefore, rock strata can be identified based on the vibration characteristics during drilling. Another group of scholars proposed a method for predicting rock uniaxial compressive strength based on the P-wave modulus [
11]. Tan Zhuo-ying proposed a new concept that uses the perforation rate per unit of energy as the drillability [
12]. Based on the coupling relationship between the effective axial pressure, rotational speed, perforation rate, and drillability during drilling, continuous layer judgments along the borehole section can be realized. Chen Jia-sheng et al. [
13] determined a drilling parameter calculation formula for roof rock during drilling by detecting the pressure and flow rate of the hydraulic system of a bolt drilling machine to detect roadway roof rock. Li Xintao et al. developed concrete test blocks with different strength ratios, tested the drilling parameters of a hydraulic anchor drill, and obtained a high linear relationship between the specific work of rock crushing and the uniaxial compressive strength of concrete [
14,
15,
16].
To summarize, in field rock identification [
17], significant work has been done, including the use of a hydraulic anchor drill for drilling-rock identification [
18], adopting a hydraulic jump bolter hydraulic motor, and using the leg flow and pressure of the hydraulic cylinder, multiplied by the efficiency of the hydraulic system, for drilling rock fragmentation. The shortcomings of the current methods include the hydraulic motor and the leg. Moreover, the efficiency of the hydraulic cylinder is difficult to measure and can only be based on experience when estimating a value. Further, the hydraulic system runs at a high temperature. Thus, efficient temperature changes will produce significant volatility, and calculating errors can lead to crushed rock [
19]. At the same time, the drilling efficiency of the roof anchoring hole is not high, and research on optimization of the drilling speed has not been mentioned in the literature [
20]. While drilling is used, in this paper, to identify the unconfined compressive strength (UCS) system of coal-mine roadway roof rock to overcome the shortcomings of the hydraulic system, at the same time, for the real-time identification of the roof rock’s unconfined compressive strength (UCS) during drilling, the method of combining the pneumatic anchor drilling machine motor power characteristic curve can be used to optimize the jump bolter drilling speed.
The second part of the article describes the principle of mechanical specific energy. In the third part, it is found that the maximum power output of the pneumatic motor is related to the unconfined compressive strength and outrigger pressure of different rocks. The outrigger pressure of the pneumatic roof bolter does not match the output power of the pneumatic motor, so the pneumatic motor cannot reach the maximum power point. Due to the insufficient thrust of the pneumatic outrigger, the output power of the pneumatic motor cannot reach the maximum, and the pressure of the hard rock outrigger is more insufficient than that of the soft rock outrigger. In order to improve the output power of the pneumatic motor, and improve the ROP (rate of penetration), the pressurization valve is designed and installed in the system. Through testing the ROP, it is found that the power of the pneumatic motor has a linear relationship with the ROP, which proves that increasing the motor power can improve the effectiveness of the ROP method. The fourth part is the systematic design and experimental research of the drilling identification method of soft rock interlayer, in a coal mine roadway roof, based on drilling specific work.
3. Optimization of Drilling Speed
3.1. Mathematical Model of the Output Torque of the Pneumatic Motor
The gear motor drives the gear to spin and generate torque under high-pressure compressed air. While the motor rotor is rotating, other processes occur, including the driving moment of the motor rotor, the viscous friction moment between the end face of the gear rotor and the case, the viscous friction moment between the tooth tip of the gear rotor and the case, and the relative sliding friction moment in the meshing of the gear rotor. When the motor is idling, the torque is balanced through the friction generated by the gear rotor. When the motor drives the external load, the speed decreases, and the sum of the external load and friction force becomes balanced with the driving torque.
3.1.1. Driving Torque of the Motor Rotor
The force of high-pressure compressed air on the gear rotor can be expressed as
where
P is the air pressure;
B is the width of the gear rotor;
R is the addendum circle radius of the gear rotor;
and
are, respectively, the distance between the meshing point of the gear rotor and the center,
and
, of the gear rotor:
The driving torque of the motor rotor
T0 is given as
A different arrangement of Equation (4) can be obtained as follows:
3.1.2. The Moment of Viscous Friction between the End Face of the Gear Rotor and the Housing
There is a gap between the gear end face and the housing. This gap is filled with lubricating oil. The moment of viscous friction between the end face of a single gear rotor and the housing
T11 can be expressed as:
where
is the dynamic viscosity coefficient of the motor lubricating oil,
is the end clearance between the gear rotor and the housing,
is the rotation angular velocity of the gear rotor, and
R1 is the shaft journal radius of the gear rotor.
3.1.3. Moment of Viscous Friction between the Gear and the Housing
The torque of viscous frictional resistance in the relative motion between the gear top and the housing
can be calculated as follows:
where
is the tip thickness of a single gear of the gear rotor,
is the clearance between the gear rotor and the side of the housing,
is the motor housing radius, and
is the addendum area of a single gear.
3.1.4. Friction Torque Caused by Bearing Friction against the Gear Rotor
The bearing in a geared pneumatic motor is a ball bearing, and the friction torque generated by each bearing on the gear rotor
can be expressed as:
where
is the coefficient of bearing friction, with
is the radial thrust produced by the pneumatic action of the gear rotor on the bearing;
is the inner diameter of the bearing.
In addition, the relative sliding friction moments of gear-rotor meshing are as follows: , , where and are the sliding friction coefficients of the meshing points of the two gear rotors and and refer to the positive pressure of the meshing points during the meshing of the two gear rotors. Here, . Because the friction coefficient is very small, it has little effect on the output torque of the motor and can be ignored.
The output torque of the pinion type pneumatic motor is given as follows:
where
is the number of teeth acting as seals between a single gear rotor and the inner wall of the housing.
3.2. Mathematical Model of the Drilling Power Output
The energy generated by the second moment in Formula (5) is 10–200 times greater than the energy generated by the first force [
21]. That is, the energy generated by the torque is the main part of the drilling energy. Therefore, according to [
22], the energy generated by thrust can be ignored, and the following formula can be obtained:
where
is the cross-sectional area of the bit, which is a fixed value. When the UCS of the rock drilled by the bit is constant, the speed of bolt drilling u is proportional to the power output by the pneumatic motor
. Therefore, when the output power of the pneumatic motor
is maximum, the bolt drilling speed u is also maximum:
3.3. Optimization of Drilling Speed
When drilling with an anchor rod, the goal is to drill as fast as possible, which will not only improve the workers’ labor efficiency but also reduce the production costs of the coal mine. A traditional pneumatic bolt machine is manually operated when drilling, and the drilling speed completely depends on the workers’ experience. Without theoretical support, the drilling speed cannot be optimized.
The power characteristic curve of the pneumatic motor of a traditional pneumatic anchor drill is shown in
Figure 1. Here, the power output by the pneumatic motor passes through the origin parabola. When the loading torque is too large, the speed of the pneumatic motor of the bolt drill reaches the minimum of zero, and then, the power output by the motor is zero. When the loading moment is zero, the power output by the pneumatic motor is also zero. At this point, the speed output by the pneumatic motor is maximum.
We observed that, when the motor load torque has a certain value, the output speed of the motor is half of its maximum speed, and the motor output power is the largest. Therefore, the power output of the pneumatic motor can be maximized by using the power characteristic curve of the pneumatic motor. According to Formula (10), the drilling speed output by the bolt drilling machine is also maximum.
For example, the structural parameters of gear motor and gear rotor are the number of teeth z = 9, modulus M = 5, center distance O1O2 = 49 mm, r = 29.5 mm, B = 70 mm, R1 = 14.5 mm, δ1 = 0.05 mm, δ2 = 0.03 mm, Z1 = 5, the calculated average value of a is 22.765 mm, and the average value of B is 22.721 mm. When the inlet pressure P = 0.5 MPa, = 0.0267 PAs, the calculated average torque is: .
The calculated average power is:
The power curve is shown in
Figure 2, which is a parabola.
4. Development of the UCS Detector Test System for the Roadway Rock
4.1. Structure and Composition of the Roof-Strata Detector
In the process of drilling, the roof bolt hole is drilled from bottom to top in the coal mine roadway. The rock debris produced in the process of drilling is discharged from the gap between the drill pipe and the borehole wall under the action of gravity and water pressure. Thus, the energy consumption of the secondary crushing of rock debris is very small and can be ignored [
23]. During drilling, the mechanical energy of the pneumatic roof bolter is converted into the heat energy of the bit and rock, which is also ignored [
24,
25].
When the bit drills into the roof rock, the act of drilling is divided into two kinds of motion: linear motion and rotational motion. The energy consumed is also divided into the energy consumed by the linear motion of the bit and the energy consumed by rotational motion, which refers to the drilling parameters such as bit thrust, propulsion speed, movement speed, and rotational speed. We can use Formula (1) to calculate the energy consumed by the drilling of the bit per unit volume of rock and then obtain the specific work of rock fragmentation, thereby obtaining the UCS of the roof rock.
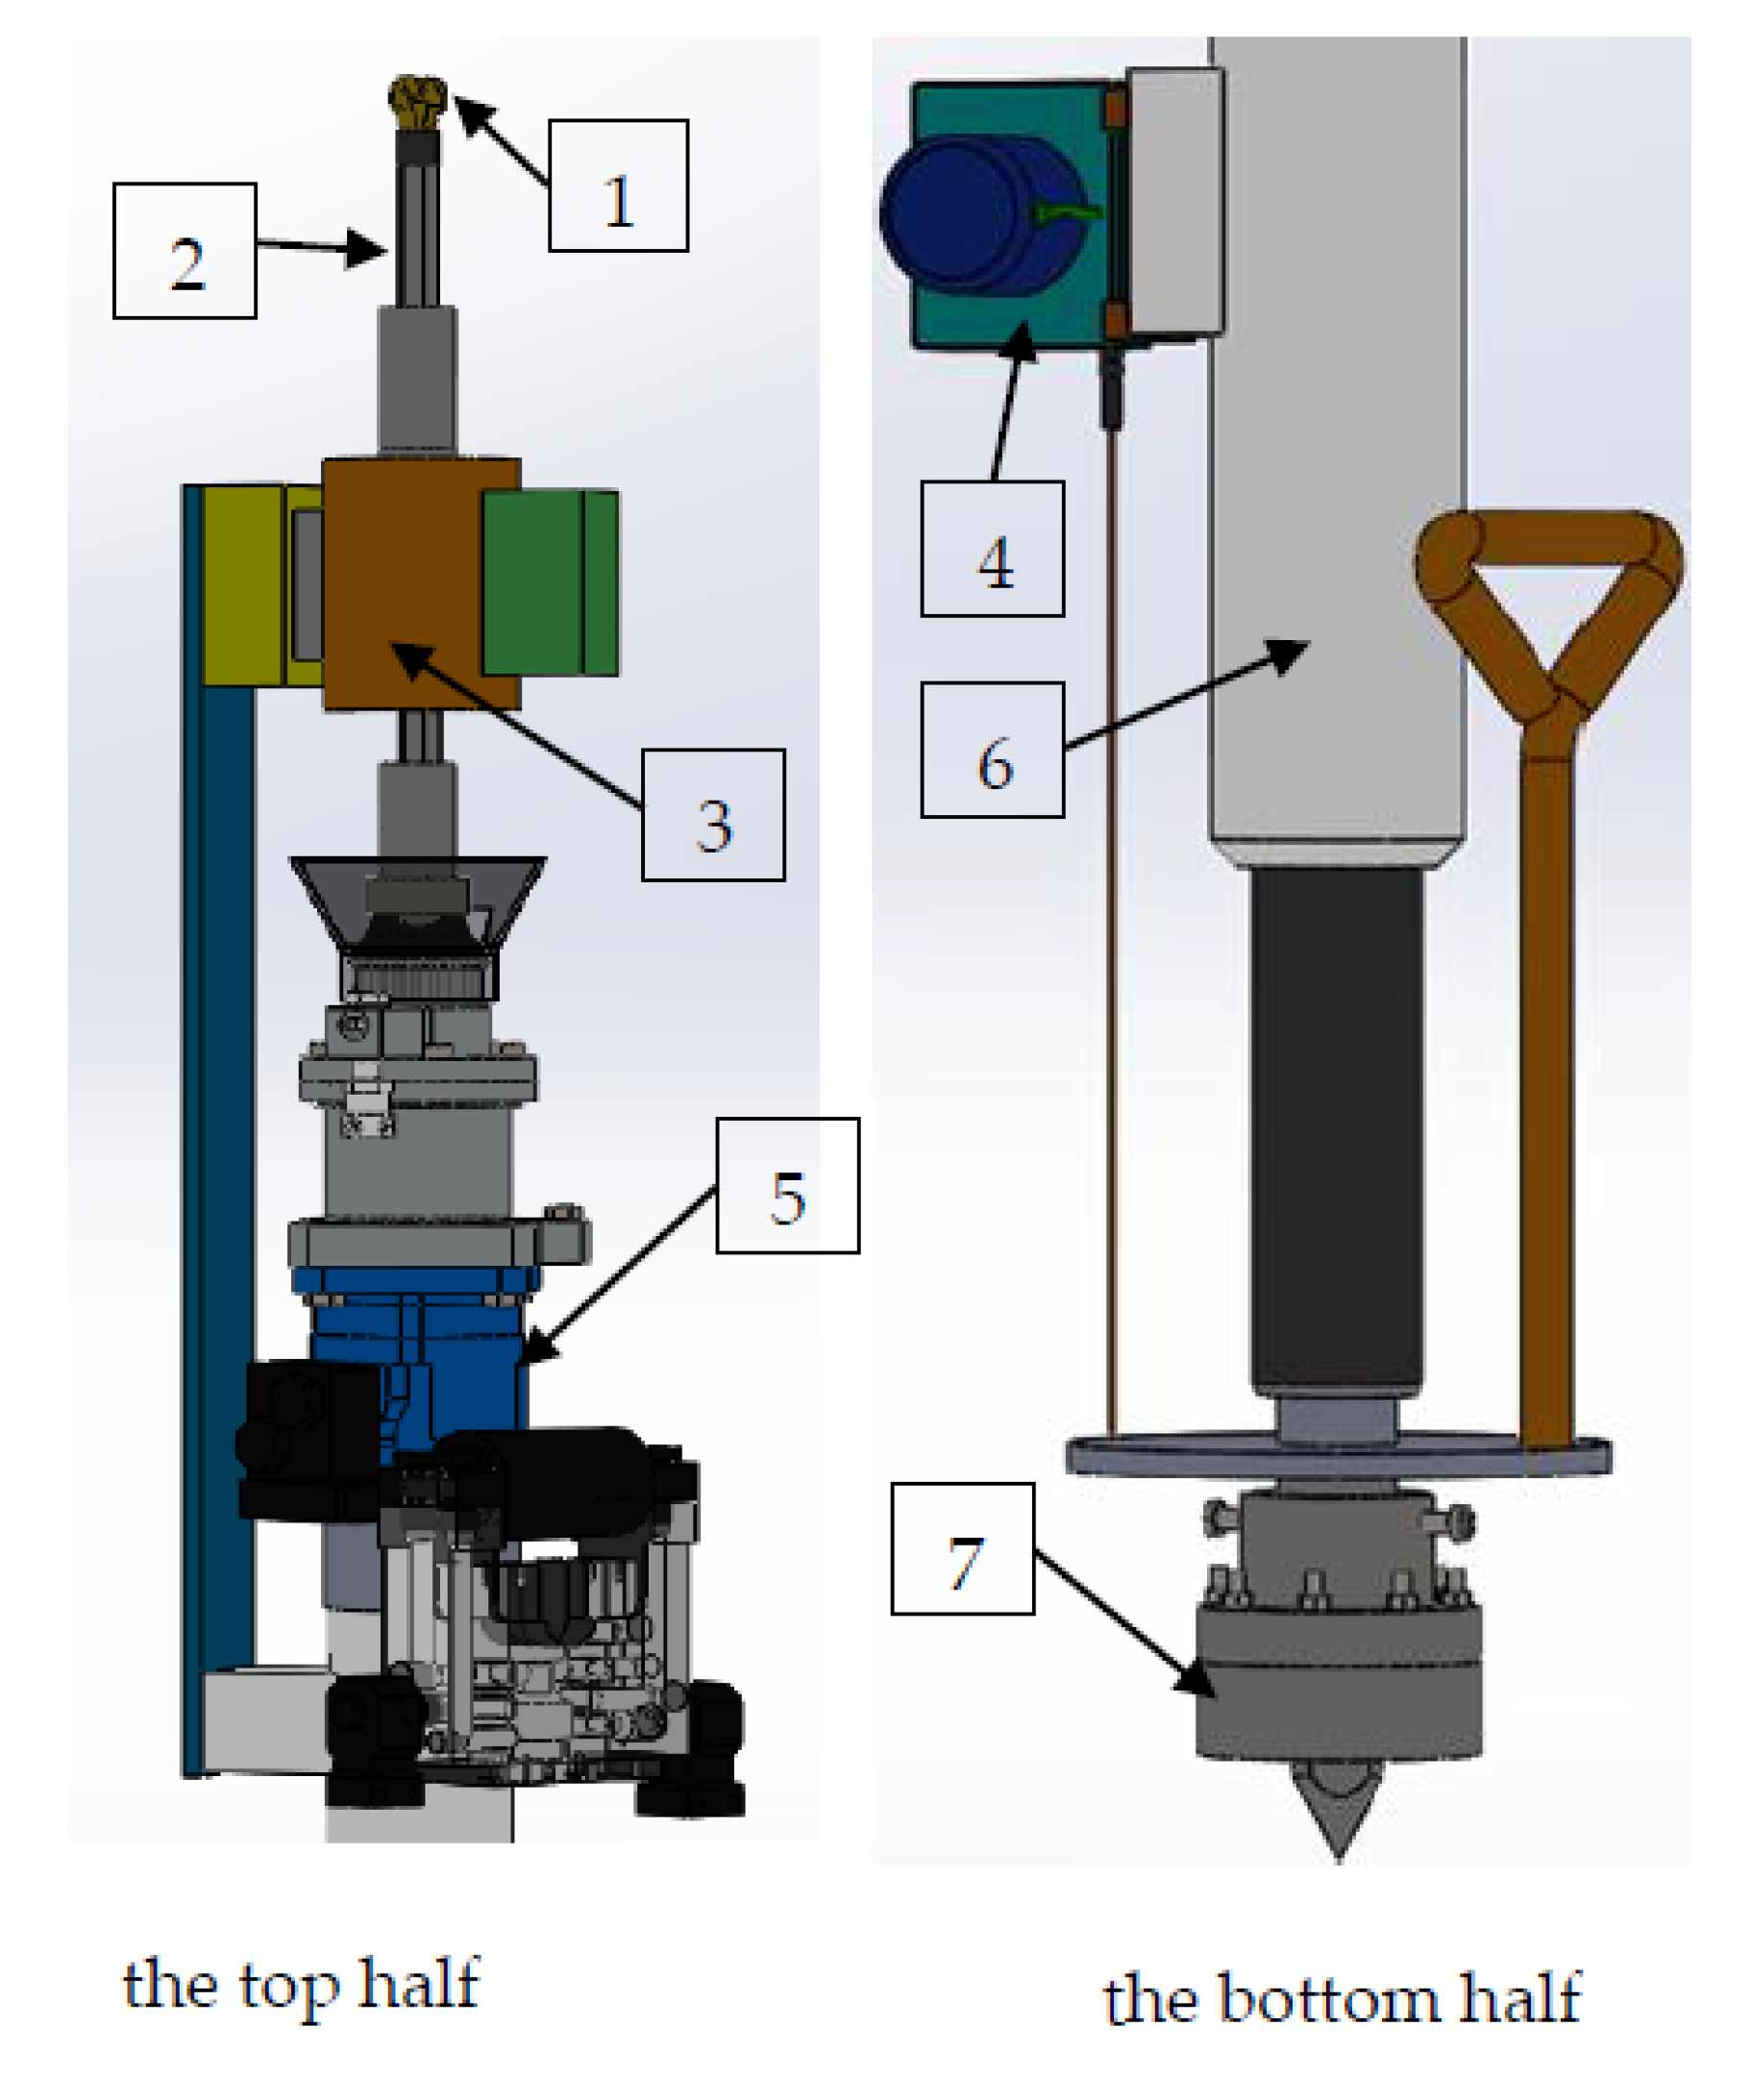
A three-dimensional structural diagram of the rock-unconfined compressive-strength detector for roadway roof identification, proposed in this paper, is shown in
Figure 3. This detector includes torque and speed sensors, displacement sensors, force sensors, pneumatic bolt machines, PDC bits, couplings, drill pipes, and controllers. The two ends of the torque and speed integrated sensor are cylindrical shafts connected to the main shaft and drill pipe of the pneumatic anchor drill through the coupling. An axle strain gauge is affixed to the inner shaft of the torque and speed sensor. A conditioning circuit is installed inside the jacket, and a base is installed outside the jacket. The base is connected to the body of the bolt machine through an iron block, as shown in
Figure 4.
One end of the displacement sensor is connected to the fuselage of the bolt drill, and the other end is connected to the end of the bolt machine’s leg cylinder. The torque and speed sensors measure the torque of the bit against the roof rock during the drilling process of the pneumatic anchor drill and measure the rotation speed of the bit. The force sensor measures the pressure of the bit when drilling the rock. The displacement sensor measures the bit displacement, which can be differentiated to obtain the drilling rate. These parameters are passed to the processor, and according to these drilling parameters, the processor can obtain the UCS in the roadway roof rock stratum in real time when the roadway rock stratum is drilled.
4.2. Experimental System for the UCS Detector of the Roadway Rock
According to the principles of the UCS detector for roadway rock structures, outlined in
Figure 4, we built a physical unconfined compressive-strength detector for roadway rock. The actual application method of vertical drilling for a coal mine roadway with a pneumatic bolt machine is shown in
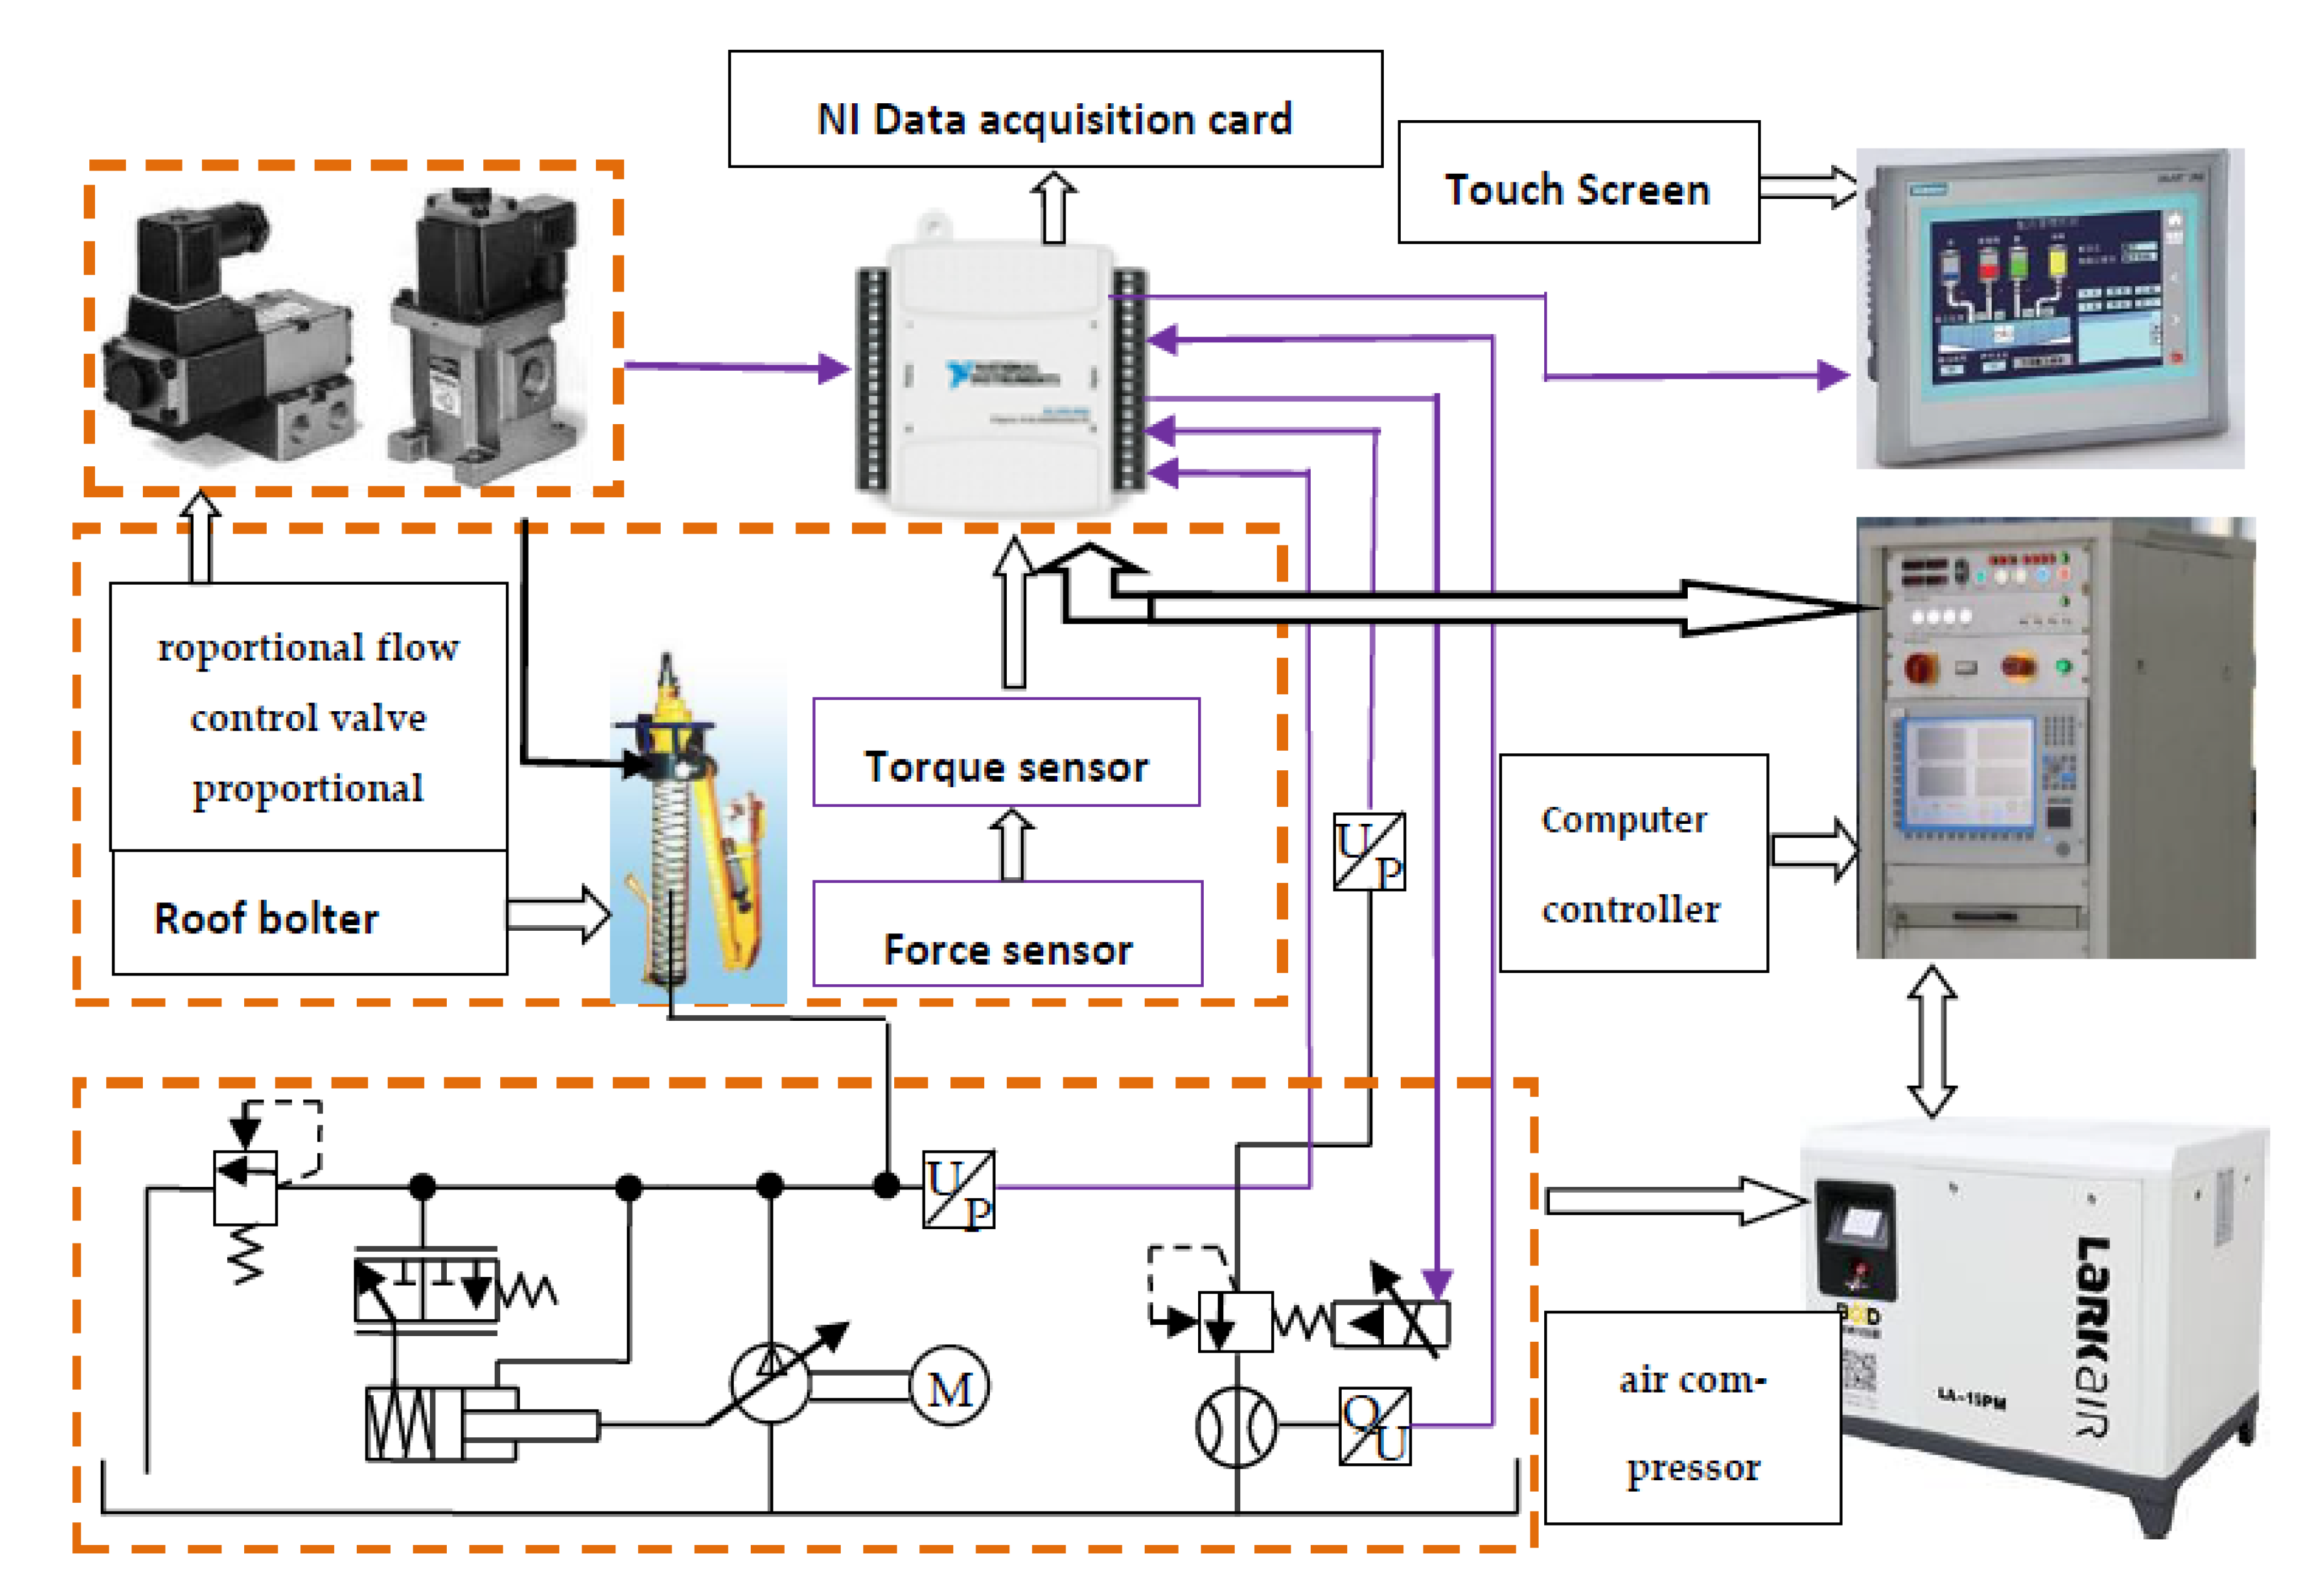
Figure 5. To facilitate observation, safety, and convenience, a pneumatic bolt machine was used for transverse drilling during the experiment. The experimental unconfined compressive-strength detector system for roadway rock, used during the process of transverse drilling, is shown in
Figure 5, and its structure is shown in
Figure 6. The test device includes three parts: the pneumatic bolt machine, the measurement- and control-system, and the compressed-air source.
The pneumatic bolt-machine part includes the following:
- (1)
A single pneumatic bolt drill;
- (2)
An HCNJ-101 integrated torque and speed sensor;
- (3)
A DYLF-102 Spoke-type force transducer;
- (4)
An MPS-S 1.5 m displacement sensor;
- (5)
A B19 bolt six-sided hollow drill pipe;
- (6)
A Φ28 mm PDC;
- (7)
A Φ10 mm water-supply line;
- (8)
An SMC proportional flow valve;
- (9)
Rock.
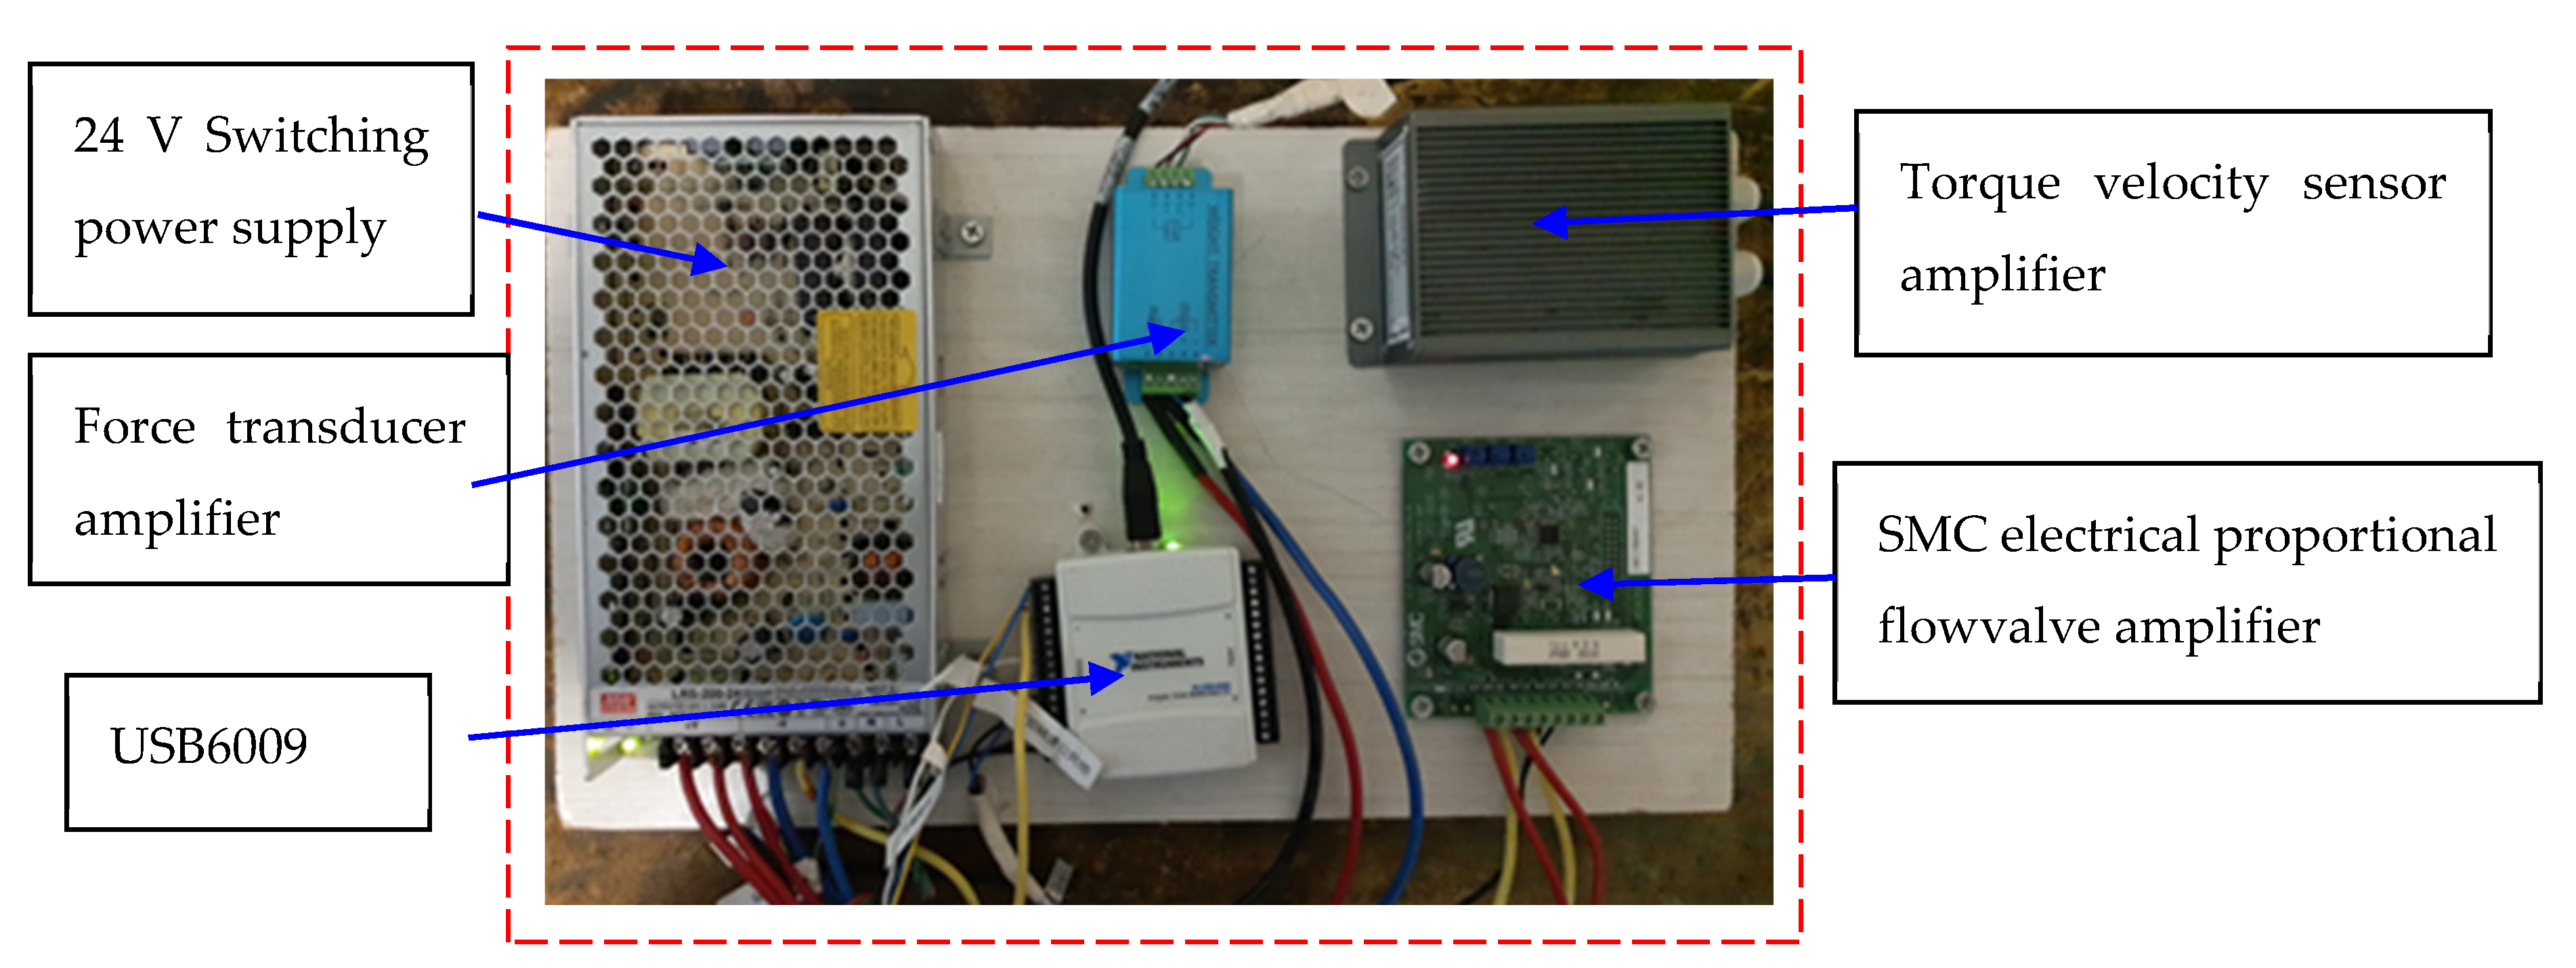
The measurement and control system includes the following:
- (1)
An NI USB-6009 data-acquisition card and the LABVIEW software;
- (2)
A 24 V DC-stabilized voltage supply;
- (3)
A force transducer amplifier;
- (4)
A torque and speed integrated sensor amplifier;
- (5)
An SMC electric proportional flow valve amplifier.
The compressed air source includes the following:
- (1)
An air compressor (3.8 m3/min);
- (2)
An air-storage tank;
- (3)
A drying machine;
- (4)
A filter;
- (5)
A reducing valve.
The experimental system is connected to high-pressure water, to scour the cuttings and cool down the PDC bit, in an effort to more realistically simulate the support situation of a roadway in a coal mine. This system is equipped with an SMC electric proportional flow valve and a valve-matching amplifier, allowing the computer to automatically control the size of the system’s valve opening, automatically control the size of the pneumatic motor’s rotation speed, achieve remote automatic control, and ensure convenient and safe operation. Due to the need for multi-channel data acquisition, the system also needs an electric proportional valve to control the signal output. Because of its simple structure, light weight, high precision, good reproducibility, and high responsivity, the USB6009 data acquisition card is used in this system for data acquisition and control. The LabVIEW software can also be used. The graphical programming language of this system has many controls that can be invoked. These controls are simple, fast, very reliable, and seamlessly connected with the USB 6009 data acquisition card. The specific hardware of the experimental system is shown in
Figure 6.
4.3. Test Results for and Analysis of the Automatic-Drilling-Identification Soft-Rock Interlayer Detector System in Drilling Rocks with Different Levels of Strength
Coal Mine Roadway Roof Rock
False roof: it is a thin rock stratum close to the coal seam and easy to collapse, at the same time, with the mining of coal. The thickness is generally 0.3~0.5m, which is mostly composed of shale, carbonaceous shale, etc.
Direct roof: it refers to the rock stratum directly above the false roof or coal seam (if there is no false roof), which often collapses with the withdrawal of support. The thickness is generally 1~2 m, and it is mostly composed of mudstone, sandstone, siltstone, and other rocks that are easy to collapse.
Basic roof: also known as the main roof, it is a thick and hard rock layer located on the direct roof or directly on the coal seam (there is no direct roof and false roof at this time). It often hangs above the goaf for a period of time, and cannot collapse until it reaches a considerable area. It is usually composed of hard rocks such as sandstone, conglomerate, and limestone. The UCS parameters of different lithological rock formations on the roof of the roadway are shown in
Table 1.
The test was carried out using methods commonly employed for similar materials. The prepared C20 concrete was made from ordinary grade 32.5 R cement, the C30 and C40 concrete were made from grade 42.5 R Portland cement, and C50 was made from grade 52.5 R Portland cement. The proportions of similar materials are listed in
Table 1. The maximum particle size of the stone was 15 mm.
The hard rock was poured in a rectangular wooden mold box with a size of 150 × 150 × 150 mm, with the rock strength as shown in
Figure 7. A test block of 50 × 50 × 50 mm was simultaneously prepared. Each test block was consistent with the drilling test material. Then, a uniaxial compression test was carried out using a mechanical rock-servo testing machine. The results are shown in
Table 2 (actual strength).
It can be seen from
Figure 8 that, under the same pressure from the compressed air of the air compressor, when drilling four kinds of rocks with different strengths (C20, C30, C40, and C50) using an anchor drill, the force on the bit is almost the same, but the amplitude of the force on the bit, when drilling higher-strength rocks, is greater than that when drilling lower-strength rocks.
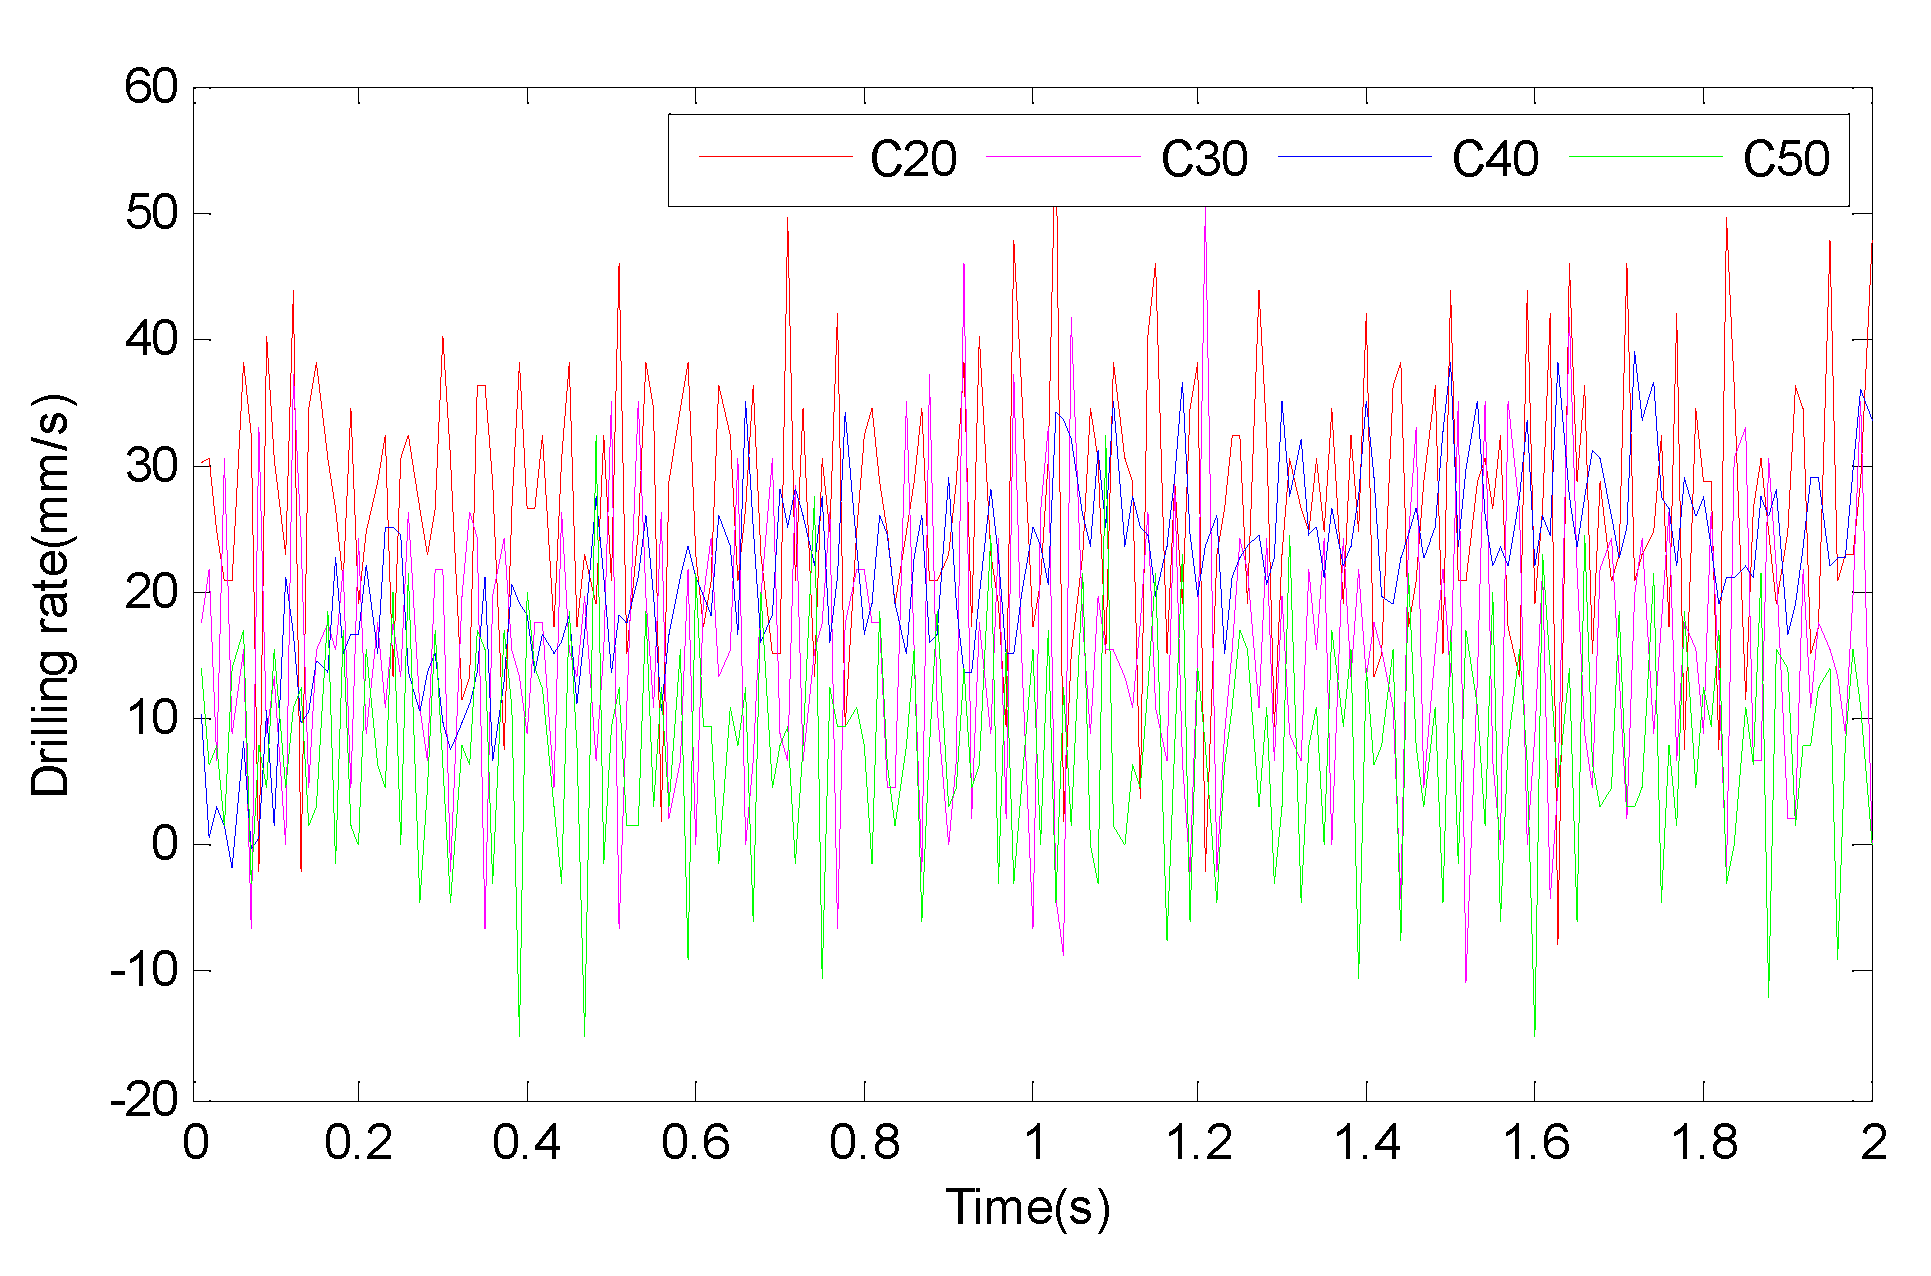
The torque and ROP values of the bit when drilling the high-strength rock and the bit when drilling the low-strength rock were very different, as shown in
Figure 9,
Figure 10, and
Figure 11. Moreover, the torque, ROP, and ROP amplitude of the rock with high bit-drilling strength were greater than those of the rock with low bit-drilling strength. In
Figure 11, we find that the drilling speed signal noise is the largest.
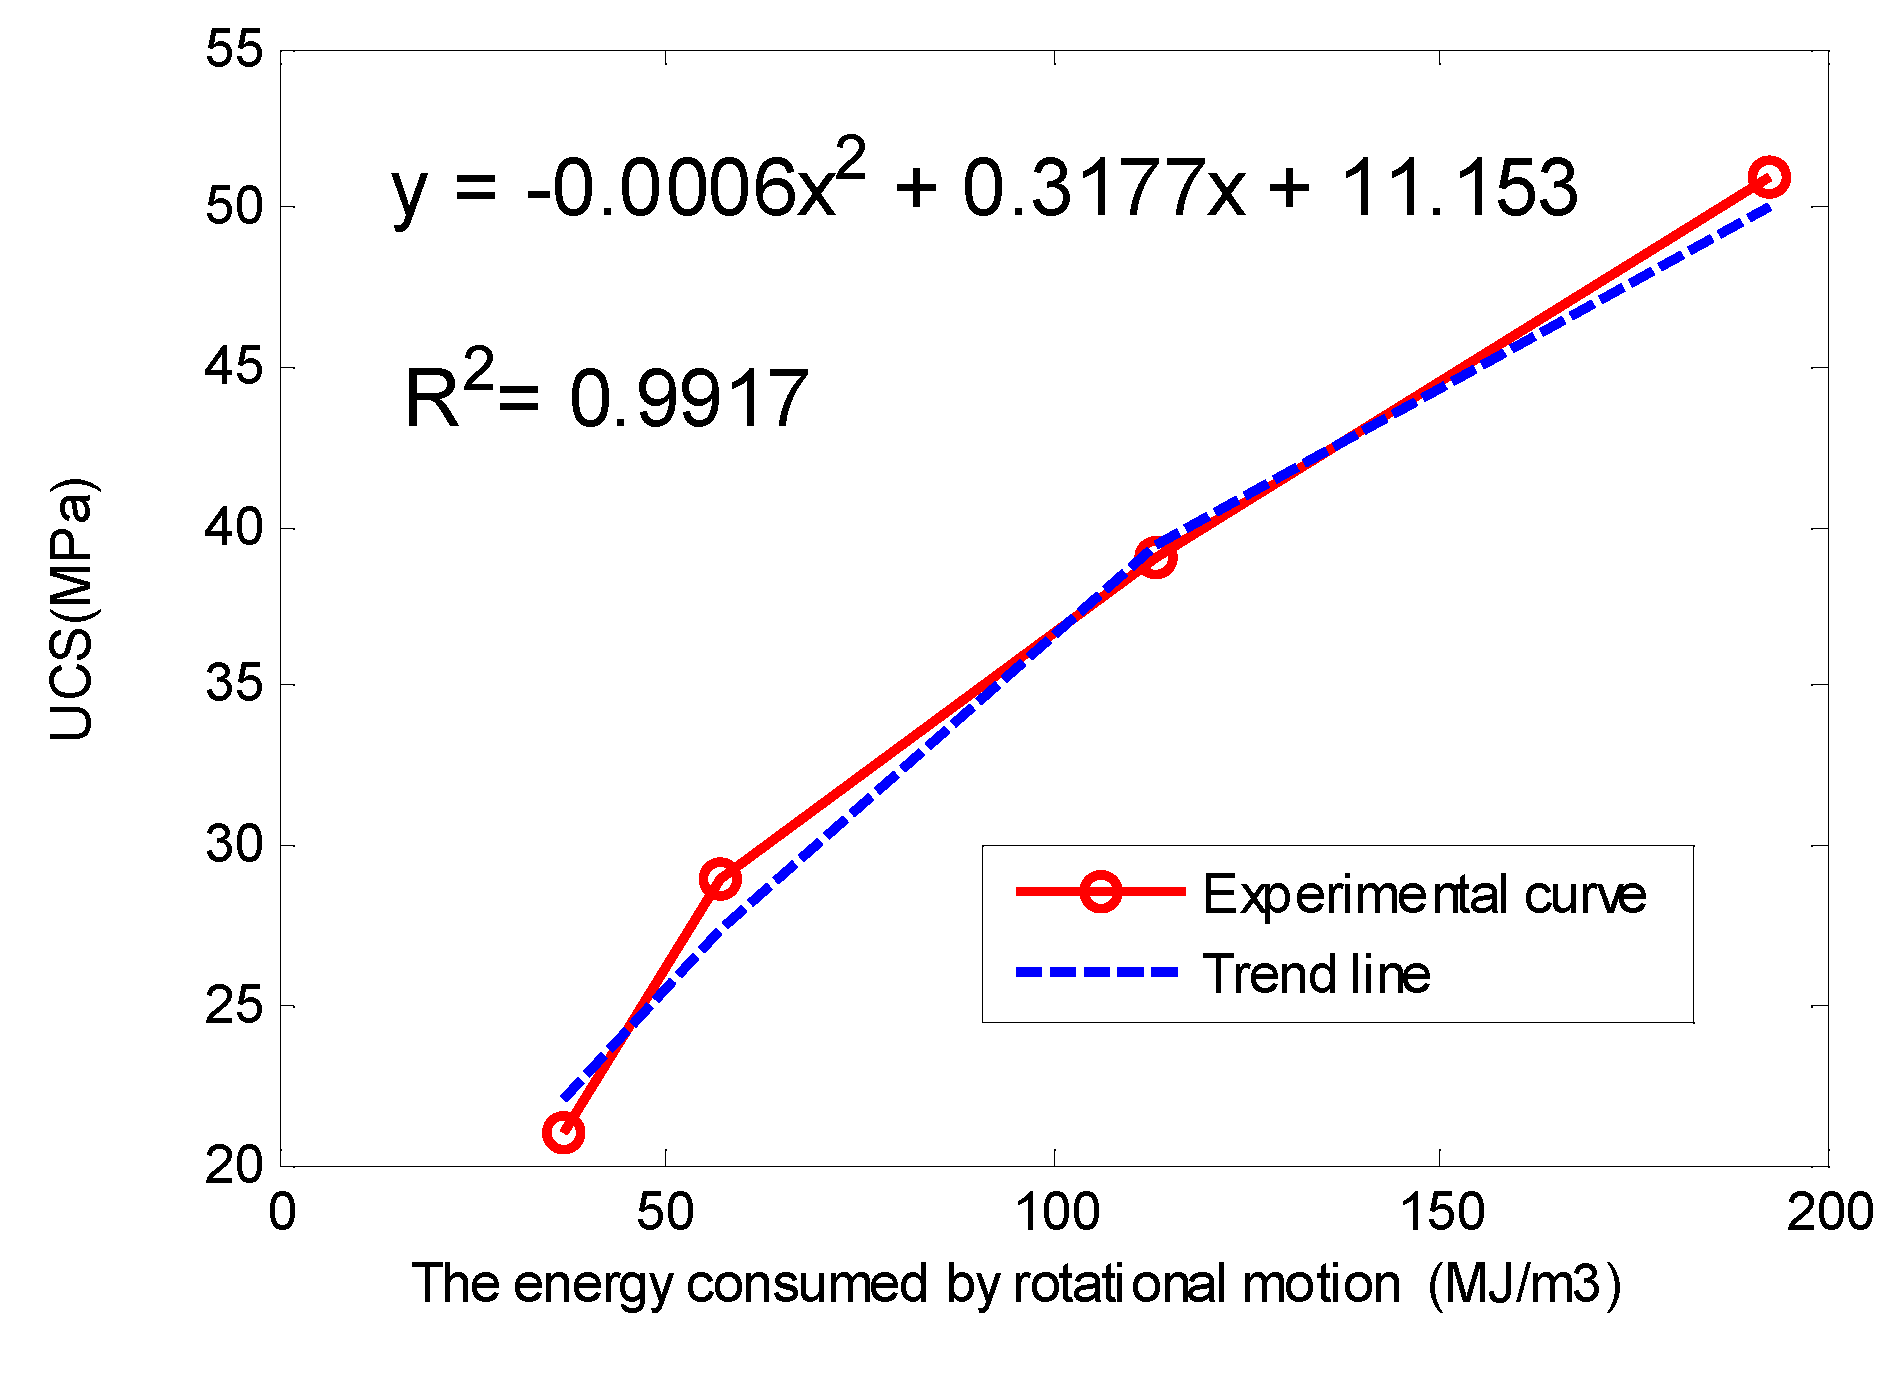
As shown in
Table 3, after calculating the average value of the force, torque, and ROP of the drill bit, when drilling rocks with four different levels of strength, and substituting these parameters into Formula (1), the specific fragmentation work of rocks with different strength levels can be calculated, as shown in
Table 4. From this table, one can clearly distinguish the rocks with higher strength from the rocks with lower strength. The relationship between UCS (Y) and energy (X) in
Table 3 is shown in
Figure 12. The best coupling formula is:
4.4. Preparation of Similar Simulated Roof Strata
Because rock is difficult to collect, the application of a simulation using similar materials was proposed. Similar-material simulations are an important element of scientific research. Such materials are made in a lab according to the similarity principle, based on a prototype model, with the help of the instrument’s mechanical parameters and their distribution inside the observation model. We used the results from studying the model to determine the prototype’s applicability and the pressure-distribution law of the rock-mass mechanical phenomenon. This process can help solve practical problems in engineering rock-mass production. This research method has the advantages of being intuitive, simple, economical, rapid, and requiring only a short experimental period. In this experiment, it was possible to study the spatial and temporal distribution and variation of rock stress, as well as the support pressure near the roadway roof, and the influence of some parameters on rock-mass pressure by fixing certain parameters, and changing others, based on the situation, which would be difficult to achieve under field conditions.
A similar simulated roof rock was prepared using Portland cement No. 52.5 (R). The maximum size of the pebbles was 15 mm, and the similar materials were arranged, as shown in
Table 5. The hard rock was poured into a rectangular wooden mold box with a size of 150 × 150 × 150 mm, as shown in
Figure 13.
The 50 × 50 × 50 mm test blocks were prepared at the same time, all of which were consistent with the drilling test materials. The UCS test was then carried out. A servo testing machine for rock mechanics was used in the experiment, and the results are shown in
Table 4.
6. Conclusions
The present research found that the maximum output power of the pneumatic motor was related to the unconfined compressive strength of different rocks and the support-leg pressure. The leg pressure of the pneumatic anchor drill did not match the output power of the pneumatic motor, which made the pneumatic motor unable to reach its maximum power point. Because the thrust of the pneumatic support leg was insufficient, the output power of the pneumatic motor could not reach its maximum, and the pressure of the hard-rock leg was less than that of the soft-rock leg.
To improve the output power of the pneumatic motor and increase the drilling speed, we applied and installed a pressure valve in the system. Through the test of the drilling speed, we found that the power of the pneumatic motor was linearly related to the drilling speed. The test demonstrated that the efficiency of the method for improving the motor power and drilling speed could be improved.
According to the theory of the unconfined compressive strength of roof rock, which can be determined by detecting the specific work of broken rock, a certain type of motor speed and torque was adopted in the pneumatic system to detect the drilling of the pneumatic bolt. A new system for identifying the strength of roadway roof rock was proposed based on the variation in the leg-cylinder force and drilling speed.
A mathematical model of the drilling power output was also derived. Using this model, the drilling machine was able to optimize the drilling speed, and the output power curve of the pneumatic motor was a parabola. The maximum value of the parabola was found to optimize the drilling speed of the drilling machine. However, the UCS values were different between different rocks, and the maximum output power of the pneumatic motor was also different.
The present study found that the maximum pneumatic motor’s output power had a relationship with the different rock UCS and leg-pressure values. The pressure of the supporting leg of the pneumatic bolt drill did not match the output power of the pneumatic motor, which was unable to reach its maximum power point. This occurred because the thrust of the pneumatic leg was insufficient for the output power of the pneumatic motor to reach its maximum. Moreover, the pressure of the drilled hard-rock leg was less than that of the drilled soft-rock leg.
To improve the output power of the pneumatic motor and the drilling speed, a booster valve was designed and installed in the system. By testing the drilling speed, we found that the power of the pneumatic motor was linearly related to the drilling speed, which demonstrated that the effectiveness of the drilling speed method could be improved by increasing the motor power.
When the air pressure is 0.5 MPa, the average power of the C40 and C60 rock is 2.3 and 1.6 kW, respectively. All power values fell to the right of the parabola center line, which indicates that the leg pressure of the pneumatic roof-bolter did not match the output power of the pneumatic motor, making the pneumatic motor unable to reach its maximum power point. When the air pressure was increased to 0.6 MPa by using the booster valve, the maximum power of the roof-bolter drilling C40 rock reached 2.5 kW, and the maximum power of the roof-bolter, when drilling C60 rock, almost reached 2.4 kW. Through this method, the drilling rates of the C40 rock and C60 rock increased by 12% and 15%, respectively, and the work efficiency was obviously improved.
Due to the limitation of experimental conditions, we use similar materials to do experiments, the properties of similar materials are relatively stable, and the results are also satisfactory. Measurement while drilling is affected by many factors, and we will consider these factors in our follow-up research.


