A Study of the Impact of Pitch Misalignment on Wind Turbine Performance

Department of Engineering, University of Perugia, Via G. Duranti 93, 06125 Perugia, Italy
Machines 2019, 7(1), 8; https://doi.org/10.3390/machines7010008
Submission received: 26 November 2018
/
Revised: 22 December 2018
/
Accepted: 10 January 2019
/
Published: 15 January 2019
Abstract
:Pitch angle control is the most common means of adjusting the torque of wind turbines. The verification of its correct function and the optimization of its control are therefore very important for improving the efficiency of wind kinetic energy conversion. On these grounds, this work is devoted to studying the impact of pitch misalignment on wind turbine power production. A test case wind farm sited onshore, featuring five multi-megawatt wind turbines, was studied. On one wind turbine on the farm, a maximum pitch imbalance between the blades of was detected; therefore, there was an intervention for recalibration. Operational data were available for assessing production improvement after the intervention. Due to the non-stationary conditions to which wind turbines are subjected, this is generally a non-trivial problem. In this work, a general method was formulated for studying this kind of problem: it is based on the study, before and after the upgrade, of the residuals between the measured power output and a reliable model of the power output itself. A careful formulation of the model is therefore crucial: in this work, an automatic feature selection algorithm based on stepwise multivariate regression was adopted, and it allows identification of the most meaningful input variables for a multivariate linear model whose target is the power of the wind turbine whose pitch has been recalibrated. This method can be useful, in general, for the study of wind turbine power upgrades, which have been recently spreading in the wind energy industry, and for the monitoring of wind turbine performances. For the test case of interest, the power of the recalibrated wind turbine is modeled as a linear function of the active and reactive power of the nearby wind turbines, and it is estimated that, after the intervention, the pitch recalibration provided a 5.5% improvement in the power production below rated power. Wind turbine practitioners, in general, should pay considerable attention to the pitch imbalance, because it increases loads and affects the residue lifetime; in particular, the results of this study indicate that severe pitch misalignment can heavily impact power production.
1. Introduction
Full-scale multi-megawatt wind turbines are nowadays a mature technology. There is a growing body of research aiming to increase wind turbine size and thus capacity factor (rated power above 7 MW), but there are still several open challenges (for example, control of mechanical loads [1,2]) preventing their industrial exploitation and management. In this transition phase toward a possible new era of wind turbine size, considerable attention is devoted to the optimization of power produced by wind turbines operating for some years (typical rated power scale of 2 MW). To this end, there are two main directions: diminishing the time of unavailability and improving the power extraction for given wind conditions. As regards the former objective, techniques for monitoring gearbox and bearing conditions have been evolving in the research and spreading in the industry, and it is estimated that the unavailability of a typical commercial full-scale wind turbine is on the order of 3% of its lifetime [3]. As regards the latter objective, three main fields of intervention primarily impact wind turbine power production: optimizing the way the wind turbine aligns to the wind direction, optimizing the way it pitches, and improving the aerodynamic properties of the blades (for example, installing vortex generator and passive flow control devices [4,5,6,7]).
Yaw alignment is a key issue affecting wind turbine performance: in [8], an estimate of the impact of yaw misalignment on full-scale wind turbine power performance was obtained on the basis of an equivalent wind speed model and a yaw error model. An average misalignment of was estimated to result in power loss on the order of 10%. This fact gives a particular boost to the research on diagnosing wind turbine yaw misalignment and optimizing yaw control. The main difficulty comes from the fact that the typical quality of wind field measurements from cup anemometers placed behind the wind turbine rotor is insufficient for a reliable yaw misalignment diagnosis. For example, one of the conclusions of [9] is that the yaw control error induced by the quality of wind vanes and cup anemometry can impact up to 5% of the power production of a wind turbine. For this reason, a considerable amount of scientific literature is devoted to employing more sophisticated anemometry techniques, such as LIDAR [10], and it is realistic to predict that this technology could become the standard in the next several years. Despite this critical point, there is some literature on yaw misalignment diagnosis for wind turbine performance improvement using SCADA data (and, therefore, cup anemometers). The method proposed in [11] is based on the analysis of the wind farm distribution of the absolute difference between the nacelle position and wind direction measured by the nacelle anemometer. If a wind turbine has an anomalous distribution with respect to the wind farm average, it is likely that there is a yaw alignment problem: in [11], real test cases are discussed, and the impact of yaw misalignment on power curve degradation can be appreciated. In [12], the problem of zero-point shifting of the yaw position was studied using SCADA data: an indicator was proposed for evaluating the power performance at each yaw angle, and it was used for the diagnosis of yaw misalignment. Also, the yawing behavior of wind turbines at the wind farm level has recently become a very important subject in the wind energy literature as regards cooperative wind turbine control [13,14,15] and wake steering. For example, in [16,17,18,19], the wake deviation in relation to yaw misalignment was studied. The first field tests of yaw control for wake steering are presented in [20]: the control was designed based on wind farm models developed at the National Renewable Energy Laboratory (NREL) in Golden, Colorado, and it includes a computational fluid dynamics (CFD) model named SOWFA (Simulator fOr Wind Farm Applications) [21,22,23,24,25] for the characterization of wakes and an engineering model named FLORIS (FLOw Redirection and Induction in Steady State) for yaw management.
There is also a considerable amount of scientific literature regarding the diagnosis of wind turbine pitch malfunctioning. Here follows a short review of some typical methods recently formulated in the literature. In [26], pitch faults were diagnosed using an adaptive neuro-fuzzy inference system with a prognostic horizon on the order of 20 days, and it was shown that the analysis of pitch alarms recorded by the SCADA system is not as effective. A similar study was conducted in [27]. In [28], pitch faults were detected based on normal behavior models of operational curves: the selected curves were power–generator speed and pitch angle–generator speed. A similar approach is proposed in [29], where Gaussian mixture model clustering and the analysis of normal performance curves are applied to model the relationship of pitch angle, rotor speed, and wind speed. In [30], a fault detection scheme for the blade pitch of wind turbines was proposed based on the unscented Kalman filter and a decorrelation approach for process and measurement noises. In [31], an interval prediction algorithm and a recursive subspace identification based on the variable forgetting factor algorithm were applied for pitch fault diagnosis.
Wind turbine pitch is also relevant to a topic that has been recently attracting some attention in the scientific literature: power curve upgrades and wind turbine retrofitting [32]. In [32], for example, the impact on power production of pitch angle optimization near the cut-in wind speed is discussed through the analysis of operational data of an operating wind farm featuring multi-megawatt wind turbines. In [33], a kernel-plus method was formulated for computing the impact of wind turbine power upgrades, and pitch angle optimization was studied artificially by synthesizing the data according to the logic of pitch angle control. One of the general lessons from [32,33,34] which inspires the present work is that precision wind turbine performance monitoring before and after a retrofitting or upgrade intervention calls for devoted data analysis techniques.
This work is devoted to studying the impact of blade pitch misalignment on the power production of a multi-megawatt wind turbine on a wind farm sited in France and owned by Renvico (www.renvicoenergy.com). The wind turbine manufacturer recalibrated the pitch of a wind turbine after an inspection detected a maximum pitch imbalance between the blades at the root on the order of . The adopted technique for imbalance detection is similar to the one proposed in [35]. This work is organized as a test case study, but it also has a methodological point of view that calls for the generalization of the proposed approach to the overall problem of precision monitoring of wind turbine performances. Operational data from the whole wind farm, before and after the pitch recalibration of the wind turbine of interest, were at our disposal. It should be noted that the primary effect of pitch imbalance is the increase in rotor loads, affecting the residue lifetime of the wind turbine; considerable attention has been devoted to this topic in the wind energy literature [36,37,38,39,40,41]. Unfortunately, load and pitch measurements were not at our disposal for this study, and, therefore, it was possible to implement a model essentially based only on power performances. Nevertheless, it should be noted that pitch imbalance detection was performed using another technique and is not the aim of this study. However, in general, it is important that the scientific and wind turbine practitioner communities become increasingly devoted to the study of wind turbine loads, because it is useful for the early detection of pitch imbalance.
Due to the non-stationary conditions to which wind turbines are subjected, the problem of computing a possible performance improvement is non-trivial and is commonly approached (as in [32,33,34,42,43]) following these steps:
- a reliable model for the power output of the wind turbine of interest is formulated;
- the residuals between measurements and model estimates are studied before and after the intervention on the wind turbine of interest.
The rationale is that, if an intervention has occurred that changes the performance of a given wind turbine, the residuals between the measurements and model estimates (where the model is constructed using the pre-intervention data) will consequently change. The simplest model that one can adopt is the so-called power-power [34], which is based on selecting a reference wind turbine and studying how the difference between the power of the target wind turbine and that of the reference wind turbine varies after the intervention on the target wind turbine. This method is intuitive and meaningful, but it has some evident shortcomings: How is the reference wind turbine selected? Is one reference wind turbine enough in order to guarantee an acceptable statistical significance?
This work is also devoted to answering these questions and to opportunely generalizing the power-power approach. Actually, an appropriate multivariate linear model for the power of the recalibrated wind turbine has been identified by means of stepwise regression [44]. It is a data-driven iterative algorithm for automatically selecting the most appropriate input variables for a multilinear regression task. Stepwise regression indicates that the power of the recalibrated wind turbine can be robustly modeled as a linear function of the active and reactive powers of some wind turbines near the one of interest. Therefore, more than one reference wind turbine can be selected, with possibly more than one variable per wind reference wind turbine.
Besides the general methodological outcome of this work, a particular result is that the pitch recalibration provided, from the time of intervention to when this study was conducted, an improvement on the order of the 5.5% of the total production below rated power.
In Section 4.1, a crosscheck of the method and the results is proposed: the same multivariate linear model was employed for studying the power production of the wind turbine of interest, but the two selected validation data sets are both pre-intervention. The expectation was that no significant difference in the behavior of the residuals between model estimates and measurements should result, and this is indeed the case.
Summarizing, the structure of the manuscript is as follows: in Section 2, the test case wind farm and the data sets used for the study are described. Section 3 is devoted to the description of the methods. The results are collected and discussed in Section 4. Section 5 is devoted to the conclusions and further directions.
2. The Test Case and the Data Set
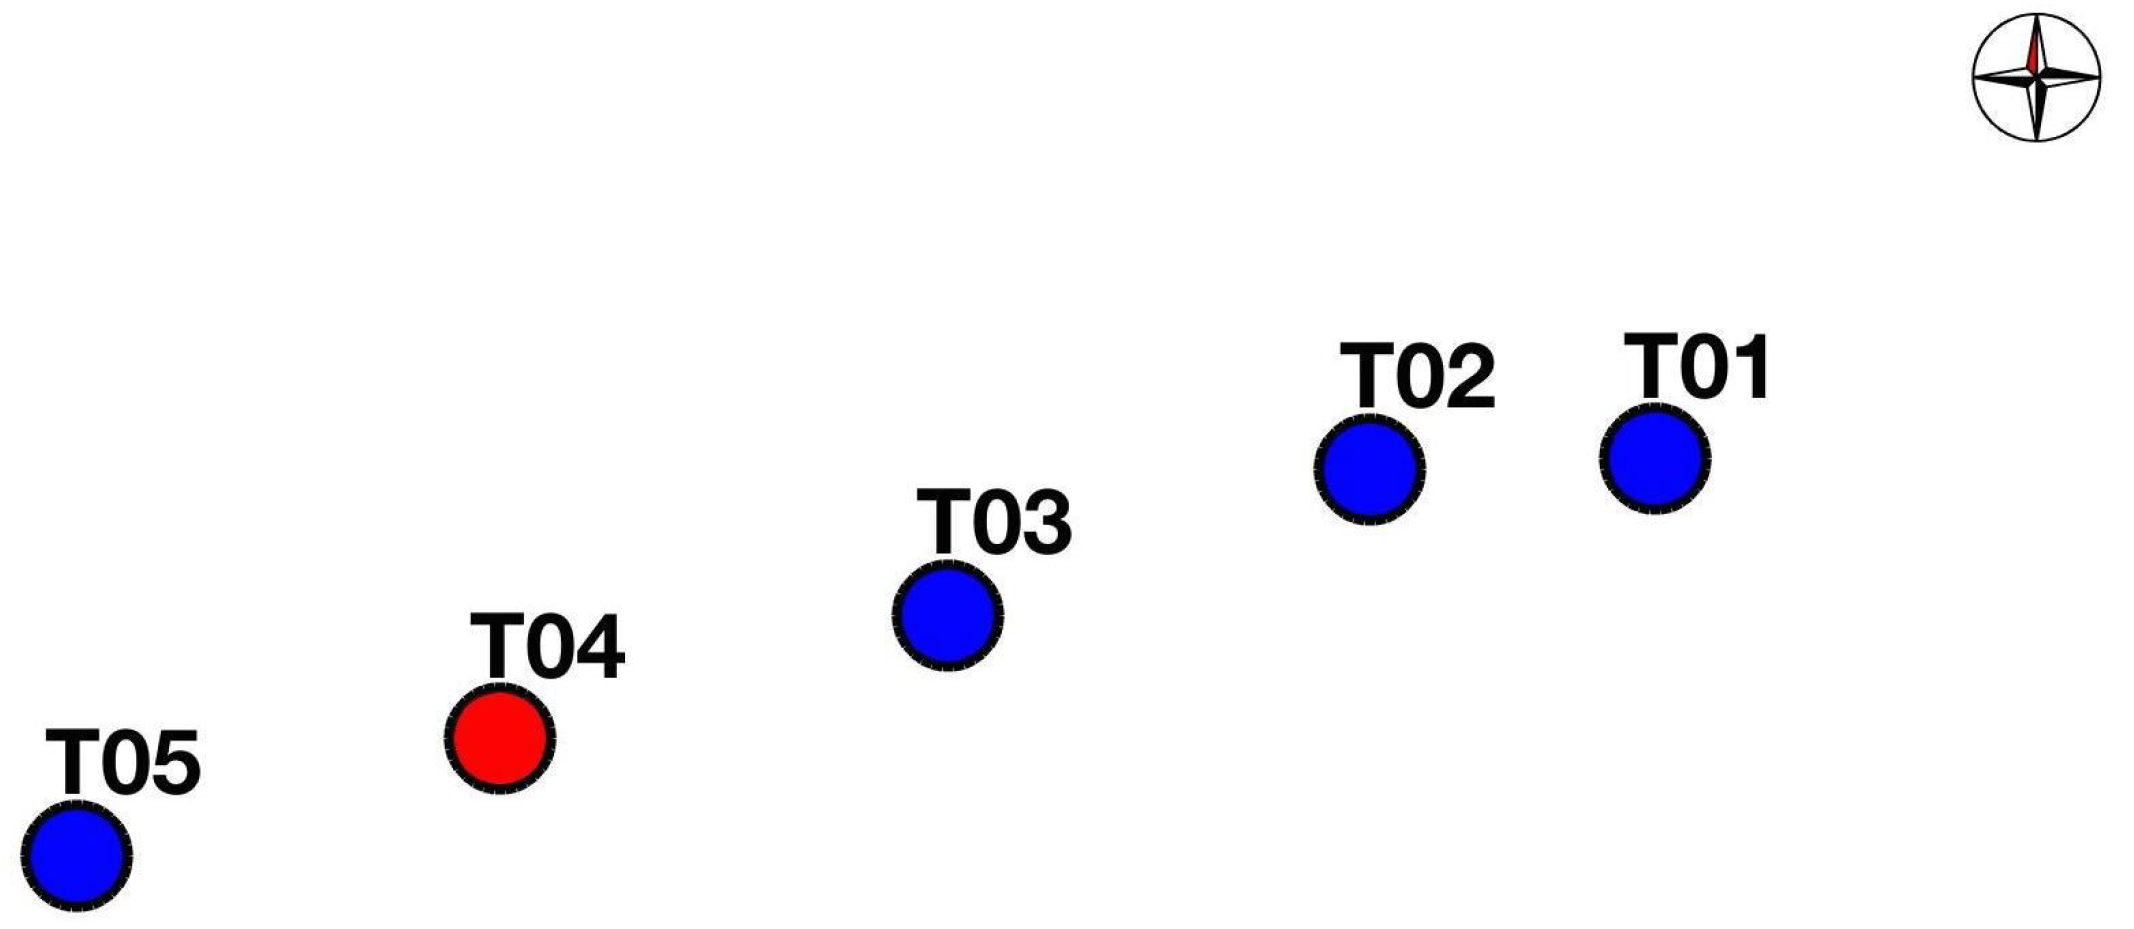
In Figure 1, the layout of the wind farm is sketched; in Table 1, the inter-turbine distances are reported. Five wind turbines, each having 2 MW of rated power, compose the wind farm, which is sited on flat terrain. The hub height is 90 m, the blade length is 44 m, the cut-in wind speed is 3 m/s, the cut-out is 21 m/s, and the rated wind speed is around 13 m/s. T04 is the wind turbine whose blade pitches were recalibrated and is indicated in red in Figure 1. Notice that the shortest distance between T04 and another wind turbine in the cluster is on the order of 8 rotor diameters: therefore, it can be said that the operation of T04 is, in general, only mildly affected by wake interactions between nearby wind turbines.
Through an inspection based on a technique similar to the one described in [35], a worrying imbalance between the pitches of the three blades was detected: the maximum imbalance between two blade pitches was at the root.
The data are organized in two sets as follows:
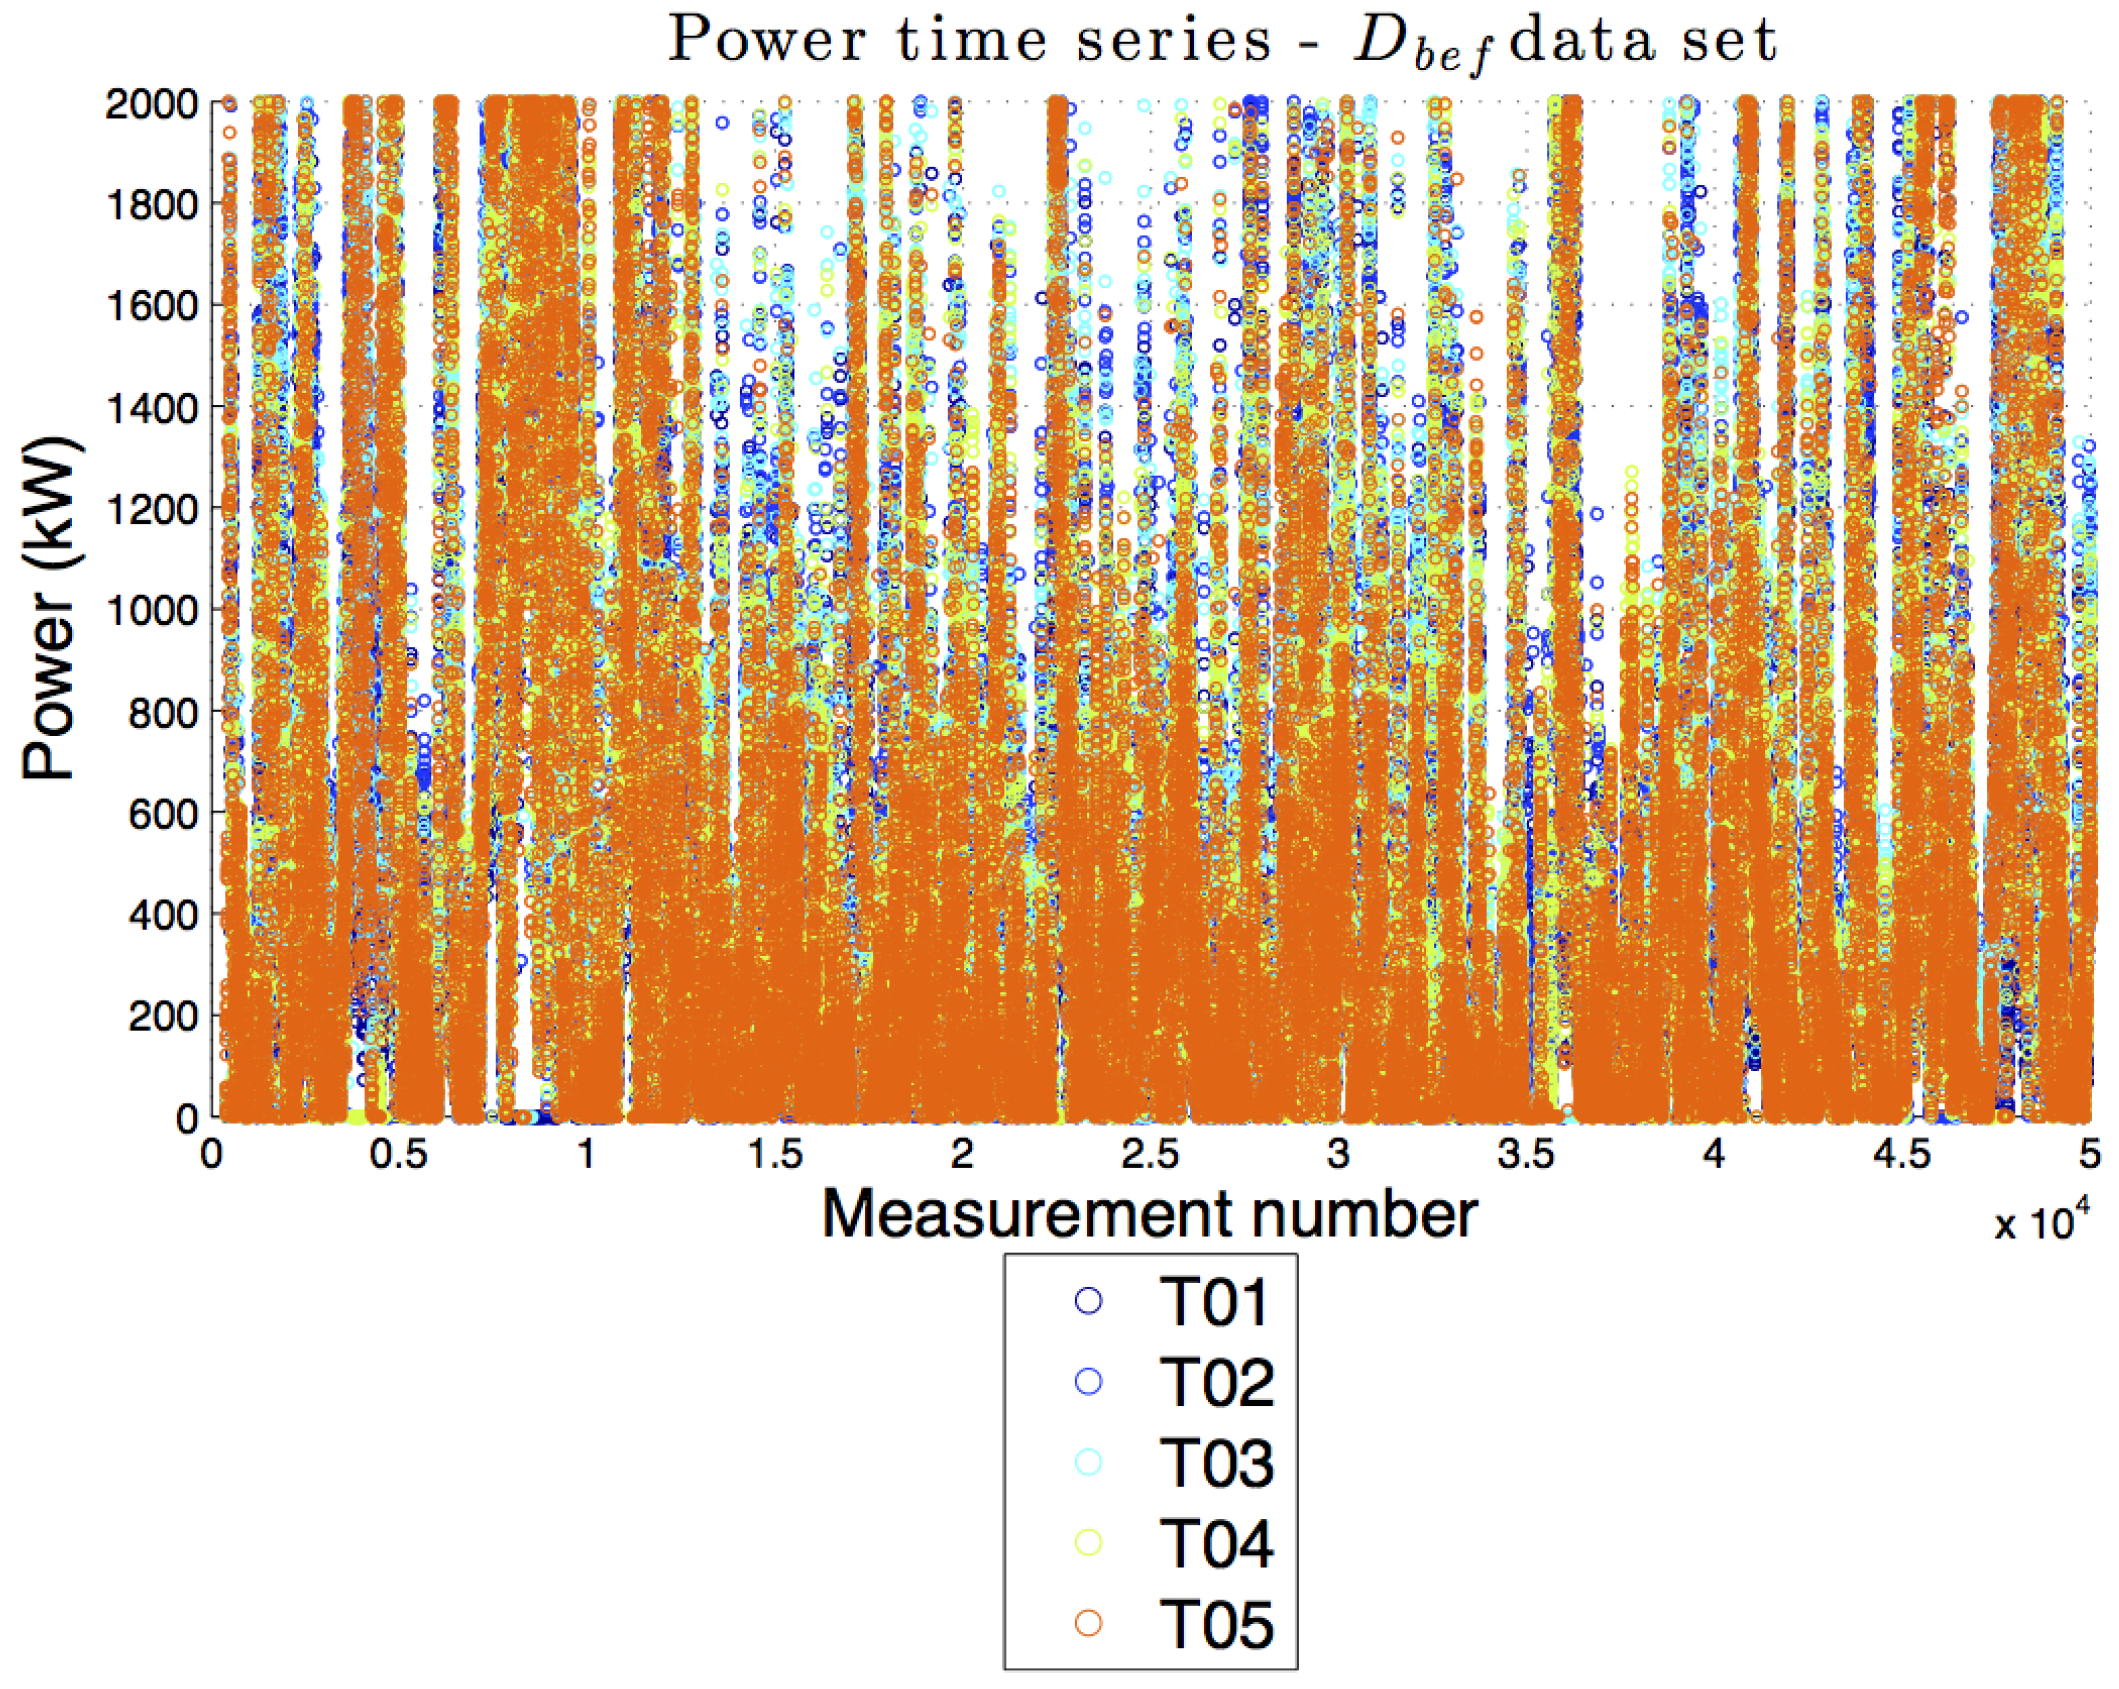
- The first data set is denoted as and contains the data collected from 1st January 2017 to 1st March 2018. It is a period prior to the intervention on turbine T04.
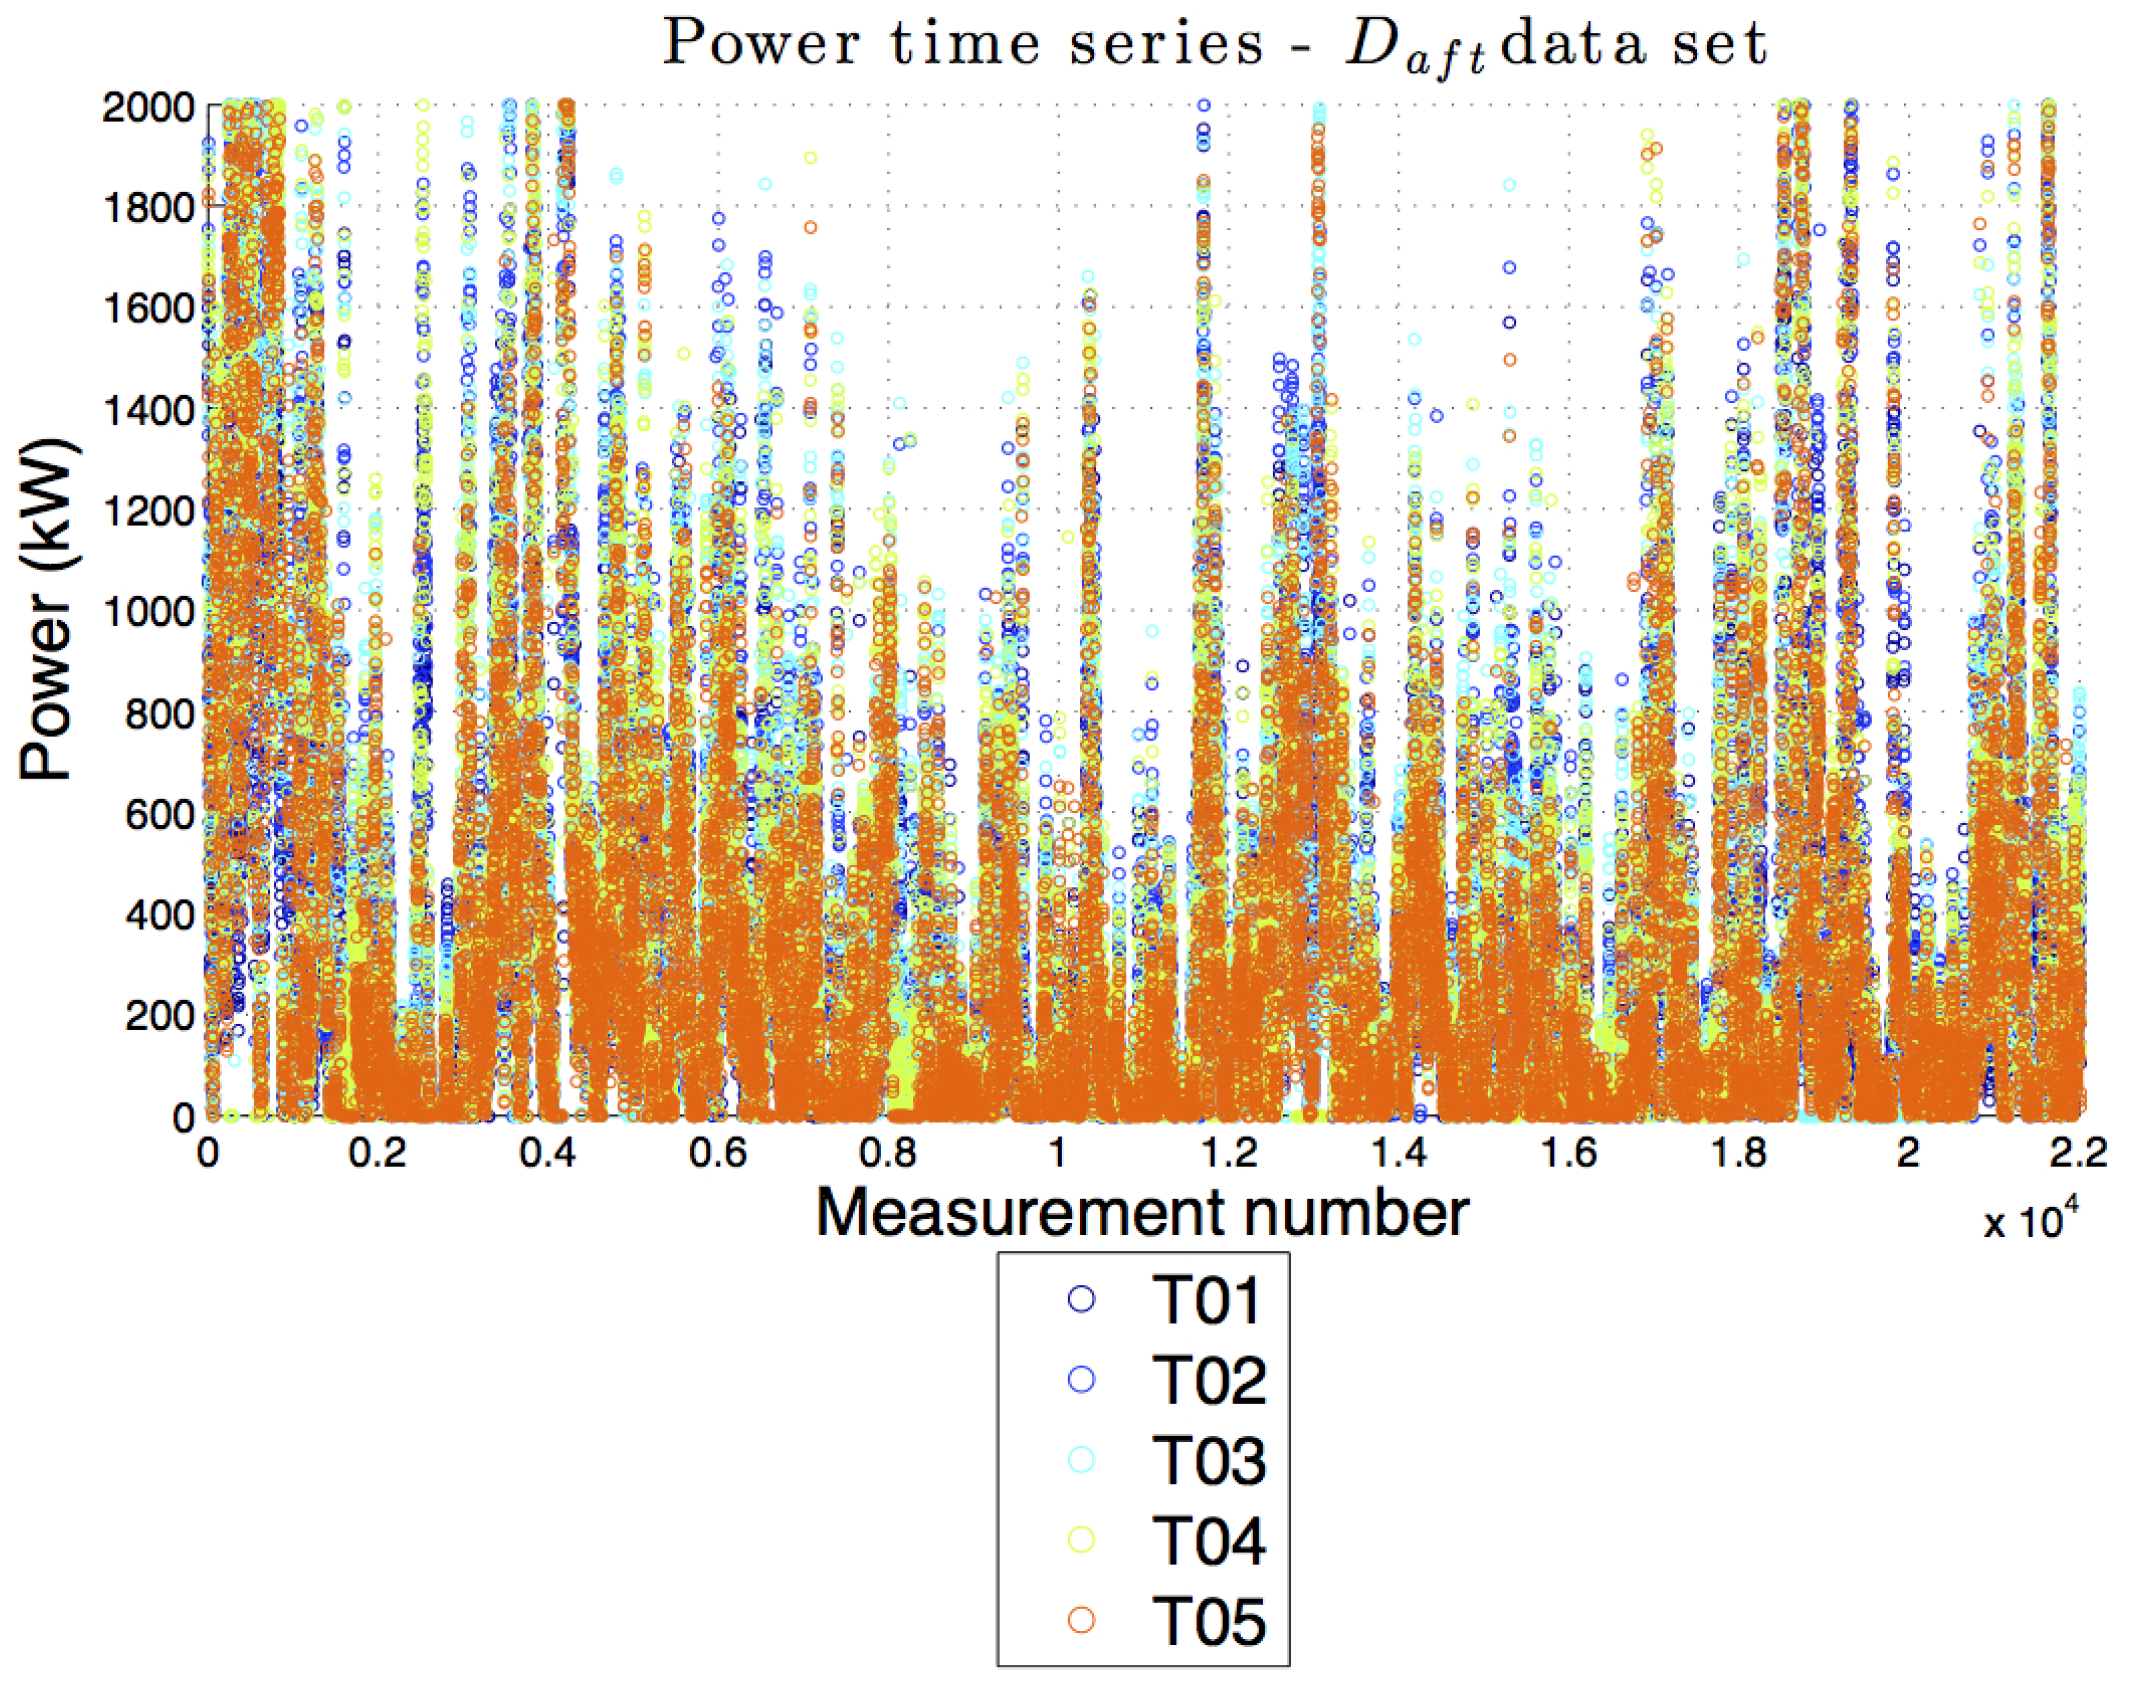
- The second data set is denoted as and contains the data collected from 1st April 2018 to 1st September 2018. It is a period after the intervention on turbine T04.
It should be noted that on a day between and , a subsequent inspection was carried out using the technique from [35], and it was determined that the pitch imbalances had returned to below the recommended thresholds.
The data have 10 minutes of sampling time, and the available validated measurements are active and reactive power [45] from all the wind turbines on the wind farm. The reactive power in wind turbine control is typically regulated by providing a specific reactive power value or a specific power factor for voltage control at the wind farm’s connection point to the system.
3. The Methods
With the given data sets, which are composed of the active and reactive power from all the wind turbines on the wind farm, it is impossible to study the operational curves before and after the pitch recalibration. Therefore, the assessment of the impact on power production of the pitch recalibration must be conducted by studying how the relative performances between the target recalibrated wind turbine and one or more reference wind turbines change.
The conditions for data preprocessing are that all the wind turbines are producing output greater than zero and that the power of T04 is below rated. This second condition is required because the power does not upgrade when it is already rated.
The objective of the model is, therefore, to estimate the power output of T04 below rated power, denoted as y in the following. The model for estimating y is multivariate linear, and its input variables were selected based on their statistical significance through a stepwise regression algorithm [44]. Starting from an initial model, at each step iteration of the algorithm, a potential input variable is added to or removed from the model. The decision to keep or exclude it is taken by calculating the p-value of the F-statistic (according to the Fisher–Snedecor distribution) of the hypothesis test for whether the corresponding coefficient in the regression is equal to zero or not. The input variables, whose probability of not having non-vanishing coefficients in the linear model is less then a specified threshold of the p-value, are selected for the linear regression. The threshold of the p-value is denoted as . The physical meaning of is therefore the following: selecting high values of , one typically obtains more precise models at the cost of enlarging the number of inputs. Furthermore, since input variables can have a non-vanishing probability of not being significant, it is possible that the model error varies when it is validated on different data sets. If selecting low values of instead, then stricter models are selected, and the input variables are strongly linearly correlated with the output. It is possible that higher mean errors are obtained and that the performances of the model are quite stable when the validation data set varies. Therefore, it is important to assess the model’s behavior when varying with an eye on the mean errors and an eye on the stability of the results. To this end, a parametric study varying was conducted: the tested values were , with . For each value of , the input selection and estimation procedure was subjected J times to K-fold cross-validation [46]. In particular, the data set was divided J times randomly into two fractions: of the data were used for training, and the remaining were used for validation. K was selected to be 10 for this study, because the objective is having a robust model and, therefore, short validation folds (10% of the given data) were selected. The number of repetitions of the validation (J) was set to 300 in order to guarantee the statistical significance of the study.
Given a value for , for each runs of the cross-validation, the most significant inputs were selected and the estimated power of T04 was modeled via linear regression. The performance of the linear model for a given value of was estimated in terms of the mean absolute error, averaged over the folds, given by
where is the measured power of T04 for the validation subset of that run. The stability is quantified as the percentage of times the stepwise regression algorithm provides the same most frequent input variable selection, and thus the same model structure, for a given value of .
In Table 2, is approximated to the digit corresponding to the order of the standard deviation of among J repetitions for a given (≃1 kW). From Table 2, it is apparent that, whether selecting a looser (lower ) or a more robust (higher ) model, the average error does not change remarkably. Instead, the number of possible selected regressors varies with , and for whatever , the number of selected regressors in the majority of the J runs is always 5 and is the same. Furthermore, the stability increases when decreases, and this means that the model is also selected when requiring robust output from the stepwise regression algorithm. The selected input variables for the model are:
- the active power of T01;
- the active power of T02;
- the active power of T03;
- the active power of T05;
- the reactive power of T01.
Therefore, the power output of T04 was modeled as a function of the five above inputs. This choice assures the statistical significance and stability of the model. Furthermore, one important lesson from the above analysis is that at least five variables are needed for linearly modeling the power of T04 in a robust way. This sheds light on the fact that the power-power approach (discussed, for example, in [34]), although commonly employed by wind turbine practitioners for similar problems, does not guarantee adequate solidity of the results.
The estimation model was finally constructed as follows: training measurements were normalized and organized in a matrix . The pseudo-inverse of was used to compute the weight matrix of the linear regression model as:
Finally, the estimated output (the power of T04) of a given validation data set was computed as a linear combination of the input at test time, weighted using the model weight matrix :
4. The Results
The data sets were employed as follows:
- was randomly divided in two subsets: D0 ( of the data set) and D1 ( of the data set). D0 was used for training the model and constructing the weight matrix , and D1 was used for validating the model.
- (also named D2 for simplifying the notation in the following) was used to quantify the performance improvement.
The objective of the analysis is to study the residuals R between the measurements y and the model estimations as a function of the inputs (the ones indicated previously in Section 3) using two data sets: a pre-intervention one (D1) and a post-intervention one (D2). If the intervention has significantly impacted the power production, the statistical features of the residuals R computed from the post-intervention data, using the model constructed from the pre-intervention data, will change.
Therefore, consider Equation (4), with .
For , one has
Since the measured y and estimated powers all have the same time basis (10 minutes), the quantity
is a percentage estimate of the energy improvement.
In order to increase the statistical significance of the results, the above procedure can be repeated by varying the random selection of the training data set D0 (consequently, the pre-intervention validation data set D1 will also change). In principle, one could also select a random subset of D2 for each run of the model, but for this work, the decision was to keep all of D2 as the post-intervention validation data set, because it is shorter than the pre-intervention data sets. The above procedure was repeated until the standard deviation of the computations of was basically stable.
In Table 3, statistics are reported for the discrepancy between estimations and measurements for the different choices of the D0 and D1 data sets: average residual between measurements and estimations (), average mean absolute error (), and average standard deviation of the residuals ().
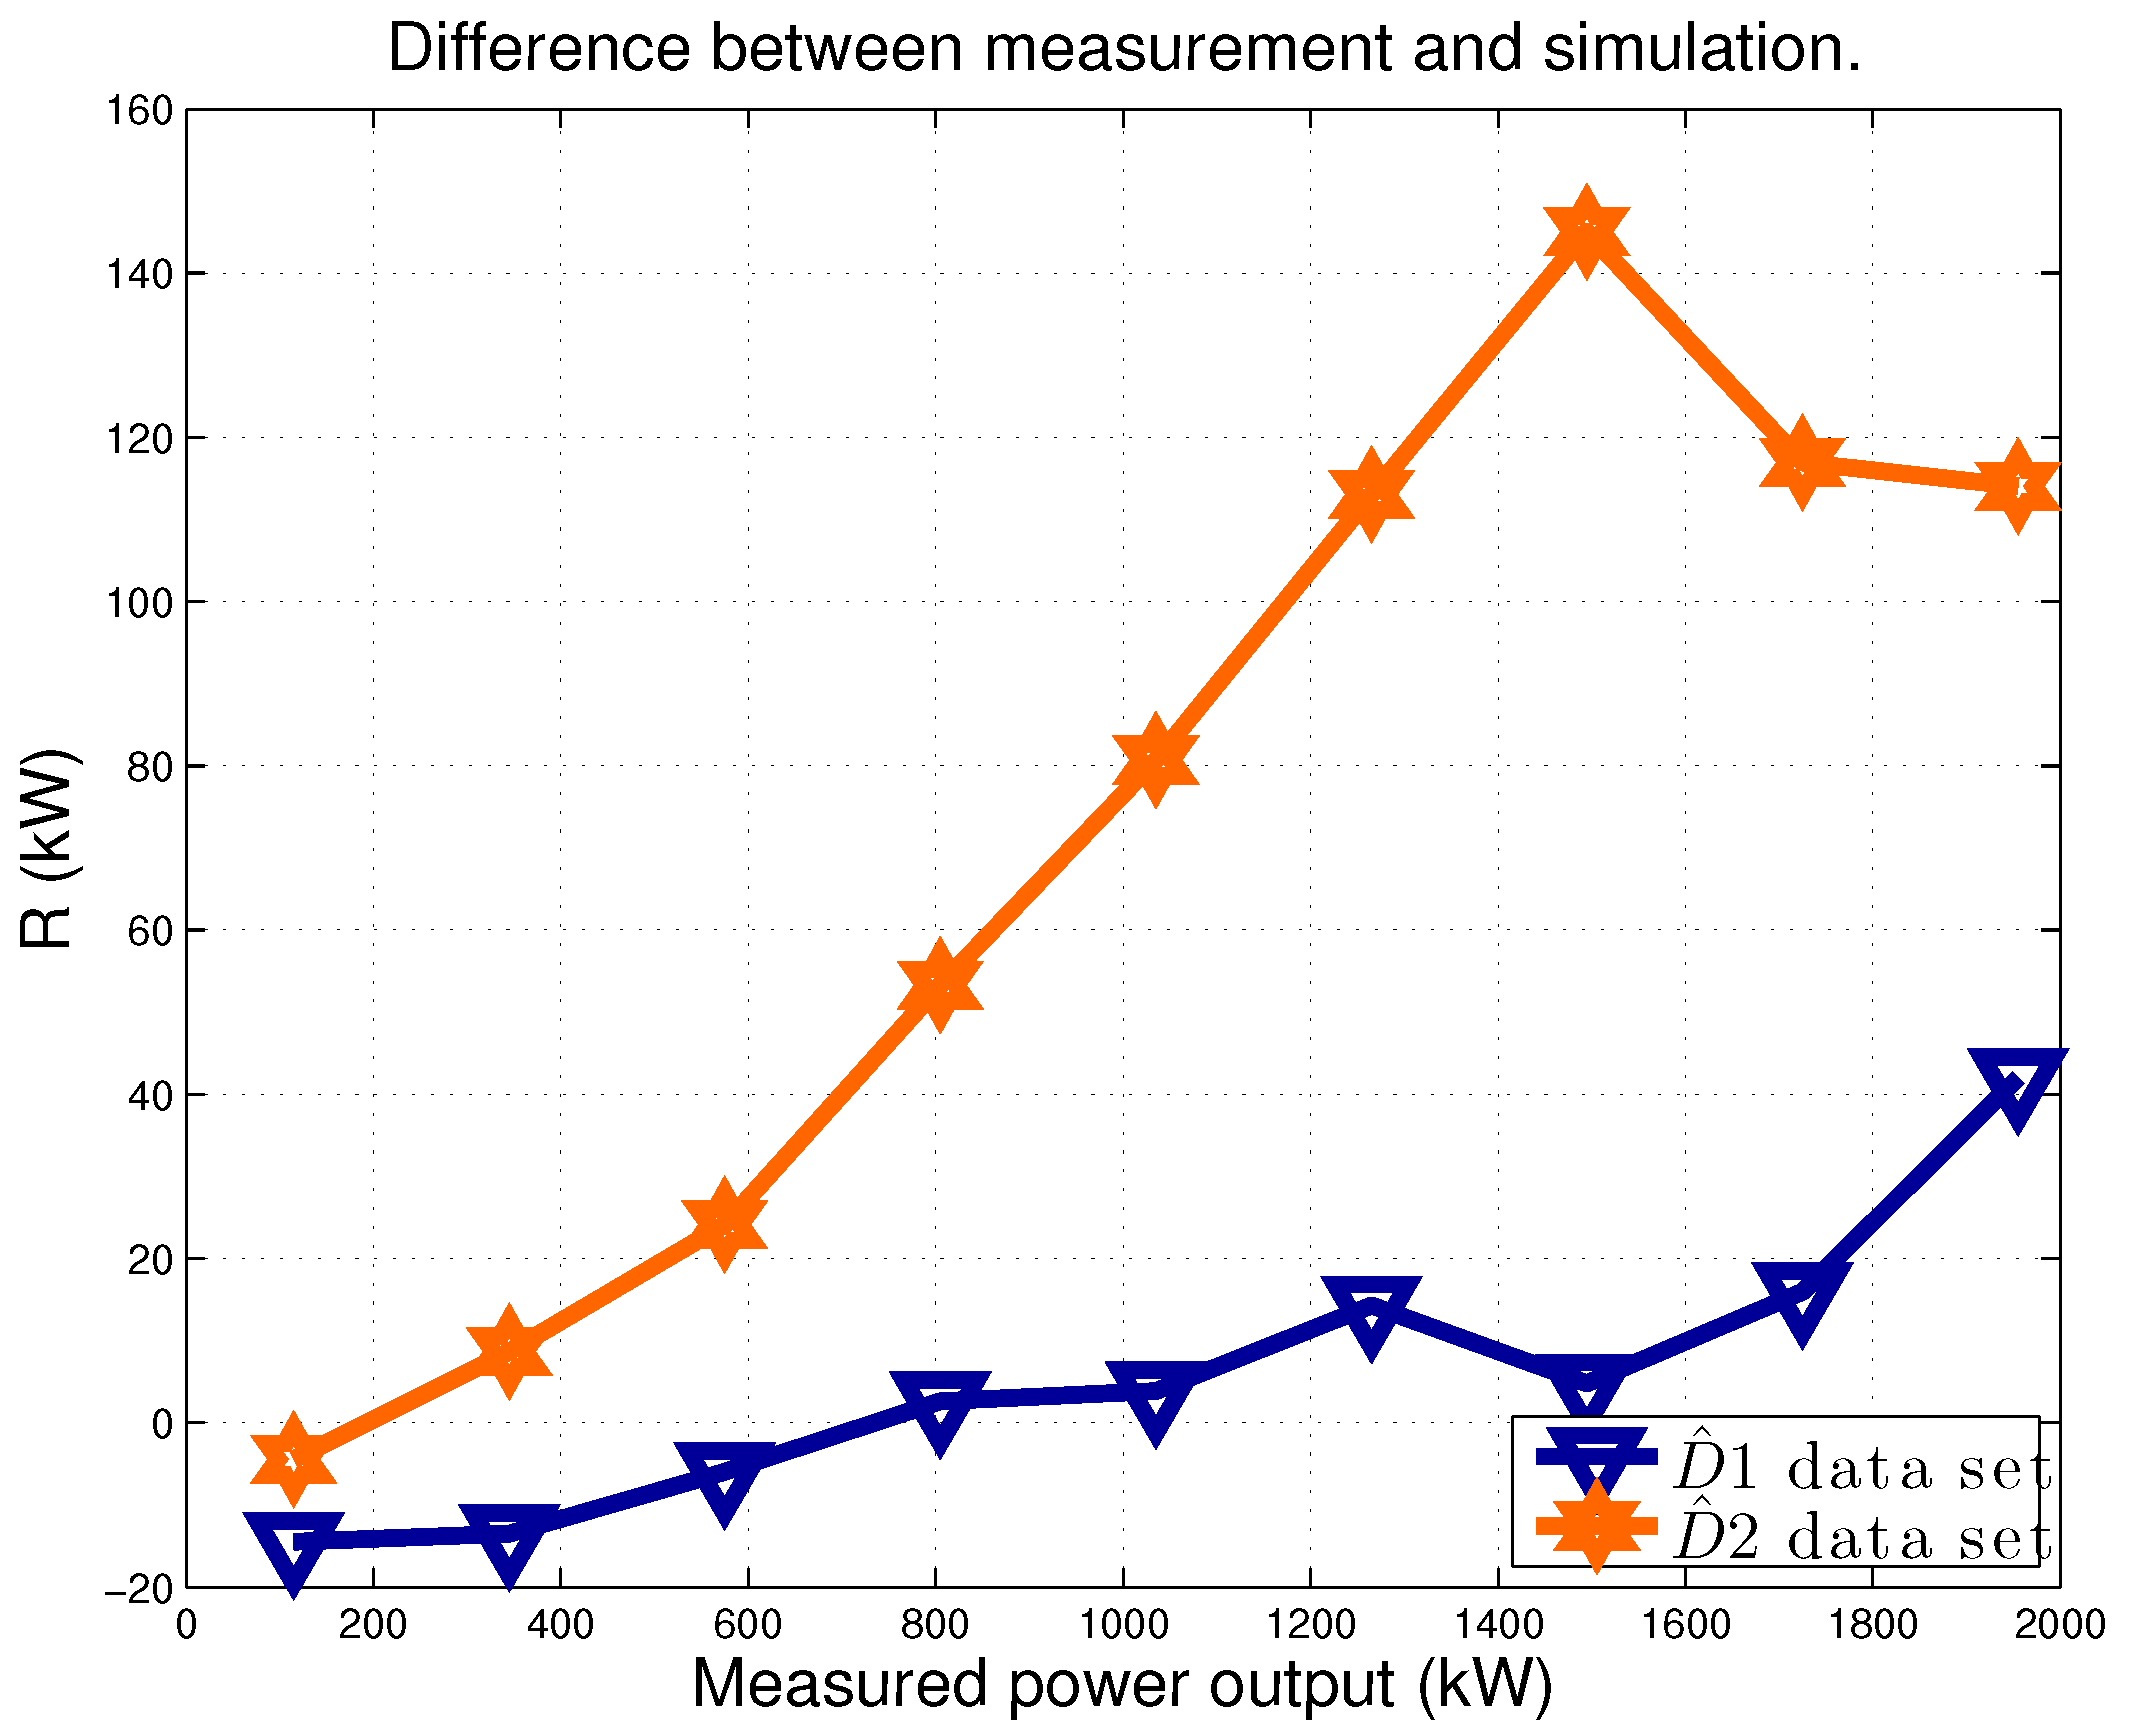
From Table 3, the average discrepancy between estimation and measurement is negligible for the D1 data set after training the model with the data sets D0 (because these data sets are both pre-intervention); the measurements instead are, on average, 35 kW higher in the post-intervention data set D2 with respect to the estimate provided by the model trained with pre-intervention data. This indicates clearly that the pitch recalibration provided a production improvement.
The improvement is appreciable also from Figure 4, which is a plot of and on a sample model run. The data are averaged in power production intervals, whose amplitude is 10% of the rated. From this plot, the variation in the residuals after the intervention is evident: the difference between measurement and estimation increases in the post-intervention period, especially approaching rated power, and this is consistent because the effect of pitch angle control is higher near rated power.
The described procedure, based on the bootstrap technique of the repeated random selections of D0 and D1, enables artificial repeatability of the experiment, and this strengthens the statistical significance of the results; basically, it is possible to not only have an average estimation of the production improvement but also a standard deviation (and, therefore, reasonable lower and upper limits). The average energy improvement is . In other words, since the upgrade was installed, the below rated power produced by T04 has been higher than without pitch recalibration. The standard deviation is computed as . Therefore, reasonable upper and lower limits of the energy improvement are and .
4.1. A Crosscheck of the Results
The idea underlying the following crosscheck of the results considers the wind turbine of interest and applies the same model to data sets that both belong to pre-intervention periods. The reasonable expectation is that, since the model is validated with two different pre-intervention data sets, no significant difference in the behavior of the residuals between model estimates and measurements should occur. A similar result would further support the robustness of the results in Section 4.
The data sets have been organized as follows:
- The first dataset is denoted as and contains the data collected from 1st January 2017 to 1st January 2018. It is a period prior to the intervention on turbine T04.
- The second dataset is denoted as and contains the data collected from 1st January 2018 to 1st March 2018. This data set is also from a period before the intervention on turbine T04.
Subsequently, as in Section 4:
- is randomly divided in two subsets: ( of the data set) and ( of the data set). is used for training the model and constructing the weight matrix , and is used for validating the model.
- (also named for simplifying the notation in the following) is used for evaluating whether there is a remarkable performance difference with respect to .
The same kind of model and thus the same input variables were used. The results are collected in Table 4, analogous to the corresponding Table 3.
From the results in Table 4, the mean difference between model estimates and measurements is practically zero for data sets and on the order of few kilowatts for the data set .
Figure 5, similar to Figure 4, is a plot of and on a sample model run. The data are averaged in power production intervals, whose amplitude is 10% of the rated. From Figure 5, the average residuals and as a function of the power are almost identical with respect to each other, contrary to Figure 4.
Applying Equations (5) and (6), it is estimated that . This estimate for is on the order of 10% of the estimate obtained when the second validation data set is post-intervention.
This test demonstrates the good estimation capabilities of the proposed approach and the consistency of the results: furthermore, the estimate of indirectly provides a reasonable order of magnitude of the precision of the results on the power production improvement of T04 after pitch recalibration.
5. Conclusions
This work was devoted to the study of the impact of pitch misalignment on the power production of full-scale wind turbines. The manuscript is organized as a test case discussion, but the conclusions and the methodological outcomes are general. The test case was the following: the wind farm of interest consists of five wind turbines sited on flat terrain, each having 2 MW of rated power. Some months ago, the wind turbine manufacturer requested an inspection through a technique similar to the one in [35], and a pitch misalignment was detected: the maximum discrepancy between the pitch angles of the three blades at the root was on the order of . Consequently, an intervention on the wind turbine of interest was performed for the removal of this offset; therefore, the objective of this work was the precision computation of whether the intervention was effective in terms of improved production.
Since wind turbines operate under non-stationary conditions, it does not make sense to compare the power productions before and after any type of intervention on a wind turbine. Furthermore, a power curve analysis might not provide meaningful insight when the employed data sets are not considerably big, because the power output has a multivariate dependence on atmospheric conditions that cannot be accounted for using the SCADA systems available commonly in the industry. The most appropriate approach, therefore, is formulating a reliable model for the power of the wind turbine of interest. If the model is trained with pre-intervention data, a production difference can be detected as a change in the behavior of the residuals between model estimates and measurements when the model is validated using two different data sets (one pre-intervention and one post-intervention).
In this work, therefore, particular attention was devoted to a judicious selection and validation of the model for the power of the recalibrated wind turbine. The selected method is completely general and can be applied to similar problems of any type. Using a stepwise regression algorithm, the most statistically meaningful input variables were selected for a multivariate linear model targeting the power of the wind turbine of interest. For the test case in the study, the validated data at our disposal for use as input variables to the model were the active and reactive powers of the other wind turbines on the farm.
An interesting lesson from the case study is that, even if the wind farm is sited on gentle terrain, five input variables (four active powers of nearby wind turbines and one reactive power) are needed for constructing a robust linear model of the power of the recalibrated wind turbine. Therefore, the power-power approach (based on the study of the difference between the power of a target and a reference wind turbine), commonly employed by wind turbine practitioners for this kind of problem, is likely not robust enough for precision control and monitoring of wind turbine performances.
The outcome of this analysis using the selected test case is that, since the pitch was recalibrated, the wind turbine of interest improved its power production below rated power by . Furthermore, the method was crosschecked by validating it using two pre-intervention data sets, and this allows a reasonable scale to be set for the precision of the results.
On the grounds of this analysis, therefore, wind turbine practitioners are warmly encouraged to crosscheck the calibration of the blade pitches of their wind turbines, because an offset of some degrees can have a remarkable impact on the quality of power production, and an offset on the order of can increase rotor loads in such a way that jeopardizes the expected lifetime of the wind turbine.
Further directions of this study include extending the range of case studies for this particular problem (pitch recalibration assessment) and, possibly, if the necessary data are available, extending the analysis to the detection of the pitch imbalance by monitoring load measurements. It would also be interesting to interface the performance monitoring method of this work to the pitch misalignment detection technique recently proposed in [47]. A general further direction is extending the application of the methodology proposed in this work to other kinds of problems. The adoption of aerodynamic and control system wind turbine power curve upgrades has been spreading in recent years in the industry, and they represent an ideal field of application for the methods detailed in this work.
Funding
This research received no external funding.
Acknowledgments
The author thanks Ludovico Terzi, technology manager of Renvico, for providing the data sets employed in this work.
Conflicts of Interest
The author declares no conflict of interest.
References
- Hoffmann, A. Load reduction based on a stochastic disturbance observer for a 5 MW IPC wind turbine. J. Phys. Conf. Ser. 2018, 1037, 032026. [Google Scholar] [CrossRef]
- Menezes, E.J.N.; Araújo, A.M.; Rohatgi, J.S.; del Foyo, P.M.G. Active load control of large wind turbines using state-space methods and disturbance accommodating control. Energy 2018, 150, 310–319. [Google Scholar] [CrossRef]
- Tchakoua, P.; Wamkeue, R.; Ouhrouche, M.; Slaoui-Hasnaoui, F.; Tameghe, T.A.; Ekemb, G. Wind turbine condition monitoring: State-of-the-art review, new trends, and future challenges. Energies 2014, 7, 2595–2630. [Google Scholar] [CrossRef]
- Barlas, T.K.; Van Kuik, G. Review of state of the art in smart rotor control research for wind turbines. Prog. Aerosp. Sci. 2010, 46, 1–27. [Google Scholar] [CrossRef]
- Tsai, K.C.; Pan, C.T.; Cooperman, A.M.; Johnson, S.J.; Van Dam, C. An innovative design of a microtab deployment mechanism for active aerodynamic load control. Energies 2015, 8, 5885–5897. [Google Scholar] [CrossRef]
- Fernández-Gámiz, U.; Marika Velte, C.; Réthoré, P.E.; Sørensen, N.N.; Egusquiza, E. Testing of self-similarity and helical symmetry in vortex generator flow simulations. Wind Energy 2016, 19, 1043–1052. [Google Scholar] [CrossRef]
- Aramendia, I.; Fernandez-Gamiz, U.; Ramos-Hernanz, J.A.; Sancho, J.; Lopez-Guede, J.M.; Zulueta, E. Flow Control Devices for Wind Turbines. In Energy Harvesting and Energy Efficiency; Springer: Berlin, Germany, 2017; pp. 629–655. [Google Scholar]
- Wan, S.; Cheng, L.; Sheng, X. Effects of yaw error on wind turbine running characteristics based on the equivalent wind speed model. Energies 2015, 8, 6286–6301. [Google Scholar] [CrossRef]
- Cortina, G.; Sharma, V.; Calaf, M. Investigation of the incoming wind vector for improved wind turbine yaw-adjustment under different atmospheric and wind farm conditions. Renew. Energy 2017, 101, 376–386. [Google Scholar] [CrossRef]
- Fleming, P.; Scholbrock, A.; Jehu, A.; Davoust, S.; Osler, E.; Wright, A.D.; Clifton, A. Field-test results using a nacelle-mounted lidar for improving wind turbine power capture by reducing yaw misalignment. J. Phys. Conf. Ser. 2014, 524, 012002. [Google Scholar] [CrossRef] [Green Version]
- Astolfi, D.; Castellani, F.; Scappaticci, L.; Terzi, L. Diagnosis of wind turbine misalignment through SCADA data. Diagnostyka 2017, 18, 17–24. [Google Scholar]
- Pei, Y.; Qian, Z.; Jing, B.; Kang, D.; Zhang, L. Data-Driven Method for Wind Turbine Yaw Angle Sensor Zero-Point Shifting Fault Detection. Energies 2018, 11, 553. [Google Scholar] [CrossRef]
- Park, J.; Law, K.H. Cooperative wind turbine control for maximizing wind farm power using sequential convex programming. Energy Convers. Manag. 2015, 101, 295–316. [Google Scholar] [CrossRef]
- Park, J.; Law, K.H. A data-driven, cooperative wind farm control to maximize the total power production. Appl. Energy 2016, 165, 151–165. [Google Scholar] [CrossRef]
- Wang, F.; Garcia-Sanz, M. Wind farm cooperative control for optimal power generation. Wind Eng. 2018. [Google Scholar] [CrossRef]
- Schottler, J.; Hölling, A.; Peinke, J.; Hölling, M. Wind tunnel tests on controllable model wind turbines in yaw. In Proceedings of the 34th Wind Energy Symposium, San Diego, CA, USA, 4 January 2016; p. 1523. [Google Scholar]
- Trujillo, J.J.; Seifert, J.K.; Würth, I.; Schlipf, D.; Kühn, M. Full-field assessment of wind turbine near-wake deviation in relation to yaw misalignment. Wind Energy Sci. 2016, 1, 41–53. [Google Scholar] [CrossRef] [Green Version]
- Schottler, J.; Bartl, J.; Mühle, F.; Sætran, L.; Peinke, J.; Hölling, M. Wind tunnel experiments on wind turbine wakes in yaw: Redefining the wake width. Wind Energy Sci. 2018, 3, 257. [Google Scholar] [CrossRef]
- Bromm, M.; Rott, A.; Beck, H.; Vollmer, L.; Steinfeld, G.; Kühn, M. Field investigation on the influence of yaw misalignment on the propagation of wind turbine wakes. Wind Energy 2018, 21, 1011–1028. [Google Scholar] [CrossRef]
- Fleming, P.; Annoni, J.; Shah, J.J.; Wang, L.; Ananthan, S.; Zhang, Z.; Hutchings, K.; Wang, P.; Chen, W.; Chen, L. Field test of wake steering at an offshore wind farm. Wind Energy Sci. 2017, 2, 229–239. [Google Scholar] [CrossRef] [Green Version]
- Fleming, P.A.; Gebraad, P.M.; Lee, S.; van Wingerden, J.W.; Johnson, K.; Churchfield, M.; Michalakes, J.; Spalart, P.; Moriarty, P. Evaluating techniques for redirecting turbine wakes using SOWFA. Renew. Energy 2014, 70, 211–218. [Google Scholar] [CrossRef]
- Fleming, P.A.; Ning, A.; Gebraad, P.M.; Dykes, K. Wind plant system engineering through optimization of layout and yaw control. Wind Energy 2016, 19, 329–344. [Google Scholar] [CrossRef]
- Fleming, P.; Churchfield, M.; Scholbrock, A.; Clifton, A.; Schreck, S.; Johnson, K.; Wright, A.; Gebraad, P.; Annoni, J.; Naughton, B.; et al. Detailed field test of yaw-based wake steering. J. Phys. Conf. Ser. 2016, 753, 052003. [Google Scholar] [CrossRef] [Green Version]
- Gebraad, P.; Teeuwisse, F.; Van Wingerden, J.; Fleming, P.A.; Ruben, S.; Marden, J.; Pao, L. Wind plant power optimization through yaw control using a parametric model for wake effects—A CFD simulation study. Wind Energy 2016, 19, 95–114. [Google Scholar] [CrossRef]
- Gebraad, P.; Thomas, J.J.; Ning, A.; Fleming, P.; Dykes, K. Maximization of the annual energy production of wind power plants by optimization of layout and yaw-based wake control. Wind Energy 2017, 20, 97–107. [Google Scholar] [CrossRef]
- Chen, B.; Matthews, P.C.; Tavner, P.J. Wind turbine pitch faults prognosis using a-priori knowledge-based ANFIS. Expert Syst. Appl. 2013, 40, 6863–6876. [Google Scholar] [CrossRef]
- Chen, B.; Matthews, P.C.; Tavner, P.J. Automated on-line fault prognosis for wind turbine pitch systems using supervisory control and data acquisition. IET Renew. Power Gener. 2015, 9, 503–513. [Google Scholar] [CrossRef] [Green Version]
- Bi, R.; Zhou, C.; Hepburn, D.M. Detection and classification of faults in pitch-regulated wind turbine generators using normal behaviour models based on performance curves. Renew. energy 2017, 105, 674–688. [Google Scholar] [CrossRef]
- Wei, L.; Qian, Z.; Yang, C.; Pei, Y. Pitch fault diagnosis of wind turbines in multiple operational states using supervisory control and data acquisition data. Wind Eng. 2018. [Google Scholar] [CrossRef]
- Noshirvani, G.; Askari, J.; Fekih, A. A robust fault detection and isolation filter for the pitch system of a variable speed wind turbine. Int. Trans. Electr. Energy Syst. 2018, 28, e2625. [Google Scholar] [CrossRef]
- Wu, D.; Liu, W. A new fault diagnosis approach for the pitch system of wind turbines. Adv. Mech. Eng. 2017, 9. [Google Scholar] [CrossRef] [Green Version]
- Astolfi, D.; Castellani, F.; Terzi, L. Wind Turbine Power Curve Upgrades. Energies 2018, 11, 1300. [Google Scholar] [CrossRef]
- Lee, G.; Ding, Y.; Xie, L.; Genton, M.G. A kernel plus method for quantifying wind turbine performance upgrades. Wind Energy 2015, 18, 1207–1219. [Google Scholar] [CrossRef]
- Hwangbo, H.; Ding, Y.; Eisele, O.; Weinzierl, G.; Lang, U.; Pechlivanoglou, G. Quantifying the effect of vortex generator installation on wind power production: An academia-industry case study. Renew. Energy 2017, 113, 1589–1597. [Google Scholar] [CrossRef]
- Wohlert, T. Measuring Rotor Blades With Lasers; WindTech International: Groningen, The Netherlands, 2016. [Google Scholar]
- Bertelè, M.; Bottasso, C.L.; Cacciola, S. Automatic detection and correction of pitch misalignment in wind turbine rotors. Wind Energy Sci. 2018, 3, 791–803. [Google Scholar] [CrossRef]
- Cacciola, S.; Riboldi, C.; Croce, A. Monitoring rotor aerodynamic and mass imbalances through a self-balancing control. J. Phys. Conf. Ser. 2018, 1037, 032041. [Google Scholar] [CrossRef]
- Cacciola, S.; Riboldi, C.E. Equalizing aerodynamic blade loads through individual pitch control via multiblade multilag transformation. J. Sol. Energy Eng. 2017, 139, 061008. [Google Scholar] [CrossRef]
- Cacciola, S.; Agud, I.M.; Bottasso, C. Detection of rotor imbalance, including root cause, severity and location. J. Phys. Conf. Ser. 2016, 753, 072003. [Google Scholar] [CrossRef] [Green Version]
- Petrović, V.; Jelavić, M.; Baotić, M. Advanced control algorithms for reduction of wind turbine structural loads. Renew. Energy 2015, 76, 418–431. [Google Scholar] [CrossRef]
- Kanev, S.; Van Engelen, T. Exploring the limits in individual pitch control. In Proceedings of the European Wind Energy Conference, Marseille, France, 16–19 March 2009; pp. 1–10. [Google Scholar]
- Astolfi, D.; Castellani, F.; Terzi, L. A SCADA data mining method for precision assessment of performance enhancement from aerodynamic optimization of wind turbine blades. J. Phys. Conf. Ser. 2018, 1037, 032001. [Google Scholar] [CrossRef]
- Astolfi, D.; Castellani, F.; Berno, F.; Terzi, L. Numerical and Experimental Methods for the Assessment of Wind Turbine Control Upgrades. Appl. Sci. 2018, 8, 2639. [Google Scholar] [CrossRef]
- Pope, P.; Webster, J. The use of an F-statistic in stepwise regression procedures. Technometrics 1972, 14, 327–340. [Google Scholar] [CrossRef]
- Tsili, M.; Papathanassiou, S. A review of grid code technical requirements for wind farms. IET Renew. Power Gener. 2009, 3, 308. [Google Scholar] [CrossRef]
- Refaeilzadeh, P.; Tang, L.; Liu, H. Cross-validation. In Encyclopedia of Database Systems; Springer: Berlin, Germany, 2009; pp. 532–538. [Google Scholar]
- Elosegui, U.; Egana, I.; Ulazia, A.; Ibarra-Berastegi, G. Pitch Angle Misalignment Correction Based on Benchmarking and Laser Scanner Measurement in Wind Farms. Energies 2018, 11, 3357. [Google Scholar] [CrossRef]
Figure 1.
The layout of the wind farm.

Figure 2.
The power time series: data set.

Figure 3.
The power time series: data set.

Figure 4.
The average difference R between power measurement y and estimation (Equation (4)). Data sets: D1 and D2. Sample run of the model.
Figure 4.
The average difference R between power measurement y and estimation (Equation (4)). Data sets: D1 and D2. Sample run of the model.

Figure 5.
The average difference R between power measurement y and estimation (Equation (4)). Data sets: and . Sample run of the model.
Figure 5.
The average difference R between power measurement y and estimation (Equation (4)). Data sets: and . Sample run of the model.


Table 1.
Inter-turbine distances in meters.
| Wind Turbine | T01 | T02 | T03 | T04 | T05 |
|---|---|---|---|---|---|
| T01 | 0 | 449 | 1140 | 1870 | 2561 |
| T02 | 449 | 0 | 703 | 1433 | 2125 |
| T03 | 1140 | 703 | 0 | 730 | 1423 |
| T04 | 1870 | 1433 | 730 | 0 | 692 |
| T05 | 2561 | 2125 | 1423 | 692 | 0 |
Table 2.
Results of the model validation.
| 1 | 2 | 3 | 4 | 5 | 6 | 7 | 8 | 9 | 10 | |
|---|---|---|---|---|---|---|---|---|---|---|
| (kW) | 60 | 62 | 61 | 61 | 62 | 62 | 62 | 62 | 62 | 62 |
| N. of regressors | 7 | 6 | 6 | 6 | 5 | 5 | 5 | 5 | 5 | 5 |
| 66 | 66 | 67 | 70.6 | 70.3 | 75.3 | 78.6 | 85.3 | 87.6 | 88.3 |
Table 3.
Statistical behavior of the residuals between measurements and estimations for the different random choices of the D0 and D1 data sets.
Table 3.
Statistical behavior of the residuals between measurements and estimations for the different random choices of the D0 and D1 data sets.
| Residual | (kW) | (kW) | (kW) |
|---|---|---|---|
| 0.3 | 61 | 89 | |
| 35 | 74 | 101 |
Table 4.
Statistical behavior of the residuals between measurement and estimation for the different random choices of the and data sets.
Table 4.
Statistical behavior of the residuals between measurement and estimation for the different random choices of the and data sets.
| Residual | (kW) | (kW) | (kW) |
|---|---|---|---|
| 0.05 | 59 | 86 | |
| 4 | 67 | 93 |
© 2019 by the author. Licensee MDPI, Basel, Switzerland. This article is an open access article distributed under the terms and conditions of the Creative Commons Attribution (CC BY) license (http://creativecommons.org/licenses/by/4.0/).
Share and Cite
MDPI and ACS Style
Astolfi, D. A Study of the Impact of Pitch Misalignment on Wind Turbine Performance. Machines 2019, 7, 8. https://doi.org/10.3390/machines7010008
AMA Style
Astolfi D. A Study of the Impact of Pitch Misalignment on Wind Turbine Performance. Machines. 2019; 7(1):8. https://doi.org/10.3390/machines7010008
Chicago/Turabian StyleAstolfi, Davide. 2019. "A Study of the Impact of Pitch Misalignment on Wind Turbine Performance" Machines 7, no. 1: 8. https://doi.org/10.3390/machines7010008
Note that from the first issue of 2016, this journal uses article numbers instead of page numbers. See further details here.