Article

Comprehensive Parameters Identification and Dynamic Model Validation of Interior-Mount Line-Start Permanent Magnet Synchronous Motors

by
Luqman S. Maraaba
1,*,
Zakariya M. Al-Hamouz
2,
Abdulaziz S. Milhem
3 and
Ssennoga Twaha
4,5
1
Center for Engineering Research, Research Institute, King Fahd University of Petroleum and Minerals, Dhahran 31261, Saudi Arabia
2
School of Technology, Electrical Engineering Program, Michigan Technological University, Houghton, MI 49931, USA
3
Electrical Engineering Department, King Fahd University of Petroleum and Minerals, Dhahran 34464, Saudi Arabia
4
Department of Electrical and Electronics Engineering, Faculty of Engineering, Kyambogo University, Kyambogo, Kampala 00256, Uganda
5
Architecture, Energy & Environment Research Group, Faculty of Engineering, University of Nottingham, Nottingham NG7 2RD, UK
*
Author to whom correspondence should be addressed.
Machines 2019, 7(1), 4; https://doi.org/10.3390/machines7010004
Submission received: 26 November 2018 / Revised: 30 December 2018 / Accepted: 2 January 2019 / Published: 7 January 2019
(This article belongs to the Special Issue Advances in Electrical Machines and Drives)

Abstract

:
The application of line-start permanent magnet synchronous motors (LSPMSMs) is rapidly spreading due to their advantages of high efficiency, high operational power factor, being self-starting, rendering them as highly needed in many applications in recent years. Although there have been standard methods for the identification of parameters of synchronous and induction machines, most of them do not apply to LSPMSMs. This paper presents a study and analysis of different parameter identification methods for interior mount LSPMSM. Experimental tests have been performed in the laboratory on a 1-hp interior mount LSPMSM. The measurements have been validated by investigating the performance of the machine under different operating conditions using a developed qd0 mathematical model and an experimental setup. The dynamic and steady-state performance analyses have been performed using the determined parameters. It is found that the experimental results are close to the mathematical model results, confirming the accuracy of the studied test methods. Therefore, the output of this study will help in selecting the proper test method for LSPMSM.

1. Introduction

In industrial applications, especially in oil and gas plants, induction motors are being gradually replaced by high-efficiency permanent magnet motors, called line-start permanent magnet synchronous motors (LSPMSMs). LSPMSM is one of the most efficient synchronous motors [1,2,3,4]. LSPMSM is equipped with a squirrel cage to rotate the rotor from standstill, with the magnets to help the motor to maintain the synchronous speed. Compared to the traditional three-phase induction motors, LSPMSM has advantages like higher efficiency and power factor within a wide load range. This kind of motor can efficiently replace the induction motors for general use [5,6,7,8].
Although the information about the parameters of electric machines is very important for implementing different types of controllers, manufacturers of such available machines usually provide insufficient information about the electric parameters. Therefore, implementation of high-performance control schemes requires the accurate estimation of these parameters. In addition, it is invaluable that the electric machine manufacturers and designers perform various simulations and analysis before the prototypes are made. Several researchers have carried out several simulation and experimental works on parameter estimation [9,10,11,12,13,14,15].
There are a lot of models that describe motor behavior, like the finite element method (FEM) [7,10,16,17,18,19], d-q reference frame [8,9,10,11,12,20,21,22] and magnetic equation [23,24]. Among these models, the d-q reference frame model provides the optimum combination of analysis time and parameter requirements along with acceptable results from the analysis. Utilizing the d-q reference frame in the development process and in optimizing the LSPMSM design gives the required results in case adequate parameter measurements are obtained. As per the well-known d-q model [20], the parameters required to be determined include the stator phase resistance, the leakage stator inductance, d- and q-axis rotor resistance, leakage rotor inductance, rotor leakage inductances, the mutual inductances in the d- and q-axis and the flux of the permanent magnet referred to stator side. In this work, the comprehensive testing methods for determining the above-mentioned parameters is presented. Throughout the process of determining the required parameters, the tests conducted comprise DC test, Single Phase AC test, Block Rotor test, DC Step test, and Open-circuit test. Afterward, the parameters were validated using the developed MATLAB® Simulink model. The rest of the paper is organized as follows. Section 2 describes the mathematical model of the LSPMSM. Section 3 shows the experimental tests used for parameter identification. Section 4 shows the results of the conducted tests. While in Section 5, validation of the measured parameters and the developed mathematical model have been done.

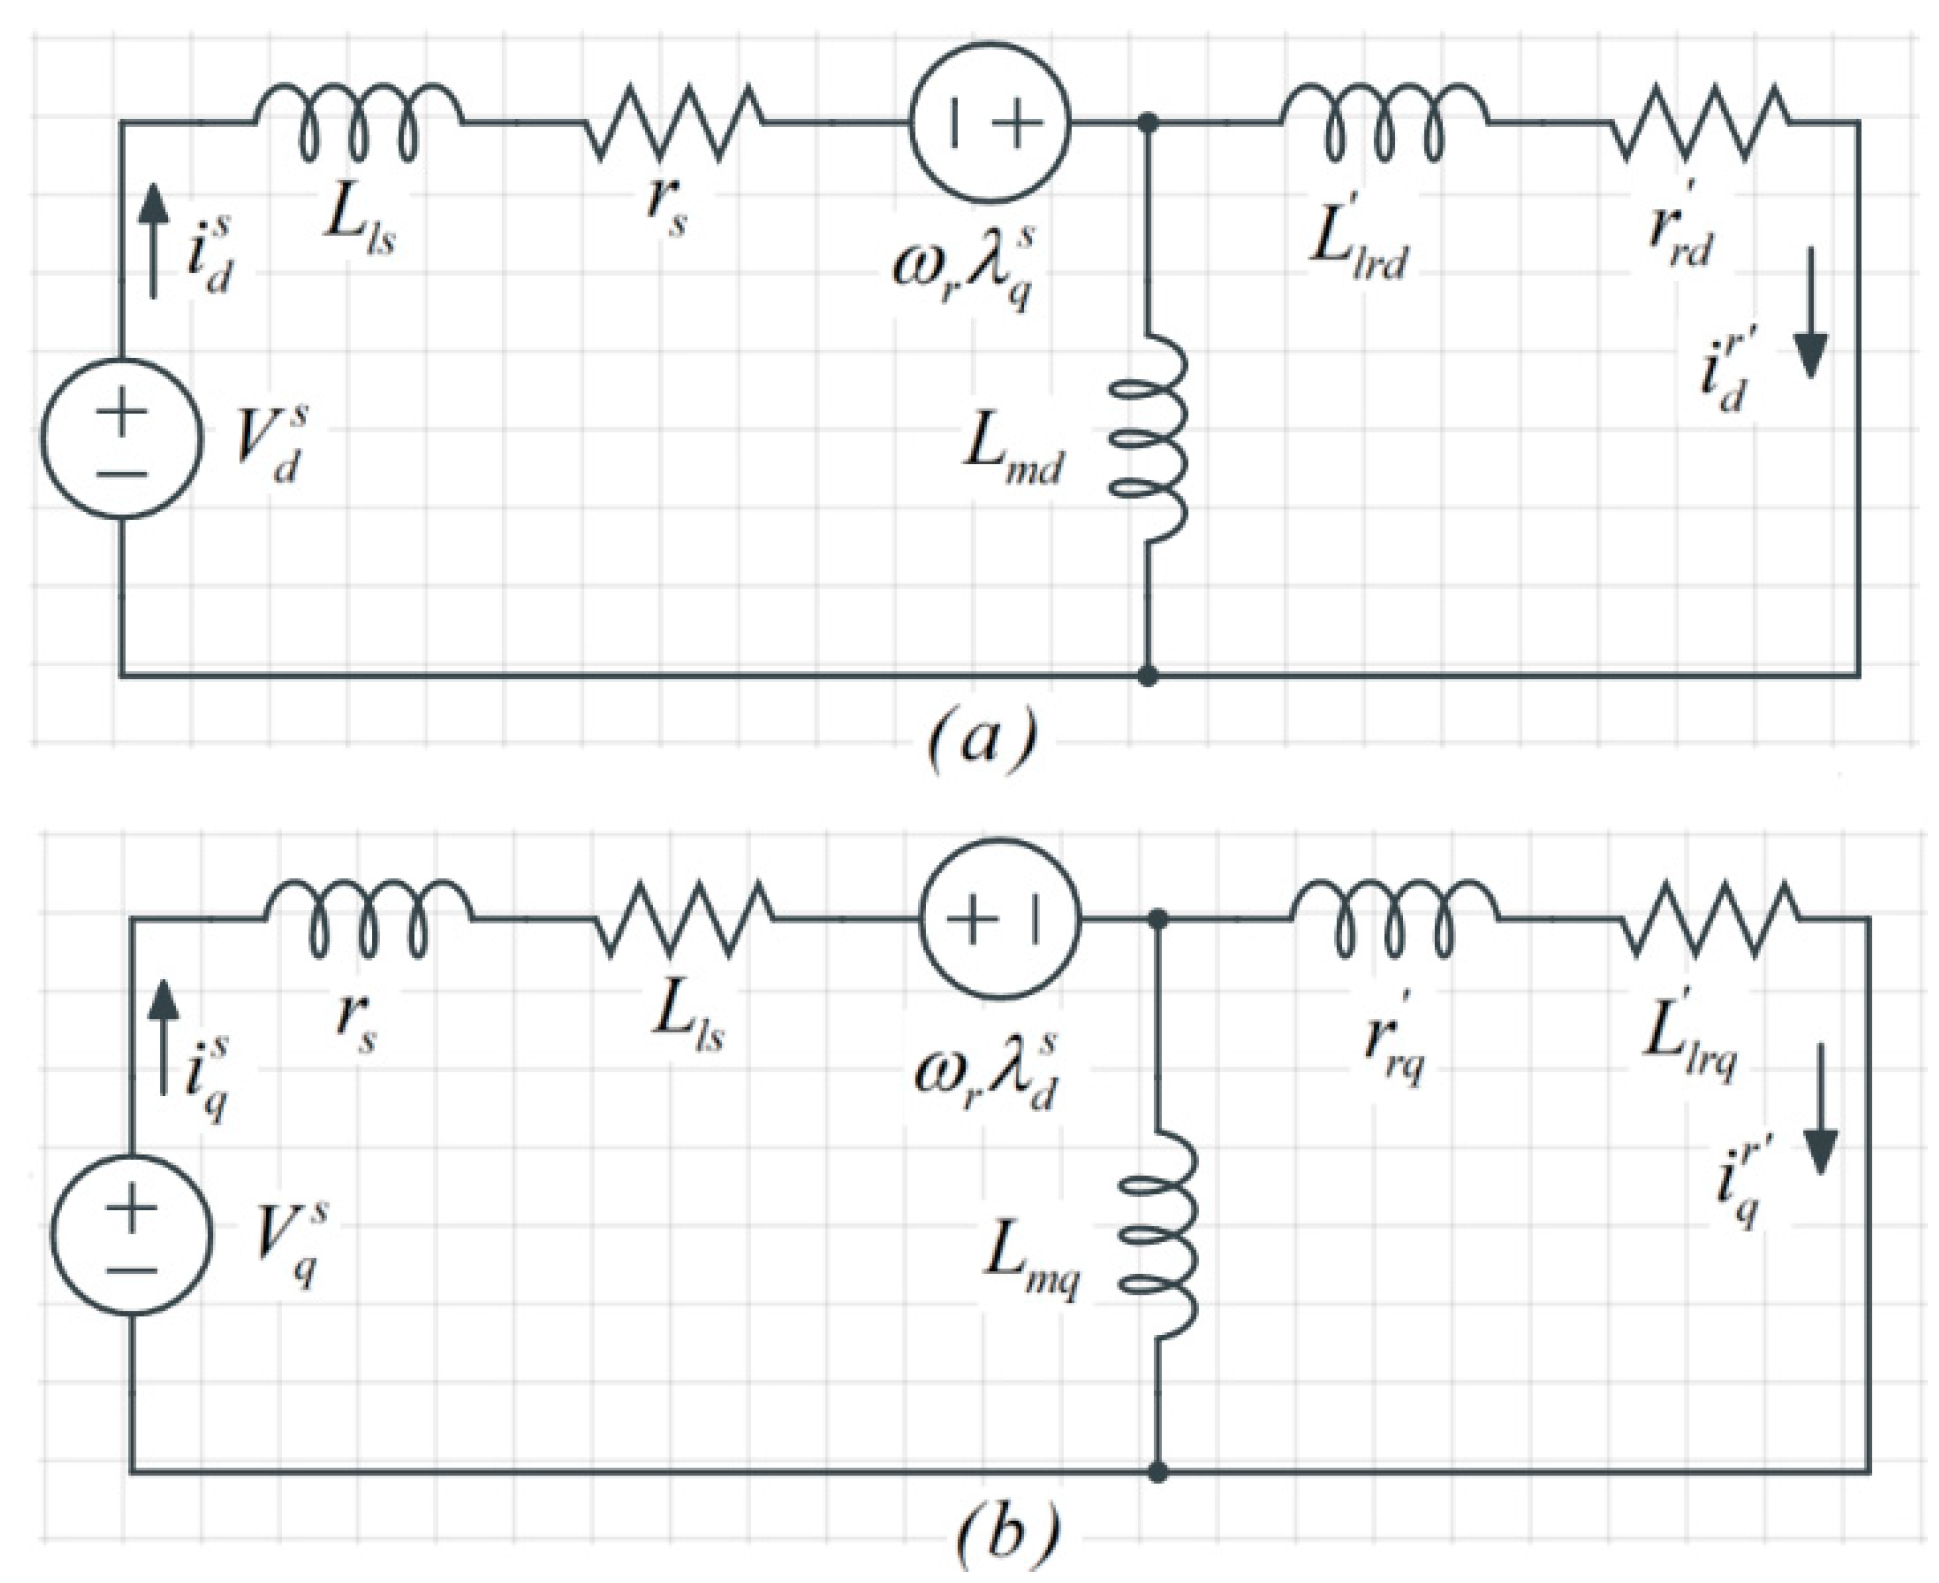
2. Mathematical Model of LSPMSM

The healthy model of LSPMSM in the qd0 reference frame is a well-known model [25,26,27,28,29,30,31,32]. Equations (1)–(10) represent the transient model for the LSPMSM. The stator and rotor voltages are represented by Equations (1)–(4) while the flux–current relationship is demonstrated by (5)–(8). Equations (9) and (10) represent the electromechanical system.
V q s = r s i q s + ω r λ d s + d λ q s d t
V d s = r s i d s ω r λ q s + d λ d s d t
V q r = 0 = r r q i q r + d λ q r d t
V d r = 0 = r r d i d r + d λ d r d t
λ q s = ( L l s + L m q ) i q s + L m q i q r
λ d s = ( L l s + L m d ) i d s + L m d i d r + λ m
λ q r = ( L l r q + L m q ) i q r + L m q i q s
λ d r = ( L l r d + L m d ) i d r + L m d i d s + λ m
where r s is stator resistance per phase. r r q is the rotor resistance in q-axis. r r d is the rotor resistance in d-axis. v q s and v d s are stator voltages in q-axis and d-axis, respectively. v q r and v d r are rotor voltages in q-axis and d-axis referred to stator side, respectively. i q s and i d s are stator currents in q-axis and d-axis, respectively. i q r and i d r are rotor currents in q-axis and d-axis referred to stator side, respectively. ωr is the rotor speed while λ q s and λ d s are stator linkage fluxes in q-axis and d-axis, respectively. λ q r and λ d r are rotor linkage fluxes in q-axis and d-axis referred to stator side, respectively. λ m is the flux of the permanent magnet refer to stator side whereas L l r q and L l r d are rotor leakage inductances in q- and d-axis refer to the stator side, respectively. L l s is the leakage stator inductance. L m d and L m q are the mutual inductances in the d- and q-axis, respectively. The electromagnetic torque of LSPMSM is expressed as:
T e m = 3 P 4 ( i q s λ d s i d s λ q s )
The mechanical equation is also expressed as in (10):
ω r ( t ) = P 2 J ( T e m + T L T d a m p ) d t
where T e m is the Electromagnetic torque, T L is the load torque, T d a m p is the damping torque, J is the Motor inertial, ω r is the rotor speed and P is the pole’s number. It is worth mentioning that, Equation (10) is derived using Newton’s second law for rotation on the rotor. Experimentally, the damping torque in the equation could be the mechanical damping torque in the bearing and of the load. In simulation we consider the damping torque to be zero. The dynamic equivalent circuits of the LSPMSM are shown in Figure 1.

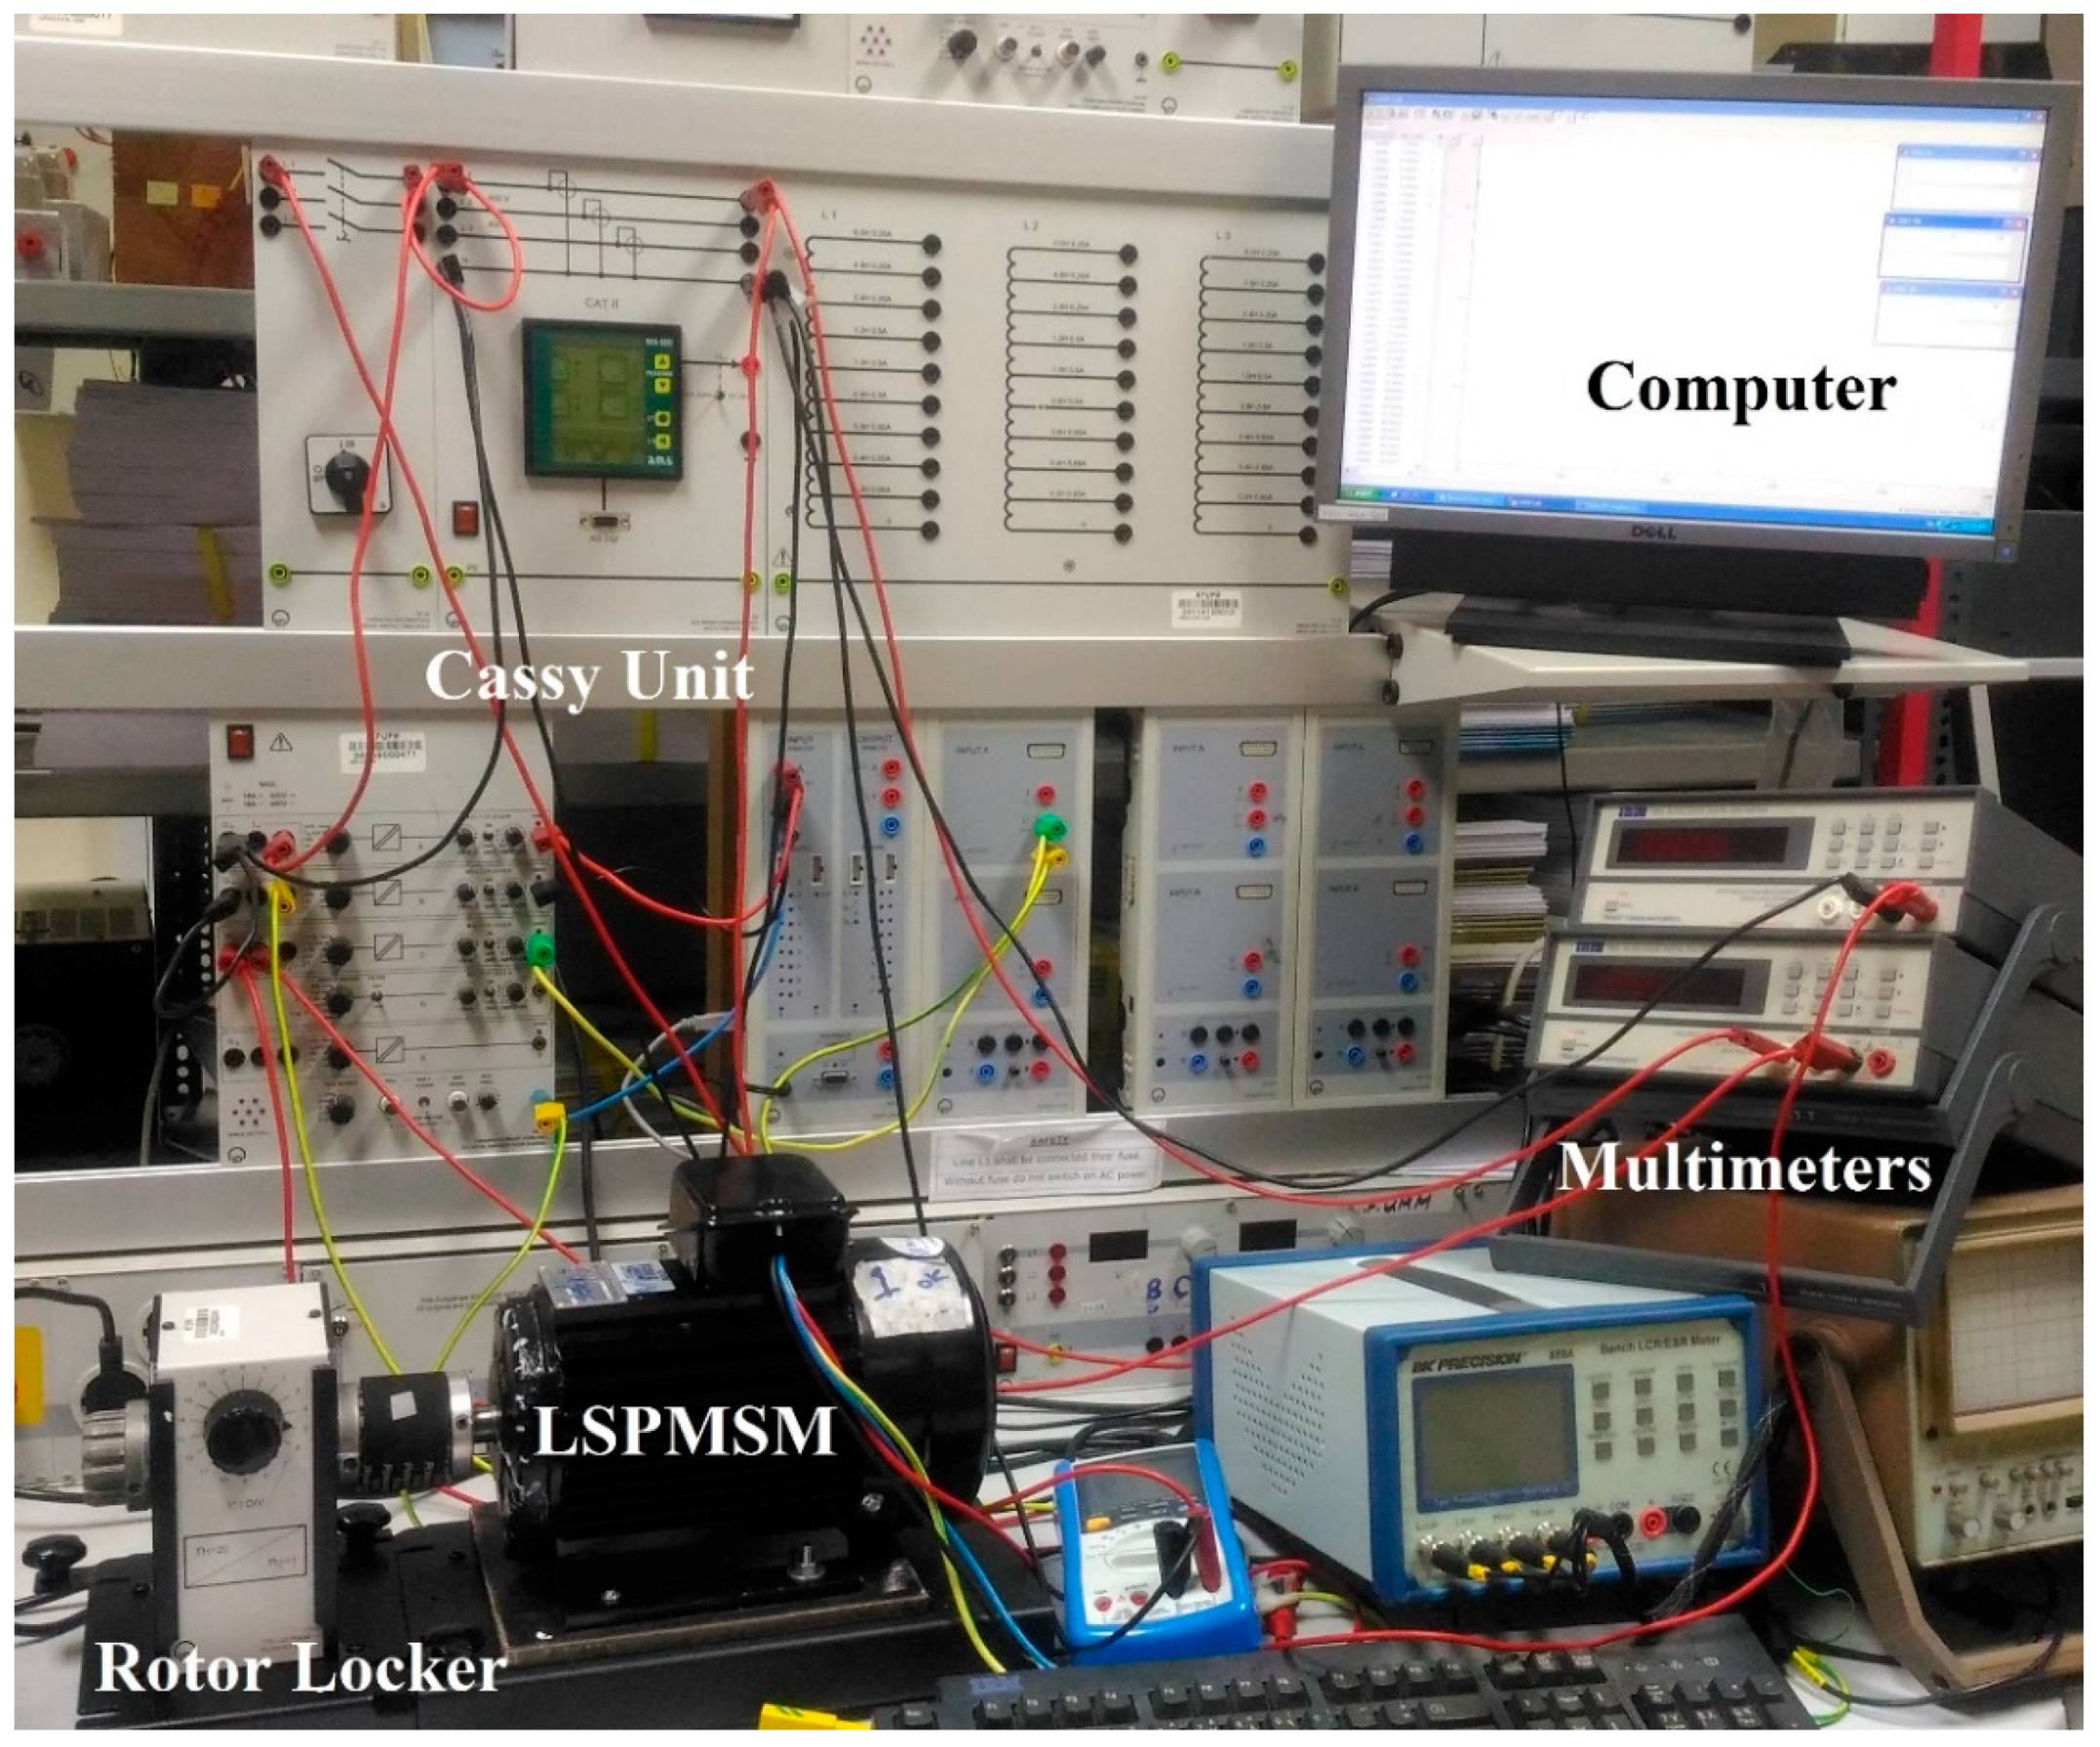
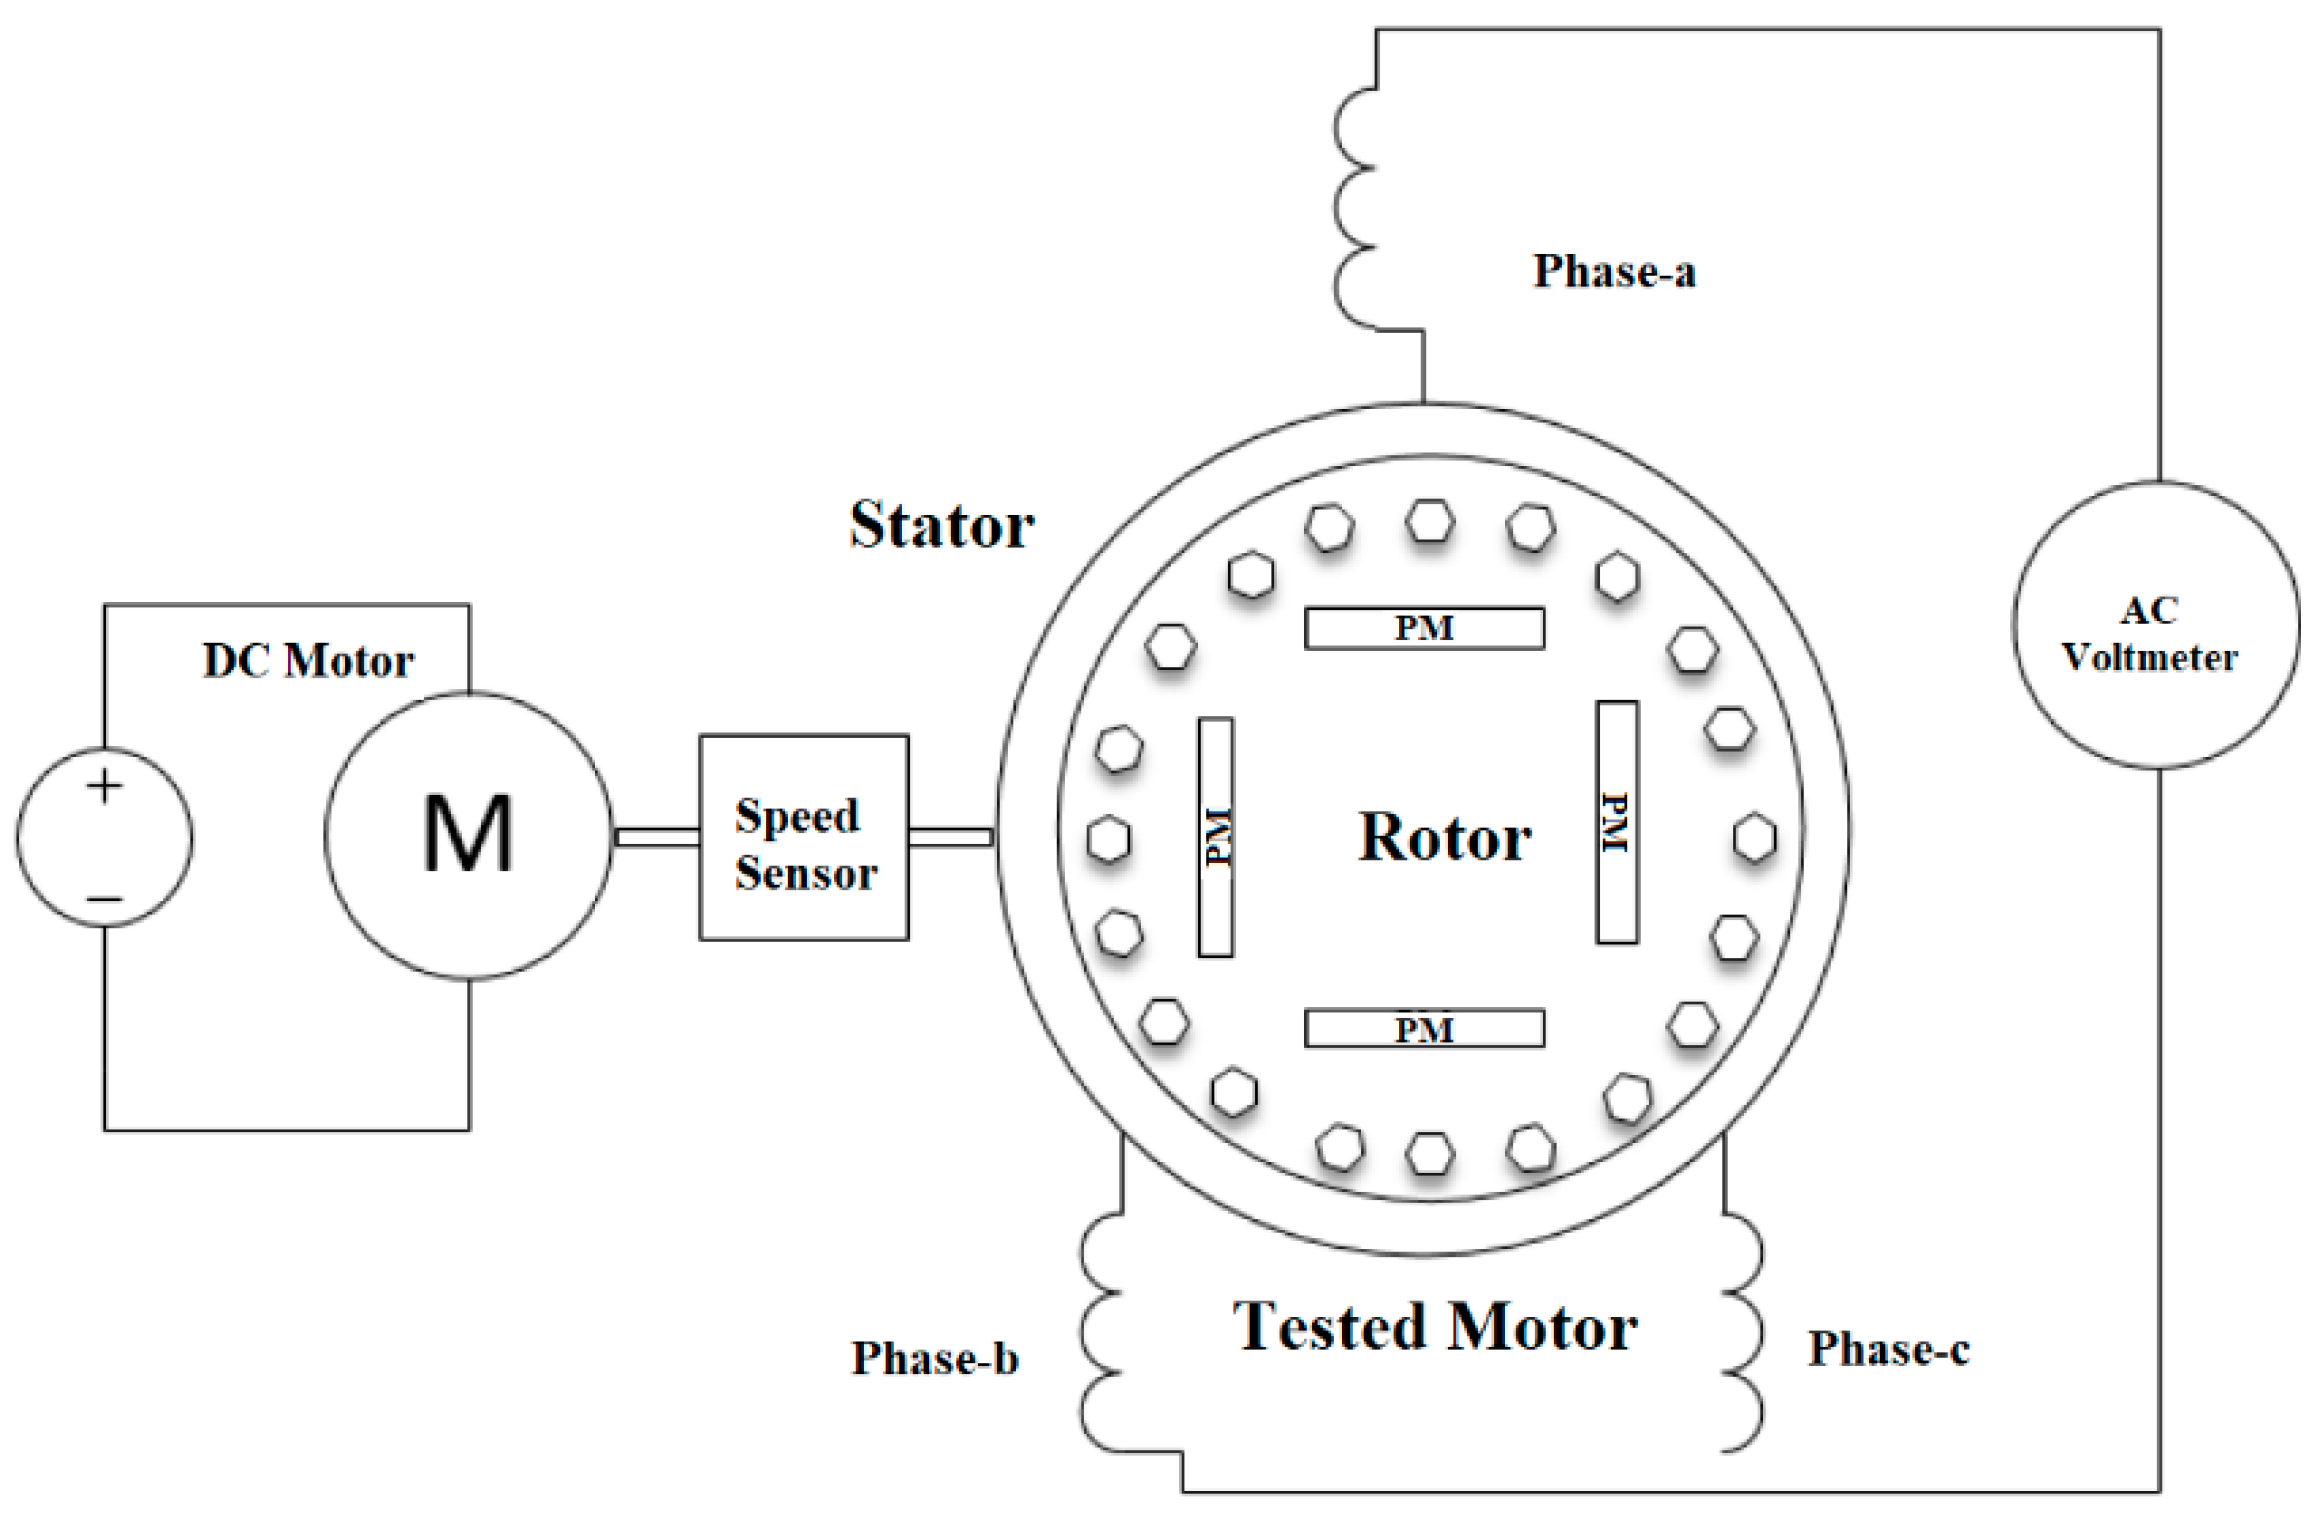
3. LSPMSM Parameters Measurement Using Different Experimental Tests
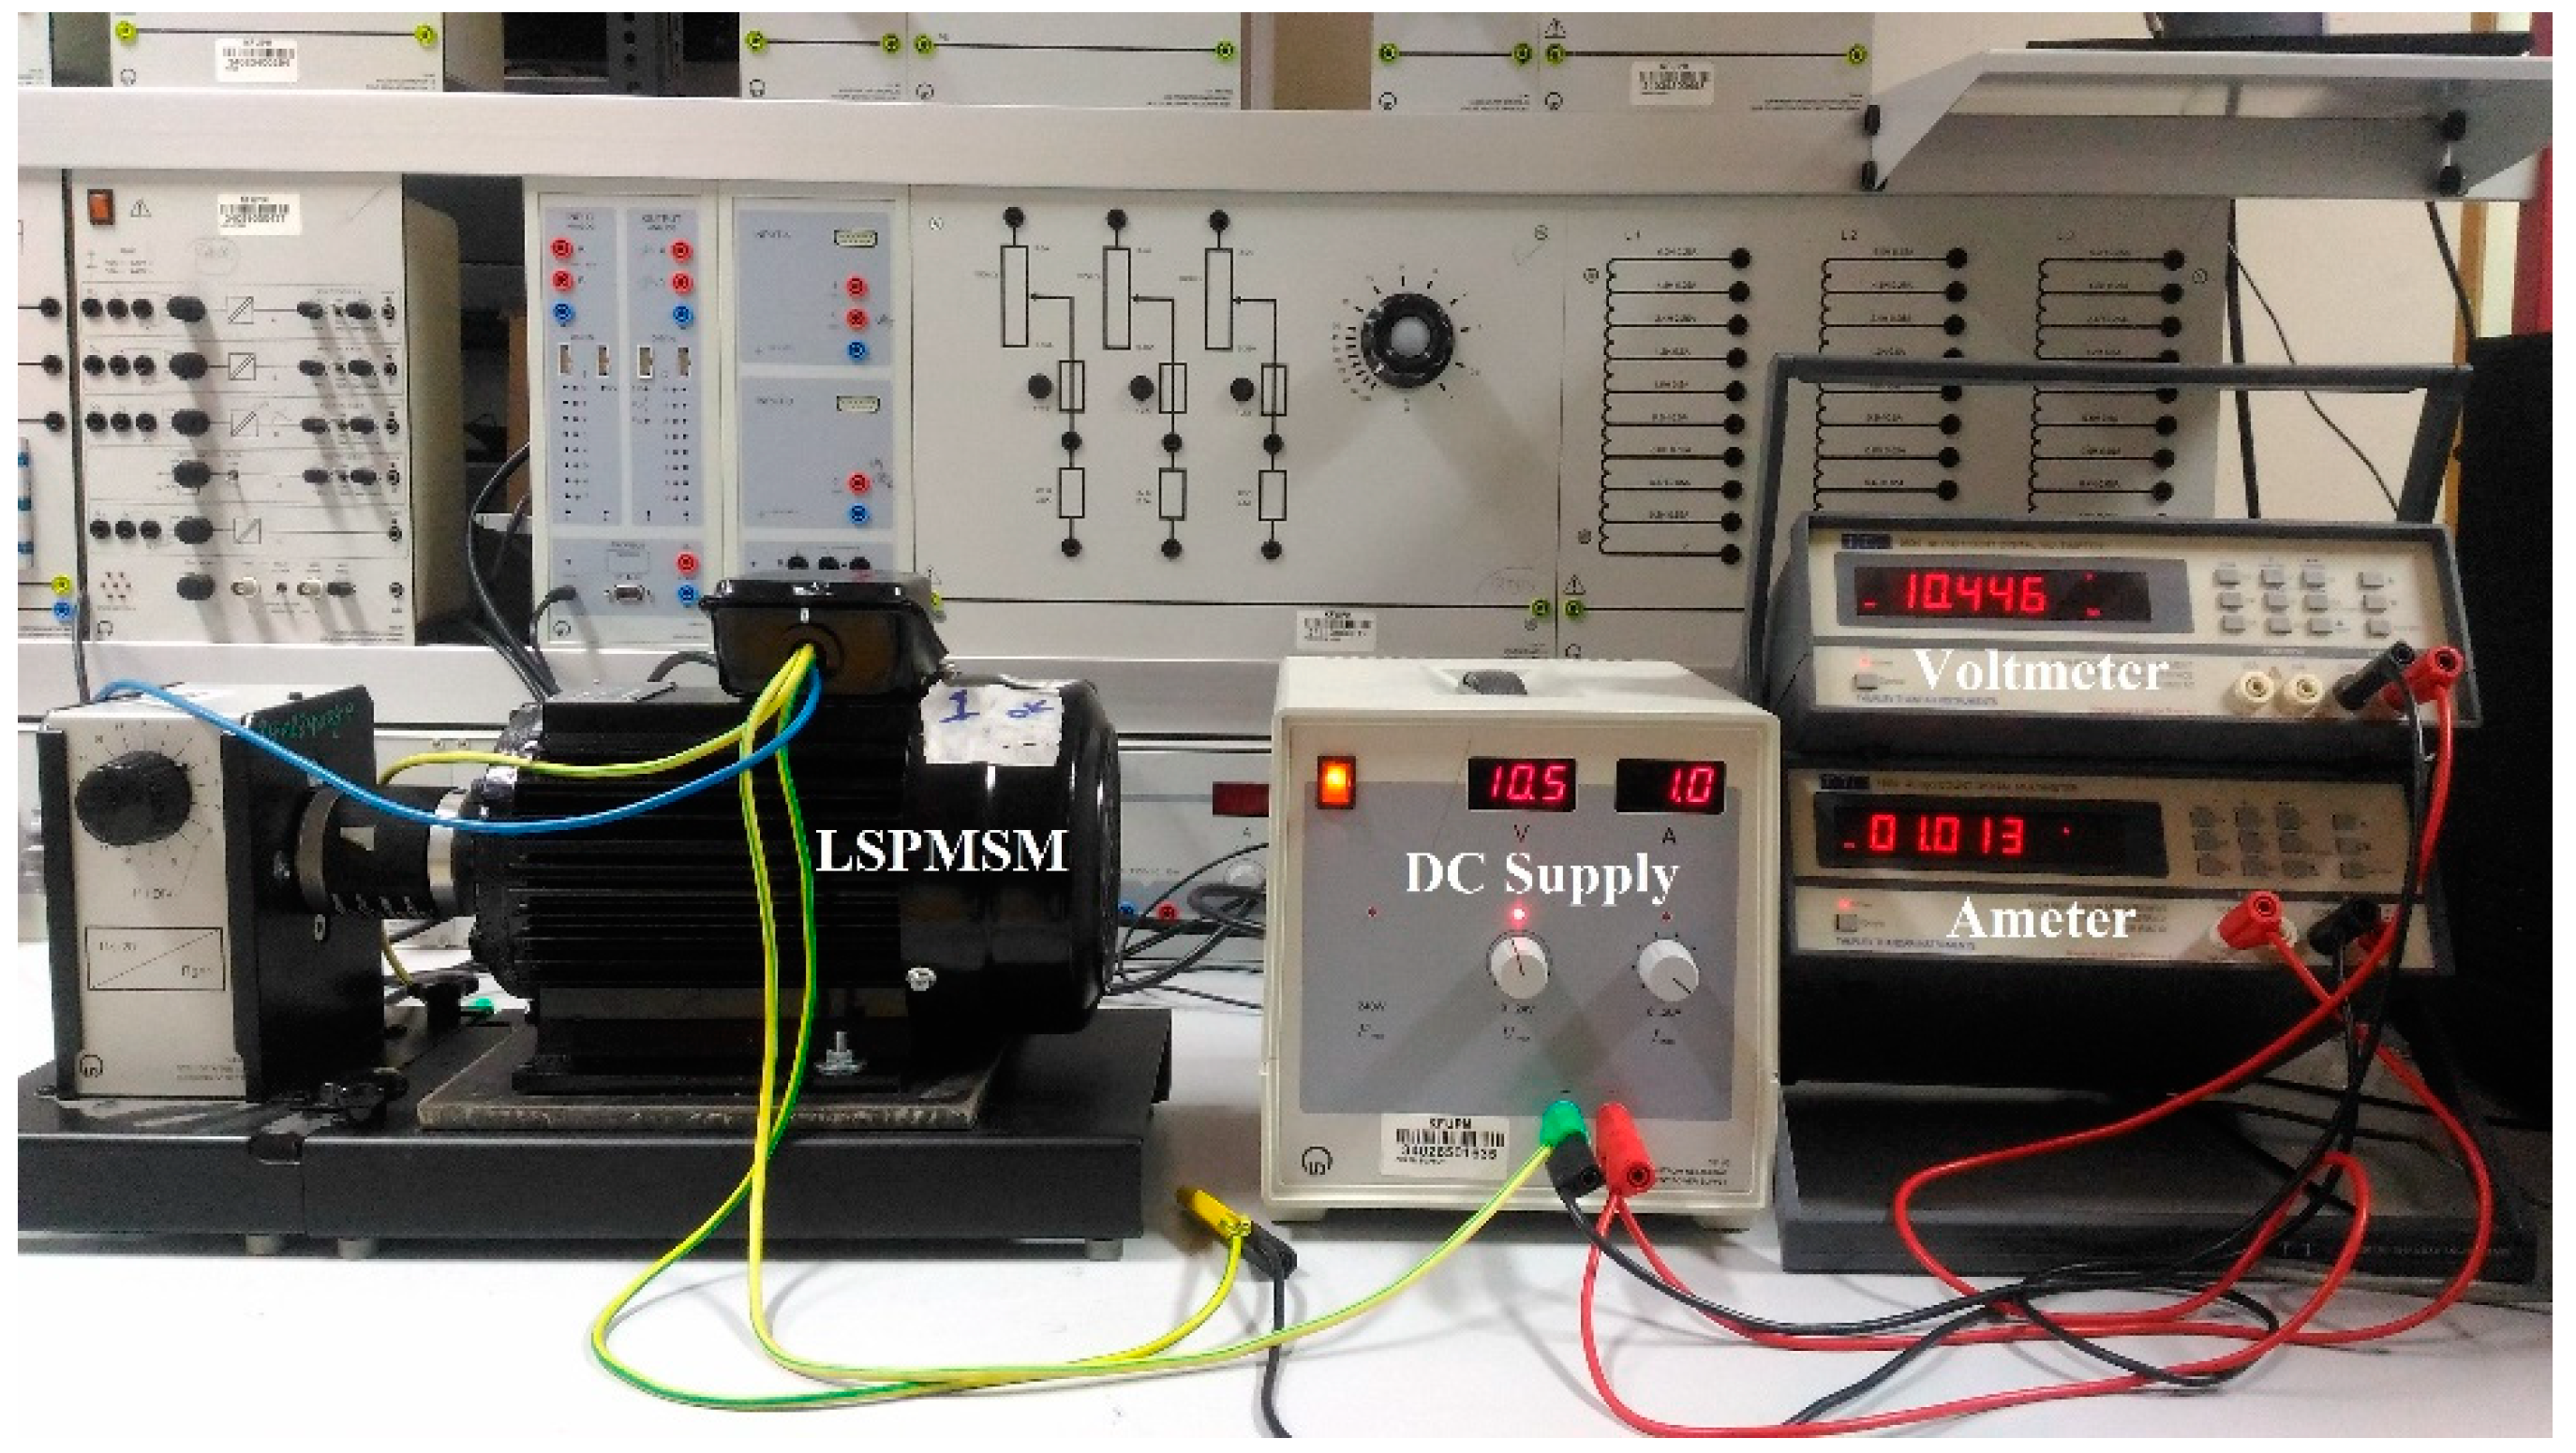
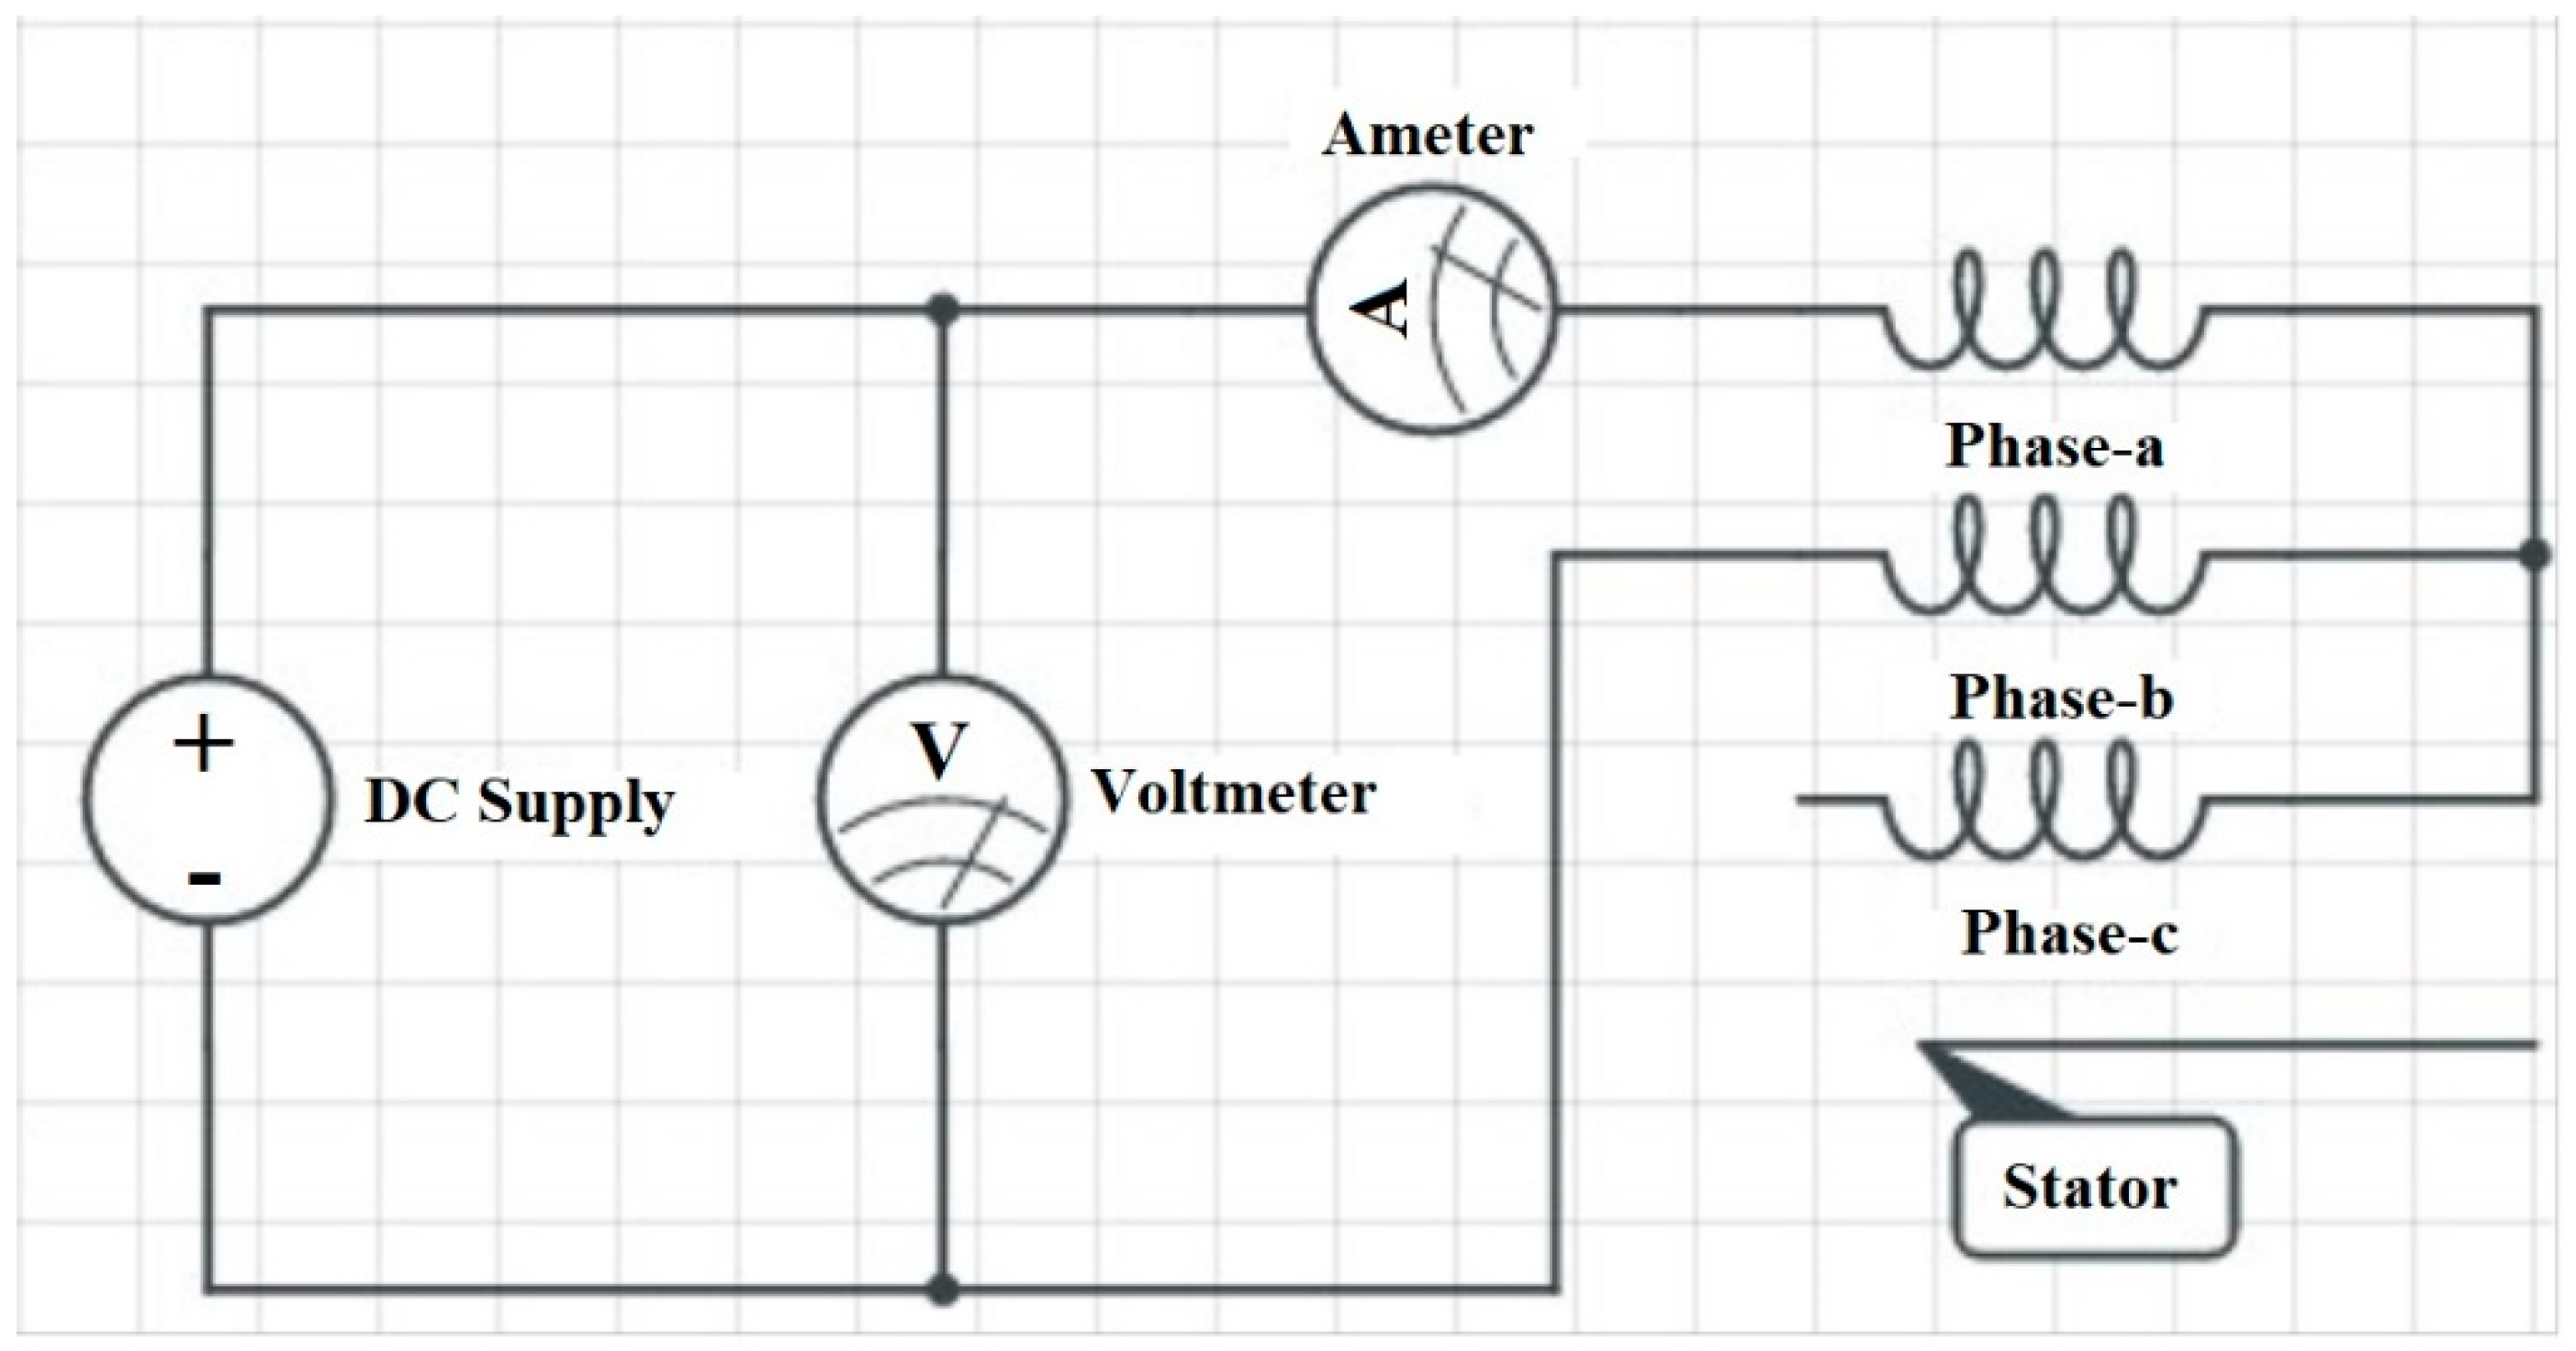
To investigate, analyze, and predict the performance of LSPMSM using its mathematical model, an accurate equivalent circuit parameter measurement of the motor is needed. Measuring the parameters of interior-mount LSPMSM is a challenging task because the rotor configuration of the motor is very complicated since it consists of a squirrel cage and the interior mount permanent magnets. Accordingly, a brief description of the experimental tests conducted in the machine laboratory at King Fahd University of Petroleum and Minerals (KFUPM) on a 1-hp Interior-mount LSPMSM to measure the electric circuit parameters are given. These tests include; DC test to measure the stator DC resistance, AC single phase (rotor not included) test to measure stator AC resistance and leakage inductance, block rotor test to measure the rotor resistance and leakage inductance in both d- and q-axis, DC step test to measure the magnetizing inductance in d- and q-axis, and lastly the open-circuit test to measure the flux linkage from the permeant magnets [33,34,35,36]. Table 1 shows the parameter of the tested machine.

3.1. DC Test

The dc resistance ( R s ) per phase of the stator winding is measured using the DC test [37,38]. In the case of star-connected stator winding R s is defined as the resistance between a phase terminal and the neutral point of the stator windings. To perform this test, two digital multimeters are needed, in addition to a variable DC power supply as shown in Figure 2.
In the DC test, a variable DC voltage is applied between the terminals of two phases, while the voltage and the corresponding current are recorded as shown in Figure 3. In this case, the effect of the inductance in the winding is neglected since the applied voltage is DC (zero frequency). Based on Kirchhoff voltage law, the formula for calculating the stator resistance is given as;
R s = V D C 2 I D C
where VDC and IDC denote the measured DC voltage and current, respectively.
The measured dc resistance obtained using DC test has to be verified using a CPC 100 measurement device as shown in Figure 4.

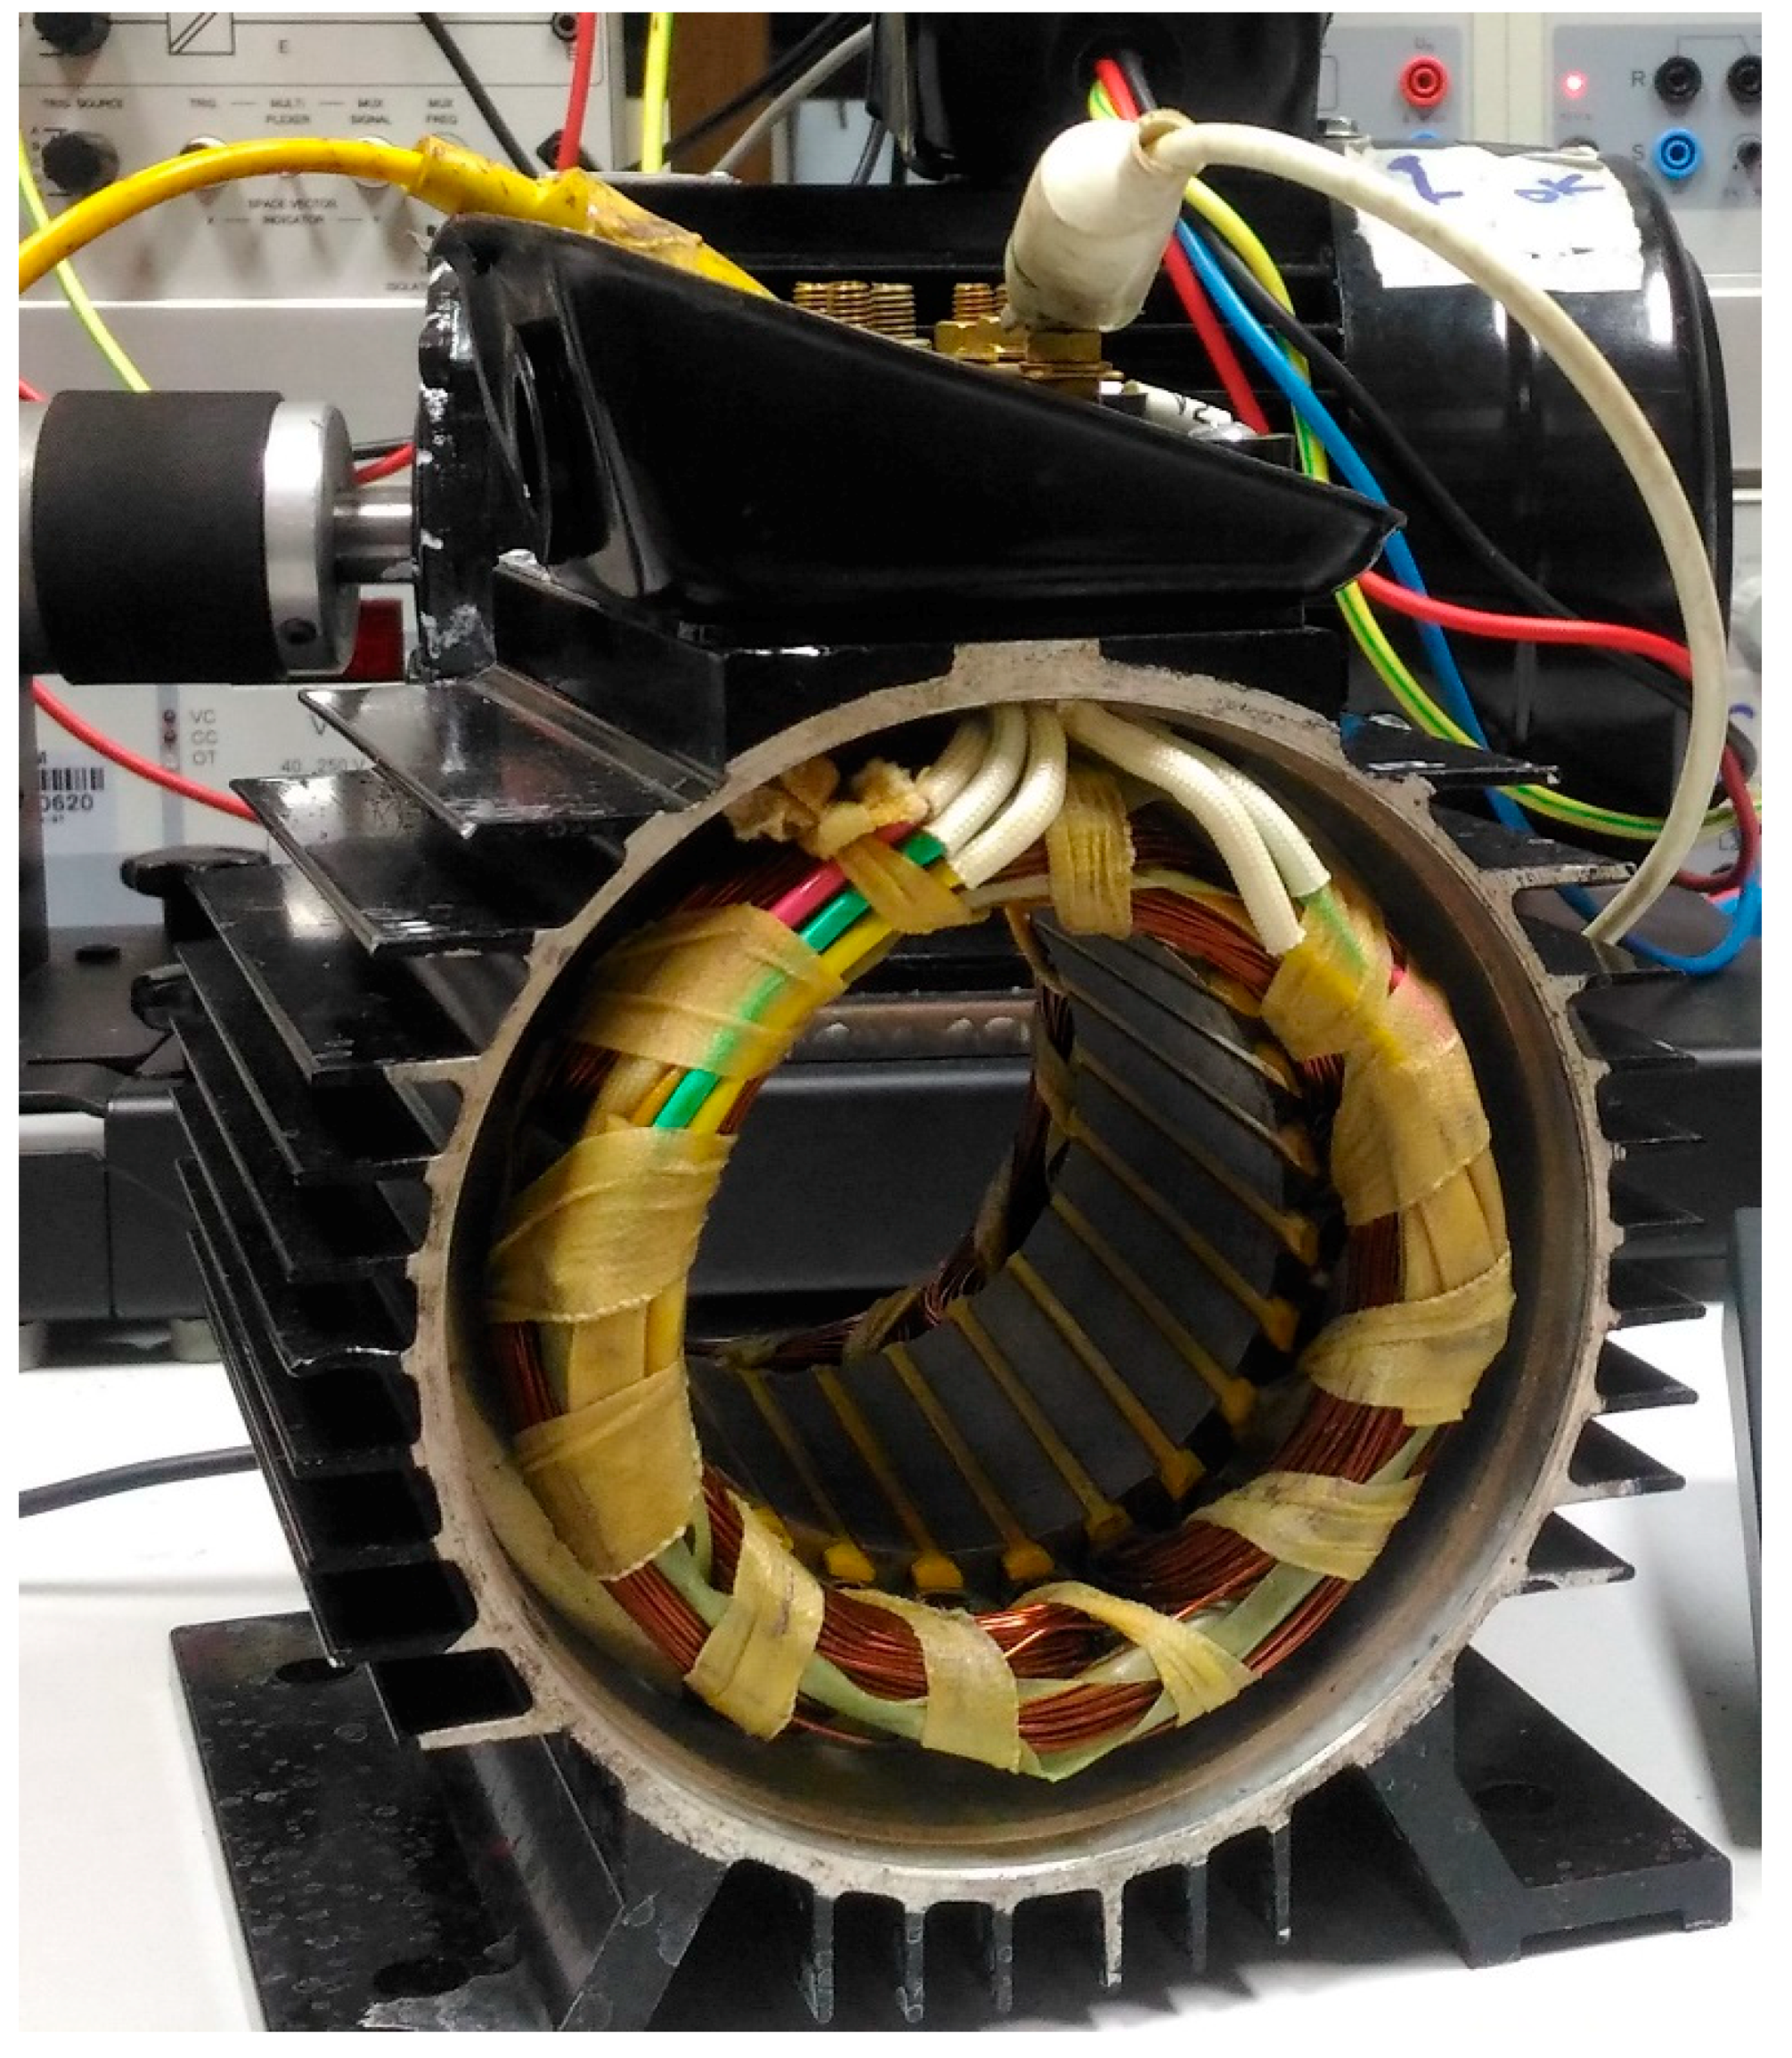
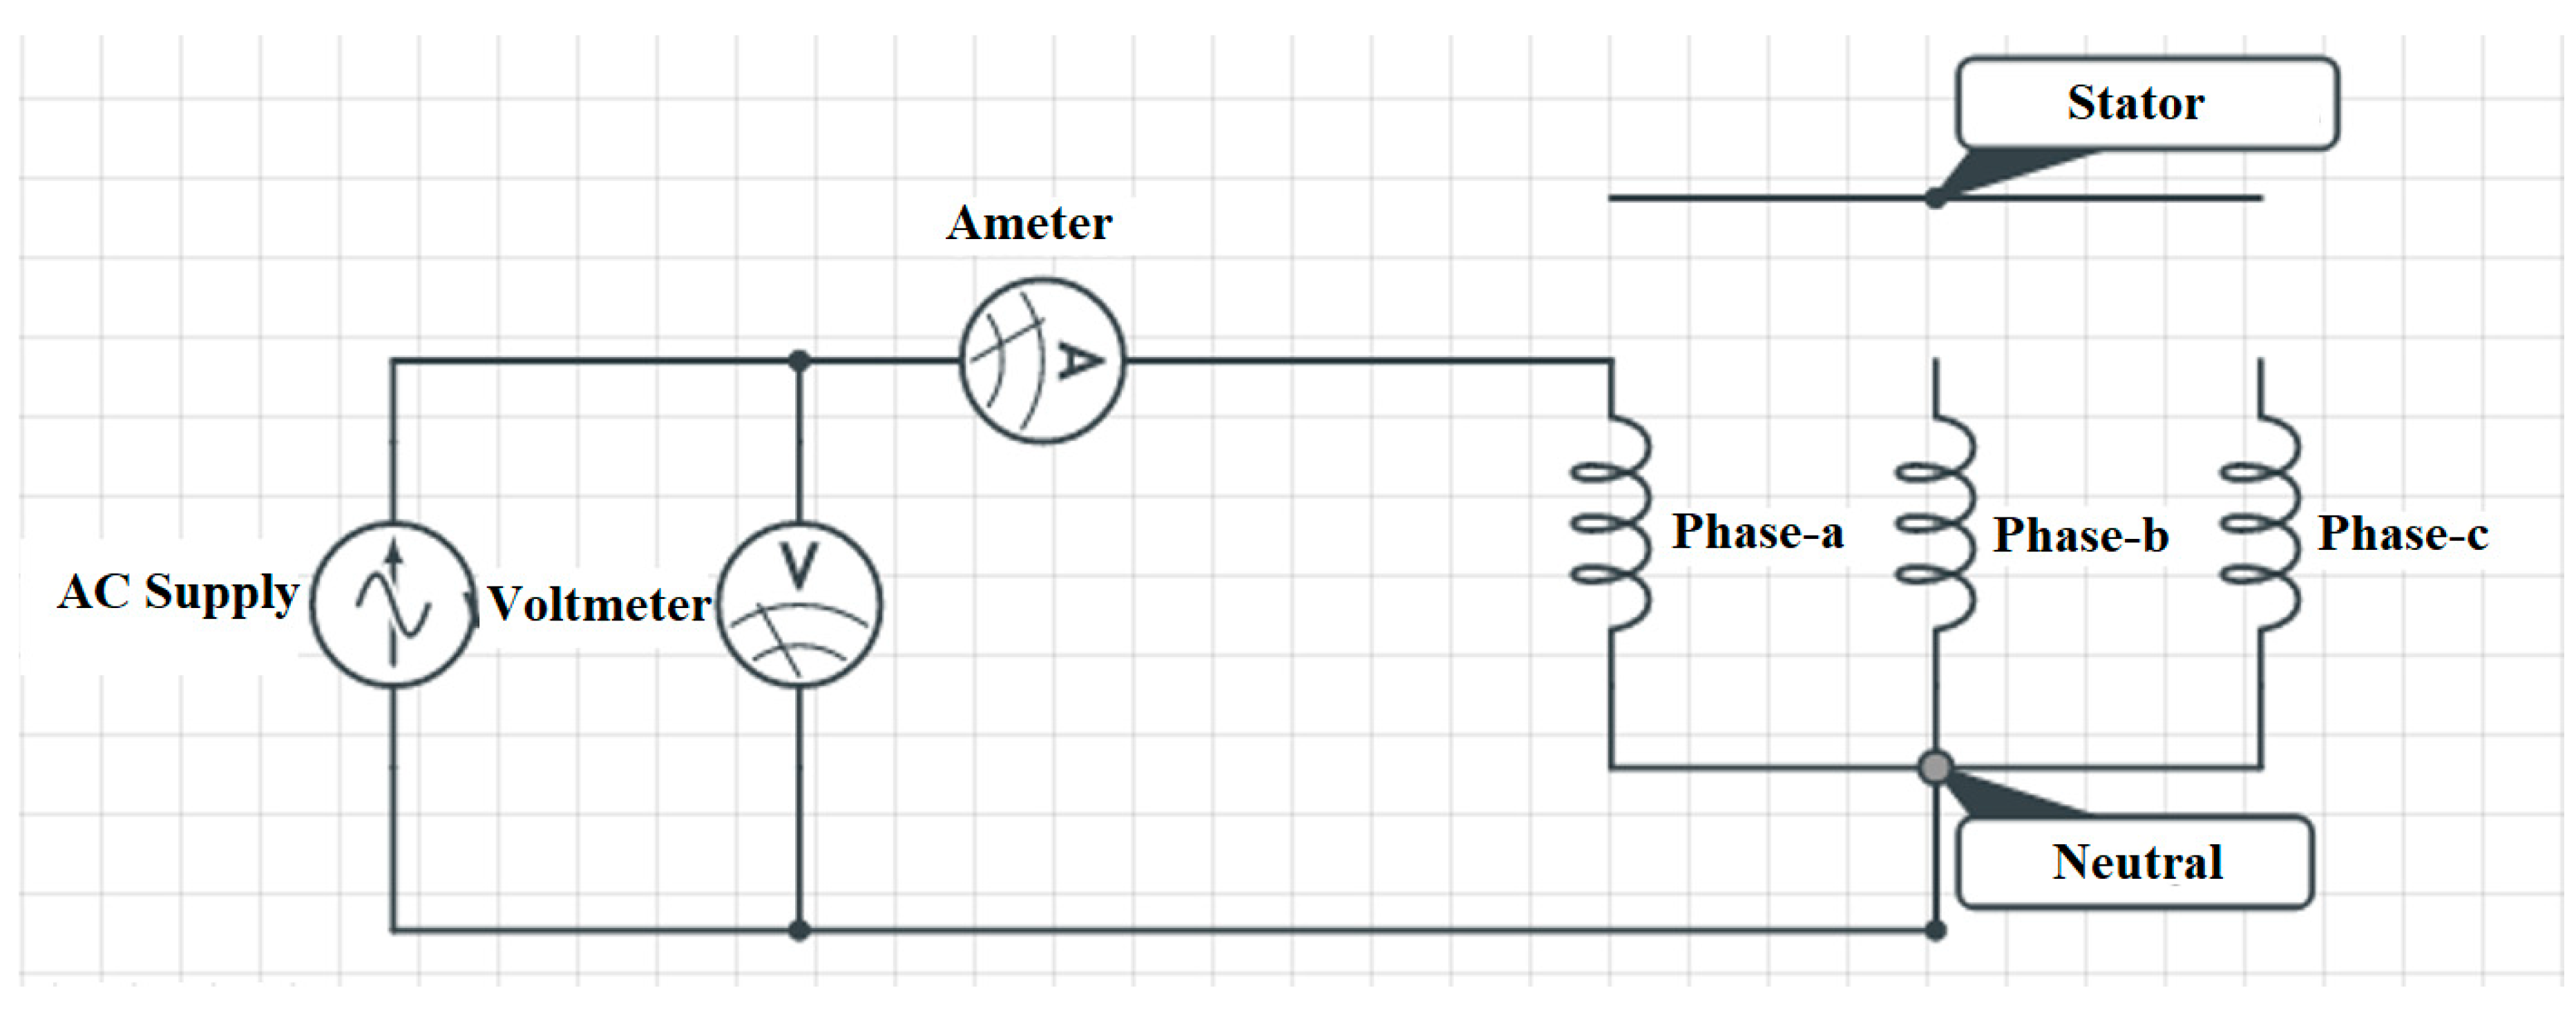
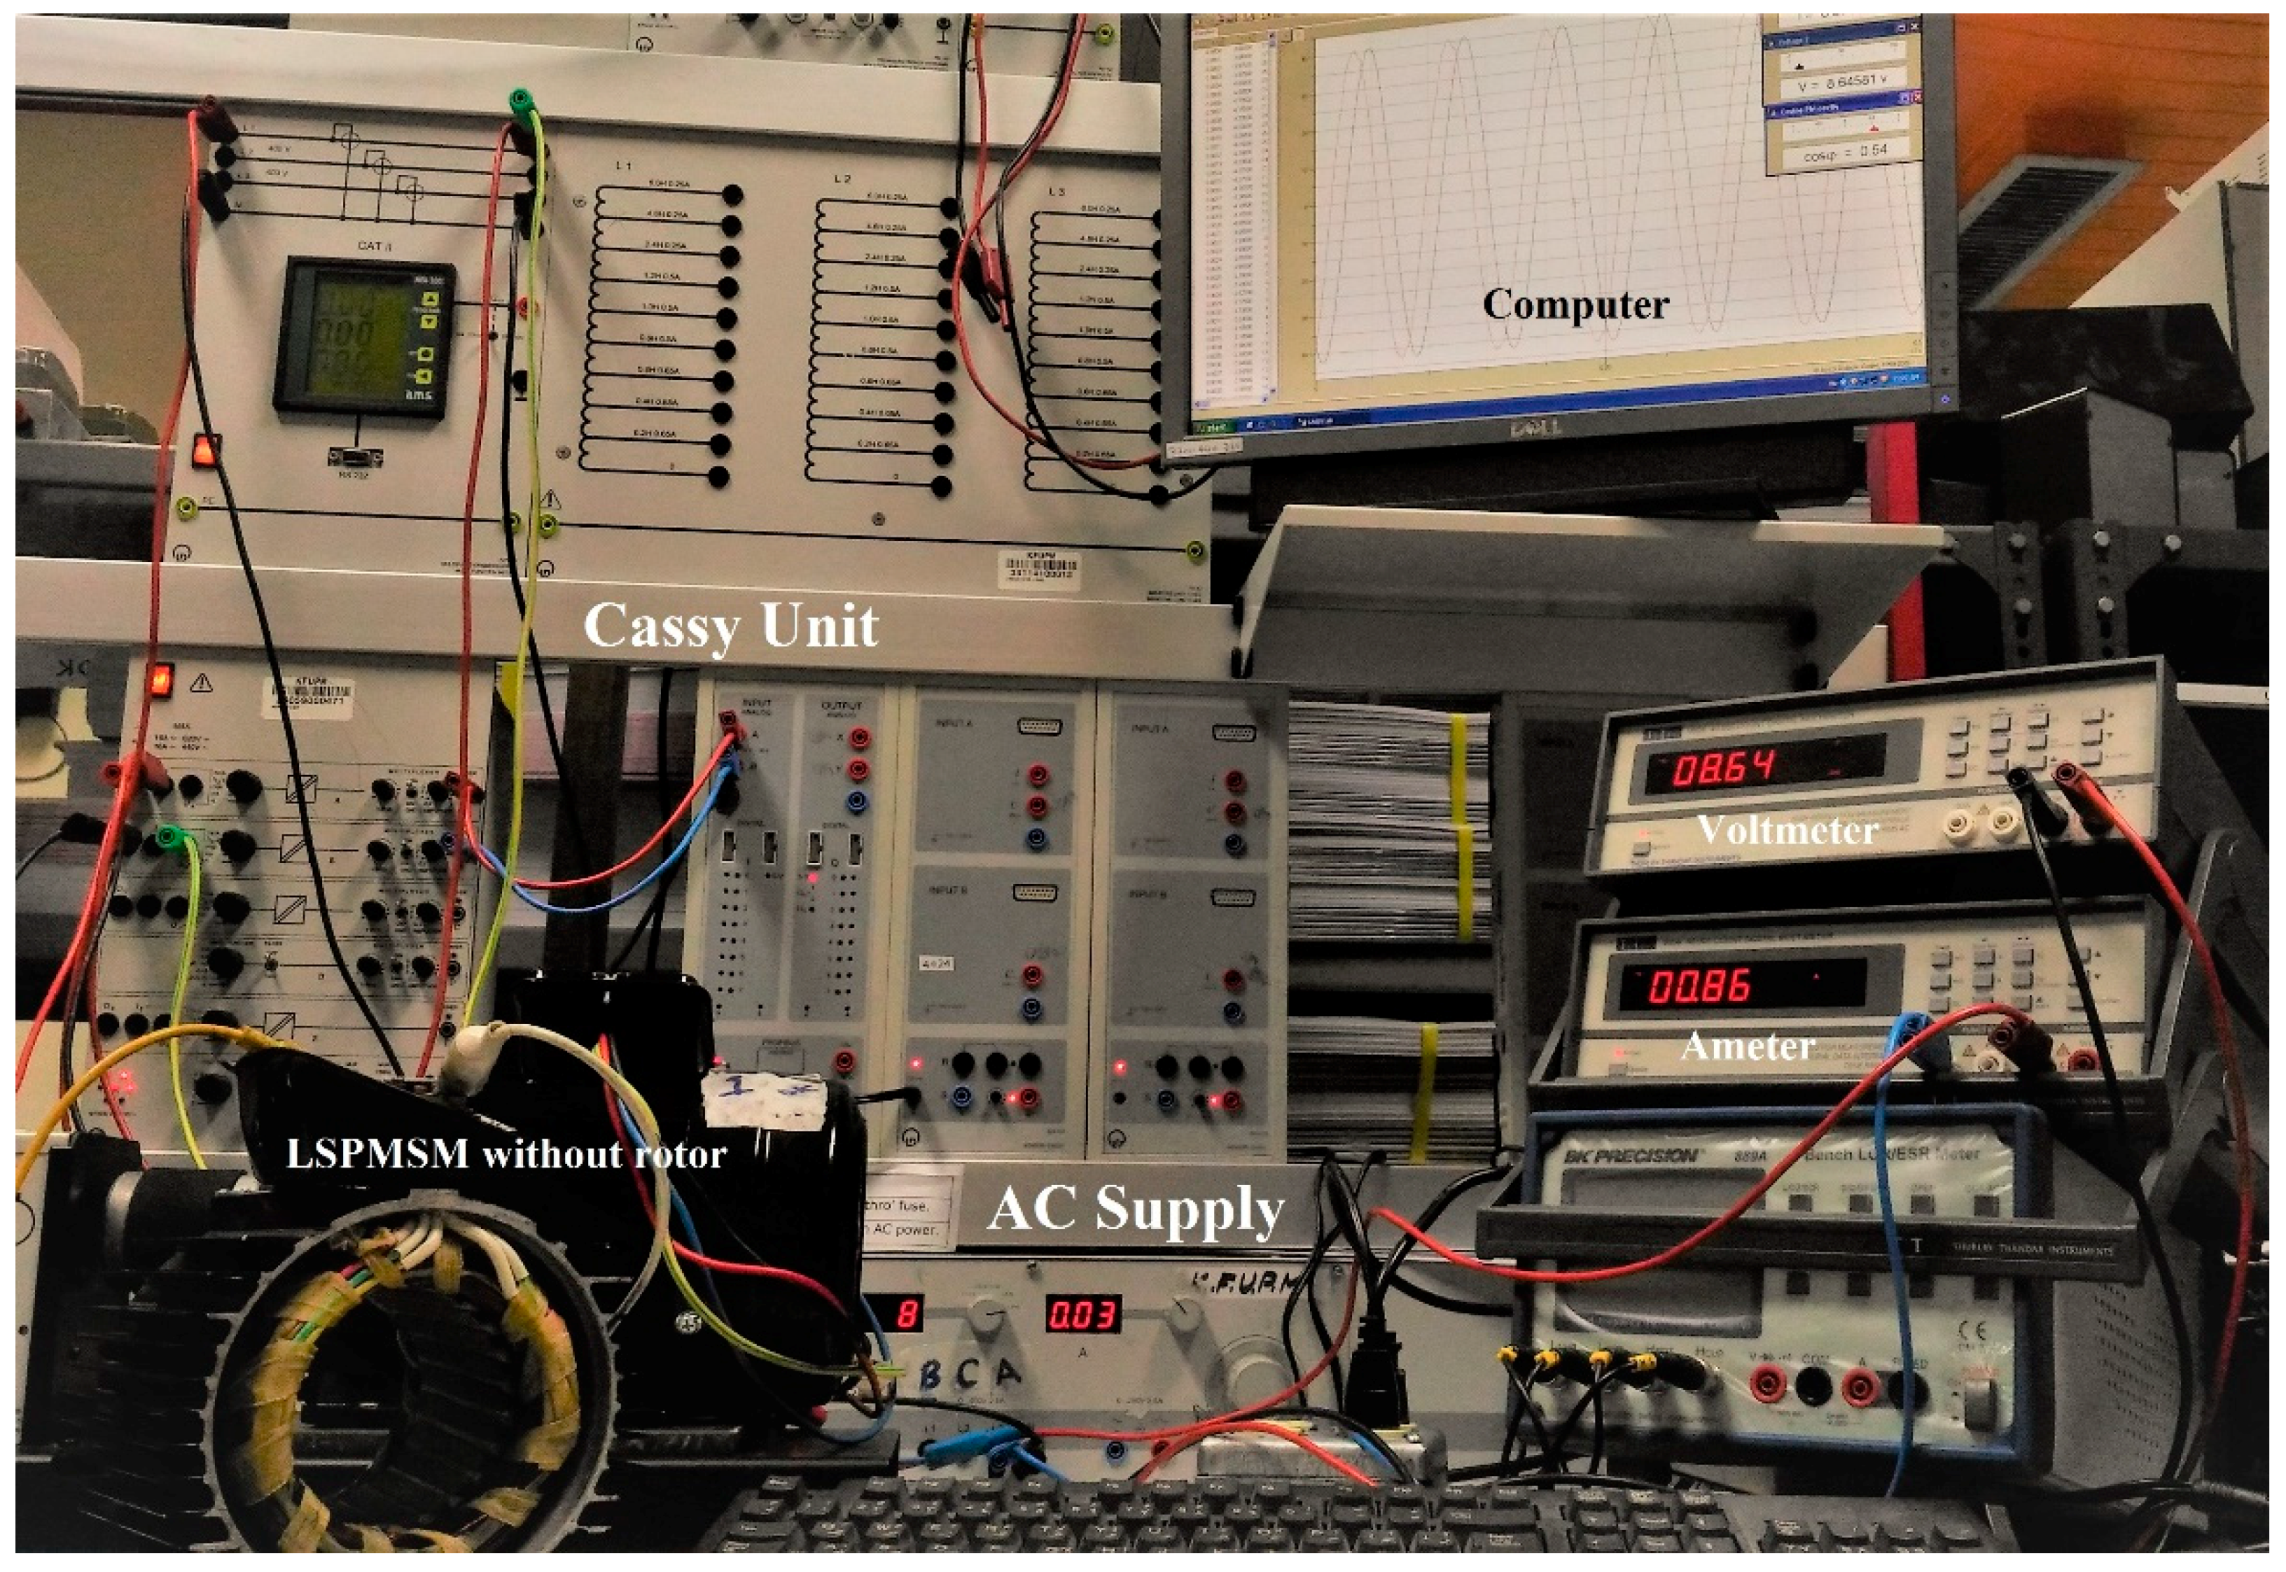
3.2. Single Phase AC Test (Rotor Not Included)

In the single phase AC test (rotor not included) both the AC resistance ( r s ) and leakage inductance ( L l s ) per phase are measured [39]. During this test, the rotor of the machine is pulled out while a single phase of the stator is connected to a variable AC voltage source as shown in Figure 5. Figure 6 shows the circuit diagram of the test. Based on the circuit analysis, the resistance r s and the leakage inductance L l s can be calculated by using Equations (12) and (13), respectively, as follows:
r s = V ϕ I ϕ cos θ
L l s = ( 1 2 π f ) × ( V ϕ I ϕ sin θ )
Using Equations (2) and (3), the applied phase voltage ( V ϕ ), the corresponding current ( I ϕ ) and the phase shift ( θ ) between them are required to calculate the stator resistance and the leakage inductance. Therefore, an AC power supply, ammeter, voltmeter, CASSY unit, and a computer were used to perform the test as shown in Figure 7.

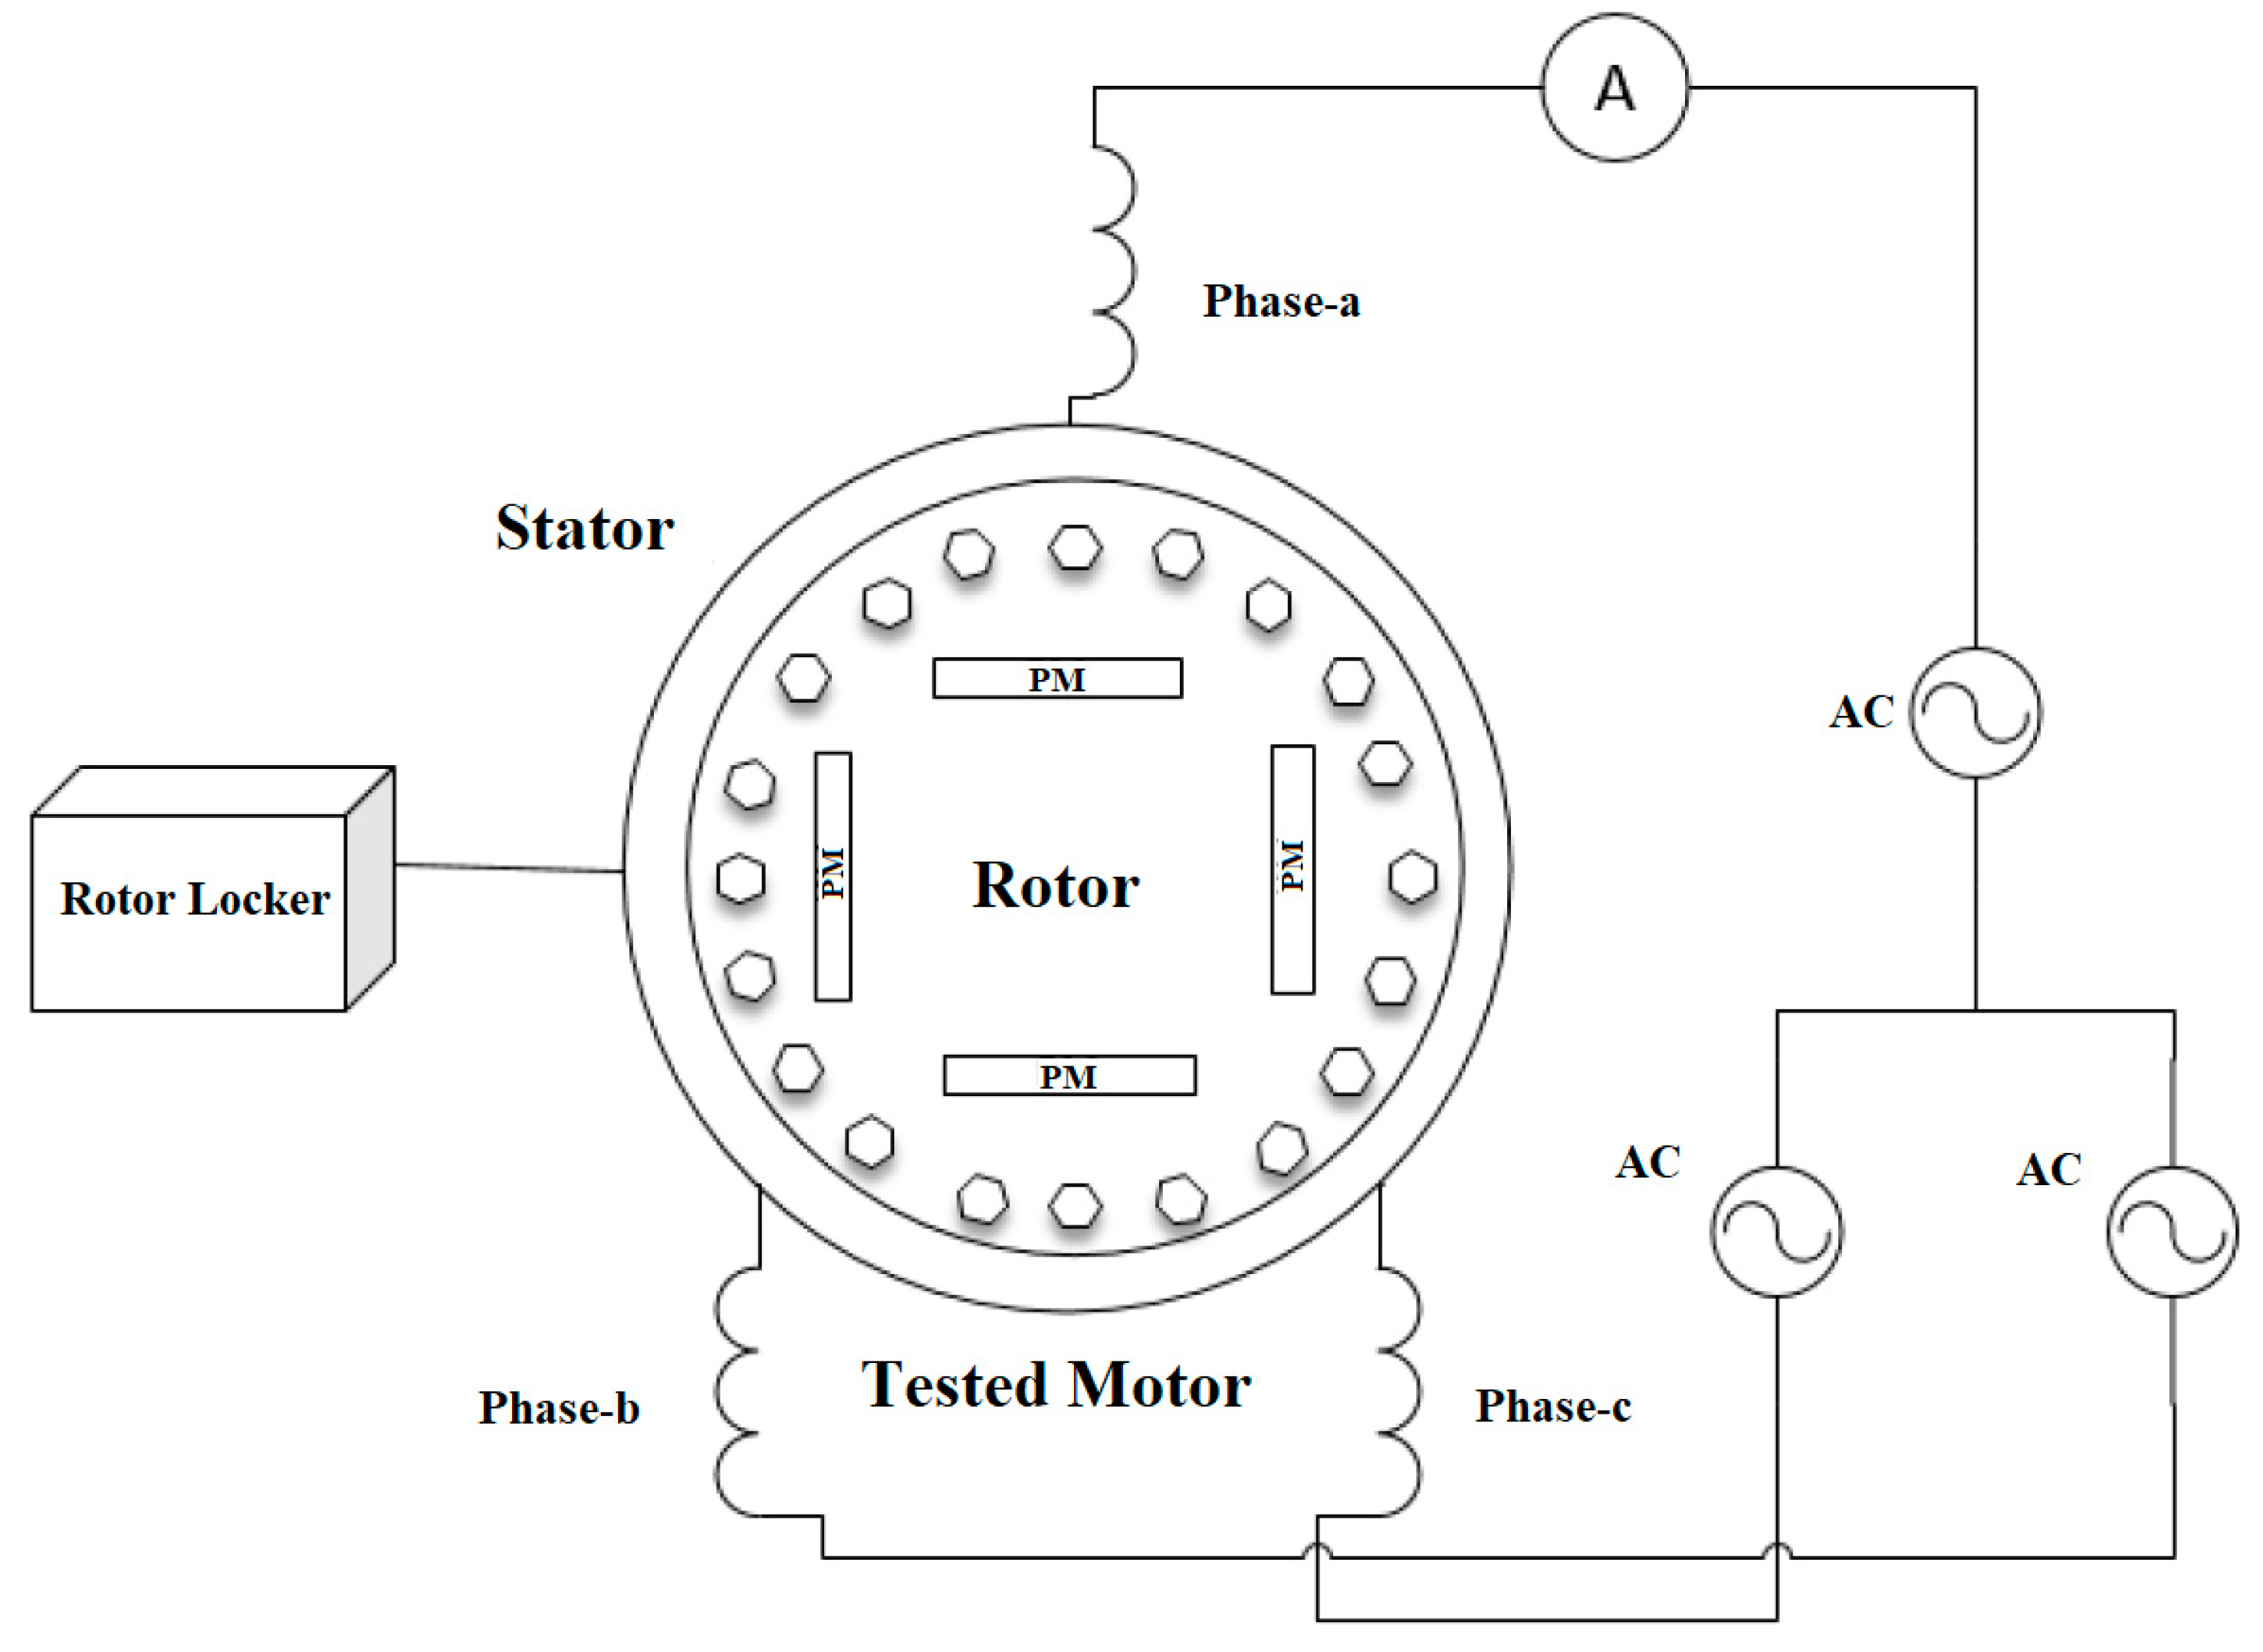
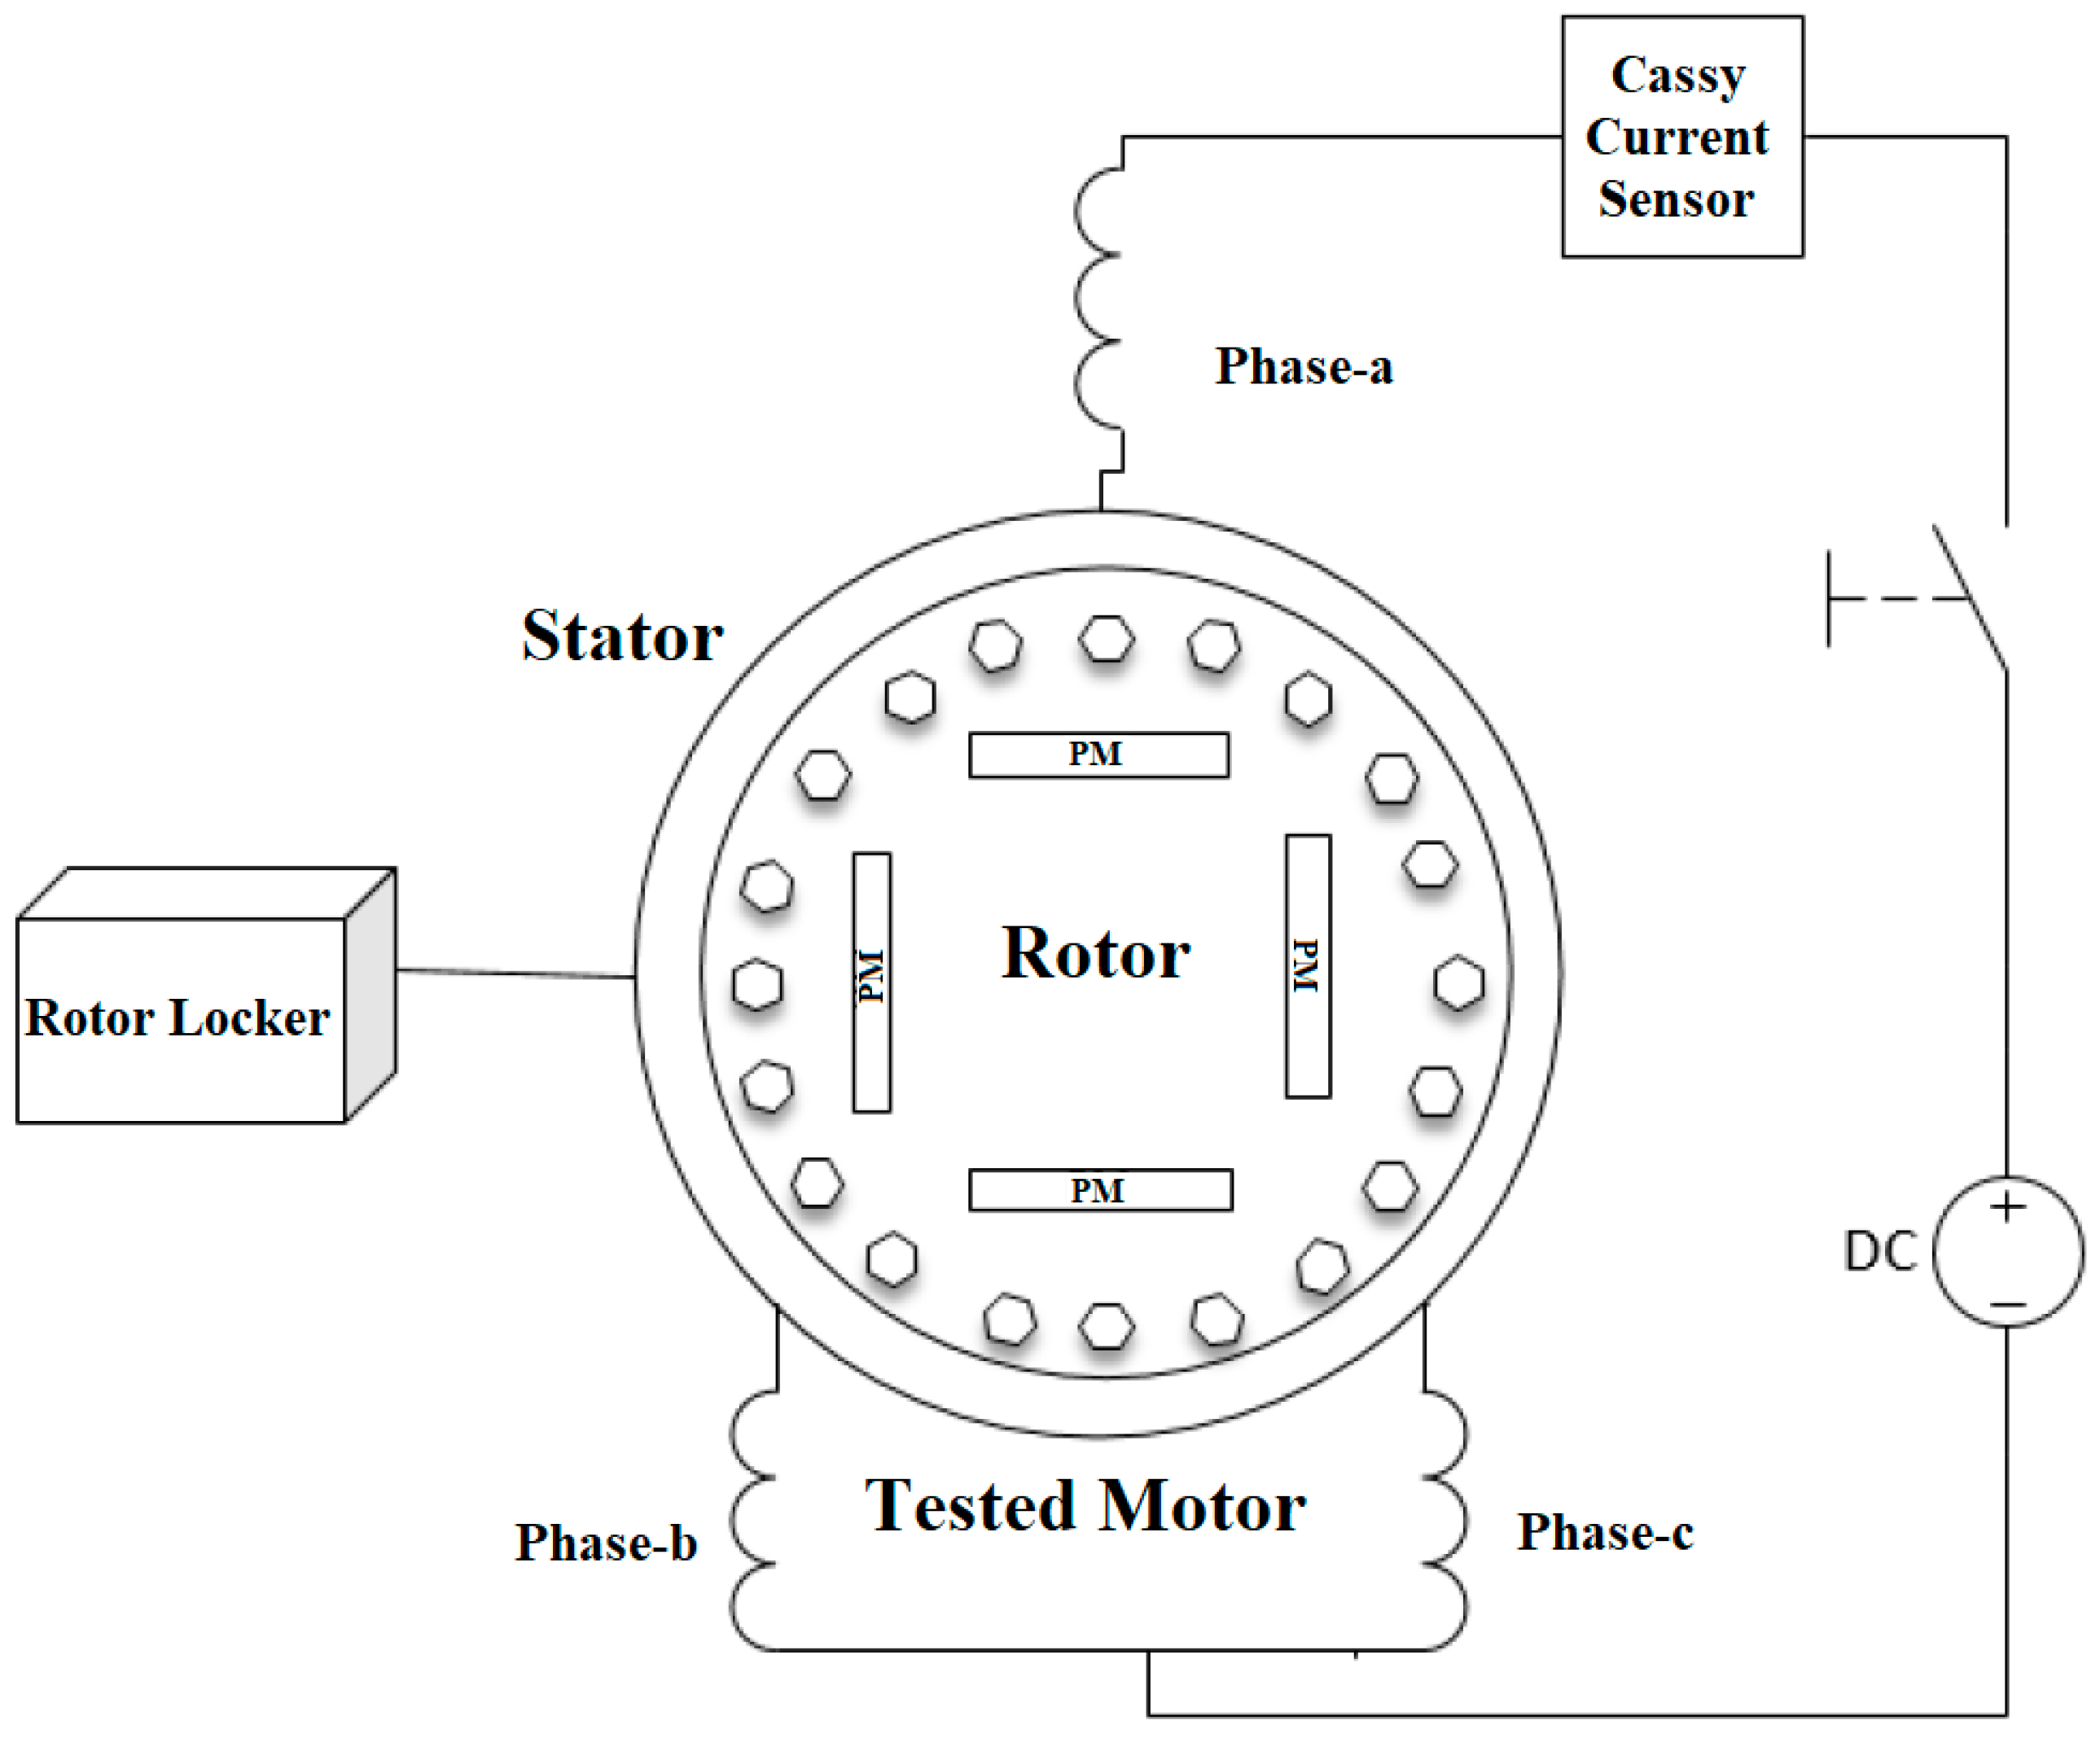
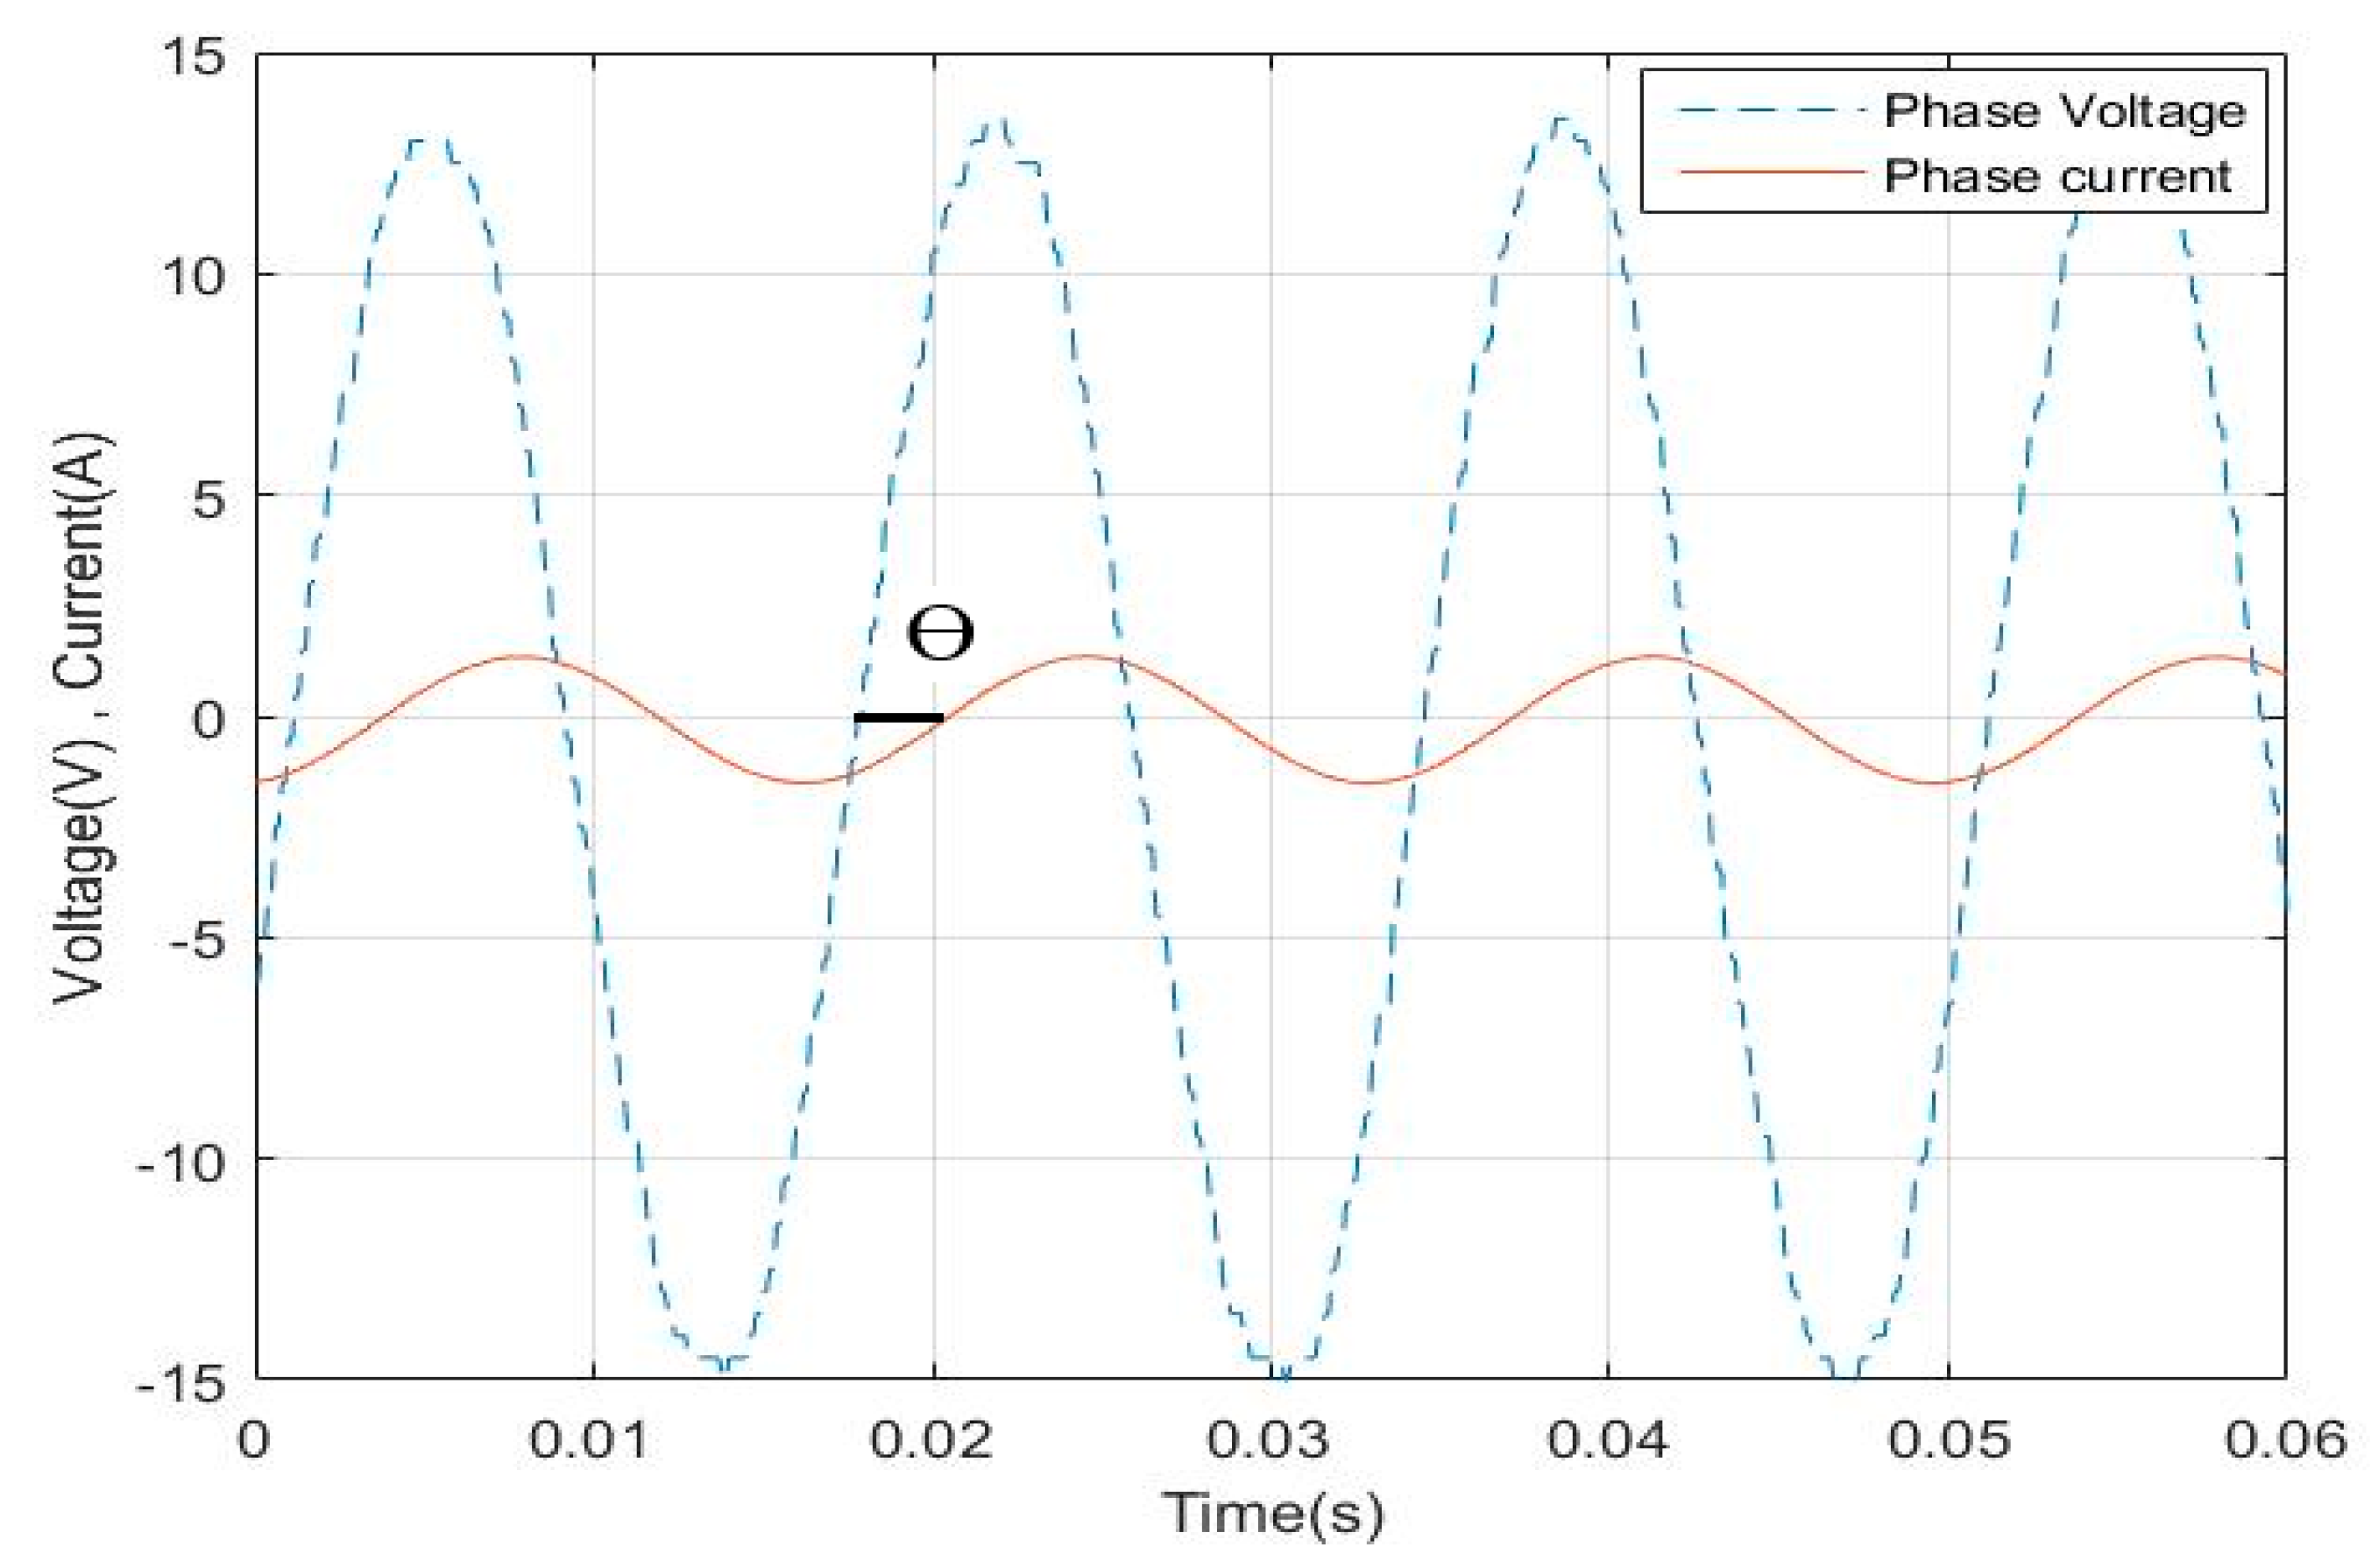
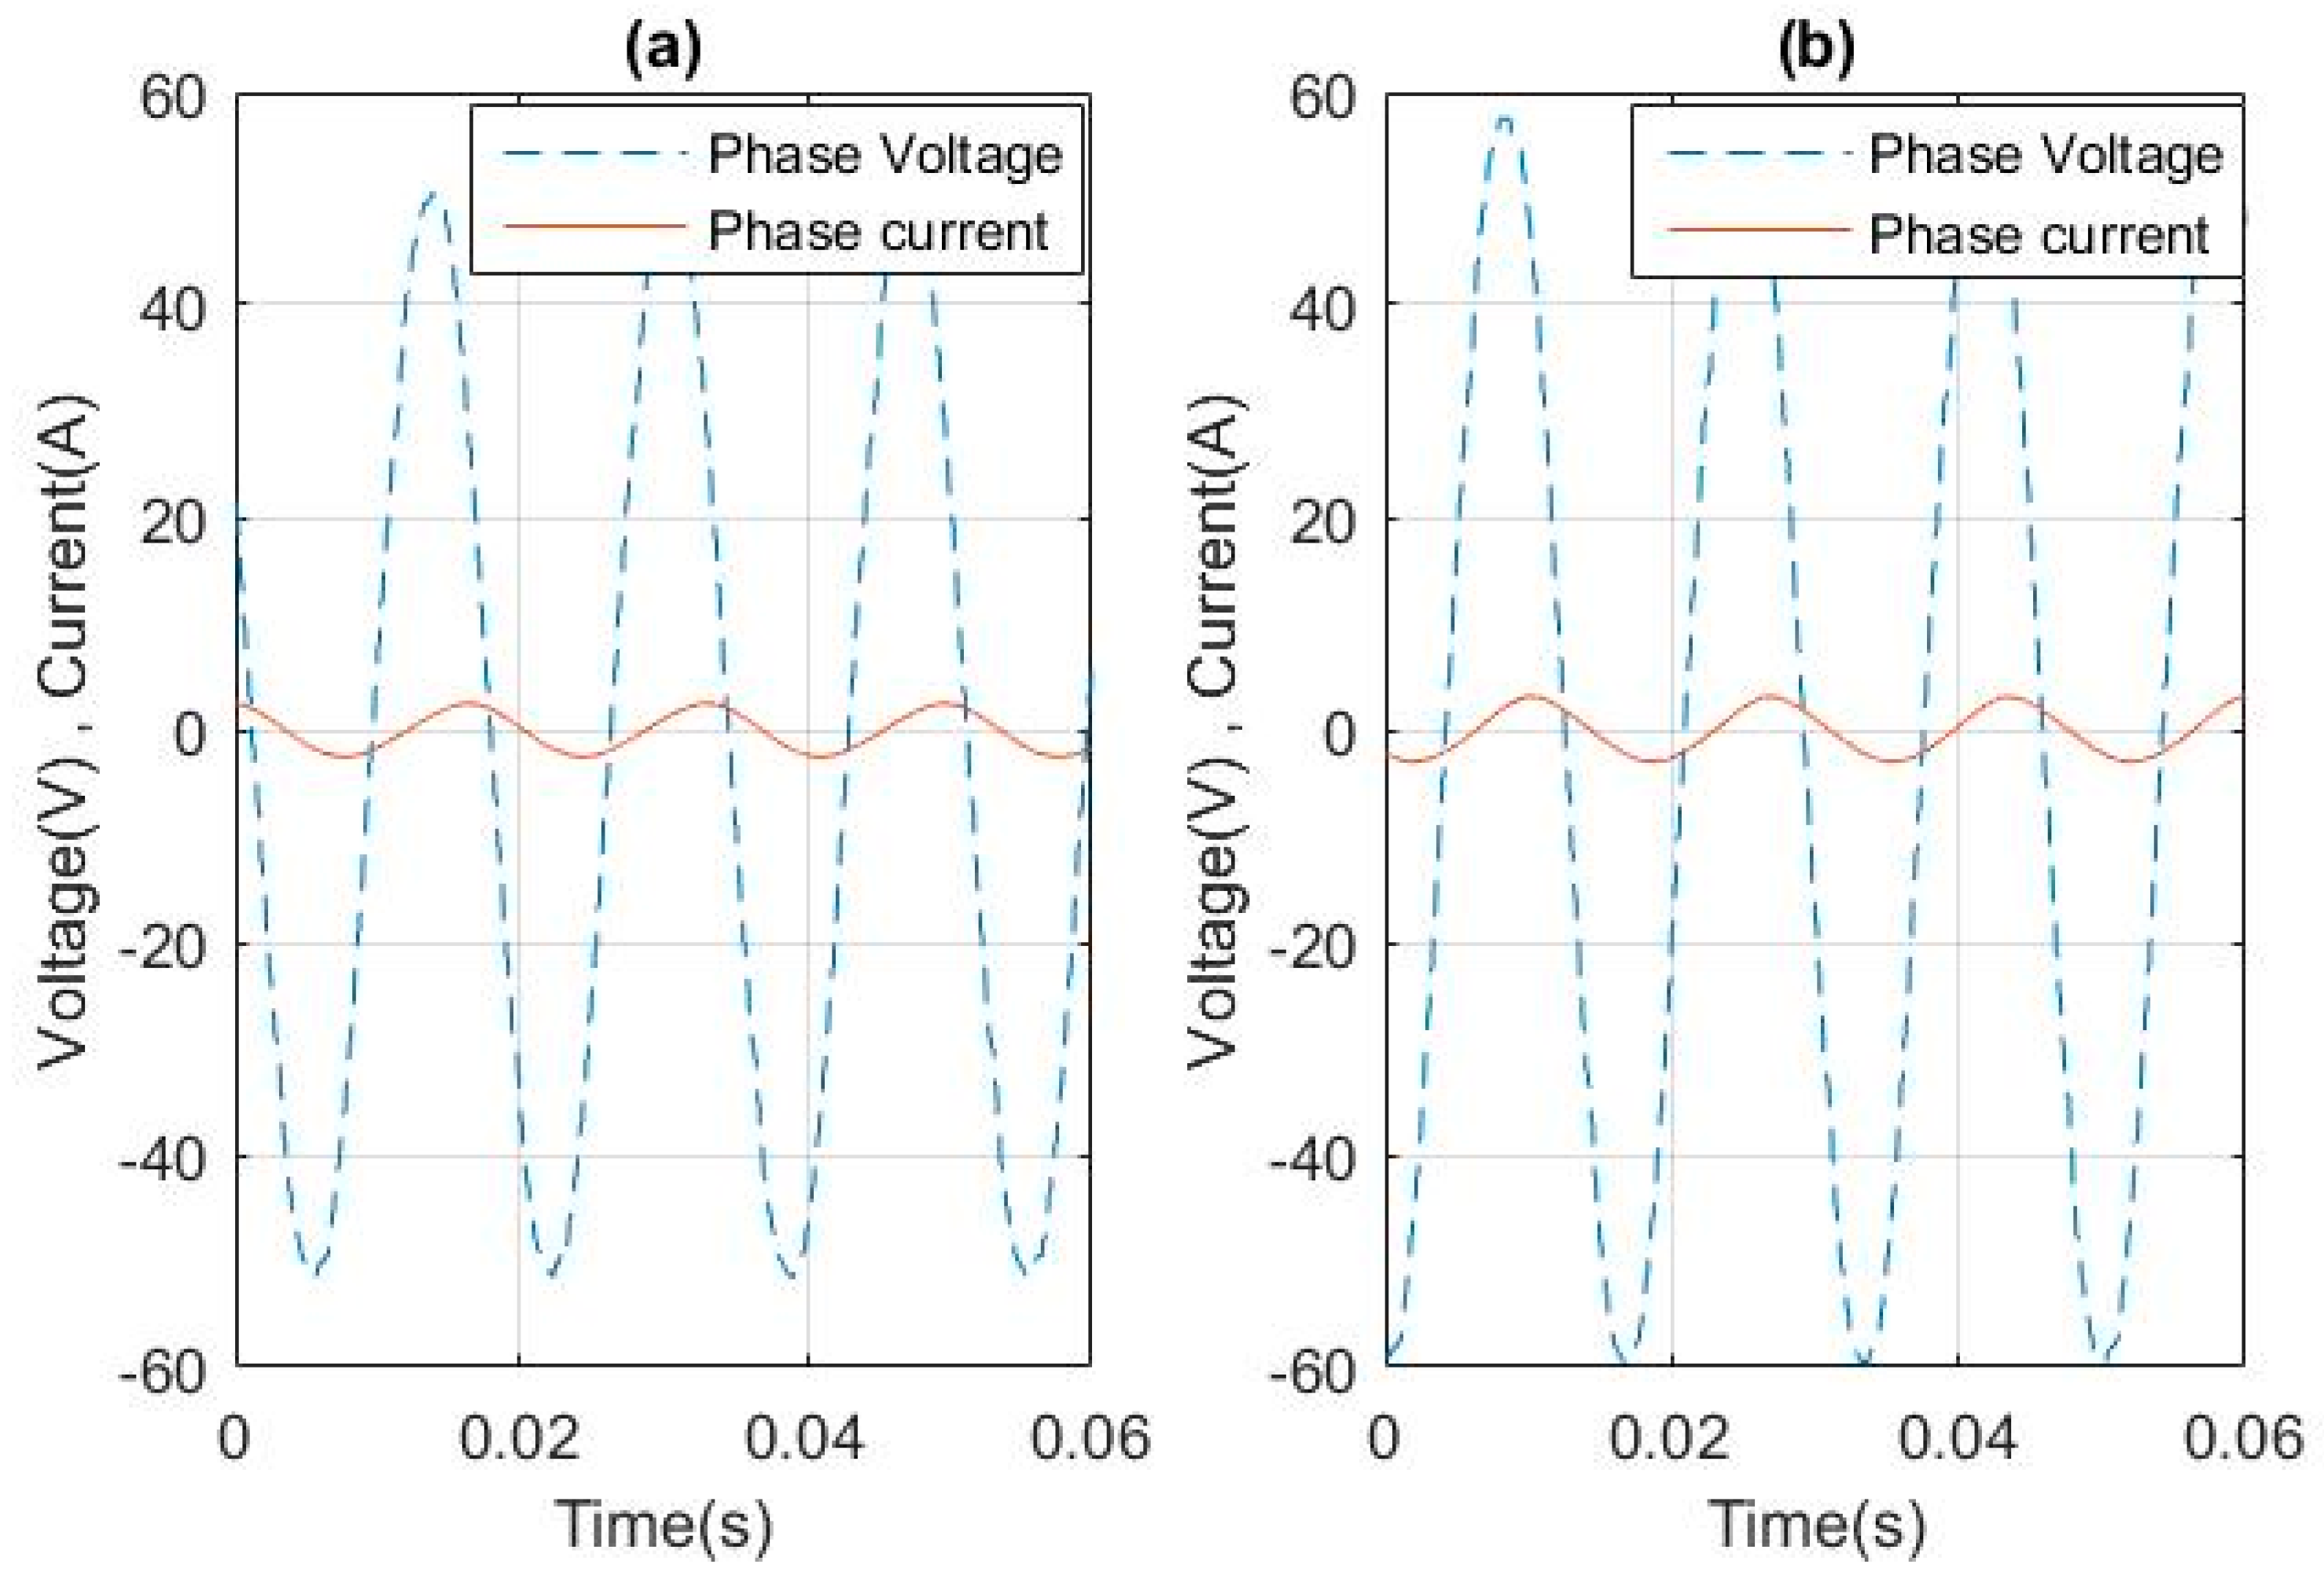
3.3. Locked Rotor Test
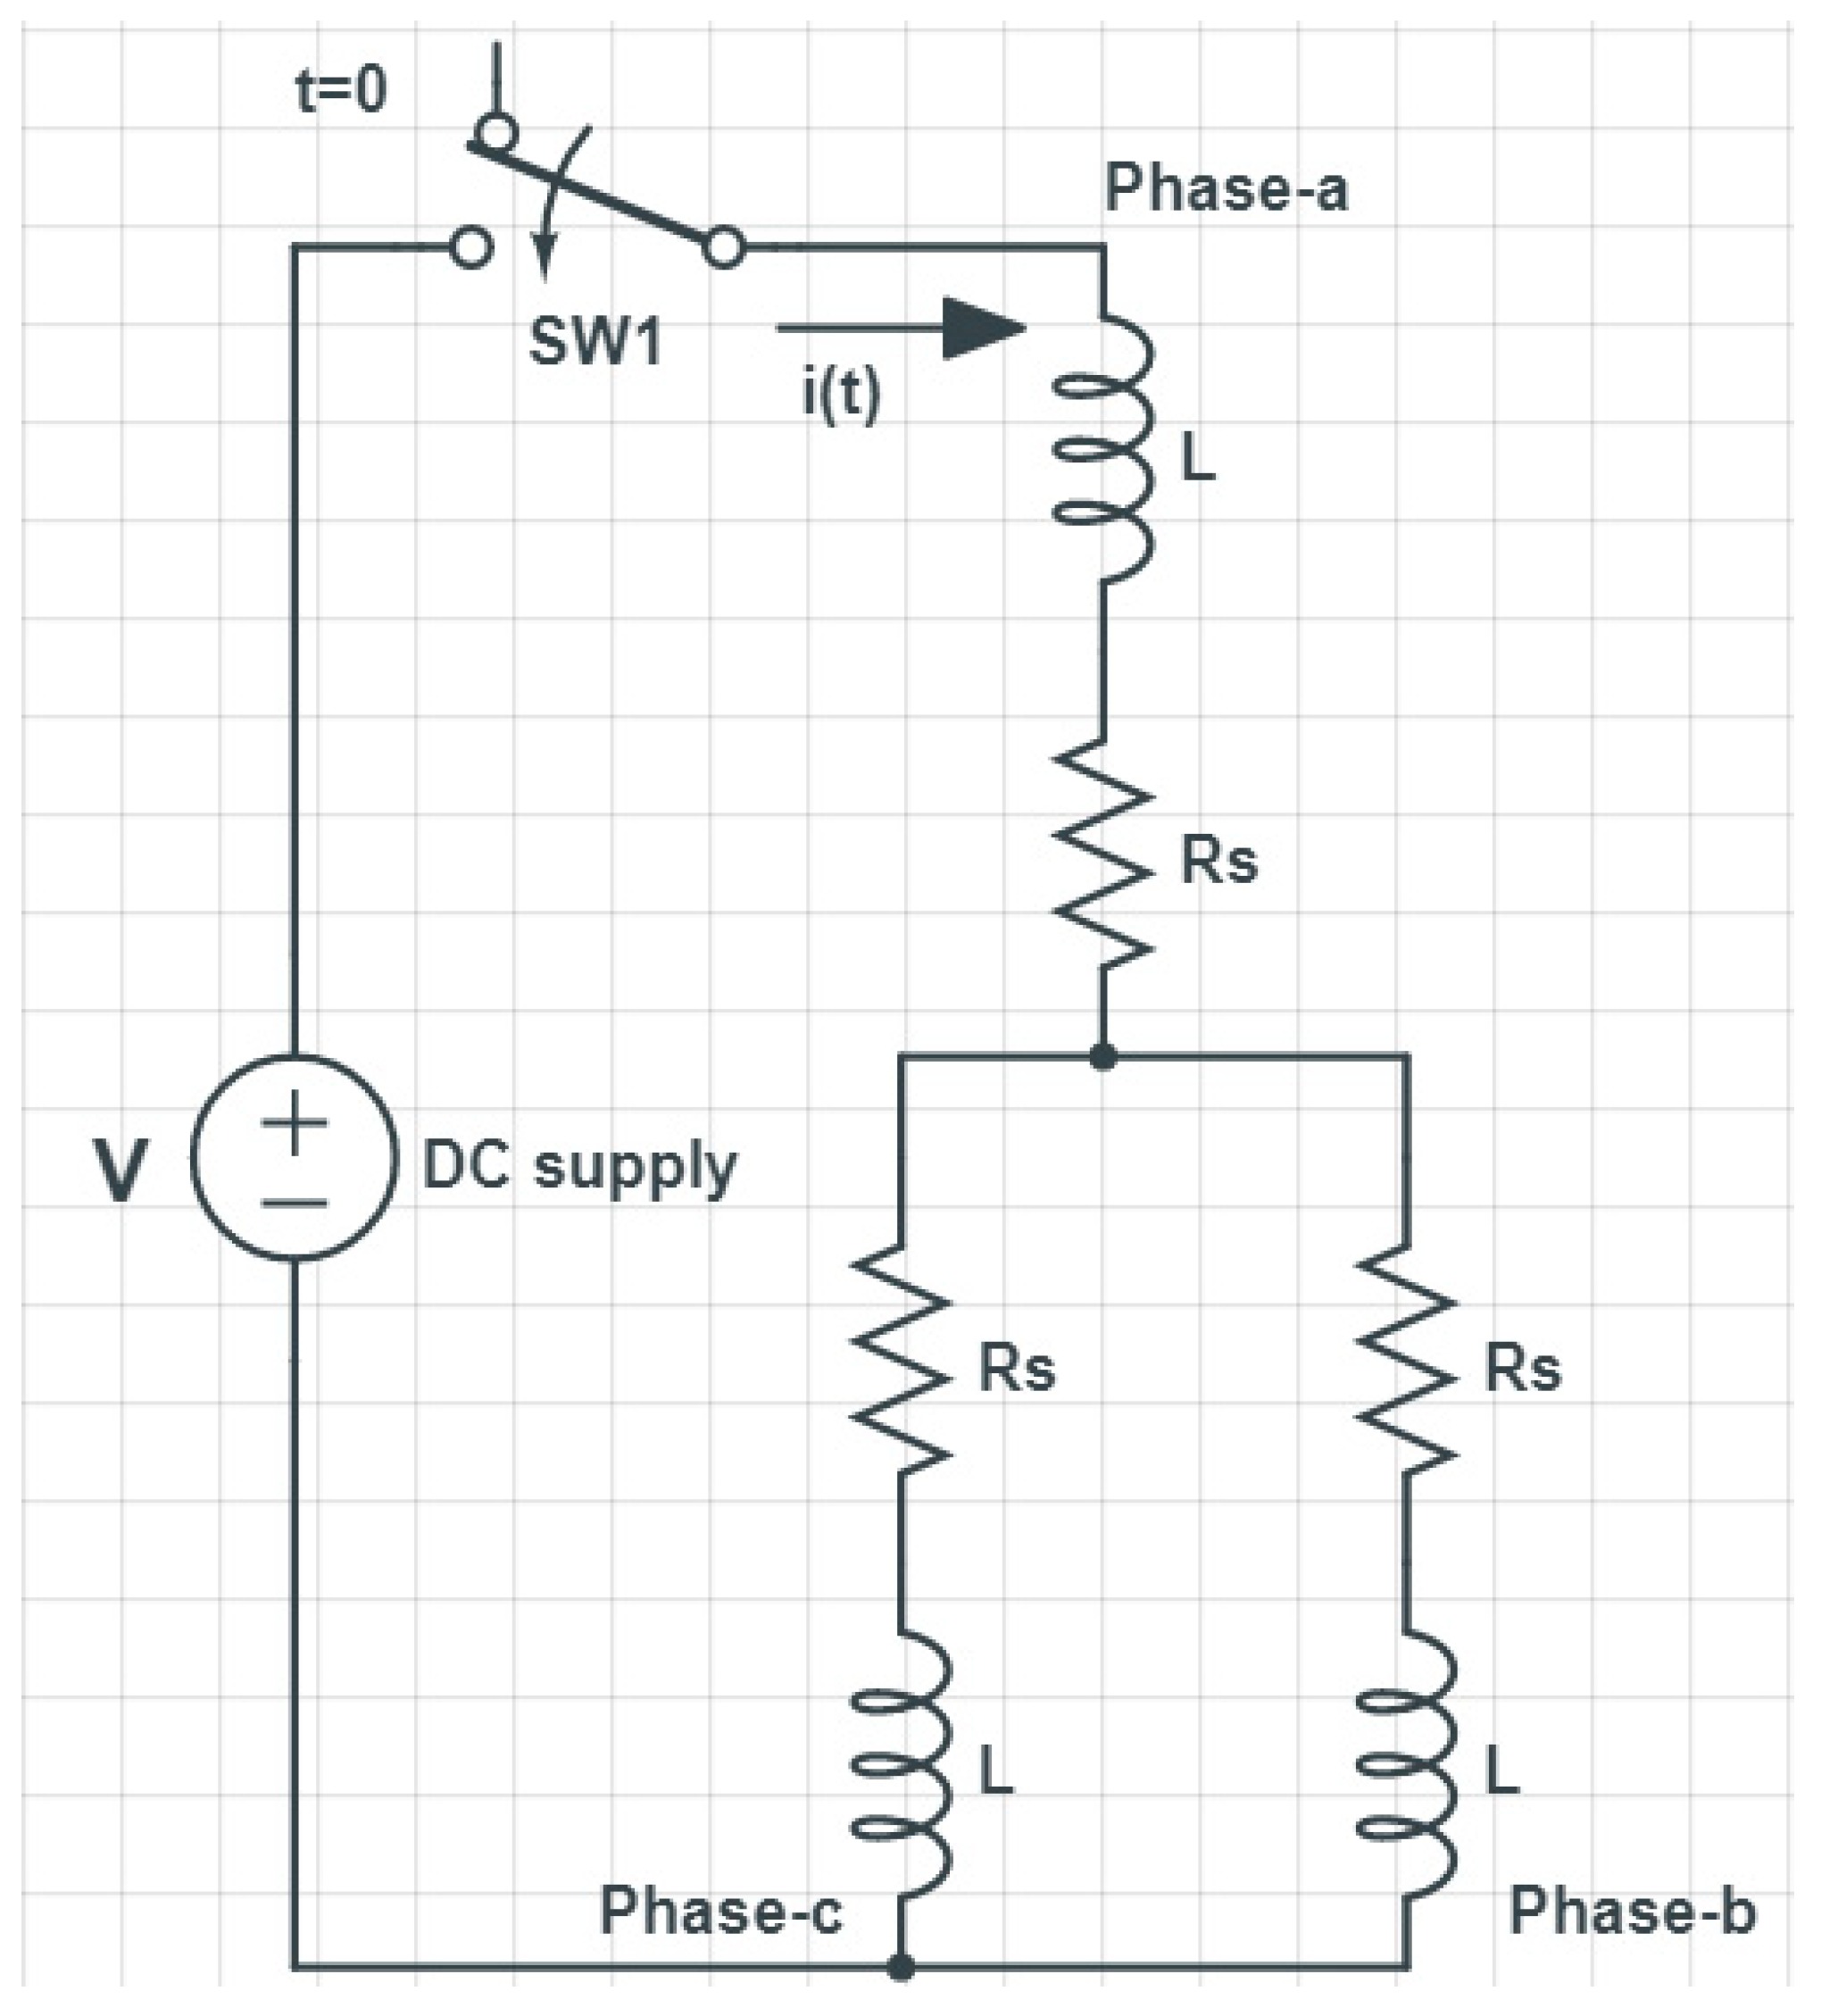
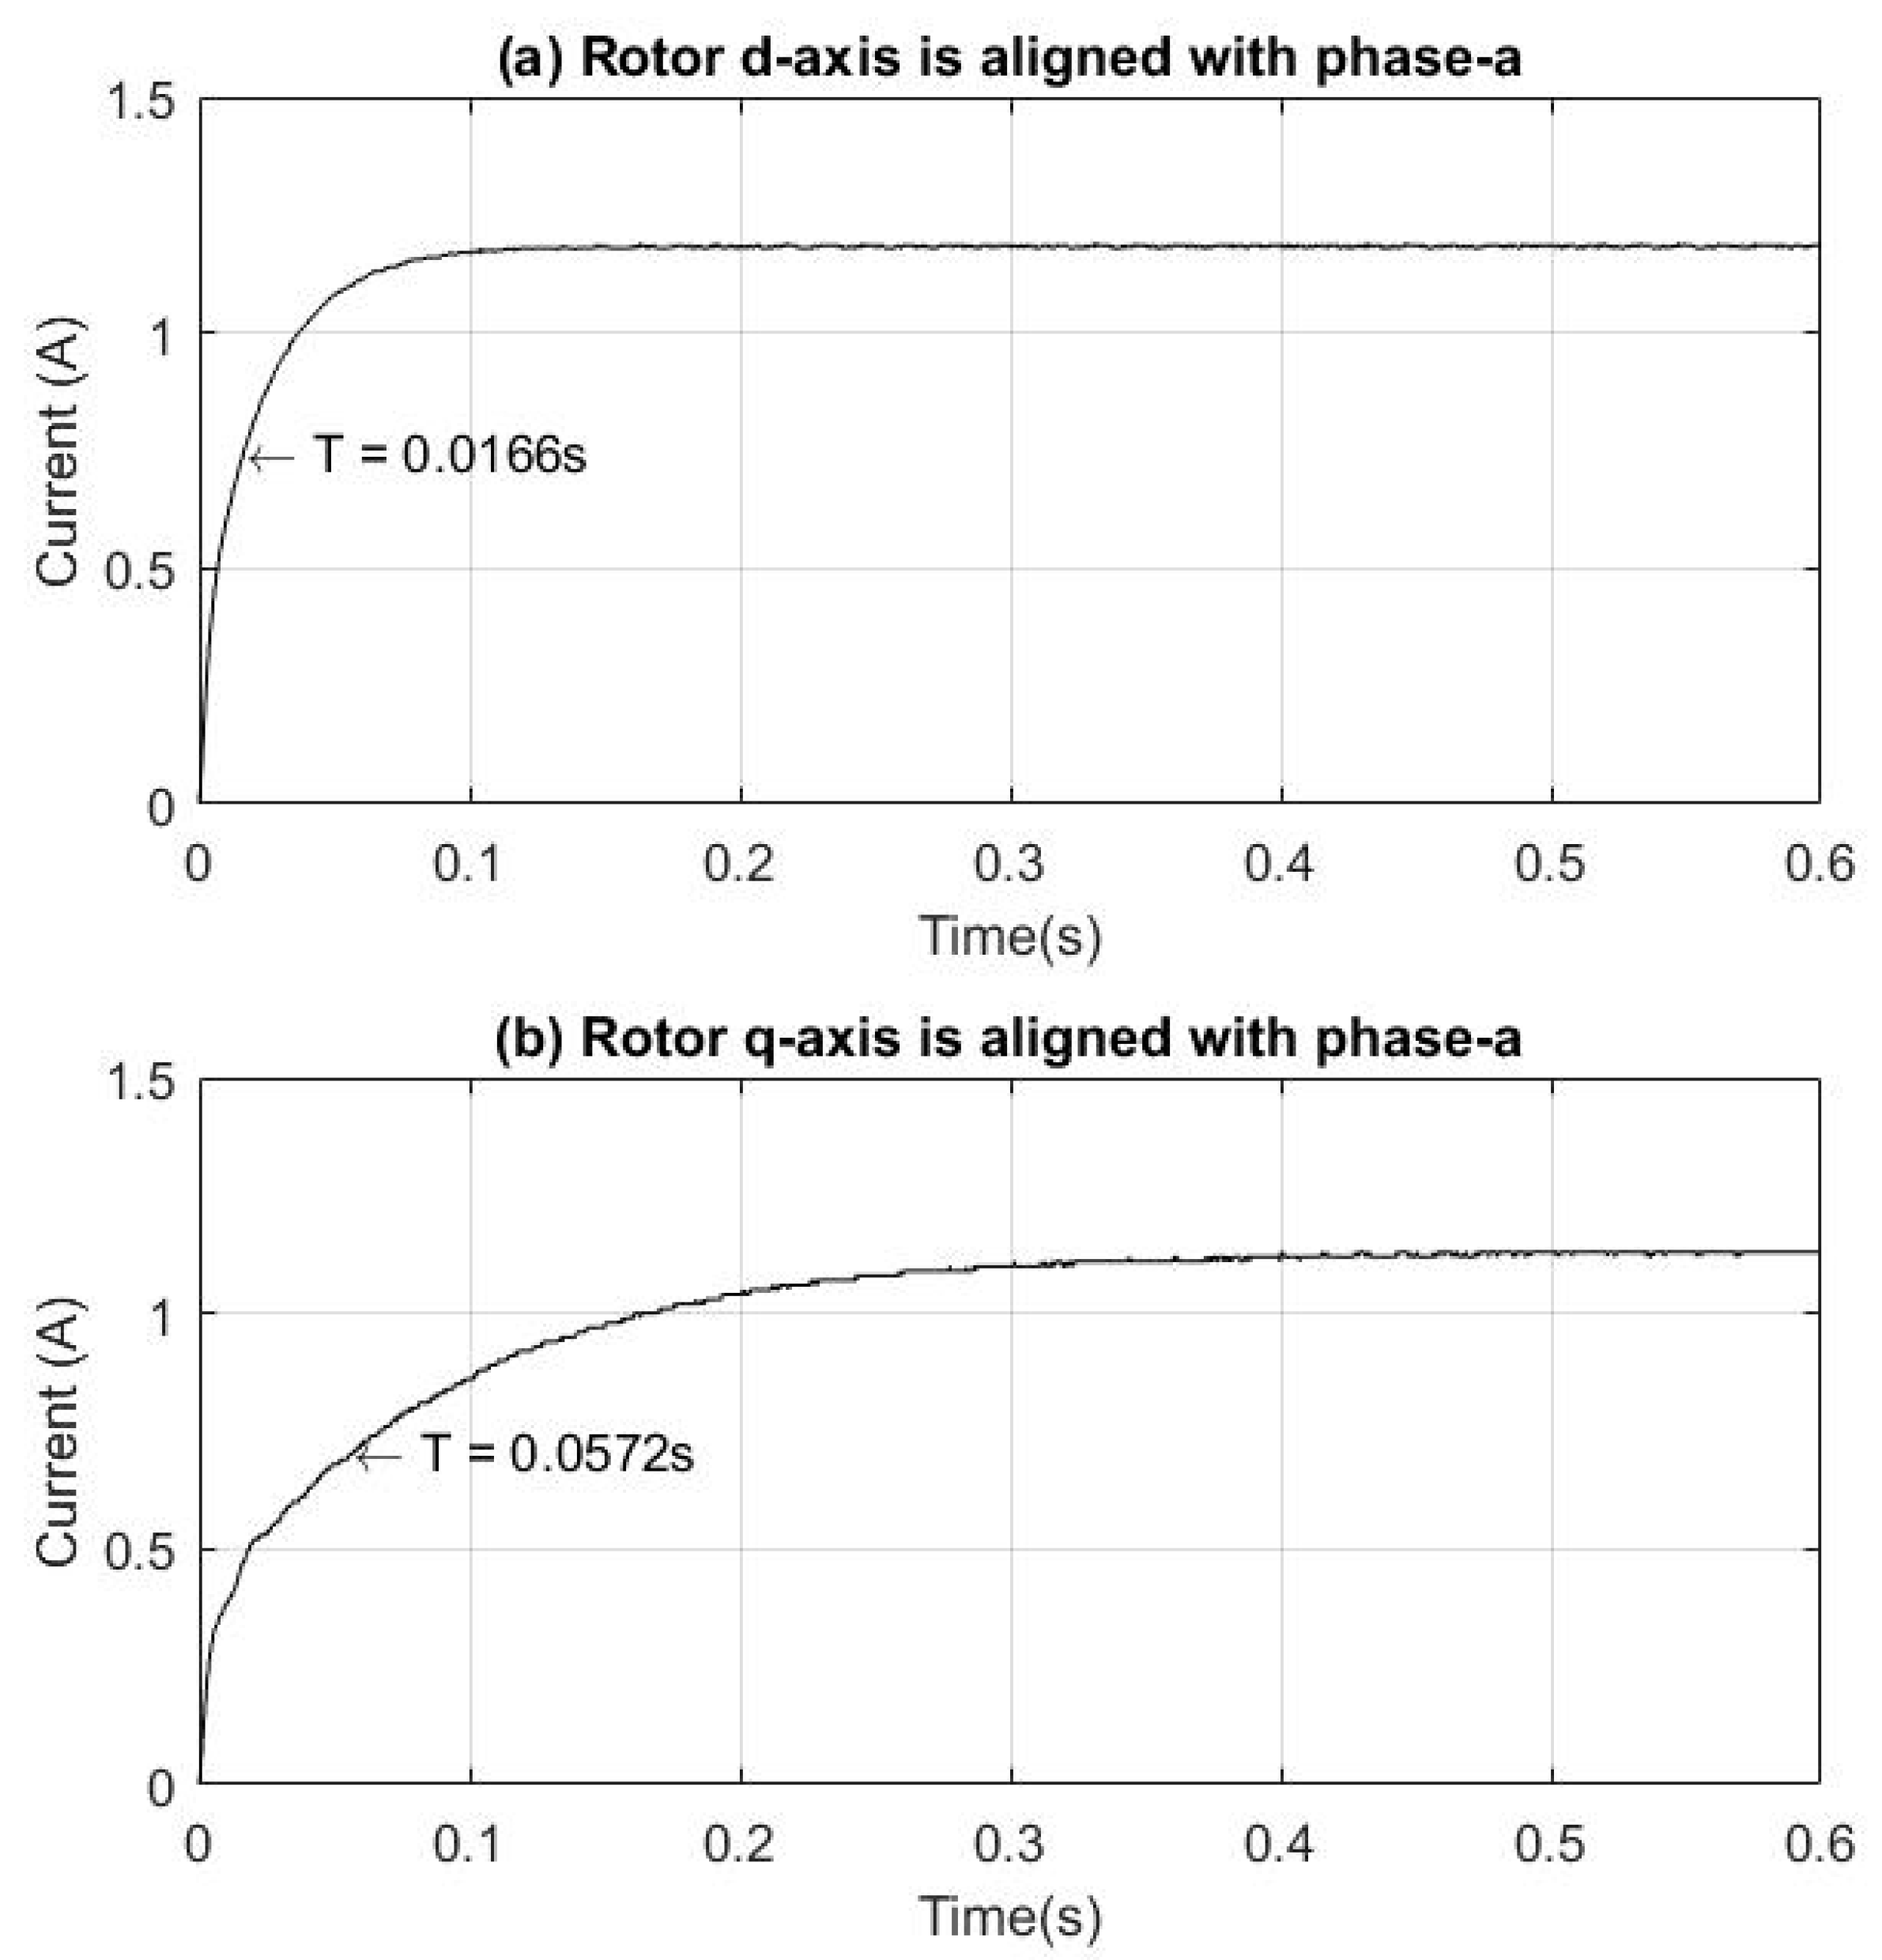
Rotor resistance and leakage inductance are measured using the locked rotor test [40,41]. During the test, the rotor is locked while the stator phases are connected to a low three phase voltages as shown in Figure 8. Under these conditions L m q and L m d are considered to be open-circuit. Also, all dependent sources in the equivalent circuits of the motor in d- and q-axis are shorted. Figure 9a,b show the final q- and d-axis equivalent circuits during the locked rotor test, respectively. Where r r q is the rotor resistance in q-axis, L l r q is the rotor leakage reactance in q-axis, r r d is the rotor resistance in d-axis and L l r d is the rotor leakage reactance in d-axis.
To measure the rotor parameters in d- and q-axis, the rotor is locked in two different positions by using a DC voltage source. In the first position, the rotor d-axis is aligned with phase-a of the stator. To do that, the stator phase-a is connected to the positive terminal of the DC voltage source while the b- and c- phases are connected to the negative terminal of the same source. In this position, both the rotor resistance and leakage inductance in d-axis can be measured. In the second position, the rotor q-axis is aligned with phase-a of the stator. To do that, the stator phase-a is kept floating, phase-b is connected to the positive terminal of the DC voltage source whereas phase-c is connected to the negative terminal of the same source. In this position, both the rotor resistance and leakage inductance in q-axis are measured.
To measure the rotor d-axis parameters ( r r d and L l r d ), the rotor is locked in the first position, and three-phase low voltages are subsequently applied at the stator phases as shown in the experimental set-up in Figure 10. The applied voltage per phase V ϕ , the current I ϕ and the angle θ between them are recorded. By using these results from the locked rotor test, the input resistance ( R i d ) and the input reactance ( X i d ) of the stator side for the equivalent d-axis circuit can be calculated using Equations (14) and (15). Finally, the rotor resistance and the leakage inductance are calculated.
R i d = V ϕ I ϕ cos θ = r s + r r d
X i d = V ϕ I ϕ sin θ = X l s + X l r d
To measure the rotor q-axis parameters ( r r q and L l r q ), the rotor is locked in the second position, and three-phase low voltages are applied at the stator phases. The same process done in the first position is then repeated while the input voltage and current waveforms for the locked rotor test are recorded. It is worth mentioning that during the locked rotor test the measured current should not exceed the rated current of the machine in order to prevent the stator winding from damage. In this case, the applied voltage will be of small values compare to rated values.

3.4. DC Step Test

The purpose of the DC step response test is to measure the d- and q-axis synchronous inductances ( L d and L q ) [42,43]. During this test, the rotor of the motor is locked in the two positions as in the case of the locked rotor test. In the first position, the synchronous inductance in d-axis is measured while in the second position, the synchronous inductance in q-axis is measured. Figure 11 shows the schematic diagram of the DC test conducted in this study. It is worth mentioning that the most used test for measuring the synchronous reactance for synchronous motor in d- and q-axis is the slip test. in the slip test, the field winding is open-circuit (the excitation is removed) and the rotor is derived by a prime mover. However, the slip test is not applicable to LSPMSM since we cannot remove the excitation. Therefore, this is why we used the DC test where the rotor is locked (rotor stationery) no flux variation from the PMs on the rotor bars and stator windings.
Based on circuit theory, the equivalent circuit of the tested motor during the test is a resistance-inductance circuit, as shown in Figure 12. Therefore, the current in the circuit can be described by Equation (16) as follows:
i ( t ) = V R ( 1 e t τ ) t 0 τ = L t R
where V is the DC source voltage, τ is the time constant, R is the equivalent resistance seen by the source which is equal to 1.5 R s , L t is the equivalent inductance seen by the source which is equal to 1.5 L , R s is the DC resistance measured in the DC test presented above. L is the inductance of the motor which is a function of the rotor position. L can be replaced by L d if the rotor d-axis is aligned with phase-a or replaced by L q if the rotor d-axis is aligned with phase-a. Accordingly, by using the step response plot, the time constant can be measured, which is then used to calculate L d and L q using Equation (16).
The magnetizing inductance ( L m d and L m q ) can be calculated using Equations (17) and (18) as follows:
L m d = L d L l s
L m q = L q L l s

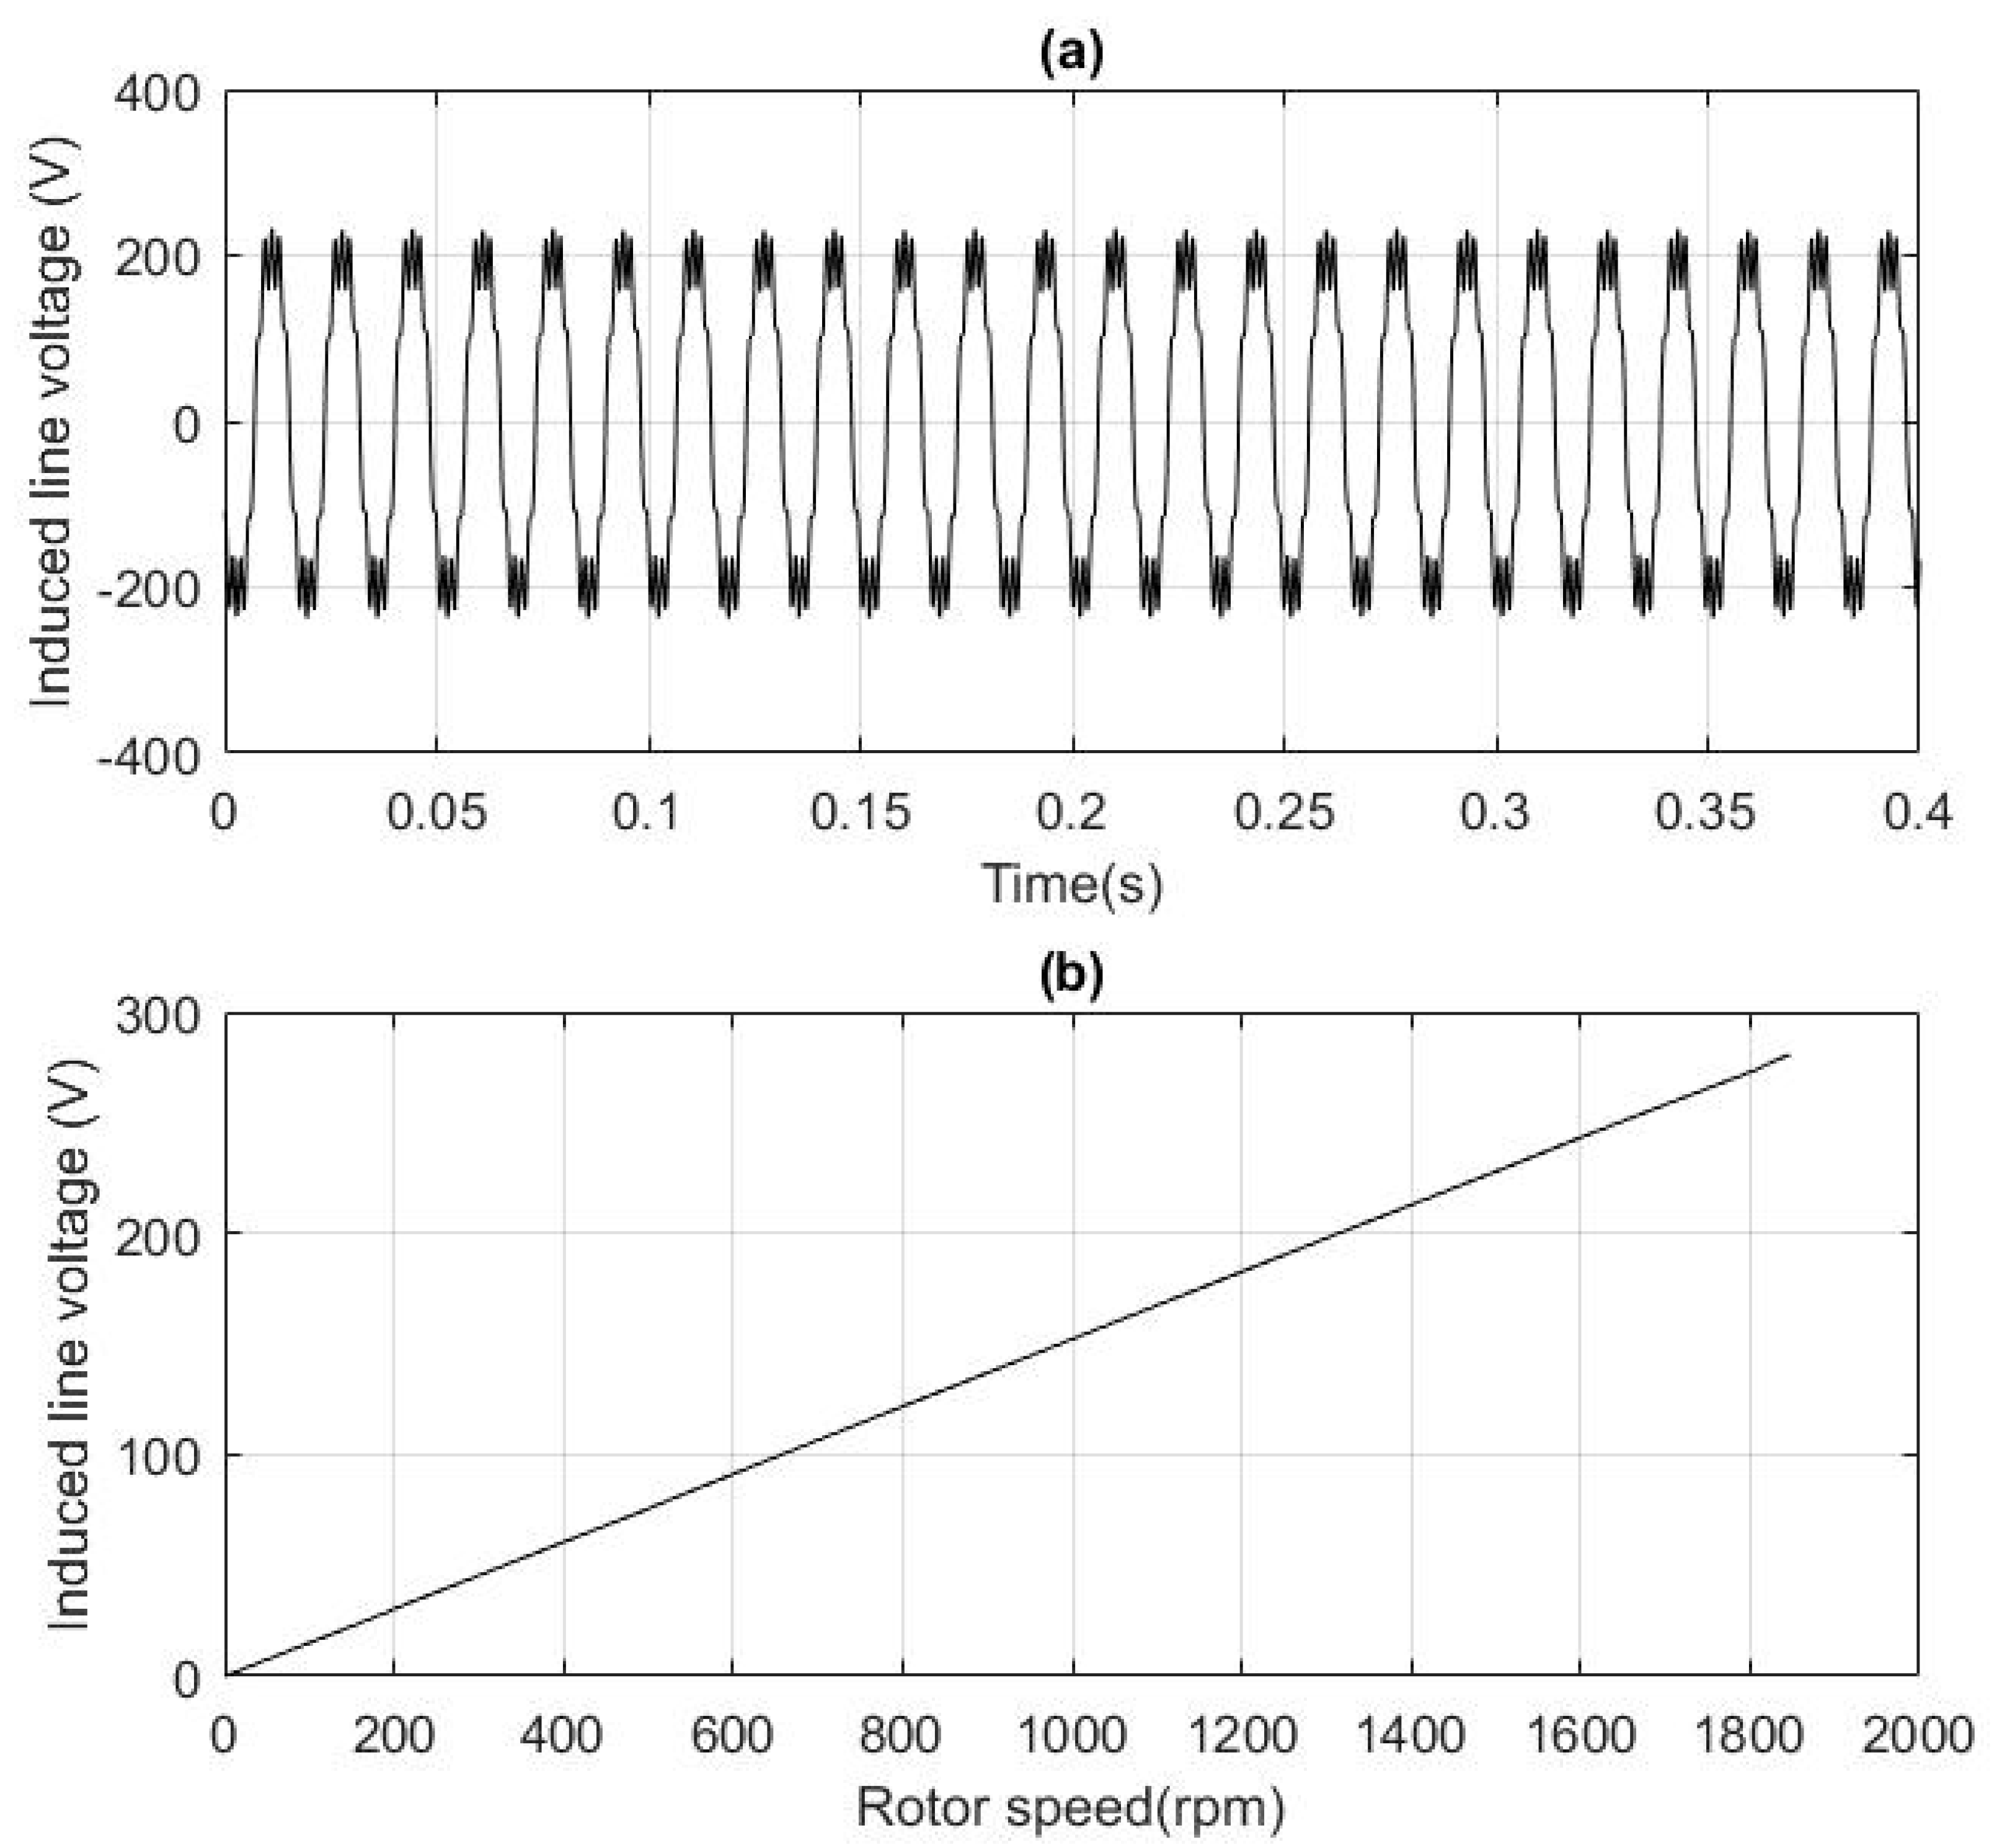
3.5. Open-Circuit Test

In the open-circuit test, the linkage flux of the rotor permanent magnets ( λ m ) on the stator side is measured [44,45]. During the open-circuit test, the tested machine is treated as a prime mover (DC Machine), whereby no AC supply is connected to the motor stator phases as shown in Figure 13. Therefore, an induced voltage which is related to the speed of the rotor and the flux of the permanent magnet on the stator side is created in the stator winding.
Since the stator is kept open, there is no current through the stator windings. Besides, an induced voltage with electrical frequency equal to rotor electric velocity is generated in the stator of the tested machine. Therefore, there is no induced current through the rotor bars. Accordingly, under these conditions the d- and q-axis stator voltages and flux-current are represented in Equations (19) and (20):
λ q s = ( L l s + L m q ) i q s + L m q i q r λ q s = ( L l s + L m q ) 0 + L m q 0 λ d s = ( L l s + L m d ) i d s + L m d i d r + λ m λ d s = ( L l s + L m d ) 0 + L m d 0 + λ m
v q s = d d t λ q s + r s i q s + ω r λ d s v q s = 0 + r s 0 + ω r λ m v d s = d d t λ d s + r s i d s ω r λ q s v d s = 0 + r s 0 ω r 0 = 0
Therefore:
λ m = v q s ω r = 2 V a b 3 ω r = 2 V a b 3 ω m P 2 = 2 V a b 3 P 2 ( 2 π n m 60 ) = 60 2 V a b 3 P   π n m
Figure 14 shows the experimental set-up of the open-circuit test.

4. Results and Discussion

4.1. DC Test Results

Table 2 shows the DC test results for the tested motor. Ten sets of test results are presented, which were used to find the average value of DC stator resistance. The measured dc resistance obtained using DC test has also been verified using a CPC 100 measurement device ( R s by CPC 100 equal 5.326275 Ω).
It should be noted that the value of the stator resistance in the DC test is not the same as the one used in AC simulation. Hence in DC test, the skin effect that occurs when an AC voltage is applied to the windings is neglected [38,46].

4.2. Single Phase AC Test (Rotor Not Included) Results

Figure 15 shows a sample of the voltage and current waveforms acquired with CASSY and from which the angle between the voltage and current is measured.
The results of the test are displayed in Table 3. The values of AC stator resistance and leakage inductance are 5.5527 Ω and 22.268 mH, respectively. It is clear that these values are also close to the values measured by the CPC 100 device when the rotor is pulled out ( r s = 5.456 Ω and L l s = 22.55 mH).

4.3. Block Rotor Test Results

The results of the test are displayed in Table 4. By using these results from this test, the input resistance ( R i d ) and the input reactance ( X i d ) from the stator side for the equivalent d-axis circuit were calculated using Equation (14) and (15). Subsequently, the rotor resistance and the leakage inductance were calculated, and the results are also recorded in Table 4.
For the locked rotor test result, with rotor q-axis aligned with phase-a, the results of this test are given in Table 5. Based on the modified Equations (14) and (15) by replacing subscript “d” with “q”, the calculated input resistance ( R i q ) and input reactance ( X i q ) from stator side for the equivalent q-axis circuit are also indicated in Table 5. It is clear from these results that the q and d rotor leakage inductances are very close to each other. It is worth mentioning that the results obtained from the block rotor test are close to the those measured by CPC 100 ( r r d = 7.12123   Ω , L l r d = 16.7134   mH , r r q = 8.9213   Ω and L l r q = 18.1225   mH ). The input voltage and current waveforms for the locked rotor test are plotted as indicated in Figure 16.

4.4. DC Step Test Results

Figure 15 shows the step response of the tested machine for the two locked rotor positions. The test is repeated for a set of DC source voltages, whereby the time constant is recorded from the plots as shown in Figure 17. The calculated values of Ld and Lq are listed in Table 6 and Table 7.
In this test, the rotor is locked (q-axis of the rotor is aligned with phase-a of the stator). Therefore, the measured inductance will be of the same value which is maximum at this location. When the rotor rotates, the inductance between the rotor and stator will vary based on the position of the rotor. The magnetizing inductances values Lmd and Lmq were calculated using Equation (17) as 71.496 mH and 260.355 mH, respectively.

4.5. Open-Circuit Test Results

The test is done for a set of different rotor speeds (nm), from which the line voltage Vab is measured and the results are listed in Table 8. By using the measured data in addition to Equation (21), the flux linkage ( λ m ) was calculated. Figure 18a shows the induced voltage waveform in the stator winding at 1060 rpm rotor speed, while Figure 18b shows the relationship between the rotor speed and the induced voltage in the stator during open-circuit. In the tested motor, the stator winding is not sinusoidally distributed. Therefore, the waveform is not pure sinusoidal; however, in the derivation of the mathematical model, we assume that the flux is sinusoidally distributed.

4.6. Summary of Parameter Measurement Results

Using the above-described experimental tests, the measured values are listed in Table 9. However, the listed parameters are approximate values due to human errors, instrumentation errors, and environmental condition.

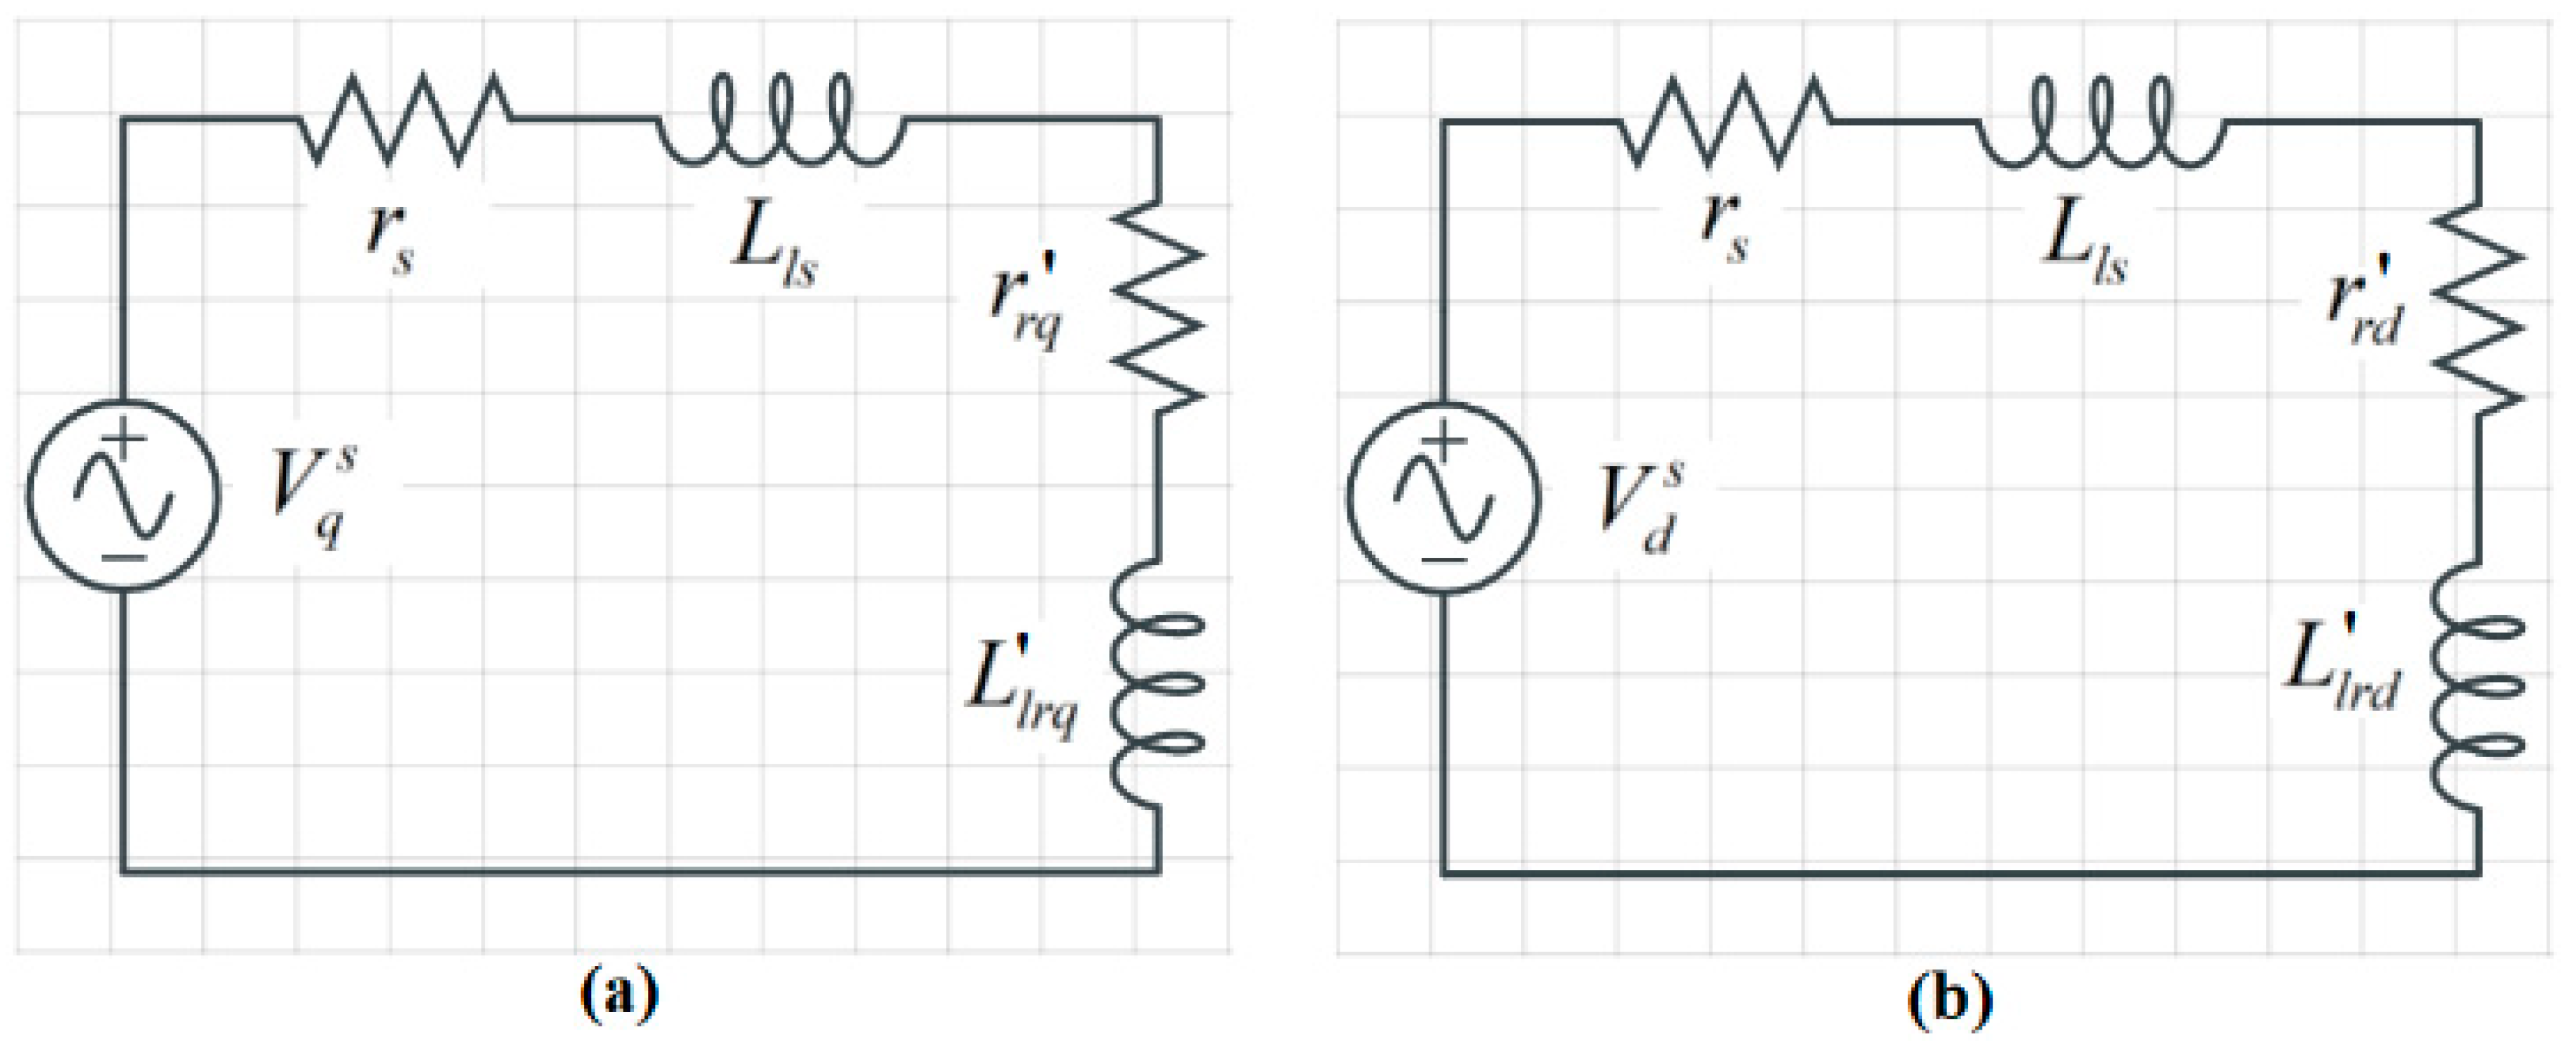
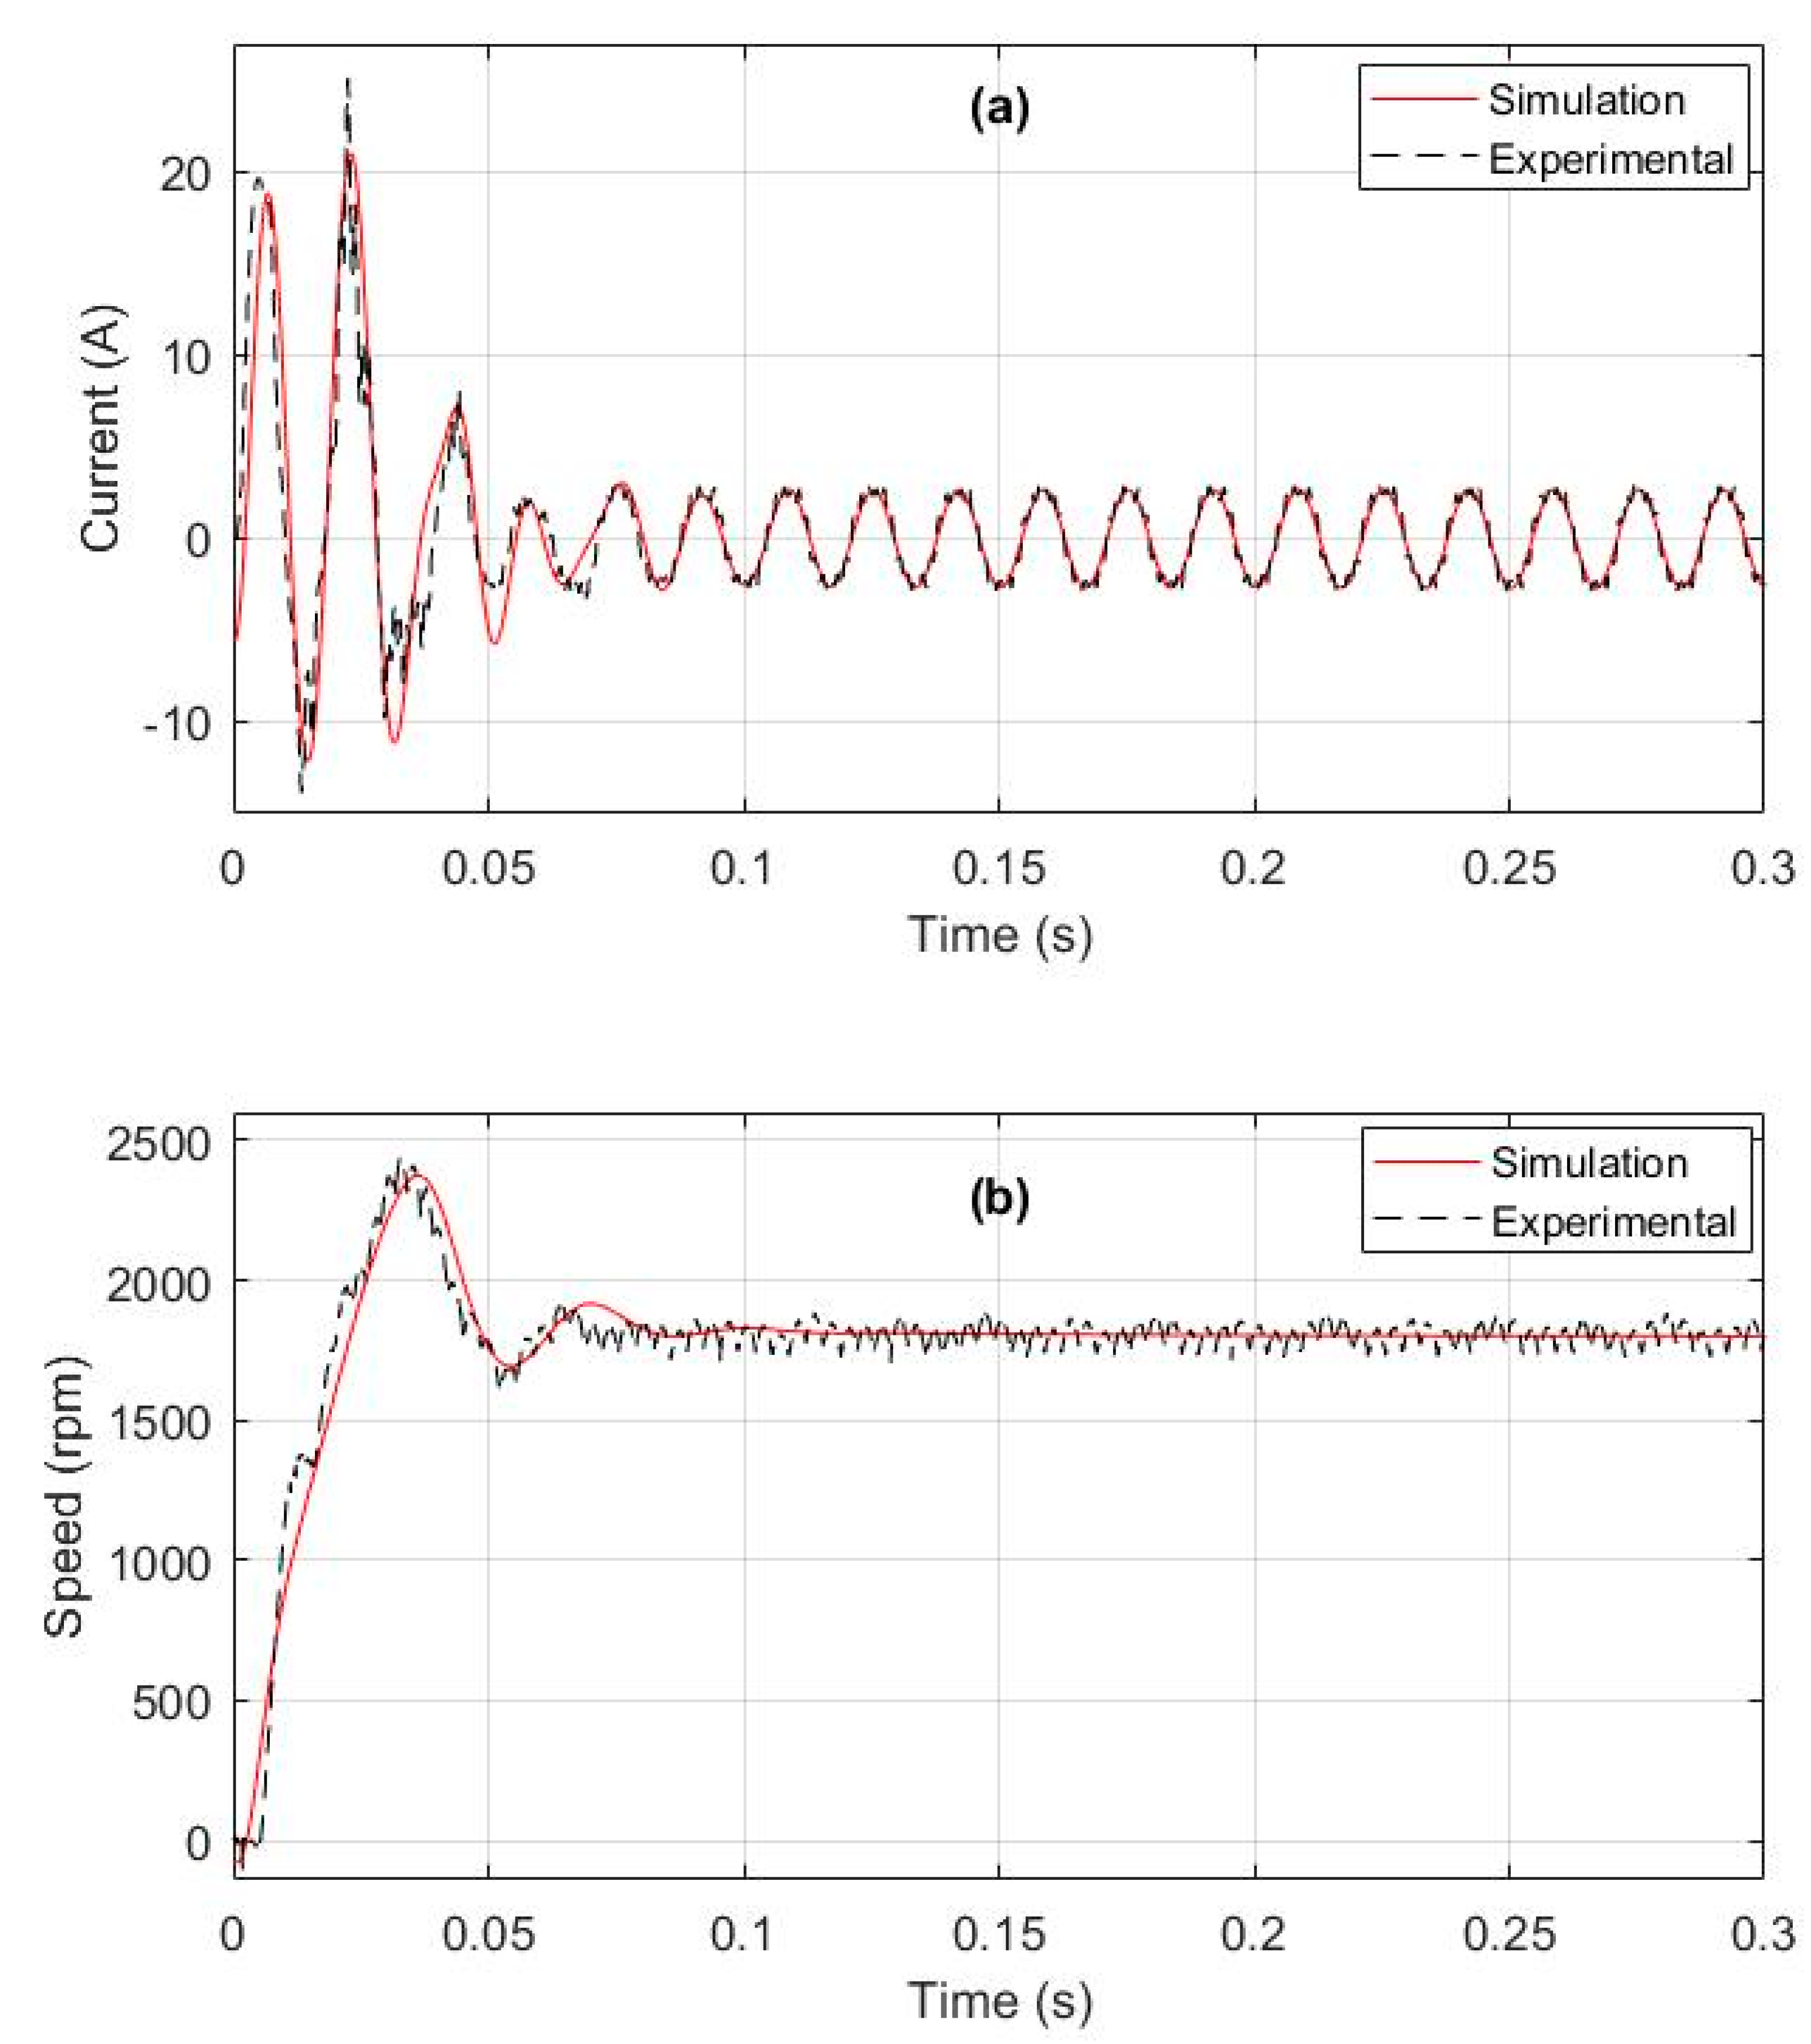
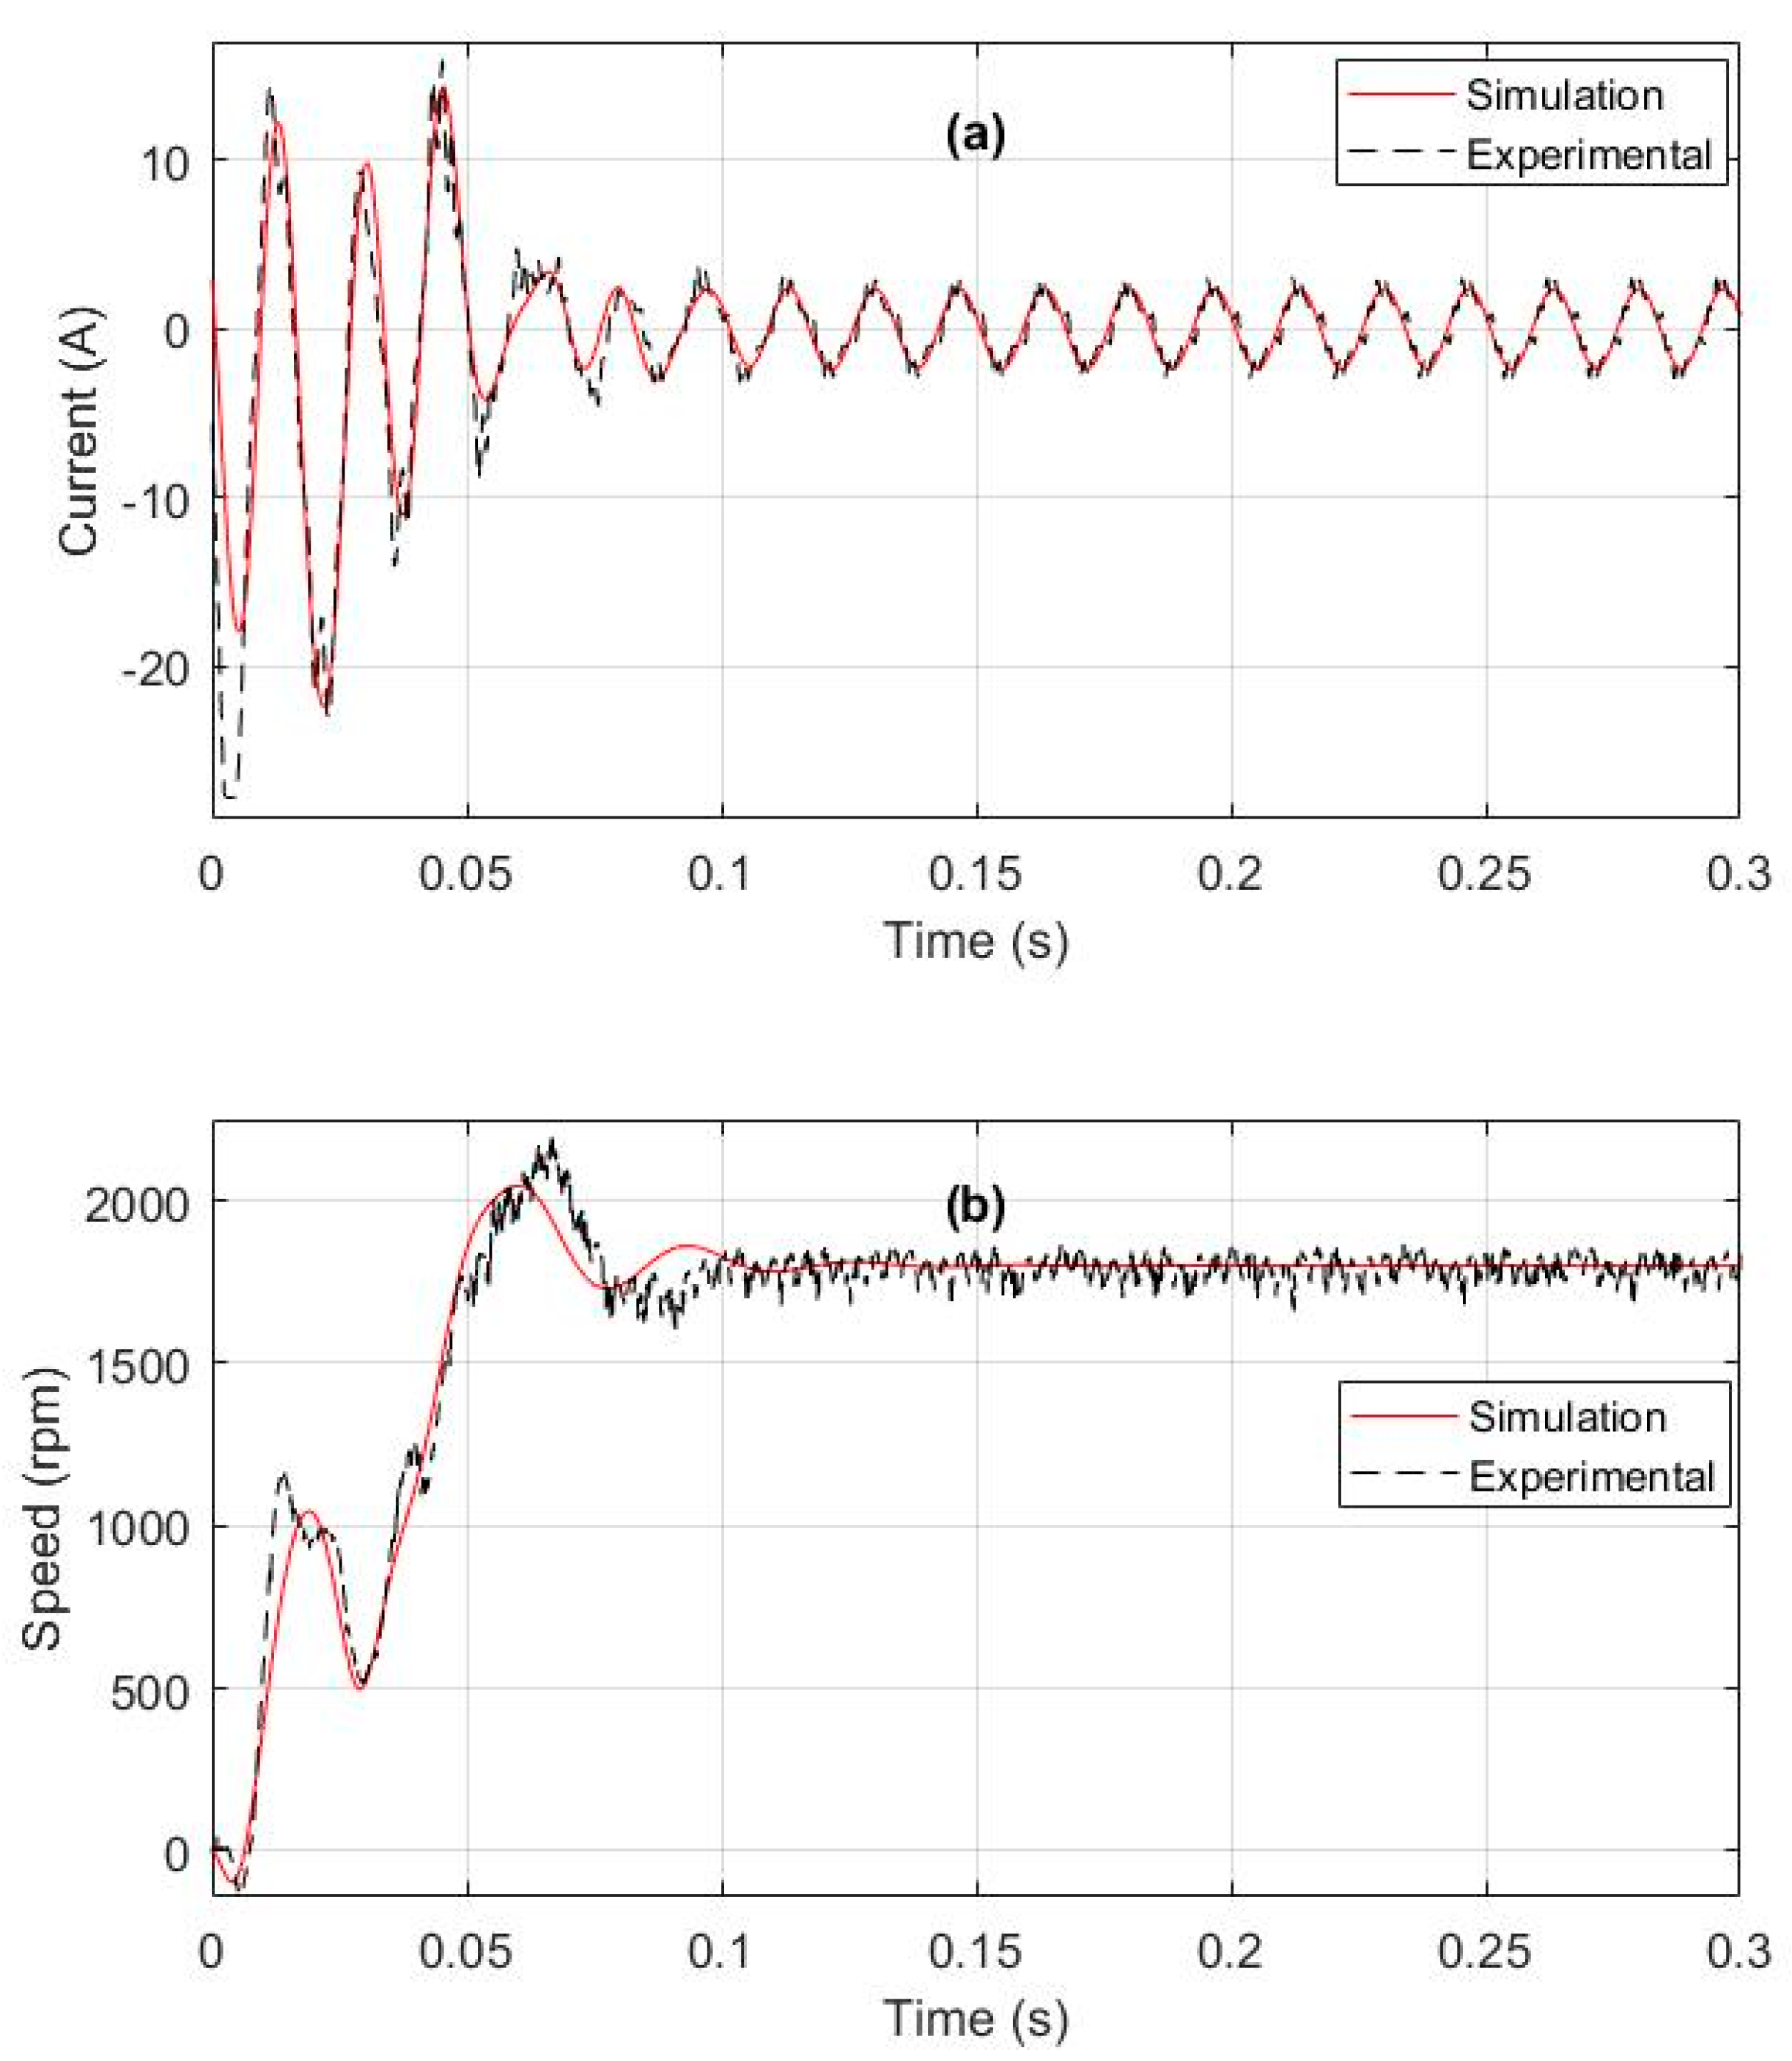
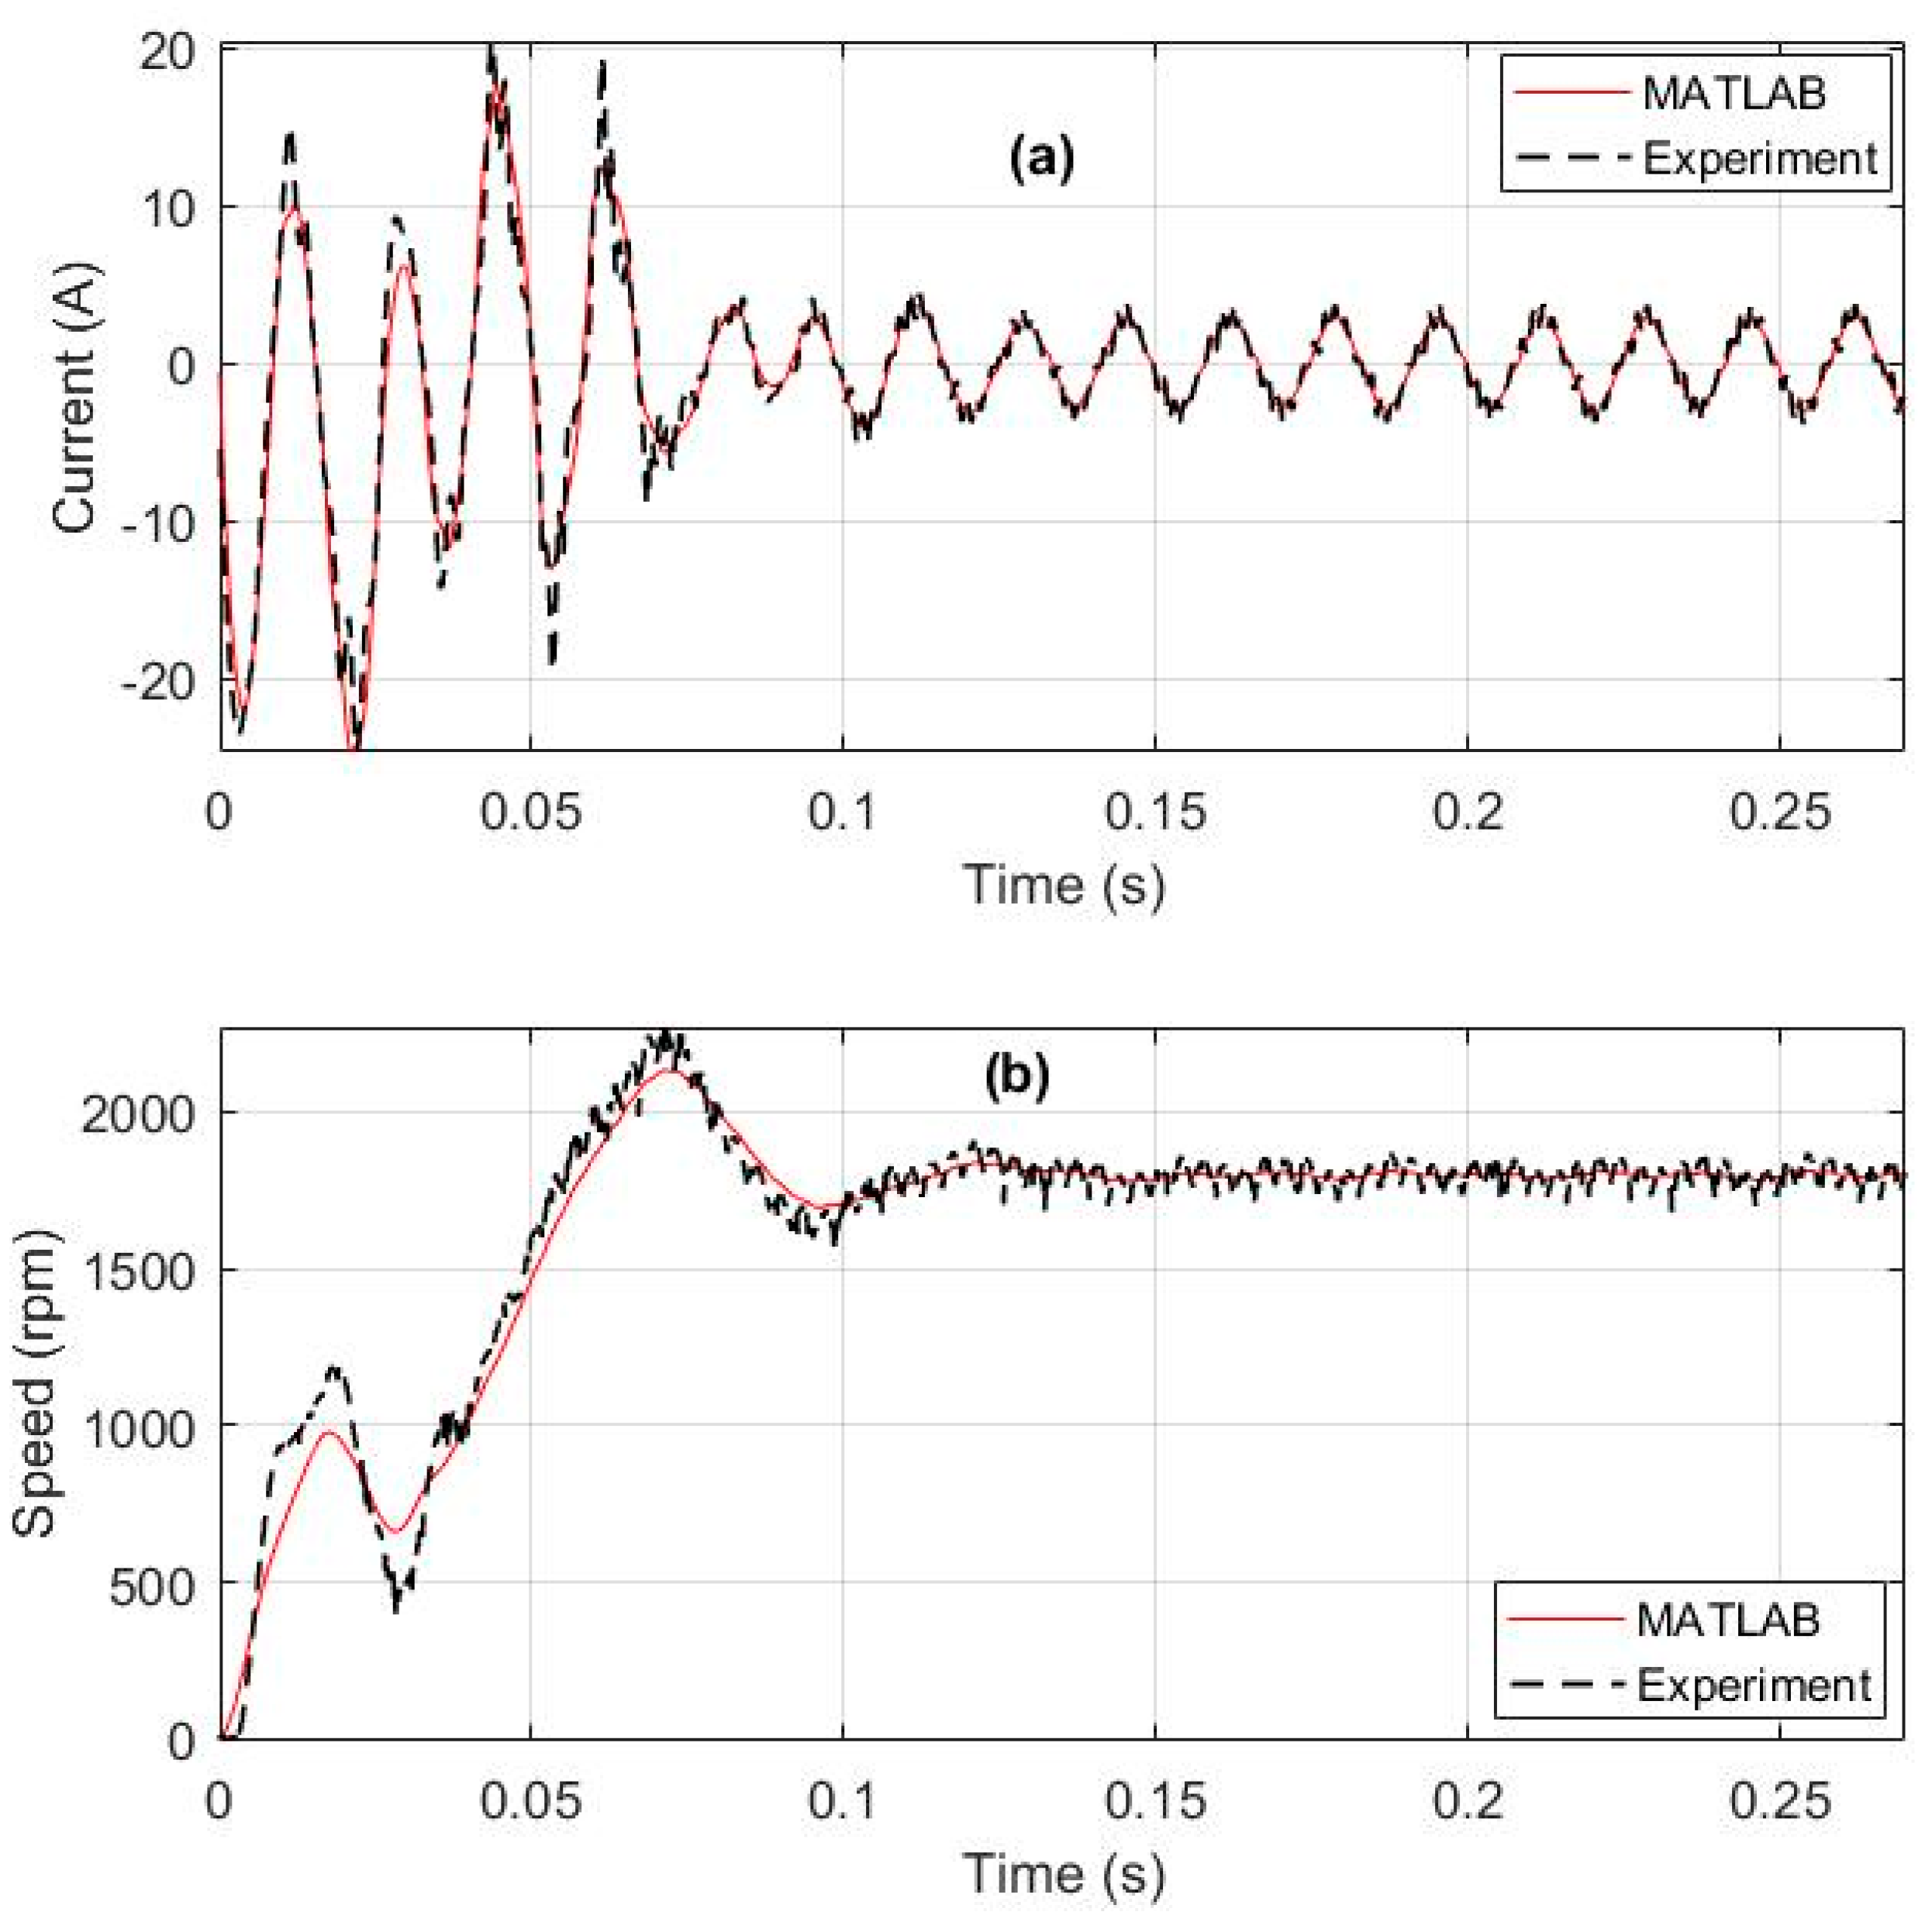
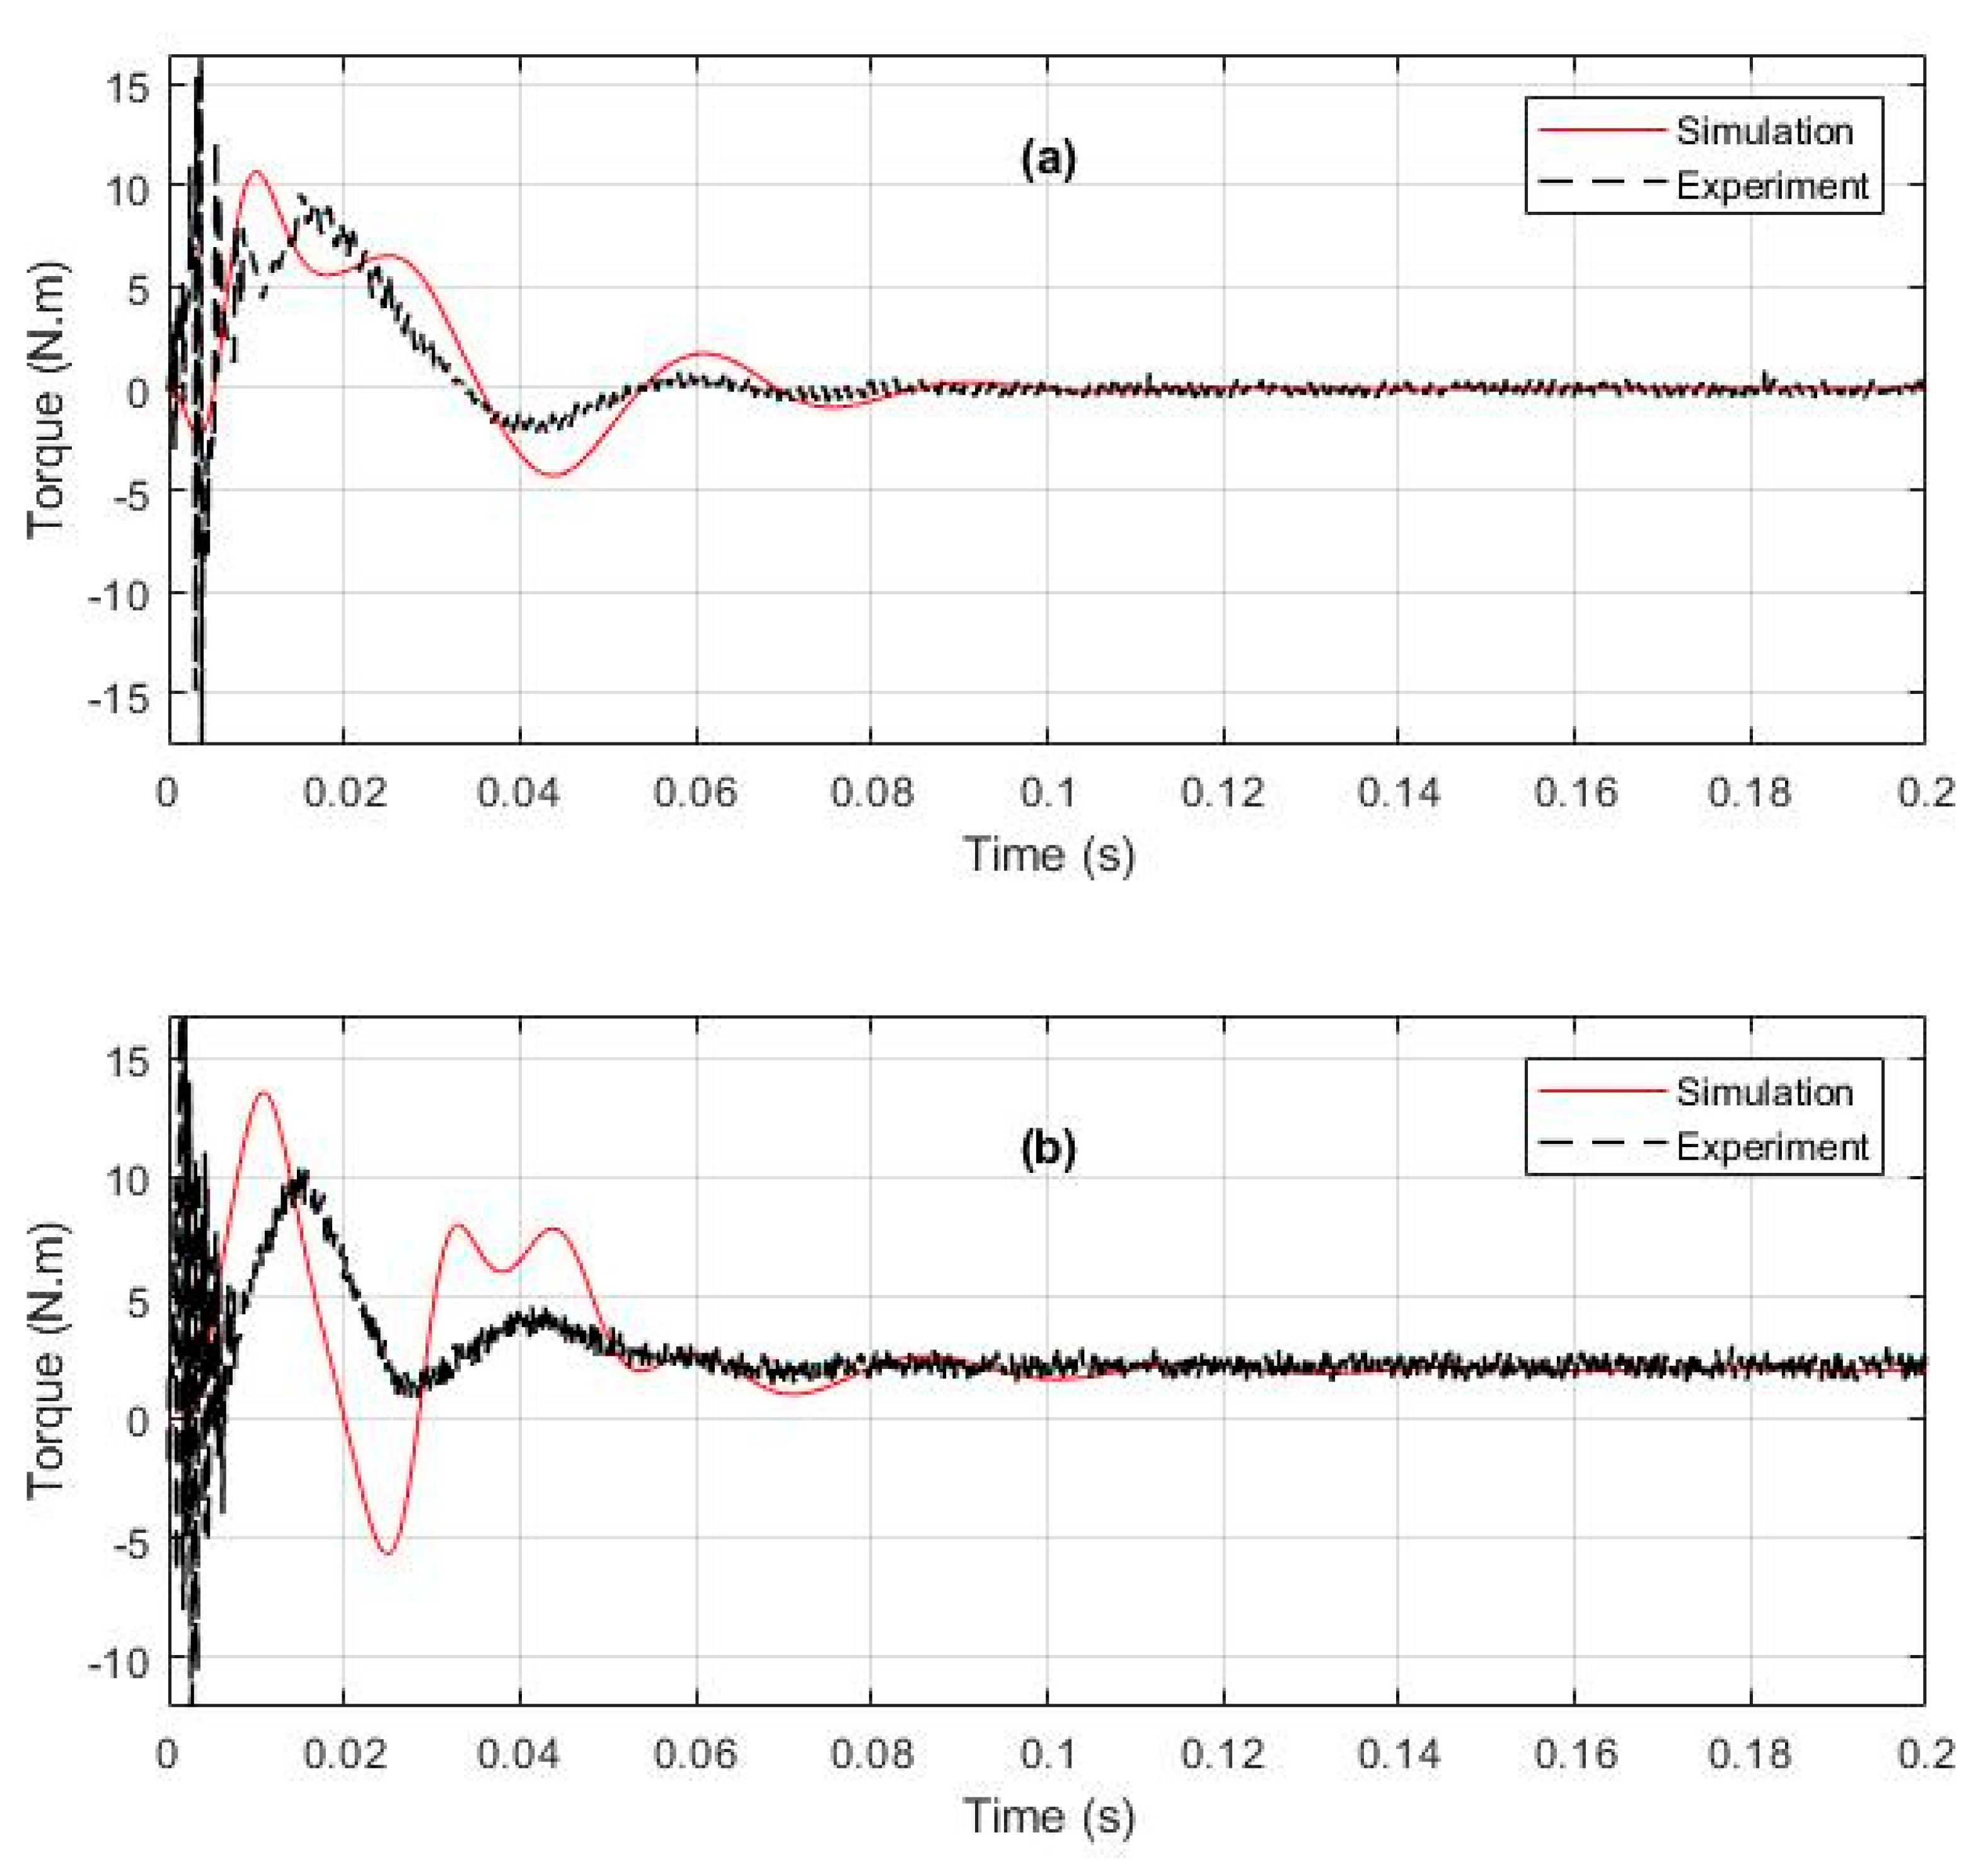
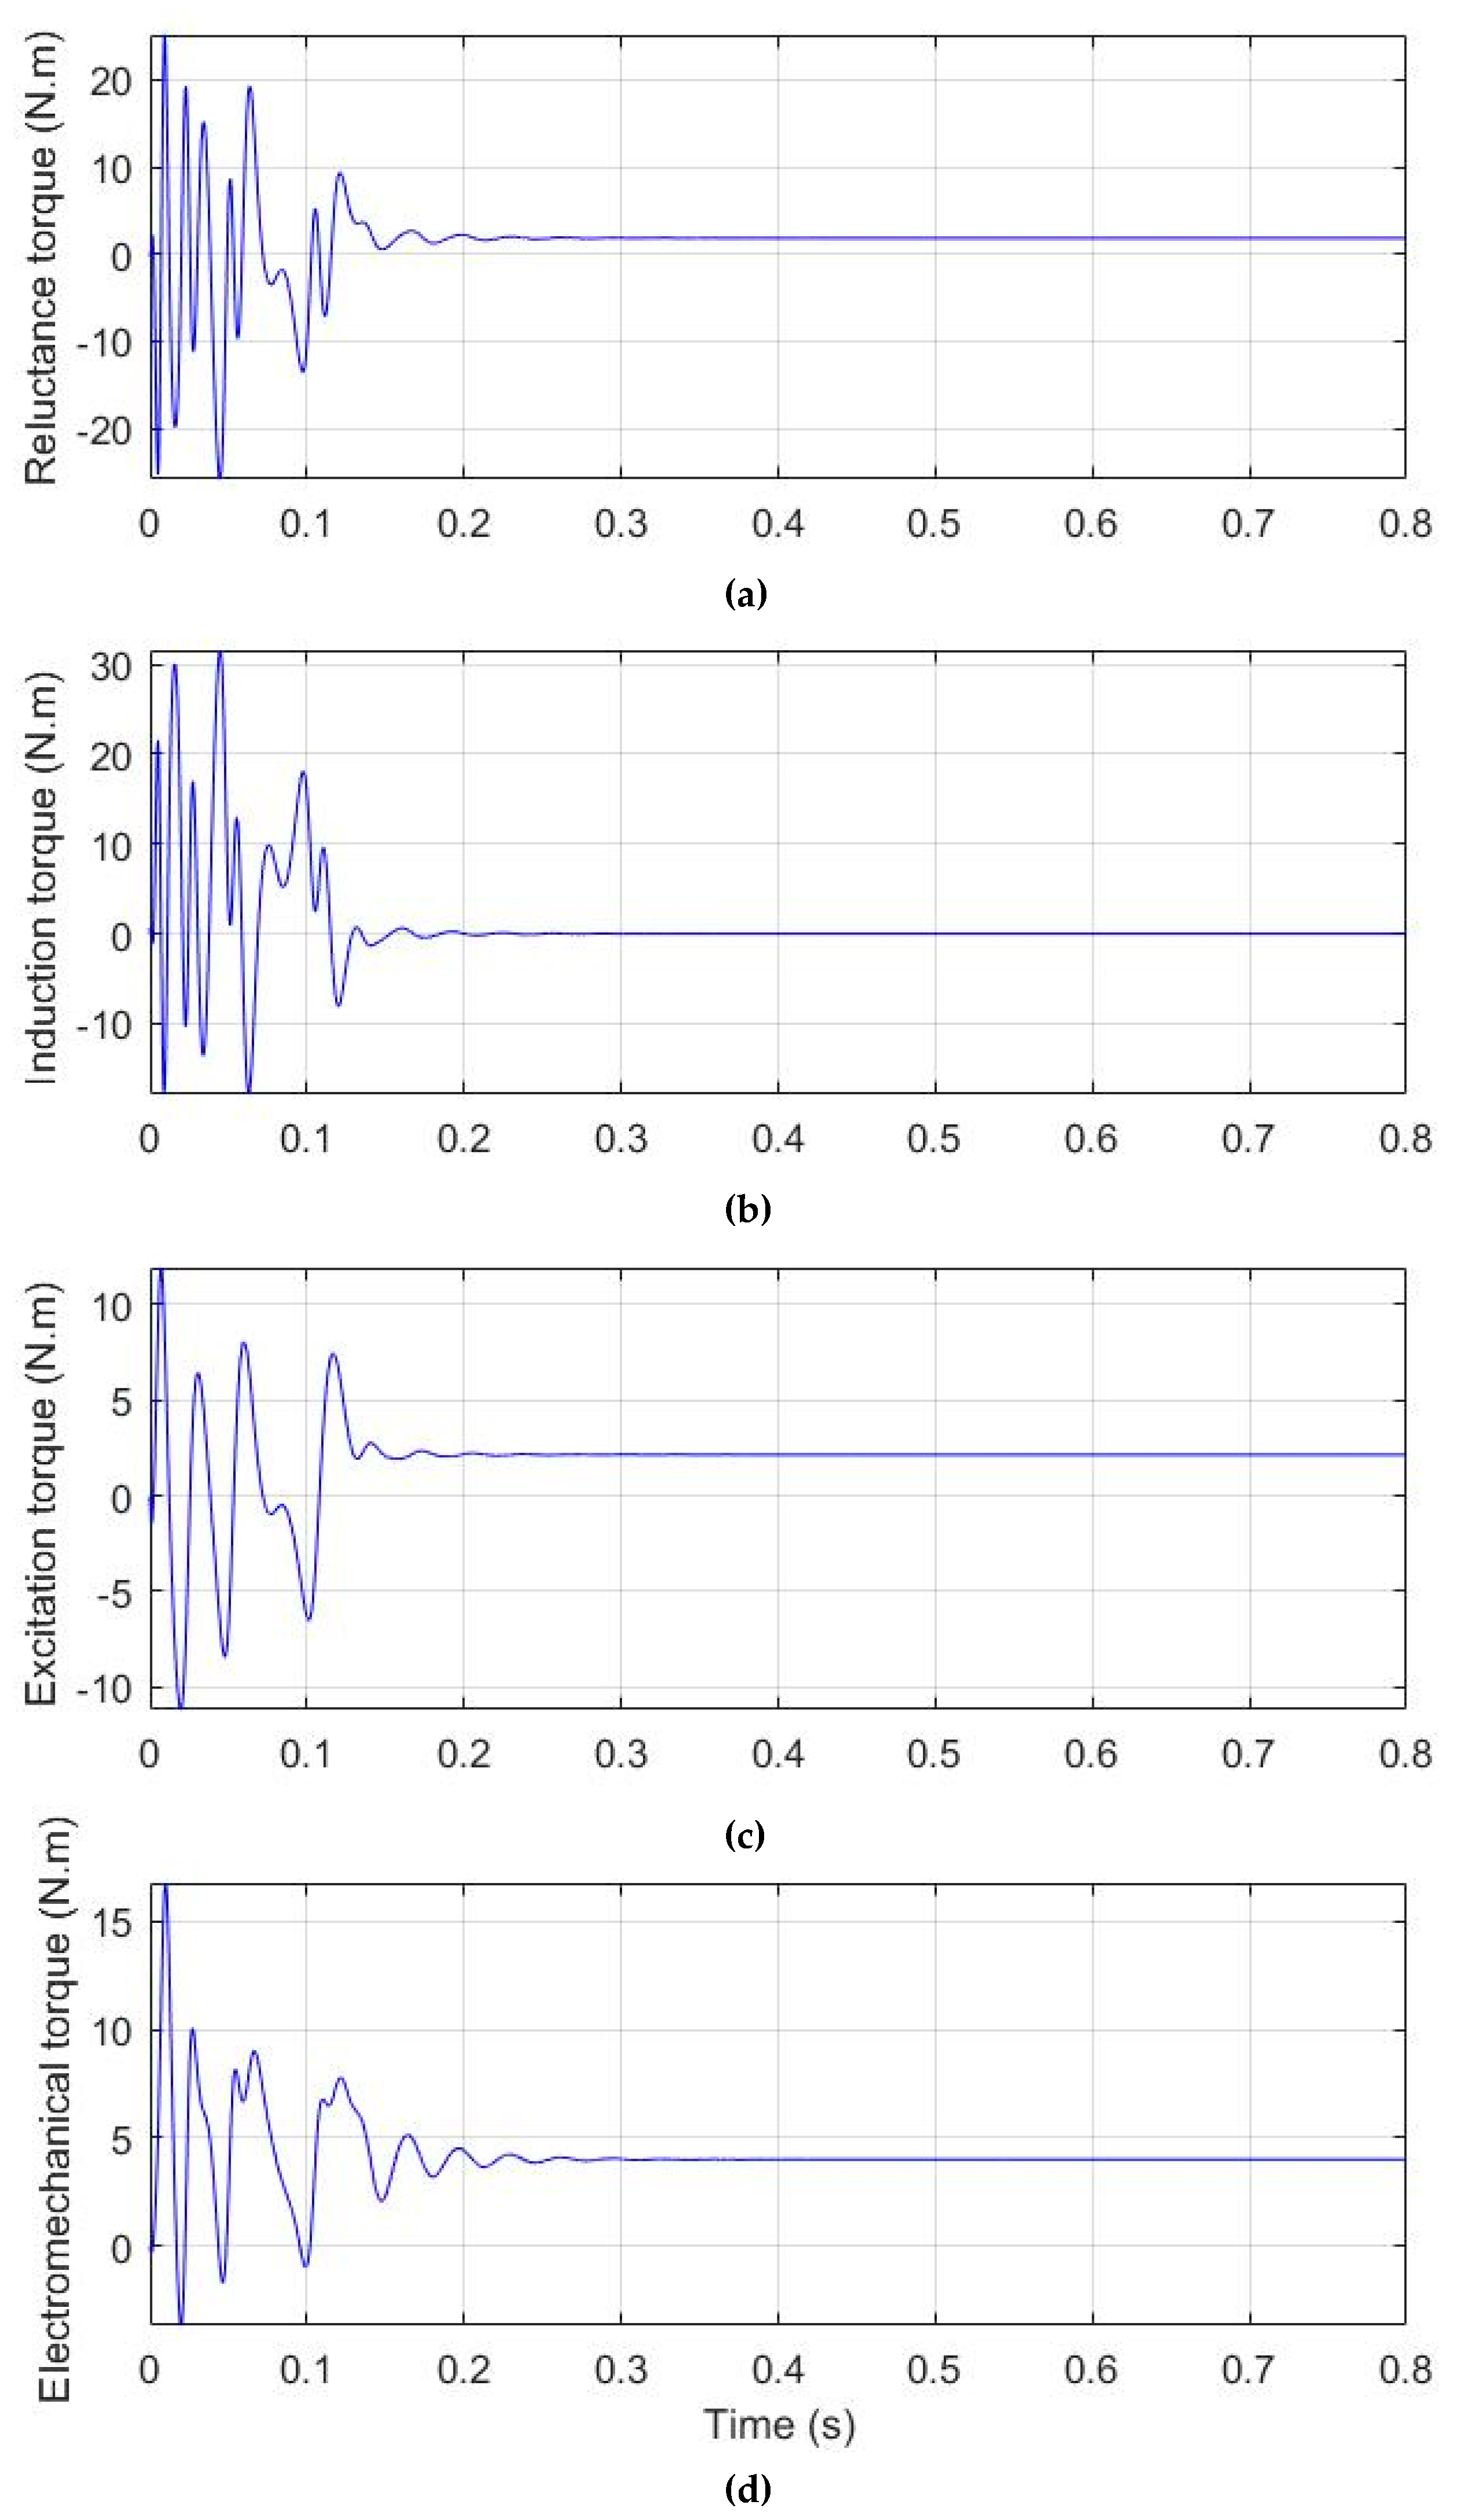
5. Parameters/Dynamic Model Testing and Validation

To test the principle of operation of the LSPMSM and measured parameters, the mathematical model has been implemented and simulated using MATLAB under different loading conditions. The stator current and the motor speed obtained from the MATLAB model and the experimental setup, under no-load, 2 N·m load and full-load conditions are shown in Figure 19, Figure 20 and Figure 21, respectively. The Figures demonstrate that both the simulation results of the developed mathematical model and the experimental results are in good agreement. The torque response of the motor has been investigated experimentally and simulated using MATLAB for no-load and full-load conditions as shown in Figure 22. It is clear from the figure that the torque response during steady-state is almost the same for simulation and experiment. The oscillatory nature of the torque response at steady-state is due to the interaction between the rotor magnets and the stator supply current as well as the cogging torque [30].
Additionally, it is clear that at steady-state, the motor runs at a synchronous speed (1800 rpm). Therefore, there is no relative speed between the rotational magnetic field of the stator and the rotor. Hence, there is no induction torque during this state. Both the excitation torque and reluctance torque (in salient pole machine) are driving the motor shaft at steady-state. At starting, the main torque component which forces the motor to rotate is the induction torque whereas the excitation torque is considered as a braking torque. Although the excitation torque (braking torque) is out of phase of the induction torque during starting, the induction torque is larger, and hence the machine is self-starting. Figure 23 shows the electromechanical torque of the motor and its components at full-load for MATLAB simulation.
Moreover, the results show that the inrush current (transient current) of the motor at the start is about 7–9 times the rated current during steady-state. It should be noted that during the starting of the motor, the current is the sum of both the stator and rotor winding currents while at steady-state it is only the current in the stator winding. Hence, no current is induced in the rotor bars. Therefore, the starting current of the LSPMSM is similar to that of an induction motor. Alternatively, the steady-state current of the LSPMSM is similar to that of a permanent magnet synchronous motor.

6. Conclusions

In this paper, the electrical parameters of a 1-hp interior mount-LSPMSM have been measured experimentally using several tests in the machine laboratory at King Fahd University of Petroleum and Minerals. The tests include the dc test, single phase ac test without rotor, locked rotor test, dc step test, and open-circuit test. The measured parameters have been used in the developed dq-mathematical model to validate the experimental results. The developed model has been implemented using MATLAB software and simulated under different loading conditions. The results from the simulation of the model include the speed and stator current of the machine. The simulation results were compared with the experimental test results under the same loading conditions. It has been observed that the simulation results from the model are in good agreement with the results obtained from experimental tests; hence, proving the accuracy of the calculated parameters. Therefore, the results of this study will help in selecting the appropriate test method for interior-mount LSPMSMs.

Author Contributions

L.S.M. and Z.M.A.-H. initiated the idea of Parameter identification for interior mount LSPMSM. L.S.M. implemented the motor simulation model; L.S.M. did the tests in the KFUPM machine laboratory. L.S.M. and A.S.M. validate the measured parameters. L.S.M., Z.M.A.-H. and A.S.M. analyzed the data; L.S.M., A.S.M. and S.T. wrote the paper; S.T. proofread it.

Funding

This research was funded by King Abdul-Aziz City for Science and Technology, grant number 13-ENE403-04.

Acknowledgments

The authors acknowledge the support from the King Abdul-Aziz City for Science and Technology (KACST) through the Science and Technology Unit at KFUPM on a Project grant No. 13-ENE403-04.

Conflicts of Interest

The authors declare no conflict of interest.

References

  1. Yang, G.; Ma, J.; Shen, J.-X.; Wang, Y. Optimal design and experimental verification of a line-start permanent magnet synchronous motor. In Proceedings of the 2008 International Conference on Electrical Machines and Systems, Wuhan, China, 17–20 October 2008; pp. 3232–3236. [Google Scholar]
  2. Takegami, T.; Hasegawa, M.; Tsuboi, K.; Hirotsuka, I.; Nakamura, M. Basic characteristics of a single-phase line-start permanent magnet synchronous motor. In Proceedings of the 2011 International Conference on Electrical Machines and Systems, Beijing, China, 20–23 August 2011; pp. 1–4. [Google Scholar]
  3. Nedelcu, S.; Tudorache, T.; Ghita, C. Influence of design parameters on a line start permanent magnet machine characteristics. In Proceedings of the 2012 13th International Conference on Optimization of Electrical and Electronic Equipment (OPTIM), Brasov, Romania, 24–26 May 2012; pp. 565–571. [Google Scholar]
  4. Hu, Y.; Guan, Z.; Yan, X. Calculation on the Rotor Slot Leakage Reactance of Line-Start Permanent Magnet Synchronous Motor. In Proceedings of the 2012 Sixth International Conference on Electromagnetic Field Problems and Applications, Dalian, China, 19–21 June 2012; pp. 1–4. [Google Scholar]
  5. De Almeida, A.T.; Ferreira, F.J.; Baoming, G. Beyond induction motors—Technology trends to move up efficiency. IEEE Trans. Ind. Appl. 2014, 50, 2103–2114. [Google Scholar] [CrossRef]
  6. De Almeida, A.T.; Ferreira, F.J.; Quintino, A. Technical and economical considerations on super high-efficiency three-phase motors. In Proceedings of the 2012 IEEE/IAS 48th Industrial & Commercial Power Systems Technical Conference (I&CPS), Louisville, KY, USA, 20–24 May 2012; pp. 1–13. [Google Scholar]
  7. Debruyne, C.; Polikarpova, M.; Derammelaere, S.; Sergeant, P.; Pyrhonen, J.; Desmet, J.J.; Lieven, V. Evaluation of the efficiency of line-start permanent-magnet machines as a function of the operating temperature. IEEE Trans. Ind. Electron. 2014, 61, 4443–4454. [Google Scholar] [CrossRef]
  8. Sarani, E.; Vaez-Zadeh, S. Design Procedure and Optimal Guidelines for Overall Enhancement of Steady State and Transient Performances of Line Start Permanent Magnet Motors. IEEE Trans. Energy Convers. 2017, 32, 885–894. [Google Scholar] [CrossRef]
  9. Iyer, K.L.V.; Lu, X.; Mukherjee, K.; Kar, N.C. A novel two-axis theory-based approach towards parameter determination of line-start permanent magnet synchronous machines. IEEE Trans. Magn. 2012, 48, 4208–4211. [Google Scholar] [CrossRef]
  10. Marcic, T.; Stumberger, B.; Stumberger, G. Differential-evolution-based parameter identification of a line-start IPM synchronous motor. IEEE Trans. Ind. Electron. 2014, 61, 5921–5929. [Google Scholar] [CrossRef]
  11. Ji, X.; Noguchi, T. Off-line parameter identification of interior permanent magnet motor by searching minimum point of current norm characteristics. In Proceedings of the 2014 International Symposium on Power Electronics, Electrical Drives, Automation and Motion, Ischia, Italy, 18–20 June 2014; pp. 279–284. [Google Scholar]
  12. Jing, D. Computational Analysis of a Permanent Magnet Synchronous Machine Using Numerical Techniques. Ph.D. Thesis, Department of Electrical & Computer Engineering, National University of Singapore, Singapore, 2005. [Google Scholar]
  13. Maraaba, L.; Al-Hamouz, Z.; Milhem, A.; Abido, M. Modelling of interior-mount LSPMSM under asymmetrical stator winding. IET Electr. Power Appl. 2018, 12, 693–700. [Google Scholar] [CrossRef]
  14. Yamamoto, S.; Ara, T. Determination of direct and quadrature axes inductances of reluctance motors taking into account cross saturation. IEEJ Trans. Ind. Appl. 2004, 123, 911–917. [Google Scholar] [CrossRef]
  15. Yamamoto, S.; Kano, T.; Yamaguchi, Y.; Ara, T. A method to determine direct-and quadrature-axis inductances of permanent magnet synchronous motors. Electr. Eng. Jpn. 2010, 171, 41–50. [Google Scholar] [CrossRef]
  16. Jedryczka, C.; Wojciechowski, R.M.; Demenko, A. Finite element analysis of the asynchronous torque in LSPMSM with non-symmetrical squirrel cage winding. Int. J. Appl. Electromagn. Mech. 2014, 46, 367–373. [Google Scholar] [CrossRef]
  17. Lazăr, F.; Simion, A.; Livadaru, L.; Daniel, I. FEM analysis of a 3 kW line-start permanent magnet synchronous machine. In Proceedings of the 2014 International Conference and Exposition on Electrical and Power Engineering (EPE), Iasi, Romania, 16–18 October 2014; pp. 402–405. [Google Scholar]
  18. Mehrjou, M.R.; Mariun, N.; Karami, M.; Misron, N.; Radzi, M.A.M. Performance analysis of line-start permanent magnet synchronous motor in presence of rotor fault. In Proceedings of the 2014 IEEE Student Conference on Research and Development, Batu Ferringhi, Malaysia, 16–17 December 2014; pp. 1–4. [Google Scholar]
  19. Ghoroghchian, F.; Aliabad, A.D.; Amiri, E.; Poudel, B. Line start permanent magnet synchronous motor with dual magnetic polarity. In Proceedings of the 2017 IEEE International Electric Machines and Drives Conference (IEMDC), Miami, FL, USA, 21–24 May 2017; pp. 1–6. [Google Scholar]
  20. Takahashi, A.; Kikuchi, S.; Mikami, H.; Ide, K.; Binder, A. dq Space vector analysis for line-starting permanent magnet synchronous motors. In Proceedings of the 2012 XXth International Conference on Electrical Machines, Marseille, France, 2–5 September 2012; pp. 136–142. [Google Scholar]
  21. Elistratova, V.; Hecquet, M.; Brochet, P.; Vizireanu, D.; Dessoude, M. Analytical approach for optimal design of a line-start internal permanent magnet synchronous motor. In Proceedings of the 2013 15th European Conference on Power Electronics and Applications (EPE), Lille, France, 2–6 September 2013; pp. 1–7. [Google Scholar]
  22. Ahmed, S.; Tremelling, D.; Kim, H.; Zhang, Z.; Frank, N.; McElveen, R. Modeling, simulation and performance evaluation of cage rotor permanent magnet motor fed by variable speed drive. In Proceedings of the 2016 IEEE Energy Conversion Congress and Exposition (ECCE), Milwaukee, WI, USA, 18–22 September 2016; pp. 1–6. [Google Scholar]
  23. Kemmetmuller, W.; Faustner, D.; Kugi, A. Modeling of a permanent magnet synchronous machine with internal magnets using magnetic equivalent circuits. IEEE Trans. Magn. 2014, 50, 1–14. [Google Scholar]
  24. Lu, X.; Iyer, K.L.V.; Mukherjee, K.; Kar, N.C. Development of a novel magnetic circuit model for design of premium efficiency three-phase line start permanent magnet machines with improved starting performance. IEEE Trans. Magn. 2013, 49, 3965–3968. [Google Scholar] [CrossRef]
  25. Isfahani, A.H.; Vaez-Zadeh, S.; Hasanzadeh, S. An educational toolbox for performance analysis of line-start permanent magnet synchronous motors. Comput. Appl. Eng. Educ. 2014, 22, 452–462. [Google Scholar] [CrossRef]
  26. Ong, C.-M. Dynamic Simulation of Electric Machinery: Using Matlab/Simulink; Prentice Hall PTR: Upper Saddle River, NJ, USA, 1998; Volume 5. [Google Scholar]
  27. Lu, X.; Iyer, K.; Mukherjee, K.; Kar, N.C. A Novel Two-Axis Theory-Based Experimental Approach Towards Determination of Magnetization Characteristics of Line-Start Permanent Magnet Synchronous Machines. IEEE Trans. Magn. 2013, 49, 4733–4737. [Google Scholar] [CrossRef]
  28. Soreshjani, M.H.; Ghafari, A.; Haghparast, M. Direct Torque and Flux Controlled Space Vector Modulated (DTFC-SVM) Based on Fuzzy Logic Controller for Line-Start Permanent Magnet Synchronous and Permanent Magnet Synchronous Machines. J. Control Eng. Appl. Inform. 2014, 16, 75–83. [Google Scholar]
  29. Motors, P.M.S. Educational Bench of Line-Start Permanent Magnet Synchronous Motors Part I: Operating Point Of Permanent Magnet. In Proceedings of the 4th International Conference on Interdisciplinarity in Education ICIE’09, Vilnius, Lithuania, 21–22 May 2009. [Google Scholar]
  30. Stoia, D.; Cernat, M.; Hameyer, H.; Ban, D. Line-start permanent magnet synchronous motors analysis and design. In Proceedings of the 15th International Conference on Electrical Drives and Power Electronics, EDPE 2009, Dubrovnik, Croatia, 12–14 October 2009. [Google Scholar]
  31. Kinnunen, J. Direct-on-Line Axial Flux Permanent Magnet Synchronous Generator Static and Dynamic Performance; Lappeenrannan teknillinen yliopisto: Lappeenranta, Finnland, 2007. [Google Scholar]
  32. Maraaba, L.S.; AlHamouz, Z.M.; Abido, M. Mathematical Modeling, Simulation and Experimental Testing of Interior-mount LSPMSM under Stator Inter-Turn Fault. IEEE Trans. Energy Convers. 2018. [Google Scholar] [CrossRef]
  33. Rahman, K.M.; Hiti, S. Identification of machine parameters of a synchronous motor. IEEE Trans. Ind. Appl. 2005, 41, 557–565. [Google Scholar]
  34. Haque, M.; Rahman, M. Dynamic model and parameter measurement of interior permanent magnet synchronous motor. In Proceedings of the 2006 Australasian Universities Power Engineering Conference (AUPEC’06), Melbourne, Australia, 10–13 December 2006; pp. 10–13. [Google Scholar]
  35. Cavagnino, A.; Lazzari, M.; Profumo, F.; Tenconi, A. Axial flux interior PM synchronous motor: parameters identification and steady-state performance measurements. IEEE Trans. Ind. Appl. 2000, 36, 1581–1588. [Google Scholar]
  36. Marcic, T.; Stumberger, G.; Stumberger, B.; Hadziselimovic, M.; Virtic, P. Determining parameters of a line-start interior permanent magnet synchronous motor model by the differential evolution. IEEE Trans. Magn. 2008, 44, 4385–4388. [Google Scholar] [CrossRef]
  37. Sonnaillon, M.O.; Bisheimer, G.; Angelo, C.D.; García, G.O. Automatic induction machine parameters measurement using standstill frequency-domain tests. IET Electr. Power Appl. 2007, 1, 833–838. Available online: http://digital-library.theiet.org/content/journals/10.1049/iet-epa_20060512 (accessed on 22 November 2018). [CrossRef]
  38. Chapman, S. Electric Machinery Fundamentals; Tata McGraw-Hill Education: New York, NY, USA, 2005. [Google Scholar]
  39. Zeni, R. Investigation of the Sensorless Capability of an Induction Motor with Intentionally Created Saliency. Simulations and Measurements. Master’s Thesis, Department of Industrial Engineering, University degli Studi di Padova, Padova, Italy, 2013. [Google Scholar]
  40. Ayasun, S.; Nwankpa, C.O. Induction motor tests using MATLAB/Simulink and their integration into undergraduate electric machinery courses. IEEE Trans. Educ. 2005, 48, 37–46. [Google Scholar] [CrossRef]
  41. Okoro, O.I. Dynamic and Thermal Modelling of Induction Machine with Non-Linear Effects; Kassel University Press: Kassel, Germany, 2002. [Google Scholar]
  42. Bobek, V. Pmsm electrical parameters measurement. Free. Semicond. 2013. [Google Scholar]
  43. Cisneros-Gonzalez, M.; Hernandez, C.; Escarela-Perez, R.; Arjona, M. Determination of equivalent-circuit parameters of a synchronous generator based on the standstill DC decay test and a hybrid optimization method. Electr. Power Compon. Syst. 2011, 39, 645–659. [Google Scholar] [CrossRef]
  44. Ohm, D.Y. Dynamic Model of PM Synchronous Motors; Drivetech, Inc.: Blacksburg, Virginia, 2000; Volume 16, Available online: www.drivetechinc.com (accessed on 22 November 2018).
  45. Lu, X. Dual Benefits of Adding Damper Bars in PMSMs for Electrified Vehicles: Improved Machine Dynamics and Simplified Integrated Charging. Ph.D. Thesis, Department of Electrical & Computer Engineering, University of Windsor, Windsor, ON, Canada, 2014. [Google Scholar]
  46. Institute of Electrical and Electronics Engineers. IEEE Standard Test Procedure for Polyphase Induction Motors and Generators; Institute of Electrical and Electronics Engineers: New York, NY, USA, 2004. [Google Scholar]
Figure 1. LSPMSM dynamic equivalent circuits (a) d-axis circuit (b) q-axis circuit.
Machines 07 00004 g001
Figure 2. DC test setup.
Machines 07 00004 g002
Figure 3. DC test circuit diagram.
Machines 07 00004 g003
Figure 4. CPC 100 Measurement Device.
Machines 07 00004 g004
Figure 5. LSPMSM motor without rotor.
Machines 07 00004 g005
Figure 6. The circuit diagram of single-phase AC without rotor test.
Machines 07 00004 g006
Figure 7. Experimental set-up for single phase AC test without rotor.
Machines 07 00004 g007
Figure 8. The schematic diagram of locked rotor test.
Machines 07 00004 g008
Figure 9. LSPMSM circuit under locked rotor conditions (a) q-circuit (b) d-circuit.
Machines 07 00004 g009
Figure 10. Locked rotor test experimental set-up.
Machines 07 00004 g010
Figure 11. Schematic diagram of step DC test.
Machines 07 00004 g011
Figure 12. Equivalent circuit of tested machine under step DC test.
Machines 07 00004 g012
Figure 13. Open-circuit test diagram.
Machines 07 00004 g013
Figure 14. Experimental set-up of the open-circuit test.
Machines 07 00004 g014
Figure 15. Voltage and current waveforms using CASSY unit.
Machines 07 00004 g015
Figure 16. Current and voltage wave form with phase a aligned with (a) d-axis (b) q-axis.
Machines 07 00004 g016
Figure 17. Step response of the tested motor.
Machines 07 00004 g017
Figure 18. (a) Induced line voltage at 1060 rpm rotor speed (b) relation between rotor speed and induced line voltage.
Machines 07 00004 g018
Figure 19. LSPMSM under no-load (a) Stator phase A Current (b) speed.
Machines 07 00004 g019
Figure 20. LSPMSM under 2 N·m load (a) Stator phase A Current (b) speed.
Machines 07 00004 g020
Figure 21. LSPMSM under 4 N·m load (a) Stator phase A Current (b) speed.
Machines 07 00004 g021
Figure 22. Torque response (a) no-load (b) full-load.
Machines 07 00004 g022
Figure 23. Motor torque components at full-load (a) reluctance torque (b) induction torque (c) excitation torque (d) electromechanical torque.
Machines 07 00004 g023
Table 1. The parameters of the tested motor.
ParameterValue
Mean air gap radius37.35 mm
Number of poles4
Air gap width0.3 mm
Permanent magnet thickness3 mm
Stack length80 mm
Number of turns per stator phase86 × 4
Rotor bar resistivity2.655 × 10−8 Ω·m
Rotor end ring resistance1 × 10−5 Ω
Angle between two adjacent rotor bars18 degrees
Number of bars20
Permanent magnet flux density1.25 T
Machine rated power1 hp
Moment of inertia0.001586 kg·m2
Rated voltage400 Vrms
Rated frequency60 Hz
Rated speed1800 rpm
Bar length80 mm
Bar cross-sectional area27 mm2
Table 2. DC test results.
V D C   ( V ) I D C   ( A ) R s   ( Ω )
5.30.4955.35353
6.610.625.33064
7.560.715.32394
8.4430.85.27687
9.530.895.35393
5.30.4955.35353
10.961.035.3203
11.941.145.2368
12.721.195.3445
13.911.2935.3789
14.931.3945.3550
10.961.035.3203
Average Value5.3274
Table 3. Single phase AC without rotor test Results.
V ϕ   ( V ) I ϕ   ( A ) θ (Deg) r s   ( Ω ) L l s   ( H )
15.311.52956.63295.50710.0221
17.711.768756.63295.50710.0221
21.1542.10856.63295.51930.0222
23.8112.36356.63295.54210.0223
26.982.67156.63295.55550.0223
29.442.955.94425.68490.0223
15.311.52956.63295.50710.0221
Average Value 5.55270.0222
Table 4. The locked rotor test result (rotor d-axis aligned with phase-a).
I ϕ   ( A ) V ϕ   ( V ) θ (deg) R i d   ( Ω ) X i d   ( Ω ) r r d   ( Ω ) L l r d   ( H )
0.72213.5950.2012.04814.4656.49550.0161
1.03620.1950.2012.46214.9626.91020.0174
1.49329.1650.2012.50215.0106.95020.0175
1.7936.1850.2012.91615.5067.36320.0188
2.5548.99750.2012.27314.7356.72040.0168
Average Value 6.88790.0173
Table 5. The locked rotor test result (rotor q-axis aligned with phase-a).
I ϕ   ( A ) V ϕ   ( V ) θ (deg) R i q   ( Ω ) Xiq (Ω) r r q   ( Ω ) L l r q (H)
0.7415.9745.41214.99315.2109.44070.0180
1.0522.5245.41214.98415.2029.43210.0180
1.533.3845.41215.62115.84810.0690.0197
2.1141.8545.41213.92514.1278.37310.0152
2.5150.6945.41214.17714.38258.62430.0158
Average Value 9.1870.0173
Table 6. Step DC test result rotor d-axis aligned with phase-a.
V (v)τ (s)R (Ω)Ld (H)
1.40.01637.9910.0868
3.20.01717.9910.0910
5.070.01887.9910.1001
7.150.01727.9910.0916
9.430.01667.9910.0884
100.01787.99120.0948
10.50.018117.9910.0964
110.018897.9910.1006
Average Value 0.09376
Table 7. Step DC test result- rotor q-axis aligned with phase-a.
V (v)τ (s)R (Ω)Lq (H)
1.760.05247.9910.2791
3.440.05157.9910.2743
5.60.05137.9910.2732
7.20.05297.9910.2818
9.020.05727.9910.3047
9.70.0567.9910.2983
10.30.05017.9910.2669
10.80.0537.9910.2823
Average Value 0.2826
Table 8. Open-circuit test results.
n m   ( rpm ) V a b   ( V ) λ m   ( Wb )
41863.10.58850
49474.50.58792
53681.20.59059
63095.70.59219
6971060.59288
13081990.59311
1404213.40.59254
1506228.80.59227
1601243.40.59268
1701258.30.59199
1800272.80.59083
1847280.90.59289
Average Value 0.59153
Table 9. Tested motor measured parameters.
ParameterValueParameterValue
r s (Ω)5.5525 L l r q (H)0.0173
L l s (H)0.0222 L m d (mH)71.496
r r d (Ω)6.8879 L m q (mH)260.355
L l r d (H)0.01735 λ m (Wb)0.591538
r r q (Ω)9.1879

