Article

Design and Optimization of Production Line Layout Using Material Flows

Faculty of Mechanical Engineering, VSB—Technical University of Ostrava, 17. Listopadu 2172/15, 708 00 Ostrava-Poruba, Czech Republic
*
Author to whom correspondence should be addressed.
Machines 2024, 12(3), 189; https://doi.org/10.3390/machines12030189
Submission received: 15 February 2024 / Revised: 8 March 2024 / Accepted: 12 March 2024 / Published: 14 March 2024
(This article belongs to the Special Issue Precision Manufacturing and Machine Tools)

Abstract

:
Businesses are constantly trying to improve their production by looking for bottlenecks to improve their market position. The introduction and innovation of automated production lines is necessary for both labor shortages and productivity and quality reasons. A combination of precision, fluidity, and speed, that is the basic definition of a production line. With the advent of new technologies, production lines have also begun to continuously speed up and innovate. Innovation is the subject of this paper, where the problem of designing a completely new layout for a new production line in the food industry has been addressed. The aim of this paper was to create a design for the optimal layout of the production line in preselected production areas. Optimal use of the space allocated for production is very important for every company today.

1. Introduction

In today’s global world, businesses are forced to compete not only in their home market, but they must be able to compete with companies from around the world [1]. Therefore, there is a need to constantly adapt to new conditions, increase productivity, streamline production, or improve product quality to compete in international markets [2,3]. Companies are forced to implement various industrial engineering methods and techniques to introduce more efficient, effective, and sophisticated production [4,5,6]. They try to eliminate activities that bring no or low added value. The company can achieve these set goals by implementing methodologies such as lean production or Six Sigma [6,7].
Therefore, the optimization of production is always important for companies. The optimal layout of production machines and workplaces plays an important role in production efficiency and space saving [8]. It is important mainly from the point of view of high prices, various limitations of production equipment, time-consuming processing, unpredictability of repairs, etc. [9]. In each design of the layout solution, there should be individual functional areas, space requirements, aisles including dimensions, but also the design of the flow diagram and the definition of picking zones [10]. Workplaces should be arranged to avoid indirectness and reversible technological flow [11]. As a result, businesses are able to maintain or even improve their market position, gain a competitive advantage, or at least reduce costs [12,13]. The loss of competitive advantage is a major risk for the company. That is why companies are trying to introduce and innovate automated production lines. However, it is always necessary to calculate the investment and assess whether it will pay for the company. It is the degree of certainty in the return on the investment that influences the entrepreneur’s decision [14].
This paper deals with one of the ways to identify bottlenecks in a company and how to optimize and improve the entire production process. The problem of designing a completely new layout of a new production line in the food industry was solved. The aim of this paper was to create a proposal for an optimal layout of the production line in pre-selected production areas.
When searching for the optimal setting of production and logistics processes, the problem is often that there are too many factors that need to be set in the company, and it is necessary to focus on a key or critical subprocess [15]. For these purposes, optimization tools can be used, which help to find a suitable combination of system settings during implementation.
As part of this study, analyses of the original production were carried out and critical points of the production system were determined. Using the proposed methods, new production designs were created that eliminate the specified deficiencies. When designing optimization variants of the existing production system, graphic-analytical analysis methods were used to analyze material flows between workplaces (for example, Sankey diagram). Furthermore, investment, economic, and partially building energy methods were examined, because the original production premises could be modified. Capacity calculations were also used in terms of maximum performance and the number of individual machines.
The disposition solution of individual machines, workplaces, or production centers is one of the essential parts of the project documentation. For the optimization of production systems, it is possible to use cooperative and investment-economical conditions; technological ones are mostly given by existing machinery, and building energy by existing production premises.
The optimization of the lines is related to the accuracy of the production of their individual components, and this article is a practical application of precision manufacturing and precision machinery. For this type of production, the accuracy of the machines and their continuity in the production lines are very important.

2. Basic Methodology

The analysis was carried out in three phases. The first step was to analyze the current situation and obtain input data. The analysis of the current state was supported by calculations of the performance and availability of individual machines on the original line. The data were obtained through observation and imaging.
As part of the first step, it was also necessary to analyze the target market to determine the size of demand for the products to get an idea of increasing production and increasing production capacity. Subsequently, it was necessary to evaluate the information obtained from the calculations made in the initial analysis [16].
To design the optimal layout of the production line, a detailed layout of the entire production plant, including the production machines, was prepared.
Material flow is then a key part in the design and planning of any production system [17]. If we want to improve the entire material flow system, we need to reduce the overall flow, for example, by simplifying the work [18].
A graphical tool—Sankey diagram—was used to illustrate all material flows in the company. To draw the diagram, a production layout is needed, into which the diagram is drawn. Sankey diagrams are used to visualize the flow of materials in different networks and processes, and it is one of the most used tools [19,20]. It is possible to express the progress of a single material or a whole group of materials in a diagram. The width of the lines represents the volume of material handled per unit time, and the length of the line represents the transport distance. The arrow indicates the direction of the material being transported [13].

3. Case Study—Optimization of Assembly Lines

The case study focuses on the optimization of the production line layout in a selected company. The manufacturing company deals with the mass production of a wide range of frozen food products.
Based on a series of analyses carried out on the production lines, the aim was to find bottlenecks in the production process of the selected product, and to propose a more efficient positioning of the new production line in terms of technical and production area.

3.1. Phase 1—Input Analysis of Production on the Original Line

This paper focuses on a production line producing frozen, packaged food. From the wide range of frozen foods that the company produces, products that fall under the category of “Ready-made foods” were selected, specifically focusing on breaded cheese, breaded vegetables, breaded chicken schnitzel, and breaded pork schnitzel. The production volumes of these products are shown in Table 1.
Figure 1 graphically shows the production volumes that were produced in 2021 on the original production line and their percentage in relation to the total production of these products. The figure shows that the largest share of production is in the production of breaded cheeses, with 75%. Because of the highest production share, breaded cheese was chosen as the representative sample on which all calculations are calculated. Specifically, 100 g of breaded cheese with a rectangular shape.
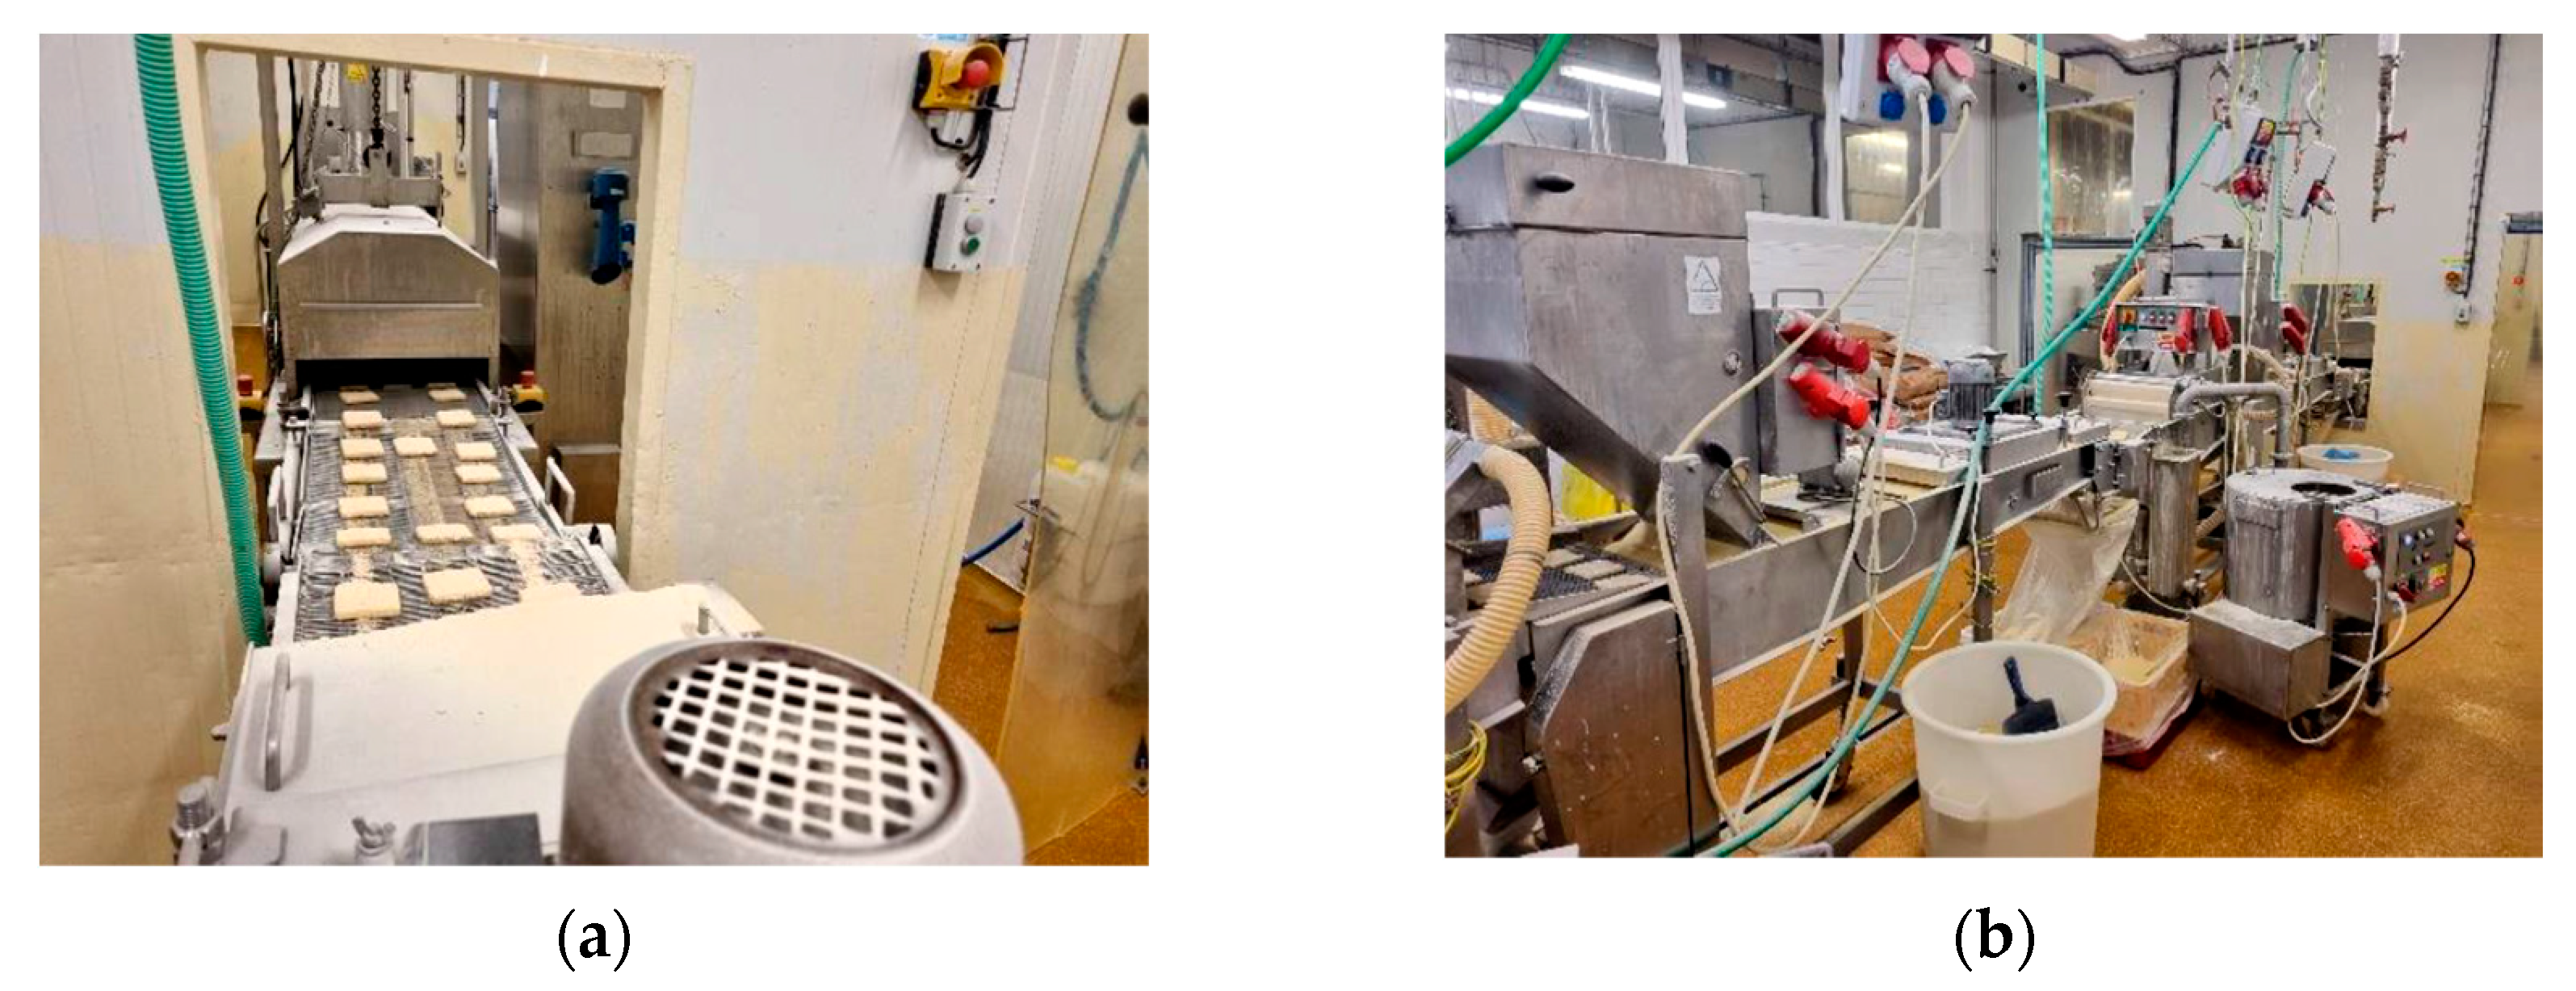
Once the production volume was established, a market analysis was carried out, which led to the conclusion that there was a need to increase production to meet customer demand. To increase production capacity and understand the situation, it was first necessary to calculate the performance of the individual machines on the production line and to calculate their unknown outputs. Three critical pieces of machinery that are part of the production line were examined. These were the forming machine, the freezing tunnel, and the frying tunnel. The wet and dry coater, mixers, cutter, and packing lines need not be addressed further. In the figures below, the forming machine and freezing tunnel (Figure 2), and the frying tunnel and the wet and dry coater (Figure 3) can be seen.
Subsequently, calculations of the output and usability of the original machinery were made. The efficiency calculations of the original devices are shown below.
Maximum efficiency of the forming machine:
  • Number of pieces produced per 1 cycle:
i1 = 3 pcs/1 cycle
  • Number of cycles in 1 min:
i2 = 23 cycles/min
Number of pieces molded in 1 h:
KT = i1 × i2 × 60 = 3 × 23 × 60 = 4140 pcs/h
where:
  • i1—the number of pieces produced per 1 cycle
  • i2—number of cycles in 1 min
  • Weight 1 pc immediately after shaping: 55 g = 0.055 kg
Total weight of pieces produced in 1 h:
mcelk = KT × mT = 4140 × 0.055 = 228 kg/h
where:
  • KT—number of pieces molded in 1 h (pcs)
  • mT—weight of molded cheese (pcs)
The resulting weight of one piece at the end of the line:
m = mT + mo = 55 + 45 = 100 g
where:
  • mT—weight of 1 piece after shaping (g)
  • mo—the weight of the cheese package (g)
The efficiency of the forming machine according to the calculation was PT = 228 kg/h. Efficiency of the frying tunnel PF = 1500 kg/h and freezing tunnel PZ = 600 kg/h were known from the technical documentation of the machines.
Furthermore, the usability calculations of the individual three main machines were performed. The forming machine had the lowest efficiency at 4140 pcs/h, and in the calculations, this value was calculated as the default value, i.e., 100% (4140 pcs/h = 100%).
Usability of the frying tunnel:
PF/m = 1500/0.1 = 15,000 pcs/h
where:
  • PF—efficiency of the frying tunnel (kg/h)
  • m—weight of 1 piece of semi-finished product (kg)
Usability calculation:
KT/KF = 4140/15,000 = 27.6%
where:
  • KT—the number of pieces produced in 1 h on the forming machine (pcs/h)
  • KF—the number of pieces produced in 1 h in the frying tunnel (pcs/h)
Usability of the freezing tunnel:
PZ/m = 600/0.1 = 6000 pcs/h
where:
  • PZ—performance of the freezing tunnel (kg/h)
  • m—weight of 1 piece of semi-finished product (kg)
Usability calculation:
KT/KZ = 4140/6000 = 69%
where:
  • KT—the number of pieces produced in 1 h on the forming machine (pcs/h)
  • KZ—the number of pieces produced in 1 h in the freezing tunnel (pcs/h)
From the above calculations, it follows that the capacities of the forming machine and the freezing tunnel are noticeably lower than the capacity of the frying tunnel, which leads to inefficient use of all machines. It is therefore possible to replace the forming machine and the freezing tunnel. Table 2 shows that the frying tunnel has the highest output, i.e., 15,000 pcs/h.
The aim was to calculate the required performance of all three main machines of the original production line. This was done to match the performance and maximize the availability of all parts of the production line.
It is evident from Table 2 that the frying tunnel has the highest efficiency. The other two devices require higher efficiency. For the forming machine, the weight of one piece was only 55 g, which was 55% of the weight of one product that passes through the frying and freezing tunnels. This weight corresponds to the unwrapped cheese, which was chosen as a representative due to its highest production share.
Calculation of the necessary efficiency of the forming machine:
PpT = PF × 55% = 1500 × 0.55 = 825 kg/h
where:
  • PF—frying tunnel efficiency (kg/h)
The required efficiency of the freezing tunnel is the same as the efficiency of the frying tunnel, i.e., 1500 kg/h.
To make the initial analysis of the production complex and to determine the current state, it was necessary to describe and record the course of production on the original production line. The actual production of the breaded cheese on the original production line starts on the Seydellman cutting machine, where the Eidam cheese is cut to the required size. The cheese is then transferred to a UM 500 mixer, to which egg melange and flour are added. The mixer churns the raw materials into a mushy mass, resulting in a cheese mixture. This mixture is then transferred to the Koppens forming machine.
The Koppens forming machine consists of a pressure plate that pushes the cheese semi-finished product through a shaped hole in the shaping plate to the required shape and weight. This cheese is shaped in three pieces side by side. These already shaped cheeses fall onto a conveyor, which transports the cheese to the wet coater. In the wet coater, the cheese is coated with the first layer, and the cheese then passes through the conveyor into the dry coater, where the cheese is coated in breadcrumbs. The cheese then re-enters the second wet coater where it is coated. Next, the cheese is conveyed to a second dry coater where the cheese is coated in breadcrumbs a second time. The now breaded cheese is transported by conveyor through the frying tunnel, where the cheese is fried at temperatures of around 160 °C.
The finished cheese then enters the freezing tunnel at a temperature of around 90 °C and is constantly in motion, spiraling up to the higher part of the freezing tunnel and then exiting into the packing area. This cheese is frozen at −24 °C. This is followed by wrapping, placing in a box, and then on a pallet.
These pallets are then transported to cold store A. Depending on the need, these pallets are transported back to the packing area where they are repacked on the Econopack packing line into consumer packs of two to four pieces. They are placed on a pallet and wrapped in foil. These pallets of finished cheeses are taken back to warehouse A where they are stored until they are dispatched. The warehouses operate a FIFO (first in—first out) system. More on the FIFO method in retail, specifically in the food supply chain, is discussed in [22].
The production flow of the breaded foodstuffs on the original production line is shown in Figure 4. A description of the numbers of all production equipment is given in Table 3.
The packing line consists of four separate places, which are the weighing table, the gluer, the detector, and the packing table.
In the warehouses, the company applies the FIFO system, where the pallet that enters first must exit first. The warehouses are designed in such a way that it is more challenging to apply the FIFO system because of the loading and unloading from one side. For this reason, it takes longer to unload goods than if the racks were accessed from both sides. However, this access is not possible in warehouse areas due to the small space.
It is also necessary to show where the so-called hygiene loop occurred in the production of ready-made foods, and one place for the handover of pallets within the company. Their locations are shown in Figure 5, where the hygiene loop, intended for the passage of people between the clean and dirty zones, is highlighted by a green circle and separates the production area with the changing rooms. The pallet handover area is then highlighted with a yellow circle and is located between the production and storage areas.

3.2. Phase 2—Evaluation of the Acquired Knowledge

Based on the calculations made in the initial analysis, it was necessary to purchase a new forming machine and freezing tunnel. The performance calculations of the individual critical parts therefore showed that the performance of the forming machine and freezing tunnel was noticeably lower than that of the frying tunnel, resulting in inefficient use of all machines. There is a possibility to replace the forming machine and freezing tunnel. We would upgrade to the maximum capacity of the frying tunnel, which is 1500 kg/h. The results were consulted at all levels of management. The company management therefore decided to purchase a new, more powerful freezing tunnel and forming machine. This will increase production capacity while maintaining the current frying tunnel. The original production line will be maintained on the first floor of the ready-made foods production. An older frying tunnel and the original wet and dry coater were used. Additional refurbished older wet and dry coaters were purchased. It was decided to purchase new packaging lines.
Due to the contractual partners and low competition in the segment of production machines, a new forming machine with a capacity from 1500 kg/h to 4000 kg/h (depending on the product) was offered by the contractual company. The main part of the forming machine is the forming drum. In contrast to the original extrusion-plate forming, the forming machine works on the principle of continuous extrusion of the raw material through a rotating drum, thus shaping it.
The purchase of the new production equipment increases the width of the belt from 400 mm to 600 mm, allowing five products to fit side by side instead of the original three. There is also enough space in the retained frying tunnel to increase the width of the belt. In addition, a freezing tunnel has been offered with a capacity of 1500 kg/h to 1800 kg/h (depending on the product).
The capacity of the new production line will be set at 1500 kg/h, i.e., 15,000 pcs/h (for 100 g cheese), which corresponds to the maximum capacity of the existing frying tunnel. Based on a consultation with the company’s management, a space has been identified to locate the new production line on the ground floor of the ready-made foods production area, which is close to the warehouse. These areas are delineated by the purple dashed line in Figure 6.

3.3. Phase 3—Design of the Production Line Layout

In this section, layout designs were made for the layout of the production line in the designated production areas. For each option, the lengths of material flows were subsequently determined, and a projected calculation of the construction modifications was made. The designs were developed in relation to the hygiene requirements and path width requirements of the relevant standards.
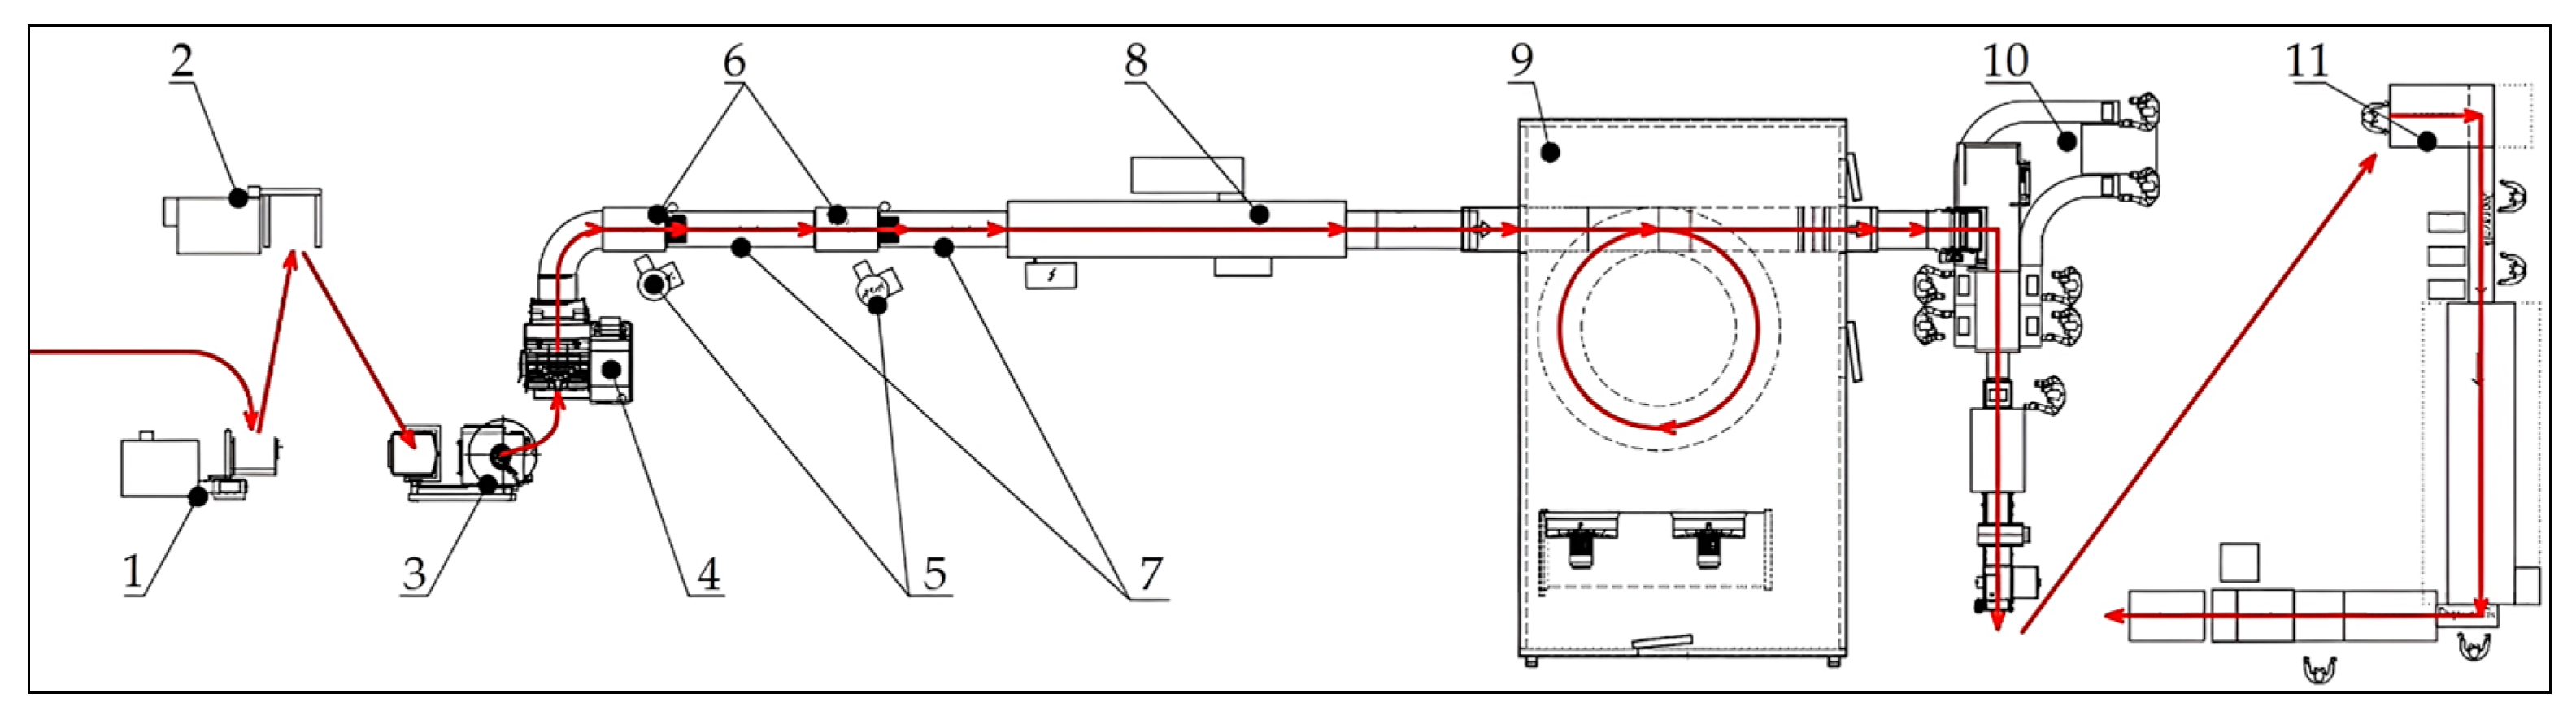
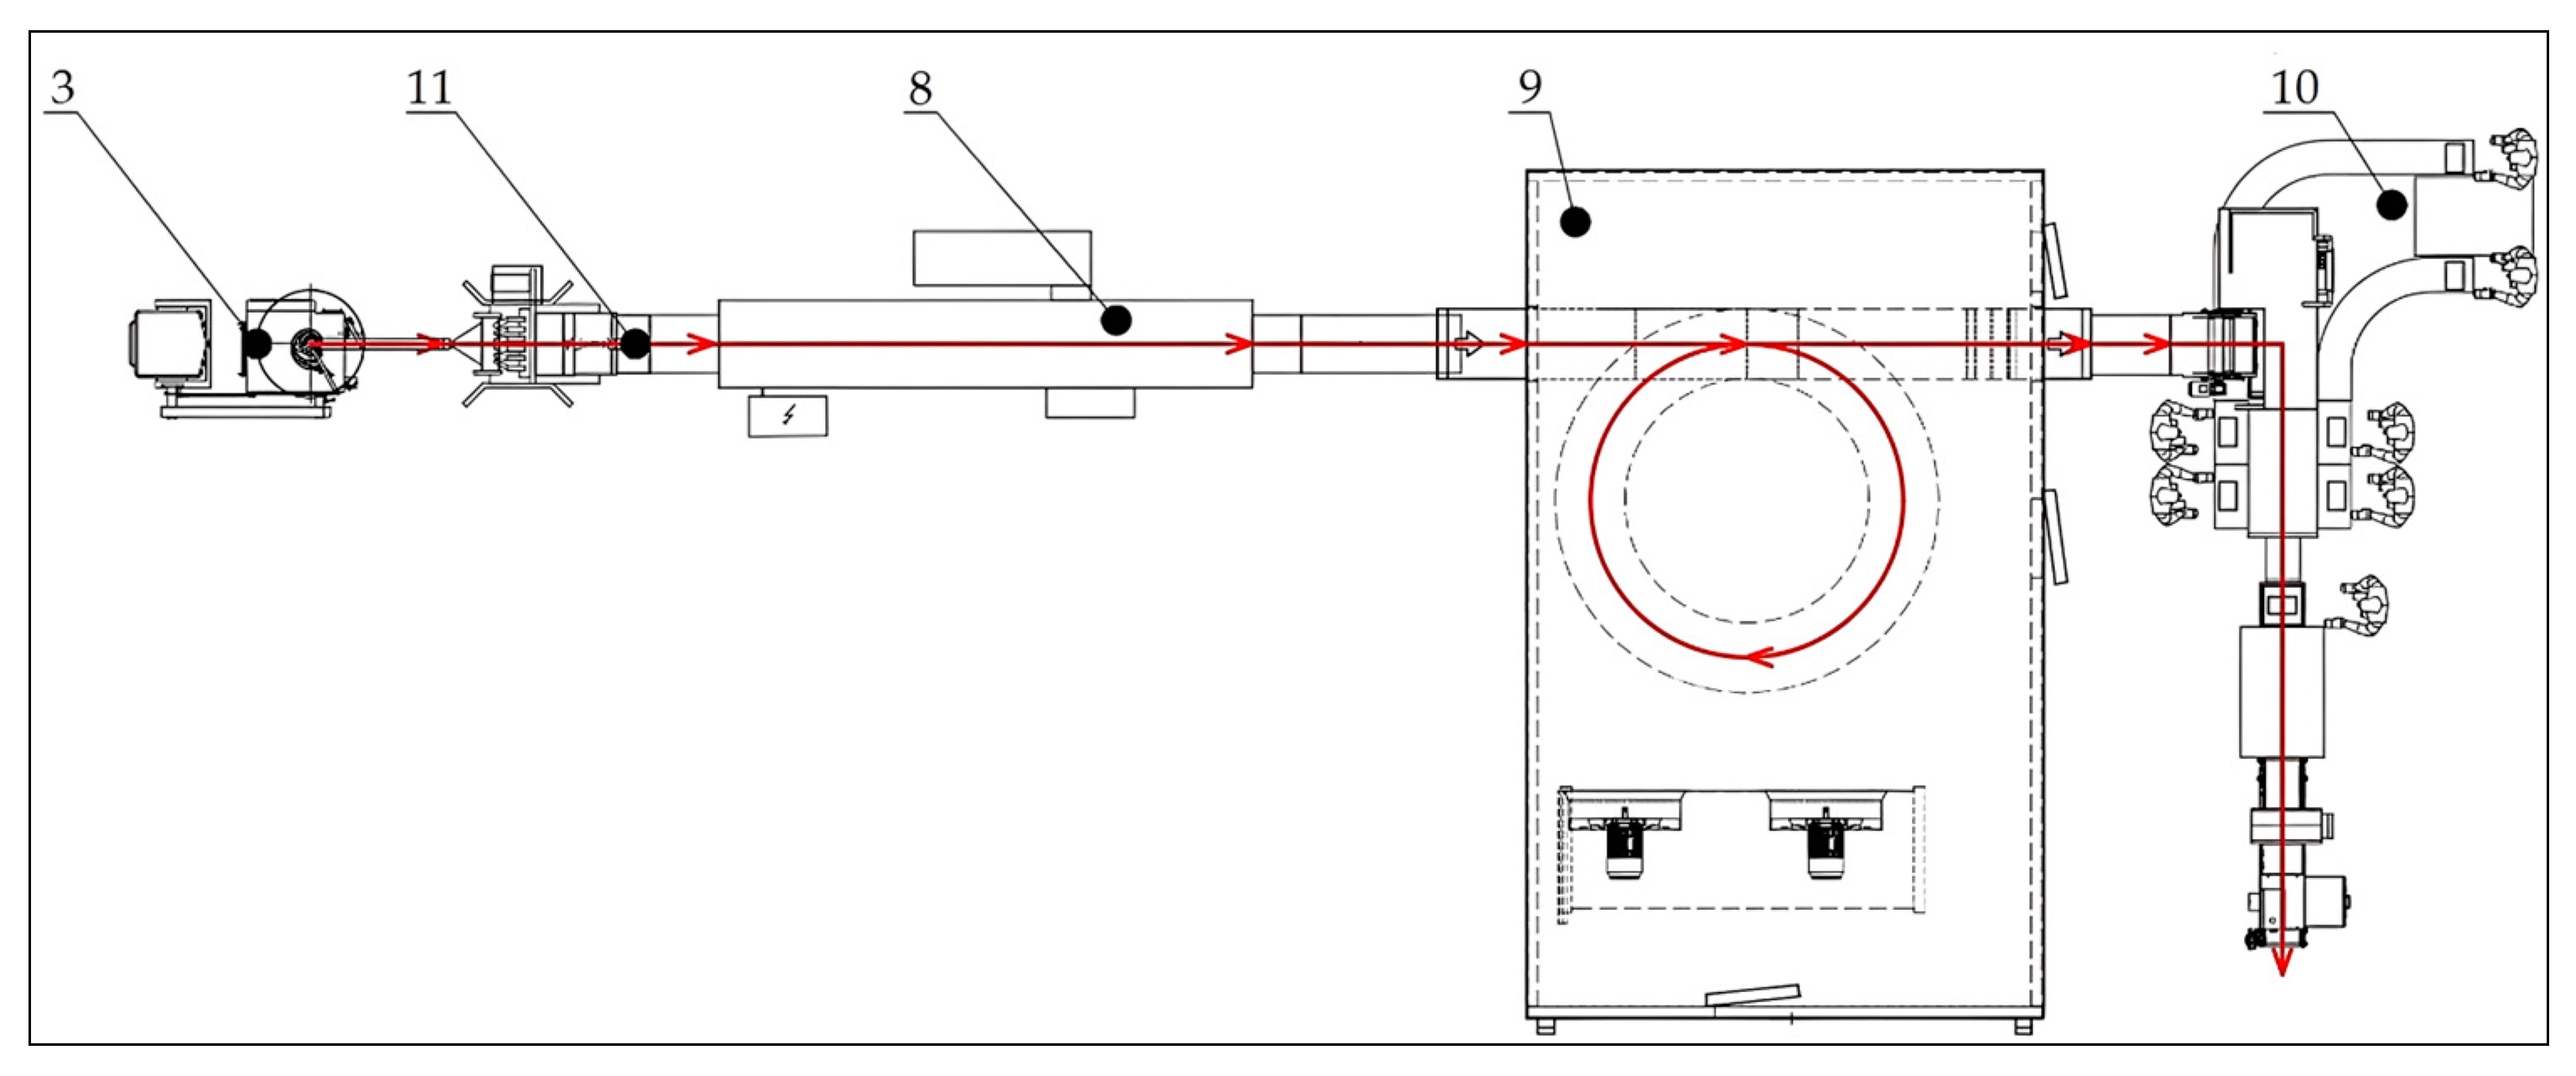
The actual production process on the new production line is similar to that on the original production line. What is different is the way in which the cheese is shaped in five rows (originally in three rows) using the principle of continuous extrusion by means of a rotating drum. The filling of the forming machine is also different. In the new production line, the mixture is tipped into a vacuum filling machine, which pushes the cheese mixture into the forming machine.
Figure 7 shows a diagram of the production process with the designation of the individual machines (Table 4). The start of production is at machine number 1, the Seydellman cutter, and the end at the Econopack packer.
However, the layout must consider the location of the drum washer and drum holder. The drum washer and drum holder must be located close to the vacuum filling machine.
The output of the new Merell forming machine, where the cheese is formed to the required shape and weight, can be seen in Figure 8, with shaped cheese coming out of the five-row forming machine.
The last machine on the new production line is the Econopack packer. Automated packing into consumer boxes takes place here. Figure 8 shows the packaging of cheese in two pieces.
In addition to breaded foods, the new production line (Figure 7) can also produce potato croquettes or liver dumplings. For this production, however, other equipment must be connected to the production line. Sanitation is required whenever production is changed, production is shut down, etc. The sanitation itself consists of dismantling the production line and cleaning all the individual equipment. This sanitation takes three hours. The sequence of the various production facilities in the production of croquettes or liver dumplings is illustrated in Figure 9.
When making croquettes or liver dumplings, both wet and dry coaters and the forming machine are taken off the production line. Furthermore, the Seydellman cutter and mixer are not required for production. Thus, there is only the connection of the Verbuffa, which is located under number 11 in Figure 9. The Verbuffa is connected on the outlet side to the Mayn frying tunnel and on the inlet side to the vacuum filling machine. For other names of machinery, see Table 4.
In terms of hygiene, it is necessary to divide production and nonproduction areas into clean and dirty zones, where clean zones are the parts of the production areas where production is carried out. Alternatively, where raw material, semifinished, or finished unpacked product is handled. The parts of the production plant are therefore divided according to Figure 10, where the clean zone is marked in blue and the dirty zone in grey.
In production, a main traffic route with one lane for one direction of travel and one side lane for the movement of people without load was considered. The maximum width of the lift truck was assumed to be 1.6 m, the width of the side lane for unladen traffic in both directions is 750 mm, and the safety clearance is 200 mm. It was also necessary to consider the necessary structural modifications (material, work, transport, rental of construction equipment), which are often required to set up new production lines in companies [23,24].
The width of the main road:
W = A + 750 + 200 = 1060 + 750 + 200 = 2010 mm
where:
  • A—the width of the lane (mm)
The production area is not used for the passage of people or materials for other production, so there is no need to consider all production locations with a width of 2010 mm. It is possible in some places to use widths of only 1460 mm in places where it is necessary to reach with a pallet truck. In the most extreme case, it is possible to consider a gap of only 1100 mm, where there will be a clearance of only 40 mm, but the possibility of transporting pallets will still be ensured. In places where there is only movement of people, it will be necessary to leave an aisle with a width of at least 600 mm for the movement of people in one direction, or 750 mm for the movement of people in both directions [23,24].
For the location of the production line in the chosen production area, two main options were offered, where one option has the production direction from left to right and the other from right to left.
Option 1—left direction of production
In the following Option 1, there is no significant saving of empty space that could be used for other production. Compared to Option 2, this option requires fewer construction changes. For example, the existing interim storage of pallets can be used. Existing hygiene loops and material transfer points can also be used. Figure 11 shows the material flows for Option 1—left direction of production.
Material flows for Option 1 were also calculated. To do this, it was necessary to determine the proportions of individual raw materials, semifinished products, and packaging needed to produce one piece of product. For each item, the distance to transport the pallet from the warehouse to the point of consumption, as well as the number of pieces or weight per pallet, were defined. From this, it can then be derived how many pallets of raw material, semifinished goods, or packaging need to be transported from or to the warehouse (Table 5).
The production line runs in three shifts of 7.5 h, seven days a week. In the calculations, continuous cheese production for one week was assumed. Including one sanitation, the production will be 3 h less in one week. This is only the theoretical maximum production time if the line runs continuously without breakdowns, and there will be no exchange to produce croquettes or liver dumplings. A total of 231,750 kg (2,317,500 pieces) of breaded 100 g cheese should be produced in this time. The consumption of all semifinished products, raw materials, and packaging for this production was then calculated. In addition, the number of pallets transported, and the total distance travelled with pallets in one week were given. The total distance travelled in one week for Option 1 was 155,979 km (Table 6); after conversion to one year, this value is 8,110,908 km.
Distance travelled in 1 year:
s1r = s1t × 52 = 155,979 × 52 = 8,110,908 m
where:
  • s1r—weekly run (m) for option 1
  • 52—number of weeks in a year
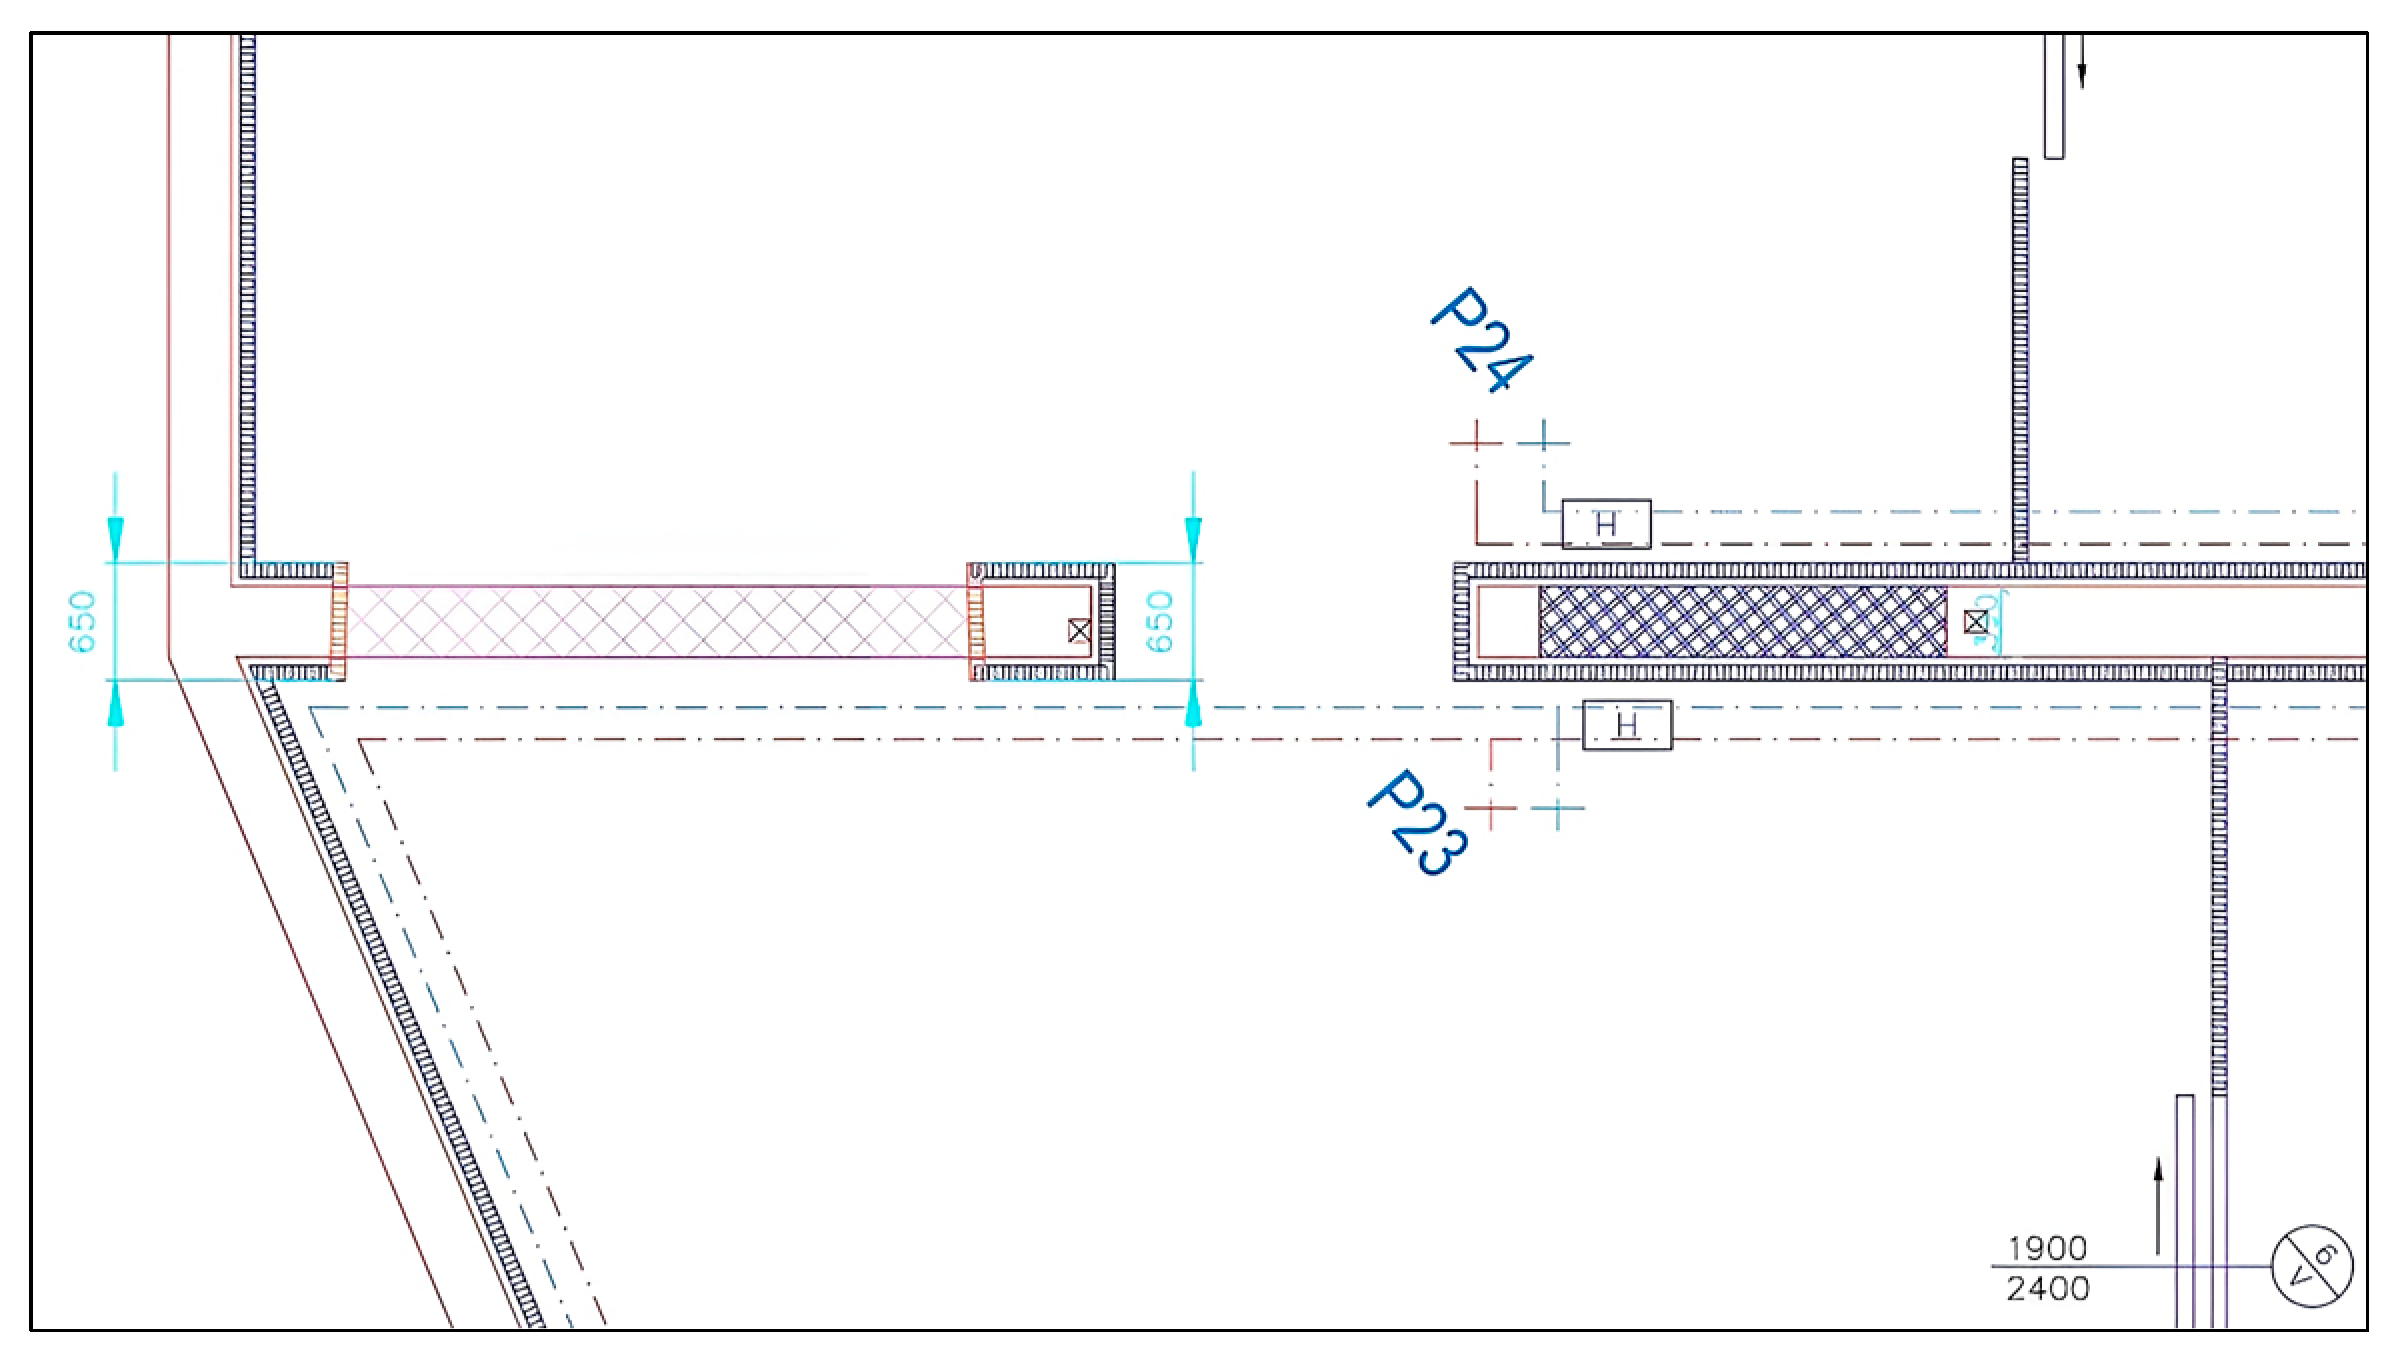
In the next part of the design, the path widths in the production areas were checked. This was based on the relevant standards, for example, the Czech standards CSN 26 9010 for materials handling, including requirements for the width and height of roads and aisles, and CSN 73 5105 dealing with industrial buildings for production purposes. The lift truck movement is shown in green and the movement of people in pink. The arrow indicates only one direction of travel. However, the return of the lift truck and persons is also considered. There should not be frequent passing in both directions. The bottlenecks are dimensioned in Figure 12, which shows that a smooth passage will be ensured. The pallet locations are purely indicative. The pallet can be placed as per the actual need of the production operator. The narrowest space (750 mm) for operator passage in this Option 1 is between the Econopack packer and the back wall. Here, however, occasional operator passage in one direction is envisaged. The narrowest space (1.7 m) for transporting pallets is between the vacuum filling machine and the column. Here, the transport of pallets and the occasional passage of persons is envisaged. All freezer doors can also be considered as bottlenecks because of their usual width (1.9–2 m). However, these passageways are usually only used when coming in or out of a shift or during breaks [23,24].
The next necessary step was the construction changes (Figure 13), which had to be calculated to determine the cost of this option. Demolition of 36 m of PUR panel walls (80 mm wide) and 3.6 m of masonry with a constant width of 390 mm would be required. In addition, three freezer doors and one lamellar screen will need to be dismantled. The ceiling height is 3.5 m. All costs in the calculations were converted from CZK to EUR according to the current exchange rate.
The calculations included the following: the total area of the walls to be demolished, an estimate of the demolition price, the area of the walls to be completed, an estimate of the price for the PUR panels (material), an estimate of the installation price, and an estimate of the transport price.
Wall area to be demolished:
Sd1 = lp1 × v1 + lz2 × v1 = 36 × 3.5 + 3.6 × 3.5 = 140 m2
where:
  • lp1—length of the PUR panel wall for the Option 1 (m)
  • lz1—length of masonry wall for Option 1 (m)
  • v1—wall height for Option 1 (m)
Demolition price estimate:
D1 = Sd1 × cd + m1 × cdm + lc1 × cdlc = 140 × 2.2 + 3 × 5 + 1 × 1.6 = 324.6 EUR
where:
  • Sd1—area of walls to demolish for Option 1 (m2)
  • cd—price of wall demolition (EUR/m2)
  • m1—number of freezer doors to remove for Option 1 (pcs)
  • cdm—the price of dismantling the freezer door (EUR/pcs)
  • lc1—the number of lamella screens to be dismantled for Option 1 (pcs)
  • cdlc—the price of disassembling lamella blinds (EUR/pcs)
Area of walls to be completed:
Sv1 = lp2 × v1 = 1.3 × 3.5 = 4.5 m2
where:
  • lp2—length of PUR panel wall to be completed for Option 1 (m)
  • v1—wall height for Option 1 (m)
Price estimate for PUR panels (material):
Pp1 = Sv1 × p2 = 4.5 × 54.3 = 244.4 EUR
where:
  • Sv1—area of walls to be completed for Option 1 (m2)
  • p2—price for PUR panels (EUR/m2)
Installation price estimate:
Pm1 = Sv1 × (p1 + p4) + Lm1 × c1 × v1 = 4.5 × (14.6 + 2.3) + 4 × 5.4 × 3.5 = 151.7 EUR
where:
  • Sv1—wall area to be completed for Option 1 (m2)
  • p1—price for the installation of PUR panels (EUR/m2)
  • p4—price for assembly—screws (EUR/m2)
  • Lm1—the number of screens needed for Option 1 (pcs)
  • cl—price for 1 slat (EUR/m)
  • v1—wall height for Option 1 (m)
Price estimate for transport and rental fees:
Pdp1 = dd × n1 + hp × n1 = (dd + hp) × n1 = (38 + 168) × 1 = 206 EUR
where:
  • dd—cost of transportation of workers (EUR/day)
  • n1—estimated length of reconstruction (day)
  • hp—rental hydraulic platforms and scaffolding (EUR/day)
In this option, the use of existing hygiene loops and material transfer points was envisaged. The need for a new refrigerated or freezer warehouse was not assumed.
The estimated total cost of the construction changes for Option 1 is very low, amounting to less than EUR 1000. In this variant, it is necessary to demolish only a few meters of walls and cover two opposite walls with PUR panels.
The total estimated price of the space modifications:
C1 = D1 + Pp1 + Pm1 + Pdp1 = 324.6 + 244.4 + 151.7 + 206 = 926.7 EUR
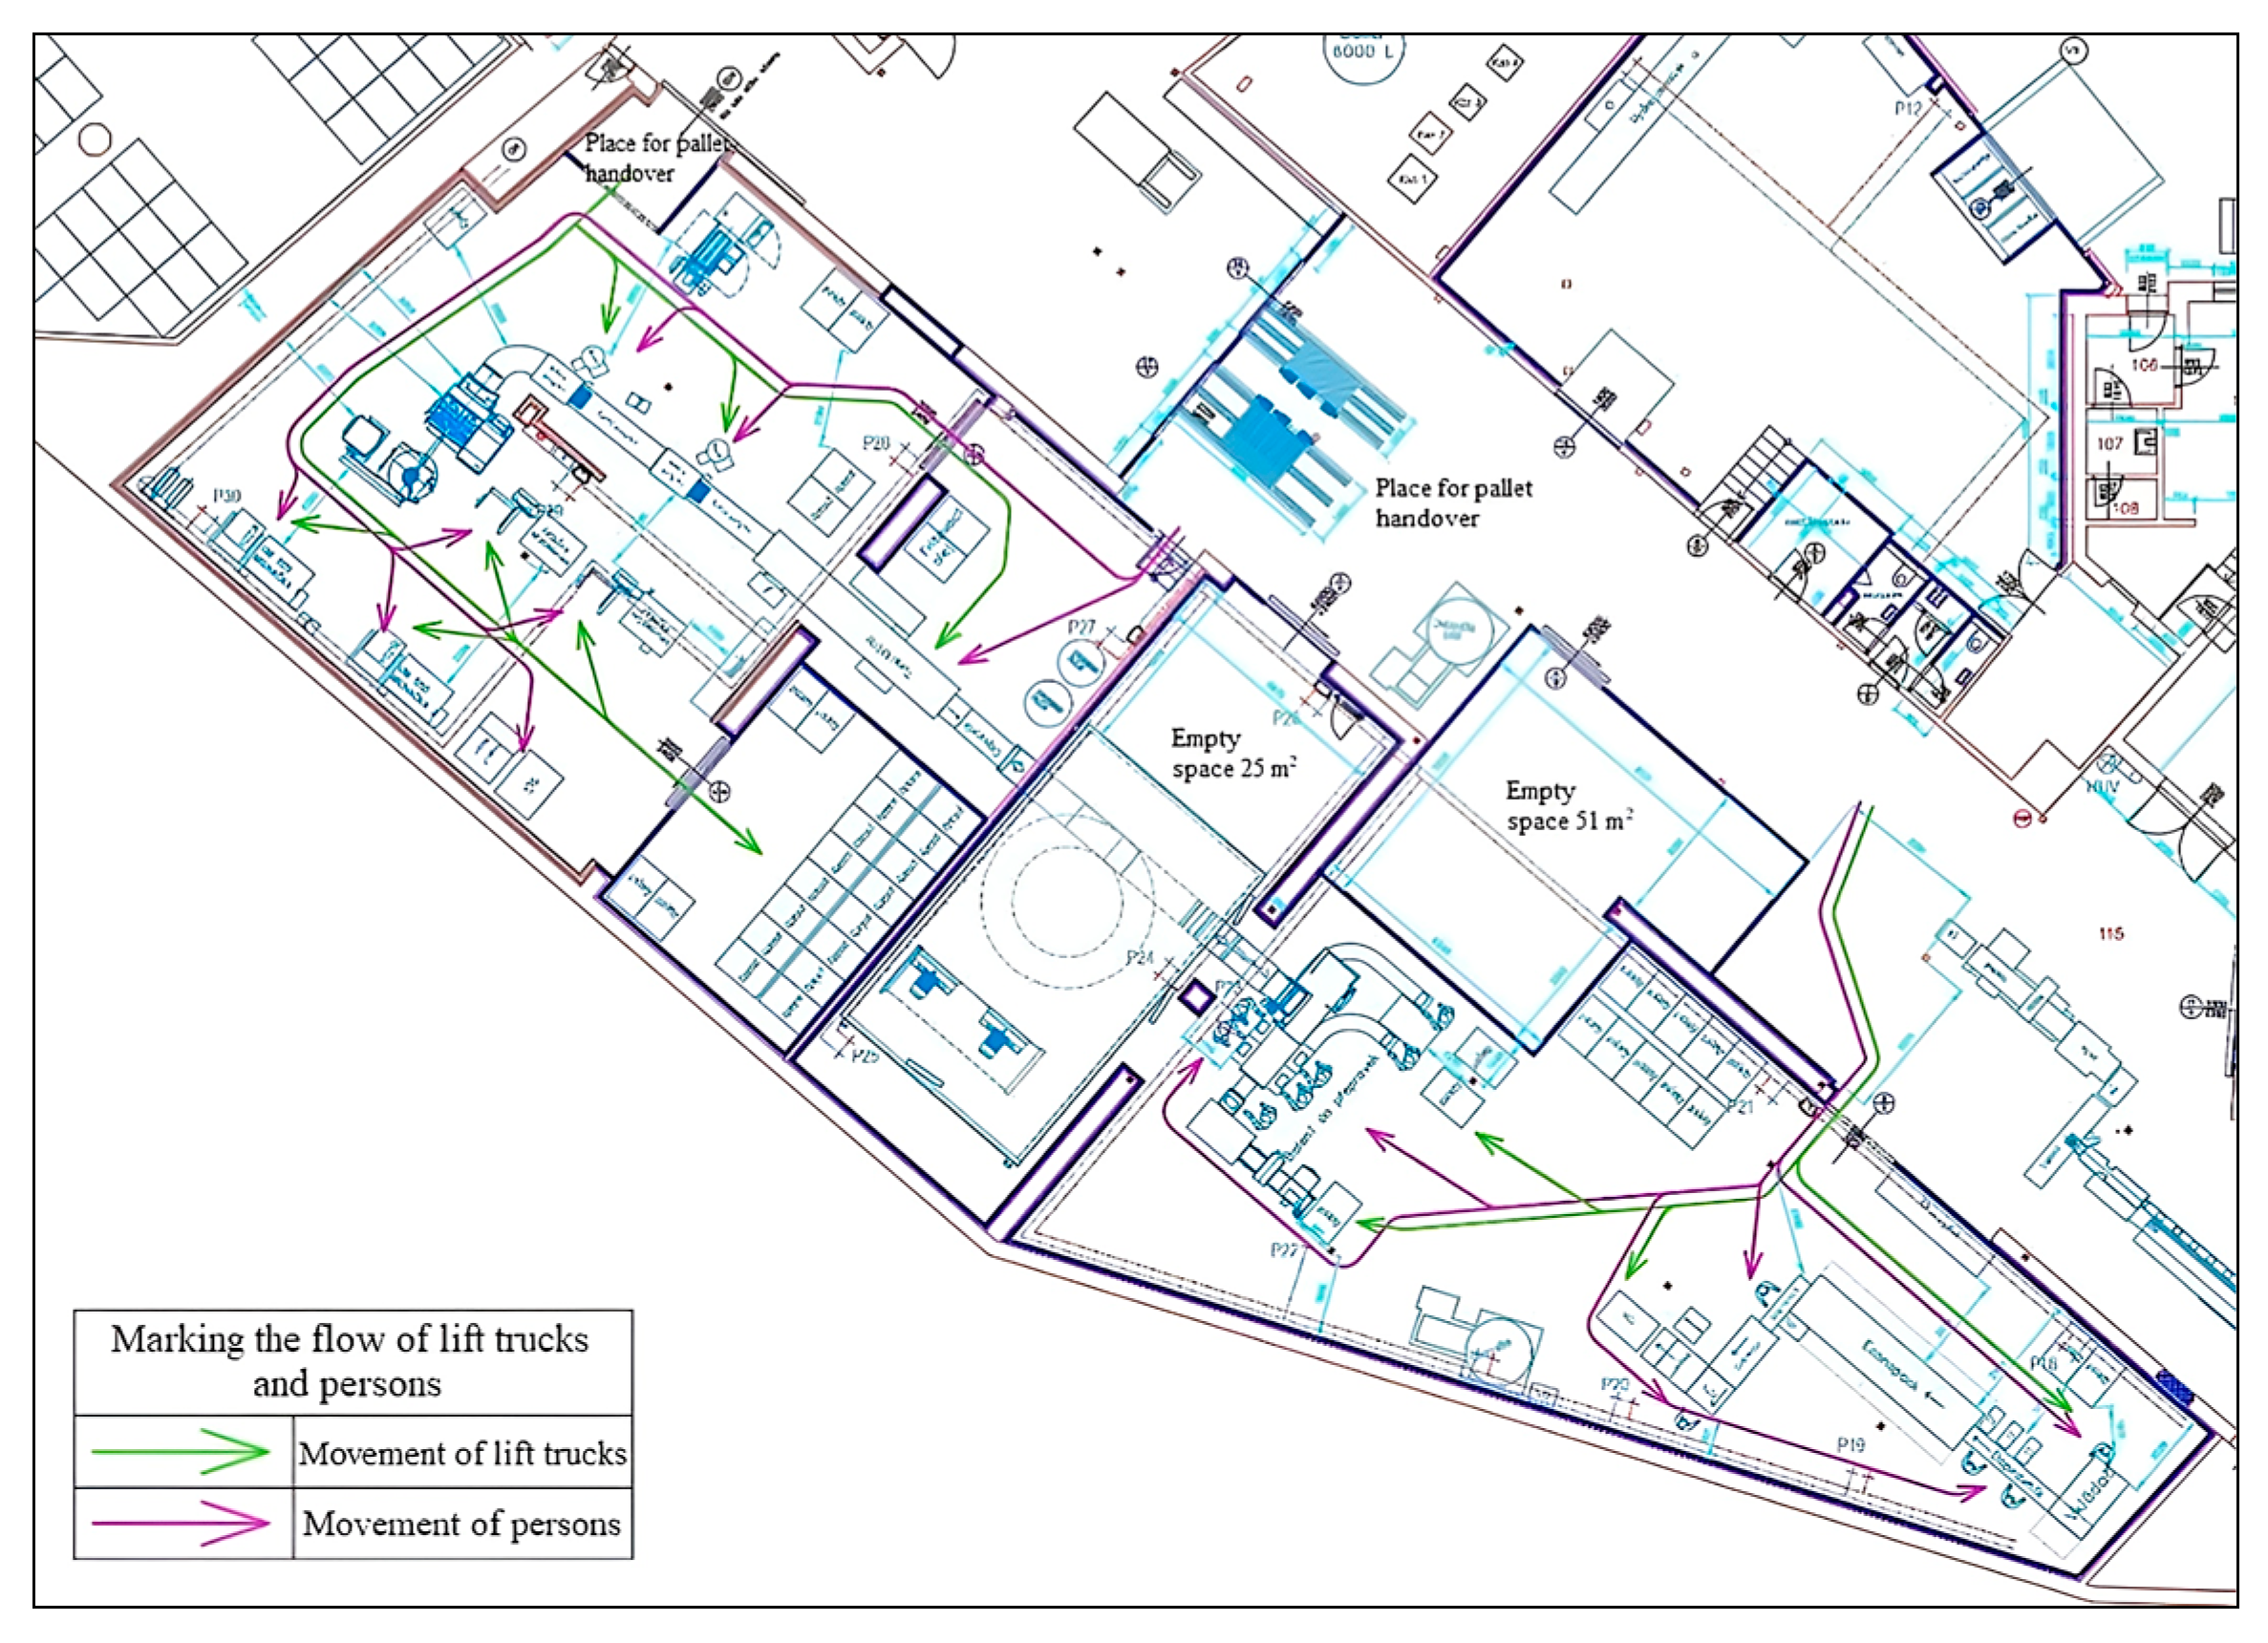
Option 2—right direction of production
The second variant is the location for the opposite direction of production—from right to left. The main advantage of this variant is the saving of two unused spaces of 25 m2 and 51 m2, which can be connected and used for other production. On the contrary, the disadvantage at first glance is the greater construction changes of the production areas. The creation of a new cold store is needed to bring in semifinished products and raw materials before production starts. In this variant, raw materials and semifinished goods are brought in from warehouses outside the main pallet transfer point. Therefore, a new pallet transfer point must be created between the storage area (dirty zone) and the production area (clean zone). Workers can then move through the main hygiene loop, which is one in these areas, at the changing rooms on the opposite side of the production plant. It will also be necessary to allocate (or purchase) one pallet truck specifically for these areas, as the trolley cannot go to other production areas without going through the dirty zone. A representation of the material flows for Option 2 is shown in Figure 14.
In this option, pallets of raw material/semifinished goods will be loaded through the transfer point to the new cold store before production starts. After the actual start of production, the pallets of raw material/semifinished goods will be transported to the individual machines as required.
As with the previous option, material flows were subsequently determined. The proportions of each raw material, semifinished product, and packaging required to produce one piece of product were defined (Table 7).
The production line runs in three shifts of 7.5 h, 7 days a week. In the calculations, continuous cheese production for one week was assumed. If one sanitation is included, the production will be 3 h shorter in one week, which is 154.5 h. Again, this is only the theoretical maximum production time if the line runs continuously without breakdowns, and there will be no exchange to produce croquettes or liver dumplings. A total of 231,750 kg (2317 500 pieces) of breaded 100 g cheese should be produced in this time. Subsequently, the consumption of all semifinished products, raw materials, and packaging for this production was calculated. The number of pallets transported, and the total distance travelled with pallets in one week were also given. The total distance travelled in one week for Option 2 was 206,289 km (Table 8); after conversion to one year, this value was 10,727,028 km.
Distance travelled in one year:
s2r = s2t × 52 = 206,289 × 52 = 10,727,028 m
where:
  • s2r—weekly run in (m) for Option 2
  • 52—number of weeks in a year
In the next part of the design, the widths of the paths in the production areas were checked according to CSN 26 9010 and CSN 73 5105, as in Option 1 [23,24]. The lift truck movement is shown in green in the figure and the movement of people is shown in pink. The arrow indicates only one direction of movement, but movement in both directions is possible. It is not anticipated to have regular movement of the pallet truck or persons in both directions at the same time. The bottlenecks are indicated in Figure 15. As can be seen from the figure, the smooth passage of people and trucks will also be ensured in this variant. The pallet locations are approximate, and the pallets can be positioned at will according to the actual needs of the production operator. The narrowest space (950 mm) for the passage of people is at the Econopack packer between the table behind the detector and the wall. Here, the occasional passage of two production operators to the conveyor belt is envisaged. In addition, one production operator works in the so-called bottleneck. However, he can approach the table from a different angle. The narrowest place for the movement of the lift truck is again at the Econopack packer, but now on the other side of the inserter. However, there is enough space (1.37 m) for loading or unloading pallets. The box packing line can also be folded at an angle, which is more suitable in this case, and gives an extra 500 mm of walk-through width. Another advantage will be the optimal positioning of the pallet, which will not block the passage of two operators working from opposite sides of the packer.
The next necessary step was the construction changes (Figure 16), which had to be calculated to determine the cost of Option 2. Here, 52 m of PUR panel walls (80 mm wide) had to be demolished. Six freezer doors and one lamellar screen will have to be dismantled. See Figure 16 for demolition. The walls to be demolished are highlighted in orange. In this option, the pallet transfer area must be extended with PUR panel partitions (80 mm wide) by a total of 2.7 m to a height of 3.5 m. It is also planned to complete the cold store, which will require the addition of 14.5 m of PUR panel walls to a height of 3.5 m. There will also be a need for the installation of refrigeration doors. In the picture, the new PUR panels are highlighted in orange, with the door in green and the lamellar screen in black. All costs in the calculations were converted from CZK to EUR according to the current exchange rate.
The calculations included the following: the total area of the walls to be demolished, an estimate of the demolition price, the area of the walls to be completed, an estimate of the price for the PUR panels (material), an estimate of the installation price, and an estimate of the transport price.
Wall area to be demolished:
Sd2 = lp2 × v1 + lz2 × v2 = 52 × 3.5 + 0 × 3.5 = 182 m2
where:
  • lp1—length of PUR panel wall for Option 2 (m)
  • lz1—length of masonry wall for Option 2 (m)
  • v2—wall height for Option 2 (m)
Demolition price estimate:
D2 = Sd2 × cd + m2 × cdm + lc2 × cdlc = 182 × 2.2 + 6 × 5 + 1 × 1.6 = 432 EUR
where:
  • Sd2—area of walls to demolish Option 2 (m2)
  • cd—price of wall demolition (EUR/m2)
  • m2—number of freezer doors to be dismantled for Option 2 (pcs)
  • cdm—the price of dismantling the freezer door (EUR/pcs)
  • lc2—number of lamellar screens to be dismantled for Option 2 (pcs)
  • cdlc—the price of disassembling lamella screens (EUR/pcs)
Area of walls to be completed:
Sv2 = (lp3 + lp4) × v2 = (2.7 + 14.5) × 3.5 = 60 m2
where:
  • lp3—the length of the PUR panel wall to complete the place for handing over the pallets (m)
  • lp4—the length of the PUR panel wall for the completion of the cold store (m)
  • v2—wall height for Option 2 (m)
Estimated price for PUR panels (material):
Pp2 = Sv2 × p2 = 60 × 54.3 = 3258 EUR
where:
  • Sv2—wall area to be completed for Option 2 (m2)
  • p2—price for PUR panels (EUR/m2)
Installation price estimate:
Pm2 = Sv2 × (p1 + p4) + Lm2 × c2 × v2 + mv × cv + md × cmcl = 60 × (14.6 + 2.3) + 1 × 5.4 × 3.5 + 1 × 21 + 1 × 21 = 1074.9 EUR
where:
  • Sv2—wall area to be completed for Option 2 (m2)
  • p1—price for the installation of PUR panels (EUR/m2)
  • p4—price for assembly—screws (EUR/m2)
  • Lm2—the number of screens needed for Option 2 (pcs)
  • c2—price for one screen (EUR/m)
  • v2—wall height for Option 2 (m)
  • mv—the number of installed doors (pcs)
  • cv—door installation price (EUR/pcs)
  • mcl—the number of installed screens (pcs)
  • cmcl—the price of installing screens (EUR/pcs)
Estimated price for transport and rental fees:
Pdp2 = (dd + hp) × n2 + dm = (38 + 168) × 5 + 1000 = 2030 EUR
where:
  • dd—cost of transportation of workers (EUR/day)
  • n2—estimated length of reconstruction (day)
  • hp—rental hydraulic platforms and scaffolding (EUR/day)
  • dm—the cost of transporting the material (EUR)
The estimated total cost of the construction changes for Option 2 is approximately EUR 6800. In addition, a new cold store and pallet transfer area had to be created for this option, which significantly increased the price. However, due to the circumstances that the entire premises already had PUR panel roofs, there was no need to create new roofs, thus saving a significant part of the investment.
The total estimated price of the space modifications:
C2 = D2 + Pp2 + Pm2 + Pdp2 = 432 + 3258 + 1074.9 + 2030 = 6794.9 EUR
A relatively important advantage of Option 2 is the saving of 25 m2 and 51 m2 of space that can be used for setting up other production machines. The empty spaces are shown in Figure 17.
These spaces have a floor at the same floor height and, therefore, after a possible structural check and possible strengthening of the ceiling, the bearing wall between them could be broken through, thus connecting these spaces.

4. Evaluation of the Results

In the section of the analysis of the current situation in terms of existing production, an increase in production capacity was made with the need to purchase some new production equipment in the required capacities, such as a freezing tunnel or a forming machine. It was also decided to maintain the original production line on the first floor of the factory.
The main reason for the purchase of a new production line was the need to increase production capacity. Based on this, the performances of the critical equipment (freezing tunnel, frying tunnel, and shaper) were calculated. From the calculations, the bottleneck was found to be the shaper. However, after replacing the shaper with a new one, the freezing tunnel would also become another bottleneck. This would of course continue to the fryer tunnel as well. In terms of capacity, at least for the time being, it was enough to replace the freezing tunnel and the shaper in the company. In the end, even though it was initially considered to simply replace the original line, in addition to the purchase of a new line to the new premises, the original line was also preserved and is located in the original location.
The original forming machine shaped three cheeses side by side, while the new one can shape five cheeses side by side. At the same time, the conveyor belt had to be replaced with a wider one, from the original 400 mm to 600 mm. The original forming machine shaped the cheese in a cyclic linear up and down movement, while the new one works on the principle of a rotating drum, so shaping is faster.
The belt must move along the entire length of the line at the same speed, which is determined by the track inside the freezing tunnel and its efficiency. The cheese must be in the freezing tunnel for about 1 h to freeze at −20 °C. The new freezing tunnel is therefore larger, the cheese inside travels a longer distance, and therefore stays in the tunnel longer and has a higher efficiency. Therefore, the conveyor belt can have a higher speed.
In the comparison of the proposed options, it was decided to locate the production line according to the design of Option 1. However, this option will not save any space that could be used to situate other technology. A comparison of the advantages and disadvantages of the two options is presented in Table 9.
Material flows must be divided by handover point that define the boundaries between warehouses (dirty zone) and production (clean zone). The movement of material inside the warehouses (to the handover point) is ensured by large electric lift trucks and is carried out by warehouse employees. In production (from the handover point to the machine), manually guided pallet trucks are ensured by the line operator. The handover points are marked in Figure 18. The lift truck operator drives the semifinished products towards the handover point as needed (mostly before the start of the shift or batch). They also take finished products to freezer warehouses, so they rarely go back empty, but it can always happen depending on the current situation. The transportation of raw materials between the production line and the handover point is ensured by the line operator. They usually bring in the necessary raw materials at the beginning of the shift or batch. Only empty pallets or possible waste are taken back from the production line. The operator only weighs the packaging to the packaging line, but takes away the finished products.
The authors believe that automation would be beneficial; however, automation was not required at the time of solution. It would probably be necessary to automate all material transports, which would be expensive in terms of acquisition costs, and would deserve its own project.
A comparison of the production performance of the original setup of the original production line with the new setup of the new production line is shown in Table 10.
The capacity was increased by 15,000 pieces per hour; the production of wrapped cheese was calculated, which represents 75% of all products produced on the production line.
The investment in new production facilities was also evaluated from an economic and legal point of view. For the economic evaluation, it was necessary to know all the expenses for the acquisition of machinery—the price of the machinery including VAT, the price of labor and commissioning, the price of construction changes, etc. In addition, the method of financing was also an important factor—not only whether it was financed from own or external sources, but also whether subsidies were used. Furthermore, the payback period of the investment was calculated, which came out to five years. From a legal point of view, it is necessary to comply with the applicable legislation. It is also important, for example, to conclude the right type of contract, to select the contractor and the related public tender problem, to write the grant application, to select the appropriate delivery terms (the possibility of using INCOTERMS clauses—see [25] for details), etc. Due to the focus of this paper, only the estimated cost of the construction changes is included in the comparison, which has an impact on the choice of the option. The evaluation of the overall investment can thus be the subject of another article.

5. Conclusions

The aim of this paper was to design the layout of the production line for its optimization. Thanks to the optimization carried out, the production on the production line became more efficient in connection with the accuracy of the production of individual machines and their mutual continuity on the production line. In the initial part of the analysis of the current situation in terms of existing production, depending on the requirement for an increase in production capacity, it was decided that there was a need to purchase some new production equipment, such as a freezing tunnel and a forming machine. The decision was taken by the company management to purchase these machines in the required capacities. It was also decided to maintain the original production line on the first floor of the factory.
The layout solution was created in the designated part of the production. The case study itself deals with two basic options for the layout of the production line, depending on the continuity of material flows and the sequence of production.
Based on the analyses, it was decided to locate the production line according to the Option 1 design, mainly because of the higher continuity of material flows, larger space for material handling, and lower purchase price, including simplicity of construction changes. However, this option does not save any space that could be used to situate other technology.
Comparing the production performance of the new production line with the old line, the new production line has 3,6 times higher production than the old line. If both production lines are used simultaneously, the production will increase by 15,000 pcs per hour. The new production line is already in operation under Option 1. The estimated payback period for the investment is five years.

Author Contributions

Conceptualization, M.B. and J.L.; methodology, M.B. and J.L.; validation, M.B., L.K. and I.H.; formal analysis, M.B.; investigation, M.B. and J.L.; resources, M.B.; data curation, M.B. and J.L.; writing—original draft preparation, M.B.; writing—review and editing, L.K. and I.H.; visualization, M.B. and J.L.; supervision, I.H. All authors have read and agreed to the published version of the manuscript.

Funding

This paper has been done in connection with project “Centre of Advanced Nuclear Technology II. (CANUT II.), Reair technologies”, reg. no. TN02000012 and financed by Technology Agency of the Czech Republic (TACR) and project “Research and Optimization of Engineering Technologies”, reg. no. SP2023/020 financed in 2023 at the Faculty of Mechanical Engineering VŠB-Technical University of Ostrava.

Institutional Review Board Statement

Not applicable.

Informed Consent Statement

Not applicable.

Data Availability Statement

The data presented in this study are available in the article.

Acknowledgments

The authors also want to thank Ing. Michaela Bučková for her advice and consultations in the field of economics and law needed for individual analyses.

Conflicts of Interest

The authors declare no conflicts of interest.

References

  1. Lehocka, D.; Hlavaty, I.; Hloch, S. Rationalization of Material Flow in Production of Semitrailer Frame for Automotive Industry. Teh. Vjesn. Tech. Gaz. 2016, 23, 1215–1220. [Google Scholar] [CrossRef]
  2. Buckova, M.; Krugerova, M.; Kozieł, M.; Stverkova, H. Risk classification in international trade using methods of cluster analysis. Forum Sci. Oecon. 2023, 11, 91–112. [Google Scholar] [CrossRef]
  3. Afteni, C.; Frumuşanu, G. A Review on Optimization of Manufacturing Process Performance. Int. J. Model. Optim. 2017, 7, 139–144. [Google Scholar] [CrossRef]
  4. Afazov, S.M. Modelling and simulation of manufacturing process chains. CIRP J. Manuf. Sci. Technol. 2013, 6, 70–77. [Google Scholar] [CrossRef]
  5. Krejci, L.; Schindlerova, V.; Bucko, M.; Hlavaty, I. Application of a process FMEA for the welding. In Proceedings of the METAL 2018: 27th International Conference on Metallurgy and Materials, Brno, Czech Republic, 23–25 May 2018. [Google Scholar]
  6. Bucko, M.; Schindlerova, V.; Hlavaty, I. Application of Six Sigma Tools in the Production of Welded Chassis Frames. MM Sci. J. 2020, 2020, 4188–4193. [Google Scholar] [CrossRef]
  7. Naeem, K.; Ullah, M.; Tariq, A.; Maqsood, S.; Akhtar, R.; Nawaz, R.; Hussain, I. Optimization of steel bar manufacturing process using six sigma. Chin. J. Mech. Eng. 2016, 29, 332–341. [Google Scholar] [CrossRef]
  8. Nenzhelele, T.; Trimble, J.A.; Swanepoel, J.A.; Kanakana-Katumba, M.G. MCDM Model for Evaluating and Selecting the Optimal Facility Layout Design: A Case Study on Railcar Manufacturing. Processes 2023, 11, 869. [Google Scholar] [CrossRef]
  9. Lv, M.; Sun, X.D.; Wang, G.; Che, Y. Resource Modeling of Manufacturing Process Optimization under Dynamic Environment. Adv. Manuf. Syst. 2011, 201–203, 878–881. [Google Scholar] [CrossRef]
  10. Saderova, J.; Rosova, A.; Sofranko, M.; Kacmary, P. Example of Warehouse System Design Based on the Principle of Logistics. Sustainability 2021, 13, 4492. [Google Scholar] [CrossRef]
  11. Delgado, S.; Rolando, D. Material Flow and Layout: An Integrative Analysis; Vydavatelství a Nakladatelství Aleš Čeněk: Plzeň, Czech Republic, 2016. [Google Scholar]
  12. Molnar, V.; Cempirek, V.; Turek, M.; Fiala, D. Design of Production Lines and Logistic Flows in Production. Open Eng. 2021, 11, 853–859. [Google Scholar] [CrossRef]
  13. Rudolf, K.; Martina, H. Modelling a production process using a Sankey diagram and Computerized Relative Allocation of Facilities Technique (CRAFT). Open Eng. 2019, 9, 444–449. [Google Scholar] [CrossRef]
  14. Krugerova, M.; Petrova, M.; Kozieł, M.; Stverkova, H. Territorial Risk Management in Relation to Country Risk Classification and Export: Results for the Czech Republic. Pol. J. Manag. Stud. 2021, 23, 369–385. [Google Scholar] [CrossRef]
  15. Sujova, A.; Marcinekova, K.; Hittmar, S. Sustainable Optimization of Manufacturing Process Effectiveness in Furniture Production. Sustainability 2017, 9, 923. [Google Scholar] [CrossRef]
  16. Bucko, M.; Schindlerova, V.; Krupova, H. Application of Lean Manufacturing Methods in the Production of Ultrasonic Sensor. Teh. Vjesn. Tech. Gaz. 2022, 29, 1671–1677. [Google Scholar] [CrossRef]
  17. Domingo, R.; Alvarez, R.; Pena, M.M.; Calvo, R. Materials Flow Improvement in a Lean Assembly Line: A Case Study. Assem. Autom. 2007, 27, 141–147. [Google Scholar] [CrossRef]
  18. Yun, Y.; Chae, J. Simulation Analysis for in-Line Sorting-and-Washing of Reusable Pallets: A Case Study. Teh. Vjesn. Tech. Gaz. 2022, 29, 337–345. [Google Scholar] [CrossRef]
  19. Schmidt, M. The Sankey Diagram in Energy and Material Flow Management. J. Ind. Ecol. 2008, 12, 82–94. [Google Scholar] [CrossRef]
  20. Hernandez, A.G.; Lupton, R.C.; Williams, C.H.; Cullen, J.M. Control data, Sankey diagrams, and exergy: Assessing the resource efficiency of industrial plants. Appl. Energy 2018, 218, 232–245. [Google Scholar] [CrossRef]
  21. Lorencik, J. Layout Design of the Production Line for the Production of Frozen Foods. Bachelor Thesis, VSB–Technical University of Ostrava, Faculty of Mechanical Engineering, Department of Mechanical Technology, Ostrava, Czech Republic, 2022. [Google Scholar]
  22. Bertolinia, M.; Bottania, E.; Rizzia, A.; Volpiaand, A.; Renzib, P. Shrinkage reduction in perishable food supply chain by means of an RFID-based FIFO management policy. Int. J. RF Technol. Res. Appl. 2013, 5, 123–136. [Google Scholar] [CrossRef]
  23. CSN 26 9010; Materials Handling. Wides and Heights of Roads and Aisles. Czech Normalization Institute: Prague, Czech Republic, 1993.
  24. CSN 73 5105; Industrial Buildings for Production Purposes. Czech Normalization Institute: Prague, Czech Republic, 1993.
  25. Krugerova, M.; Petrova, M.; Kozieł, M. Influence of Incoterms 2020 on Strategic Decision-making of Entrepreneurs. In Proceedings of the 14th International Conference Strategic Management and Its Support by Information Systems 2021, Ostrava, Czech Republic, 25–26 May 2021. [Google Scholar]
Figure 1. Representation of the share of production on the original production line in kg/year.
Machines 12 00189 g001
Figure 2. Koppens forming machine and freezing tunnel [21]. (a) Koppens forming machine; (b) freezing tunnel.
Machines 12 00189 g002
Figure 3. Entrance to the frying tunnel and wet and dry coater [21]. (a) Entrance to the frying tunnel; (b) wet and dry coater.
Machines 12 00189 g003
Figure 4. Production flow on the original production line [21].
Machines 12 00189 g004
Figure 5. Location of hygiene loops and pallet handover points [21].
Machines 12 00189 g005
Figure 6. Space for the new production line [21].
Machines 12 00189 g006
Figure 7. Production flow on the new production line [21].
Machines 12 00189 g007
Figure 8. Merell forming machine and Econopack packer [21]. (a) Merell forming machine; (b) Econopack packer.
Machines 12 00189 g008
Figure 9. Sequence of making potato croquettes and liver dumplings [21].
Machines 12 00189 g009
Figure 10. Division into clean and dirty zones [21].
Machines 12 00189 g010
Figure 11. Material flows—Option 1 [21].
Machines 12 00189 g011
Figure 12. Movement of lift trucks and persons—Option 1 [21].
Machines 12 00189 g012
Figure 13. Construction changes and completion of PUR panel walls—Option 1 [21].
Machines 12 00189 g013
Figure 14. Material flows—Option 2 [21].
Machines 12 00189 g014
Figure 15. Movement of lift trucks and persons—Option 2 [21].
Machines 12 00189 g015
Figure 16. Construction changes (completion)—Option 2 [21].
Machines 12 00189 g016
Figure 17. Space saving—Option 2 [21].
Machines 12 00189 g017
Figure 18. Material flows with marking of handover points—Option 1 [21].
Machines 12 00189 g018
Table 1. Quantity produced on the original production line for the accounting year 2021 [21].
ProductProduction Volume for the Accounting Year (kg/Year)
Breaded cheese2,668,566
Breaded vegetables477,833
Breaded pork schnitzel377,287
Breaded chicken schnitzel48,135
Total3,571,818
Table 2. Outputs and usability of the main machines [21].
MachineOutput (pcs/h)Usability (%)
Forming machine4140100
Frying tunnel15,00027.6
Freezing tunnel600069
Table 3. Numbers of the original production facilities [21].
Machine NumberName of the MachineMachine NumberName of the Machine
1Cutting machine7Frying tunnel
2Mixer8Freezing tunnel
3Forming machine9Weighing table
4Wet coater (2×)10Gluer
5Mixer11Detector
6Dry coater (2×)12Packing table
Table 4. Machine numbers on the new production line [21].
Machine NumberName of the MachineMachine NumberName of the Machine
1Seydellman cutter7Dry coater (2×)
2Mixer UM 5008Frying tunnel
3Vacuum filling machine9Freezing tunnel
4Forming machine Merell10Packing machine
5Mixer (2×)11Econopack packer
6Wet coater (2×)
Table 5. Material flows for Option 1 [21].
IngredientNumber (kg) on PalletDistance (m)Product Share (%)
Eidam cheese 30%5009051.84
Egg melange250802.06
Instant flour750951.10
Cheese mixture119.9755
Battermix750886.61
Ice250622.52
Brata breadcrumbs7508810.3
Semily breadcrumbs450888.2
IngredientNumber (L) on the palletDistance (m)Product share (%)
Water-Water pipeline12.63
Frying oil200554.8
PackagingNumber of pieces on the palletDistance (m)Share per 1 kg of product
Carrier boxes28811/15
Boxes12,800815
Cartons960801/2
Packaged products3360381/2
ProductNumber of pieces on the palletDistance (m)Share per 1 kg of product
Product in a carrier box420821/15
Table 6. Total distance of material flows for Option 1 [21].
IngredientConsumption of Semifinished Products (kg)Number of Transported Pallets/Trolleys (Pcs)Total Distance Travelled (m)
Eidam cheese 30%120,13924121,690
Egg melange4774201600
Instant flour25494380
Cheese mixture127,46310647448
Battermix15,319211848
Ice5840241488
Brata breadcrumbs23,870322816
Semily breadcrumbs19,004433784
IngredientConsumption of Semifinished Products (L)Number of Transported Pallets/Trolleys (pcs)Total Distance Travelled (m)
Water29,270--
Frying oil11,924603300
PackagingPackaging Consumption (pcs)Number of Transported Pallets (pcs)Total Distance Travelled (m)
Carrier boxes15,45055244,712
Boxes1,158,750917371
Cartons115,8751219680
Product in a carrier box15,45055245,264
Packaged product115,8751214598
Total:--155,979
Table 7. Material flows for Option 2 [21].
IngredientNumber (kg) on PalletDistance (m)Product Share (%)
Eidam cheese 30%5007251.84
Egg melange250702.06
Instant flour750671.10
Cheese mixture119.9455
Battermix750606.61
Ice250312.52
Brata breadcrumbs7505710.3
Semily breadcrumbs450618.2
IngredientNumber (L) on the PalletDistance (m)Product Share (%)
Water-water pipeline12.63
Frying oil200524.8
PackagingNumber of Pieces on the PalletDistance (m)Share per 1 kg of Product
Carrier boxes281051/15
Boxes12,8001045
Cartons9601021/2
Packaged products3360671/2
ProductNumber of Pieces on the PalletDistance (m)Share per 1 kg of Product
Product in a carrier box4201551/15
Table 8. Total distance of material flows for Option 2 [21].
IngredientConsumption of Semifinished Products (kg)Number of Transported Pallets/Trolleys (Pcs)Total Distance Travelled (m)
Eidam cheese 30%120,13924117,352
Egg melange4774201400
Instant flour25494268
Cheese mixture127,46310644256
Battermix15,319211260
Ice584024744
Brata Breadcrumbs23,870321824
Semily Breadcrumbs19,004432623
IngredientConsumption of Semifinished Products (L)Number of Transported Pallets/Trolleys (pcs)Total Distance Travelled (m)
Water29,270--
Frying oil11,924603120
PackagingPackaging Consumption (pcs)Number of Transported Pallets (pcs)Total Distance Travelled (m)
Carrier boxes15,45055257,960
Boxes1,158,750919464
Cartons115,87512112,342
Product in a carrier box15,45055285,560
Packaged product115,8751218107
Total:--206,289
Table 9. Comparison of Option 1 and Option 2 according to defined indicators.
Comparison IndicatorsOption 1Option 2
Annual distance of material flows (km/year)8,110,90810,727,028
Estimated cost of construction changes (EUR)926.76794.9
Saved area to be used for another technology (m2)076
Table 10. Comparison of original and new production line in terms of production performance.
Comparison IndicatorsOption 1Option 2
Production performance (pcs)15,0004140
Disclaimer/Publisher’s Note: The statements, opinions and data contained in all publications are solely those of the individual author(s) and contributor(s) and not of MDPI and/or the editor(s). MDPI and/or the editor(s) disclaim responsibility for any injury to people or property resulting from any ideas, methods, instructions or products referred to in the content.

