3.1. Finite Element Analysis Results
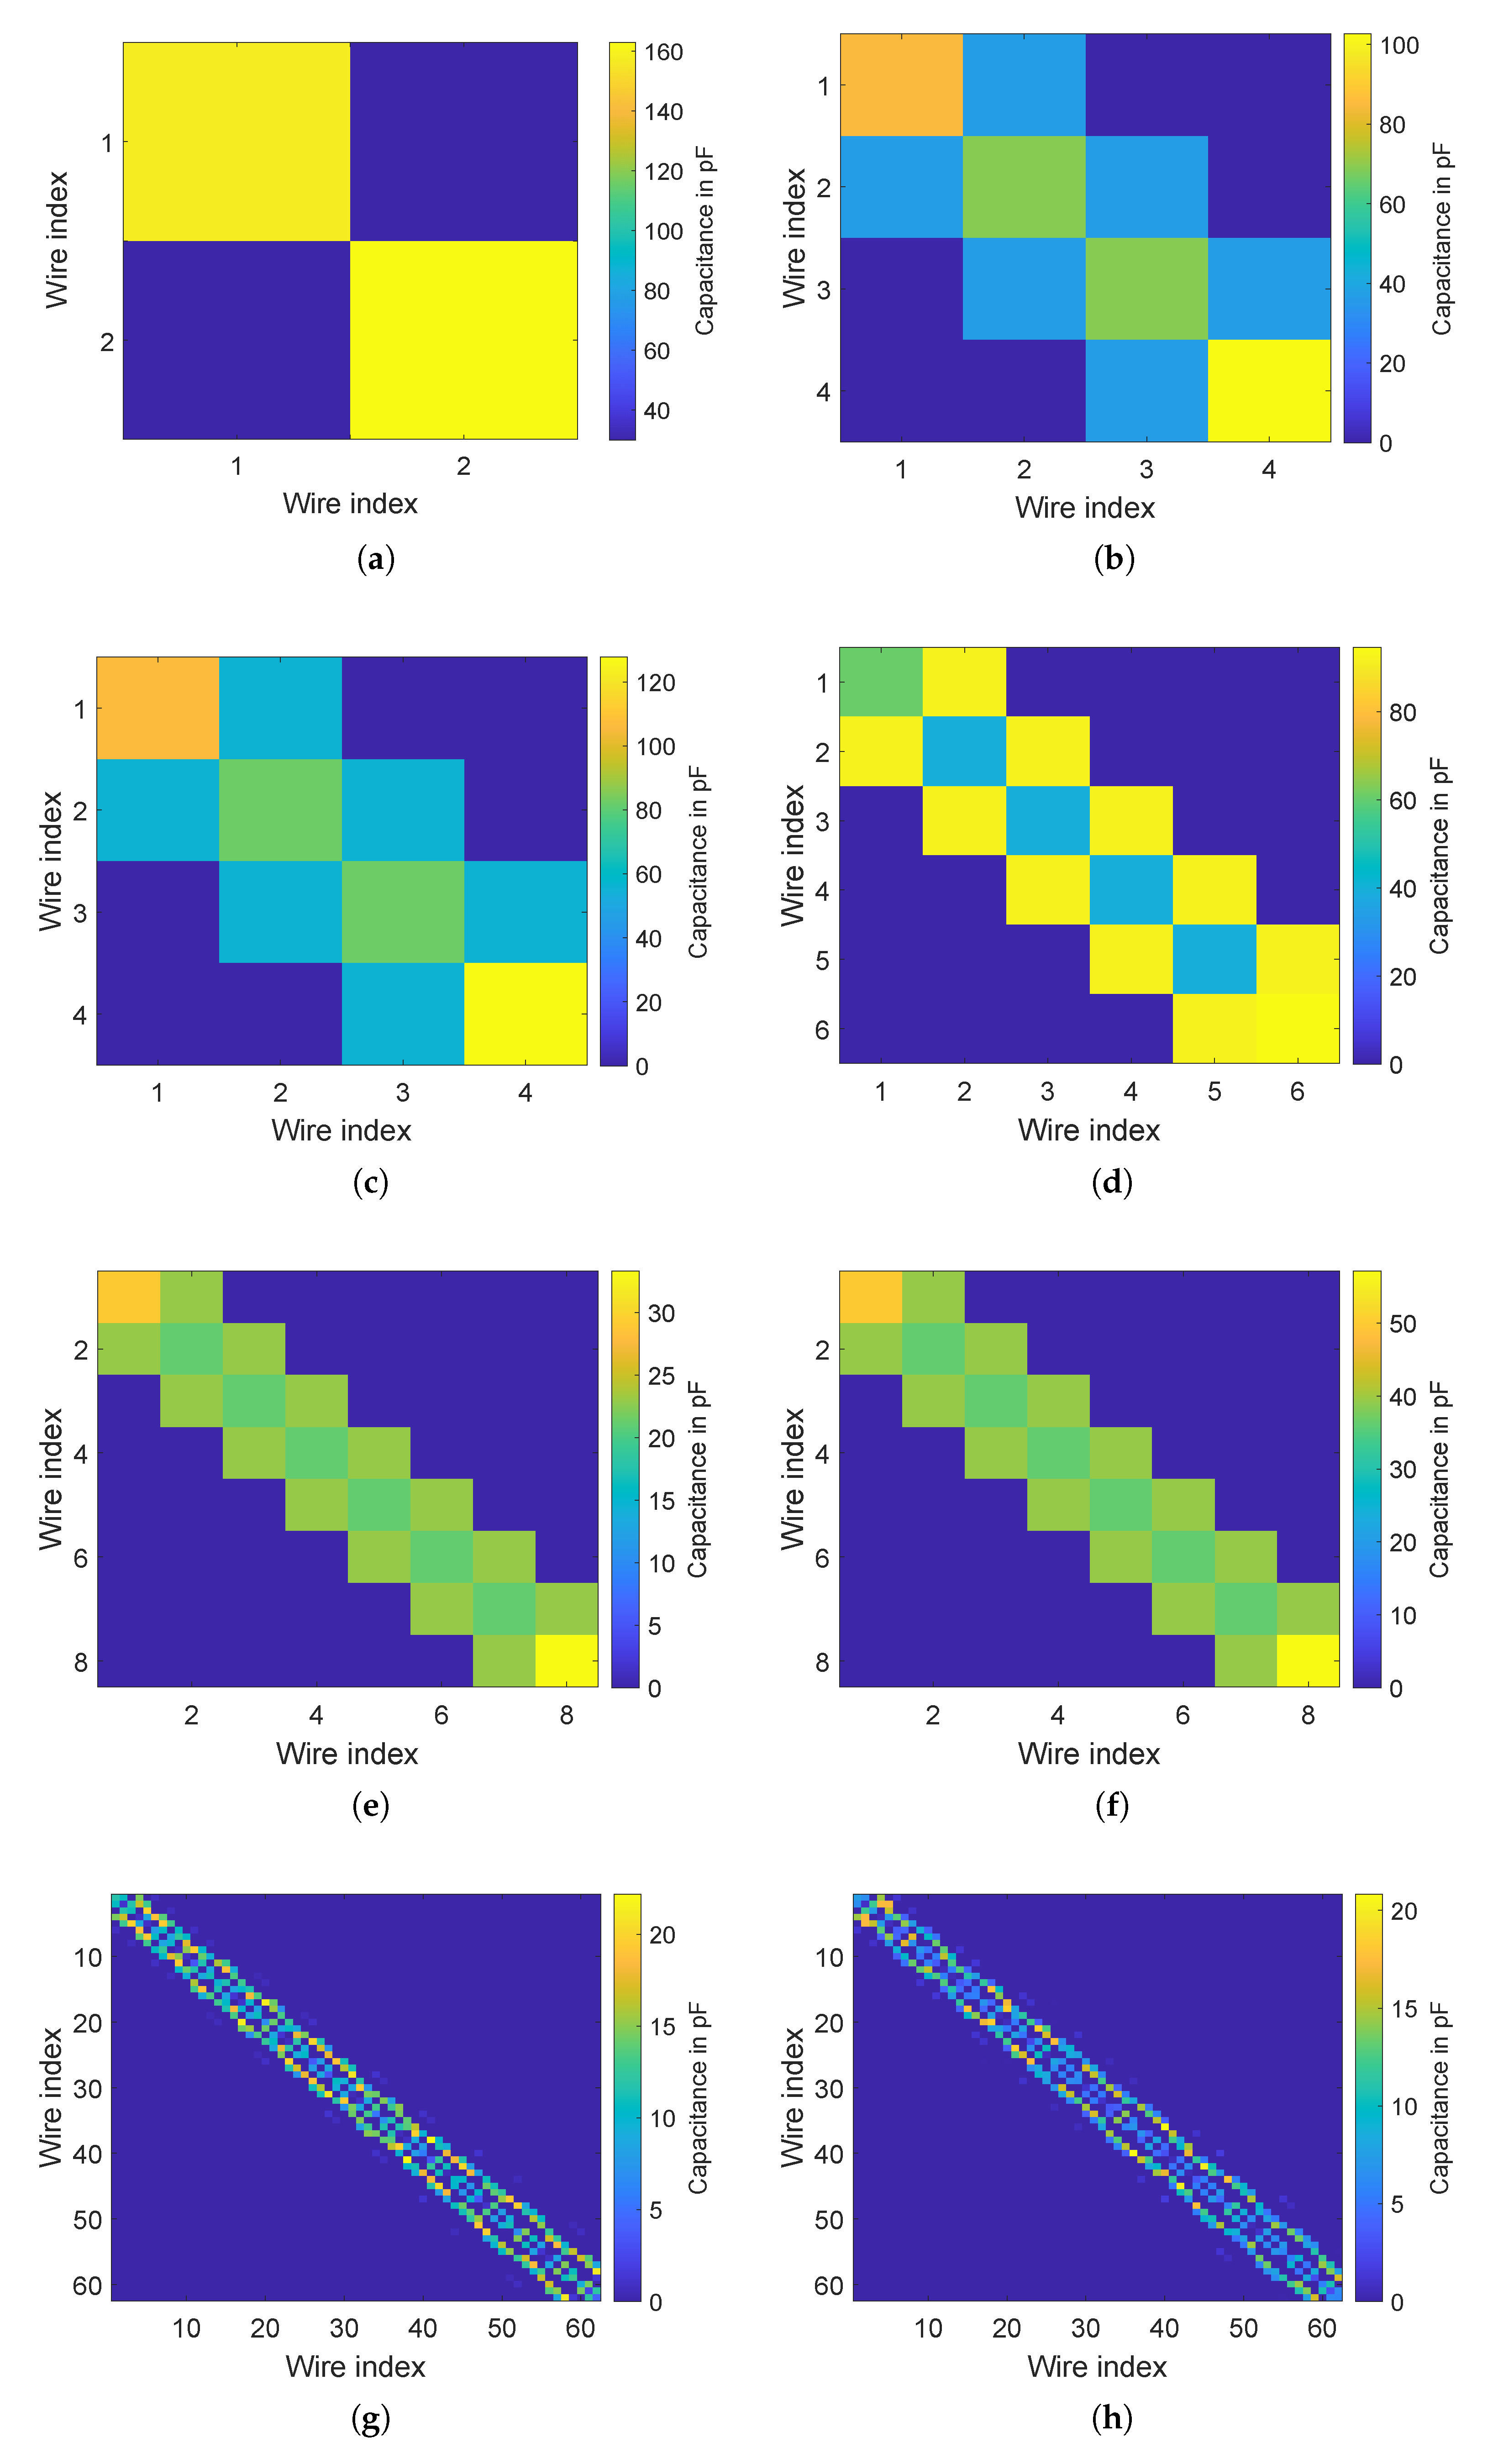
Figure 6 illustrates the lumped spice capacitance matrices of all analyzed designs, simulated in AEDT Q2D extractor by assigning a signal line property to each wire and the reference ground property to the stator core. They are
matrices each, with
N being the number of wires per slot. The wire index begins with the wires closest to the slot opening (bottom layer) and ends with those closest to the slot top (top layer). The values of capacitive couplings are displayed by the colorbar in
, with brighter colors indicating larger capacitance. The diagonal matrix entries represent the capacitance of each respective wire to the stator core, whereas the off-diagonal entries represent the capacitances between wires [
16]. Hereafter, these individual capacitances will be referred to as
and
, respectively.
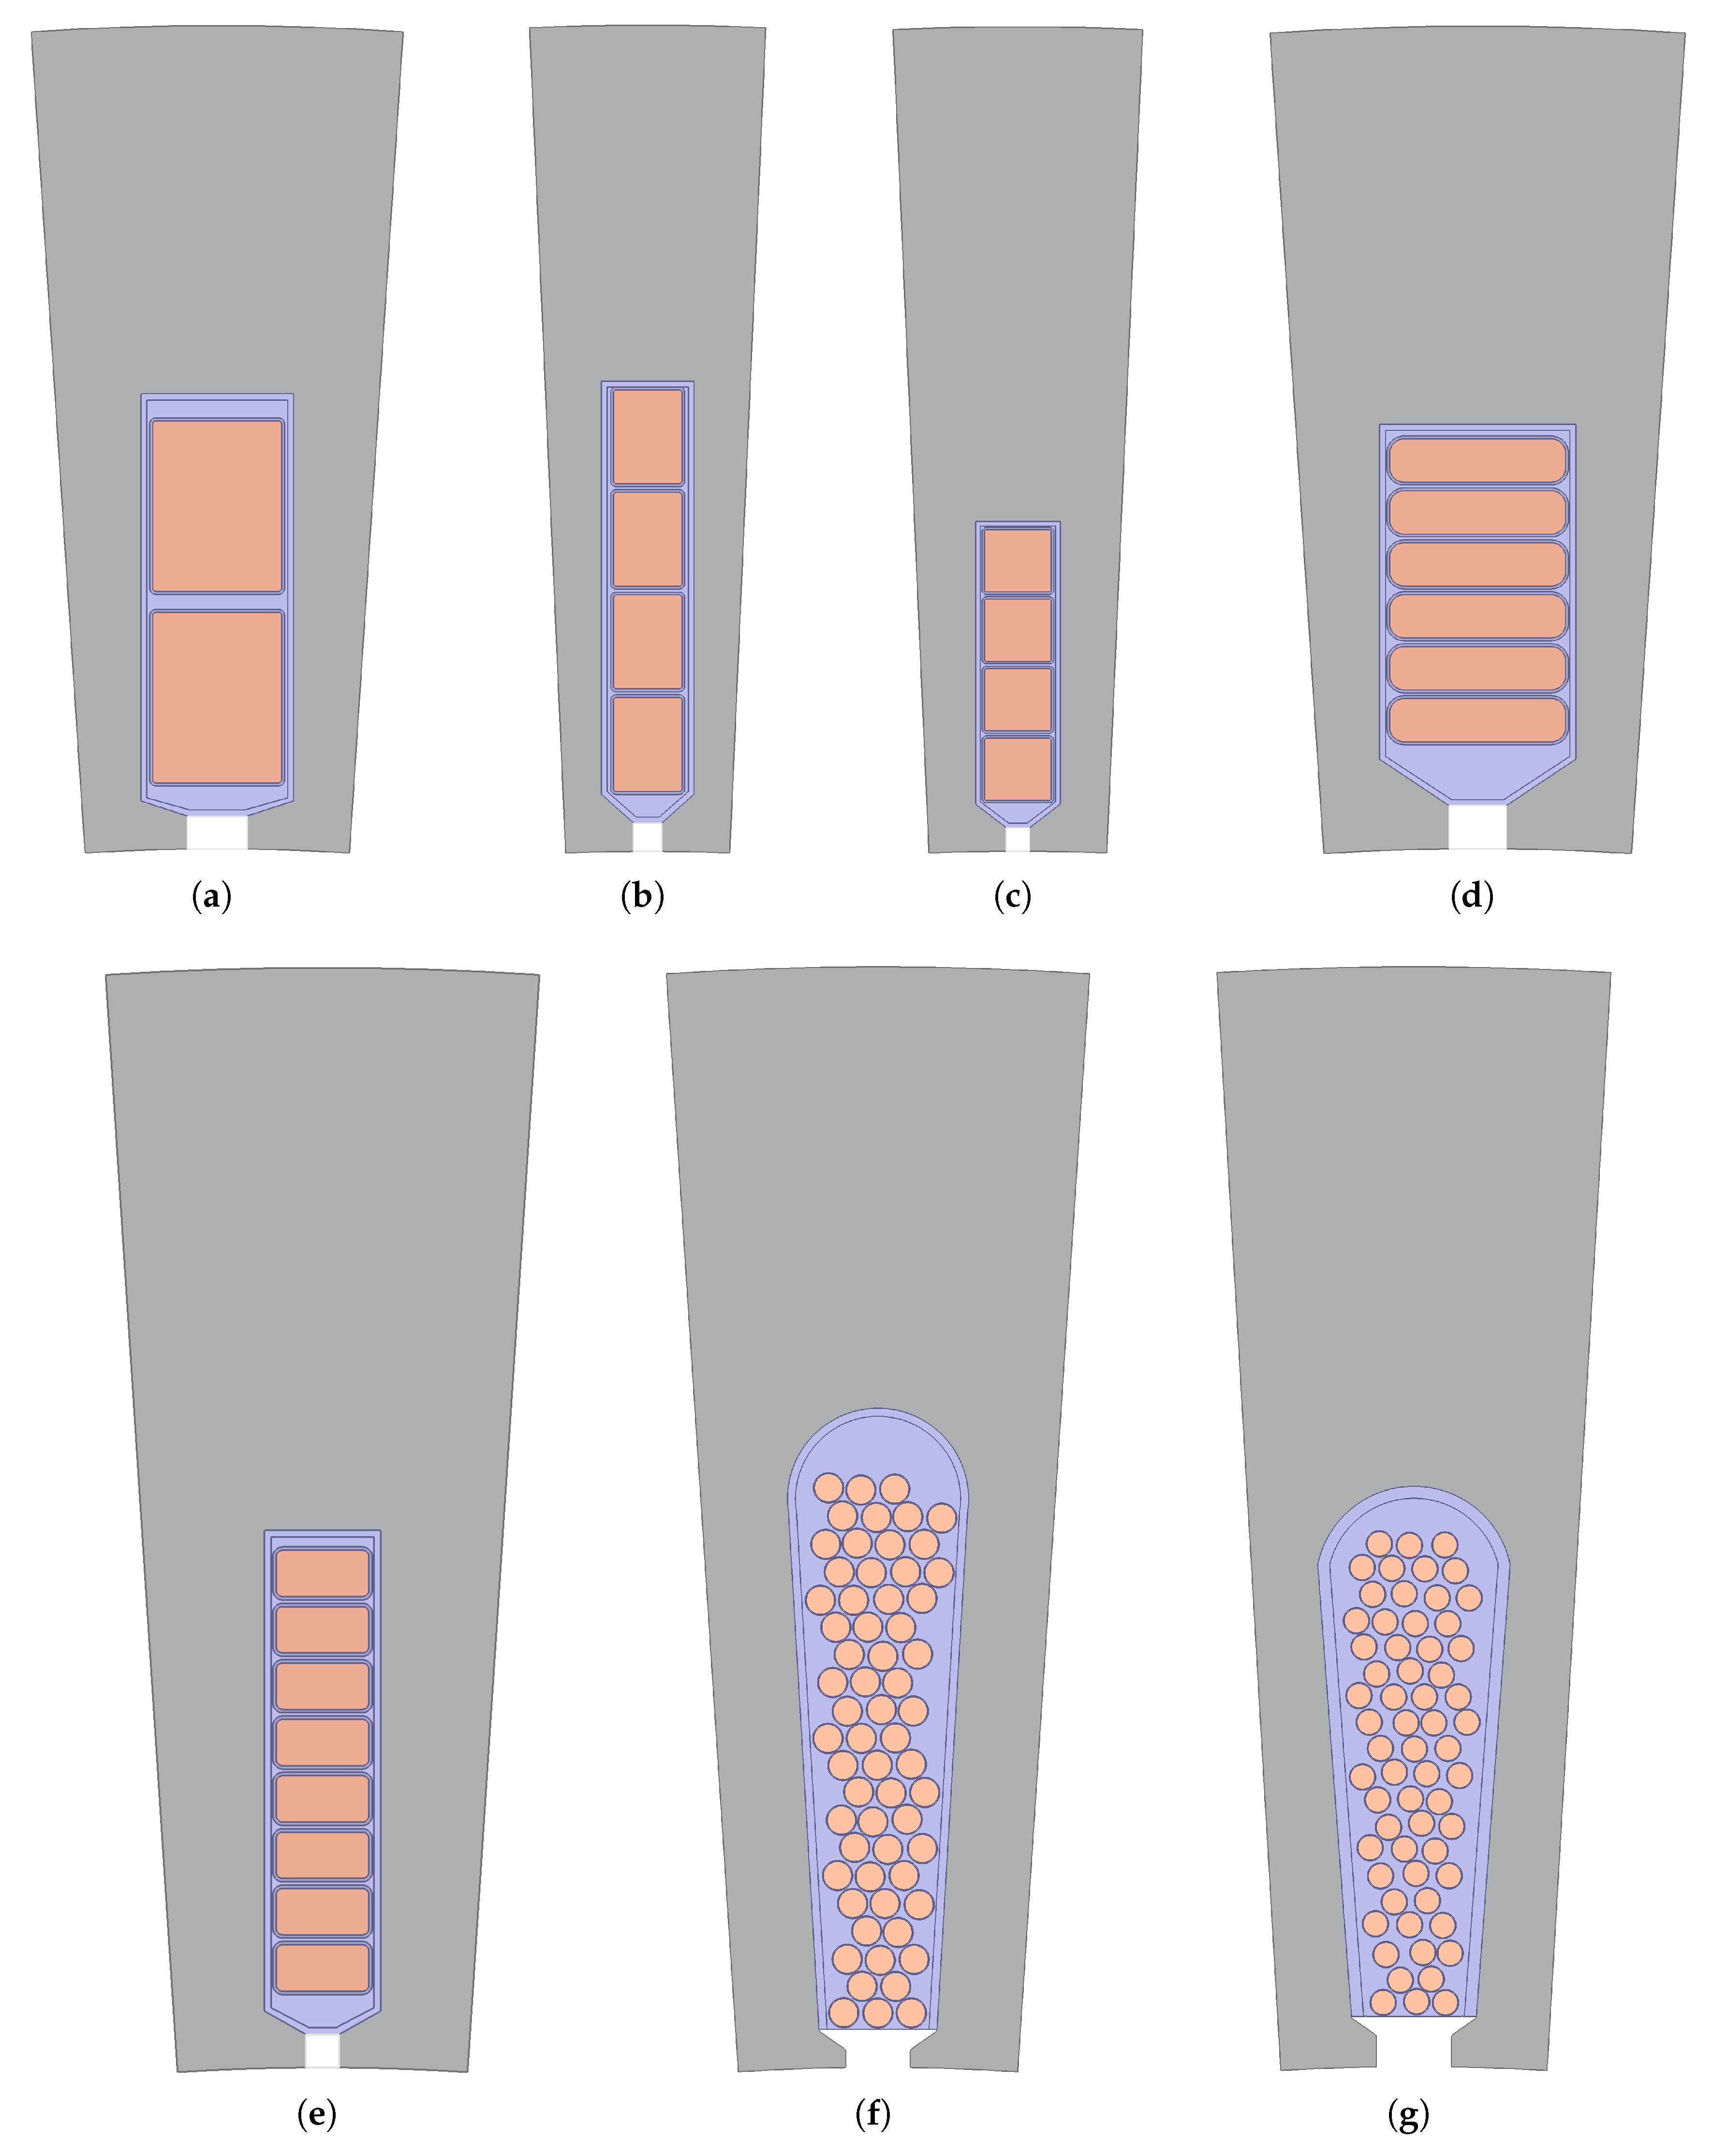
For the hairpin winding designs, the general trend is that the top layer has the largest
due to the large overlap area with the stator core not only at the slot sides but at the top as well. The second largest
is between the bottom layer and the stator core. The inter–wire coupling
is only significant for the hairpins adjacent to each other. The designs where the conductor width is much larger than the conductor height, i.e., H6 and H8, display larger
than
with the exception of the top and bottom layers (see
Figure 6d–f). This is because wide and short hairpins have more overlap area with adjacent wires than they have with the stator core. This is particularly pronounced for the H6 design, with the conductor width being more than four times larger than the height, thus resulting in inter–wire couplings that even exceed the
between the bottom layer and the stator core. With an increasing number of layers, the
of each layer decreases due to the decreasing conductor height. This is particularly evident when comparing
Figure 6a, displaying values close to 160
, with
Figure 6e, where the largest capacitance barely exceeds 30
.
The same holds true for the designs with stranded windings (
Figure 6g,h). Here, mainly the wires closest to the slot boundaries or the stator core contribute to the winding–to–stator capacitance, whereas those in between the outermost wires do not. Since there are more wires adjacent to each other than in the case of hairpin windings, the significant inter–wire coupling capacitances
are higher in number. Between the two stranded wire designs, S1 has slightly larger
than S2 because of the shorter distance between the wires and the stator core.
Table 5 further lists the total winding–to–stator capacitance
in
for all analyzed designs, equal to the sum of the individual
for one stator slot multiplied by the number of slots. Also given in the table is the difference between the numerical calculation and an analytical procedure given in references [
2,
17] for the hairpin winding and stranded winding designs, respectively. Among the hairpin winding designs, H8 F has the smallest
by far, and the difference to H8 R originates from the difference in lamination stack length, which scales the capacitance linearly. H2 and H6 have similar capacitance due to the identical stack length, same slot number and similar slot fill factor. However, referring to
Figure 2a, the
of design H2 is likely to increase if the uppermost wire were to be positioned closer to the slot top. The designs with four layers display the largest
mainly due to the higher number of slots, with 72 compared to the 48 slots of other designs. Comparing the numerical results with the analytical values obtained from the equations in [
17], it can be seen that the absolute error remains below 10% with the exception of H6, although there is no clear indication as to whether this equation tends to overestimate or underestimate the capacitance value. The identical difference for both H8 designs results from the fact that in the FEA, the wires are positioned identically within the slot.
On the other hand, with values around or below 10
, the designs with stranded wires exhibit much lower winding–to–stator capacitance
than the hairpin winding counterparts (with the exception of H8 F) because of the shorter stack length of 135
and less overlap area between the wires and the stator core due to the smaller slot fill factor. Because of the larger fill factor, S1 shows considerably higher
than S2 despite having a lower number of stator slots. It should be noted that here, the randomization described in
Section 2.2 was only applied to a single slot, and the resulting capacitance was multiplied with the number of slots. To represent a real stranded wire distribution more accurately, the randomization could be applied to every slot individually, but this would also result in a drastic increase in the computational effort. The analytical equation provided in [
2] includes form factors to consider that not all of the area around the slot is filled with wires, and the difference to the numerical calculation is similar compared to the hairpin winding cases, with maximum deviations slightly above 10%.
It can be concluded that although there are significant variations in the distribution of individual winding–to–stator and inter–wire couplings, the total is mainly determined by the stack length, slot number and slot fill factor. Among hairpin designs, the number of winding layers is less significant as long as the slot fill factor is similar. Stranded winding designs display lower capacitance values than their hairpin counterparts because of the lower fill factor, even if the stack length was to be the same. Therefore, from a parasitic capacitance standpoint, stranded winding is preferable to hairpin winding.
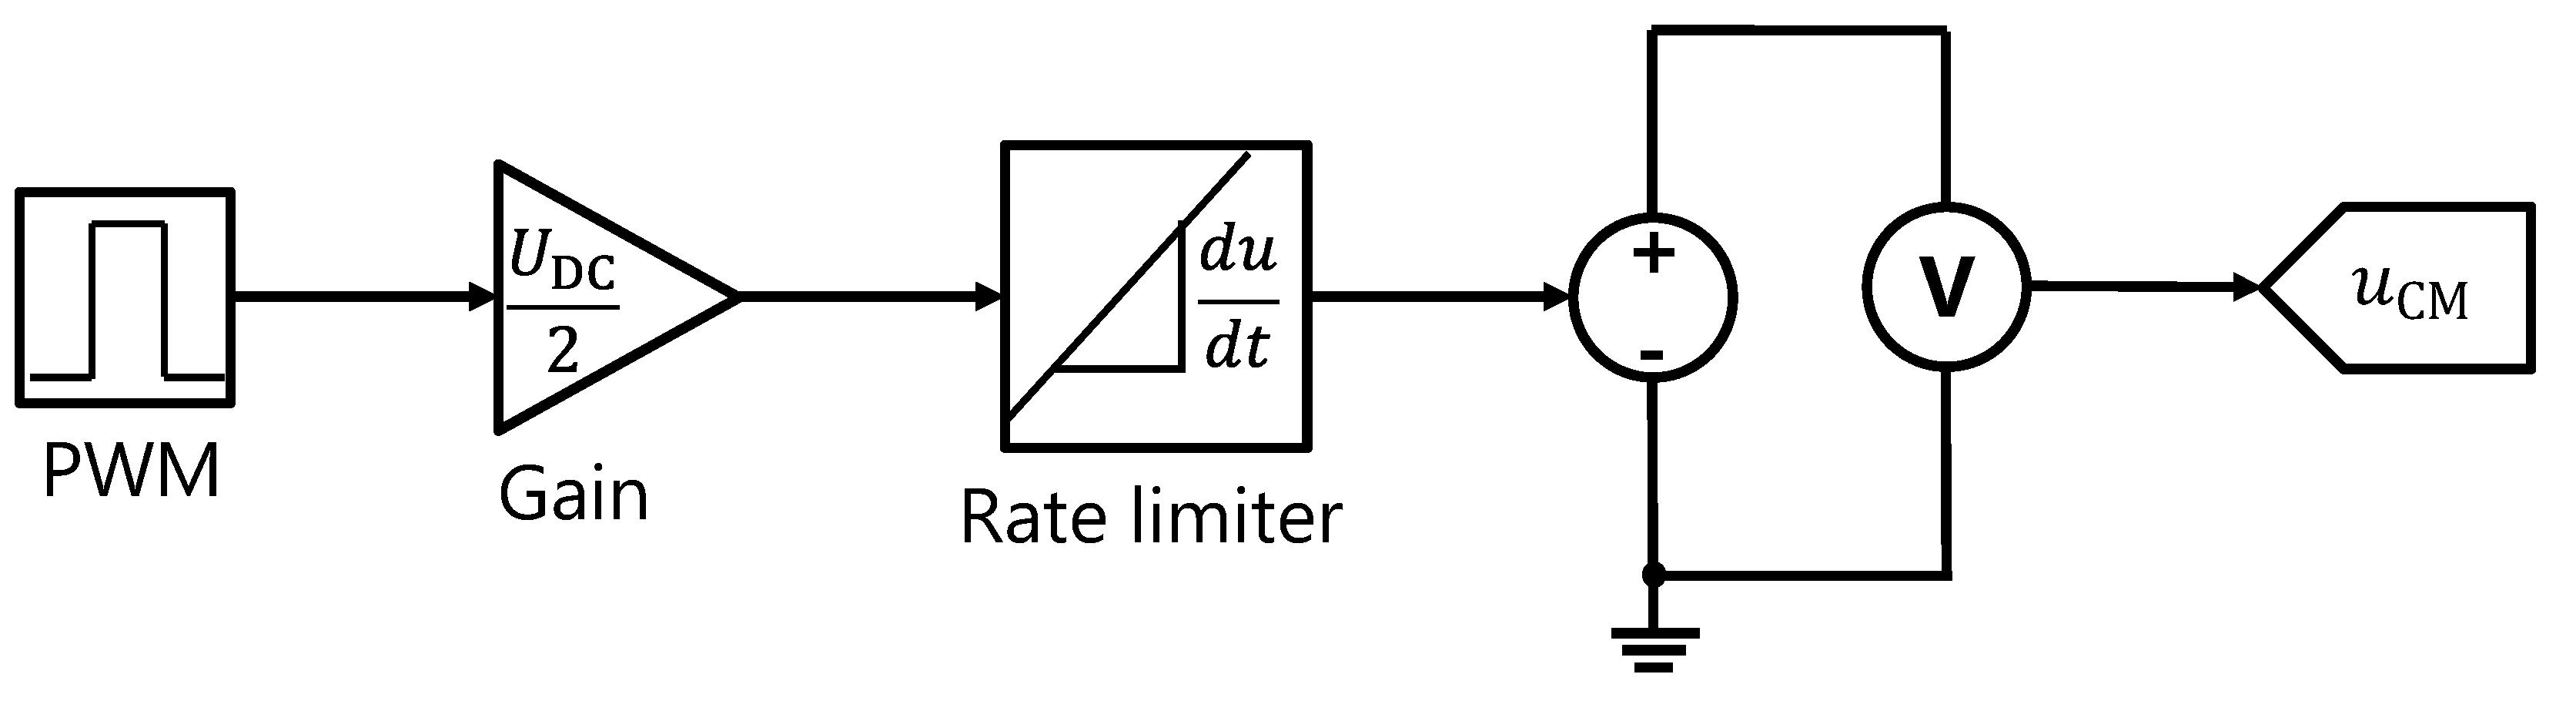
3.2. Time-Domain Simulation Results
With the numerically determined winding–to–stator capacitance
and the analytical calculation of the other model parameters from
Figure 5 described in
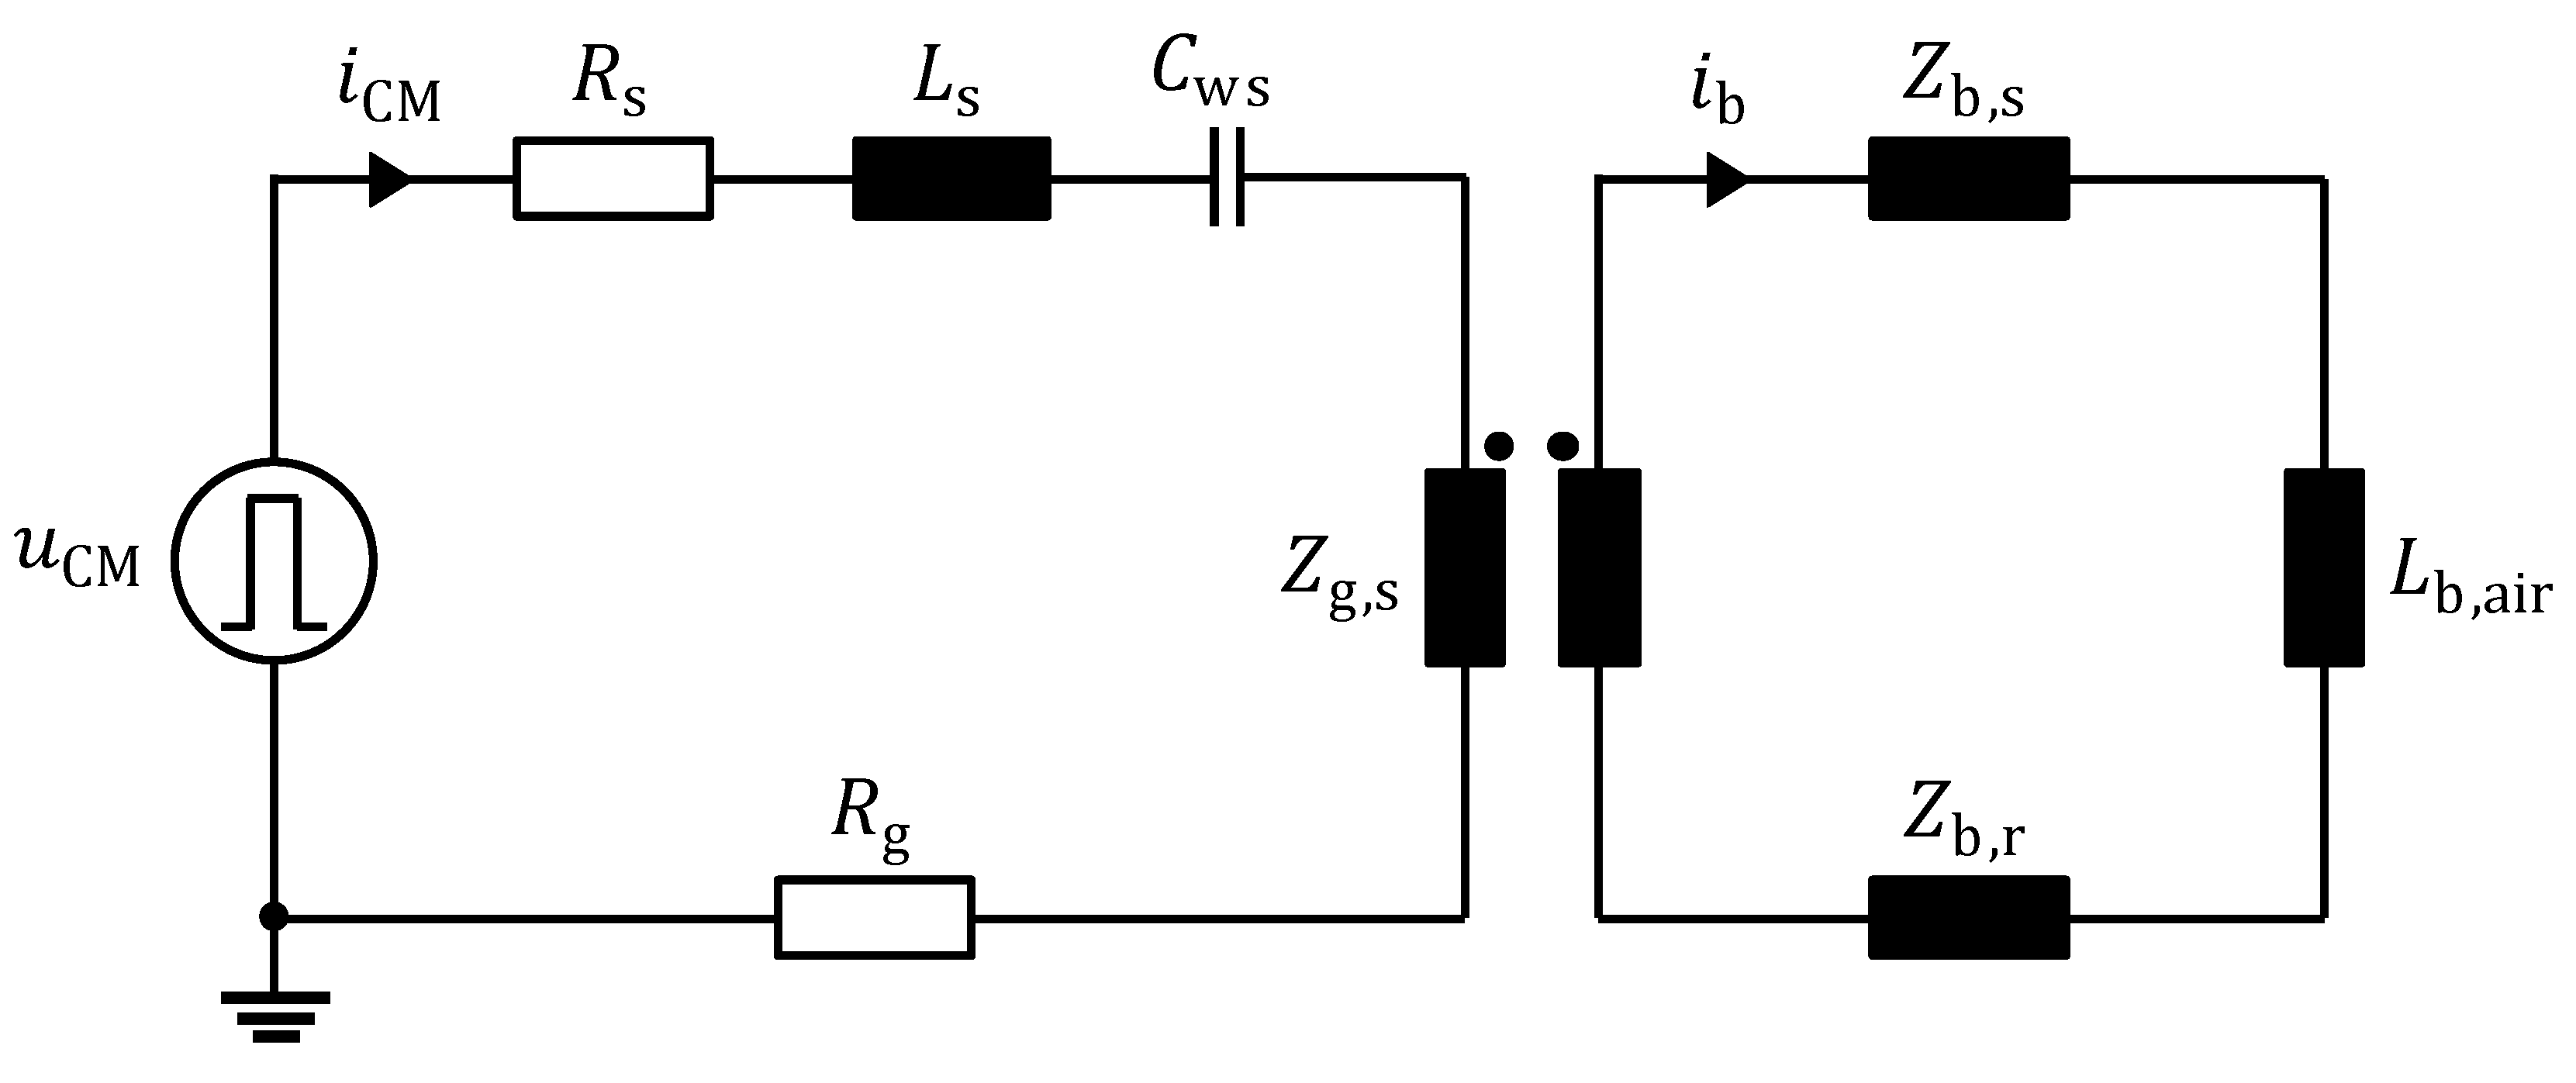
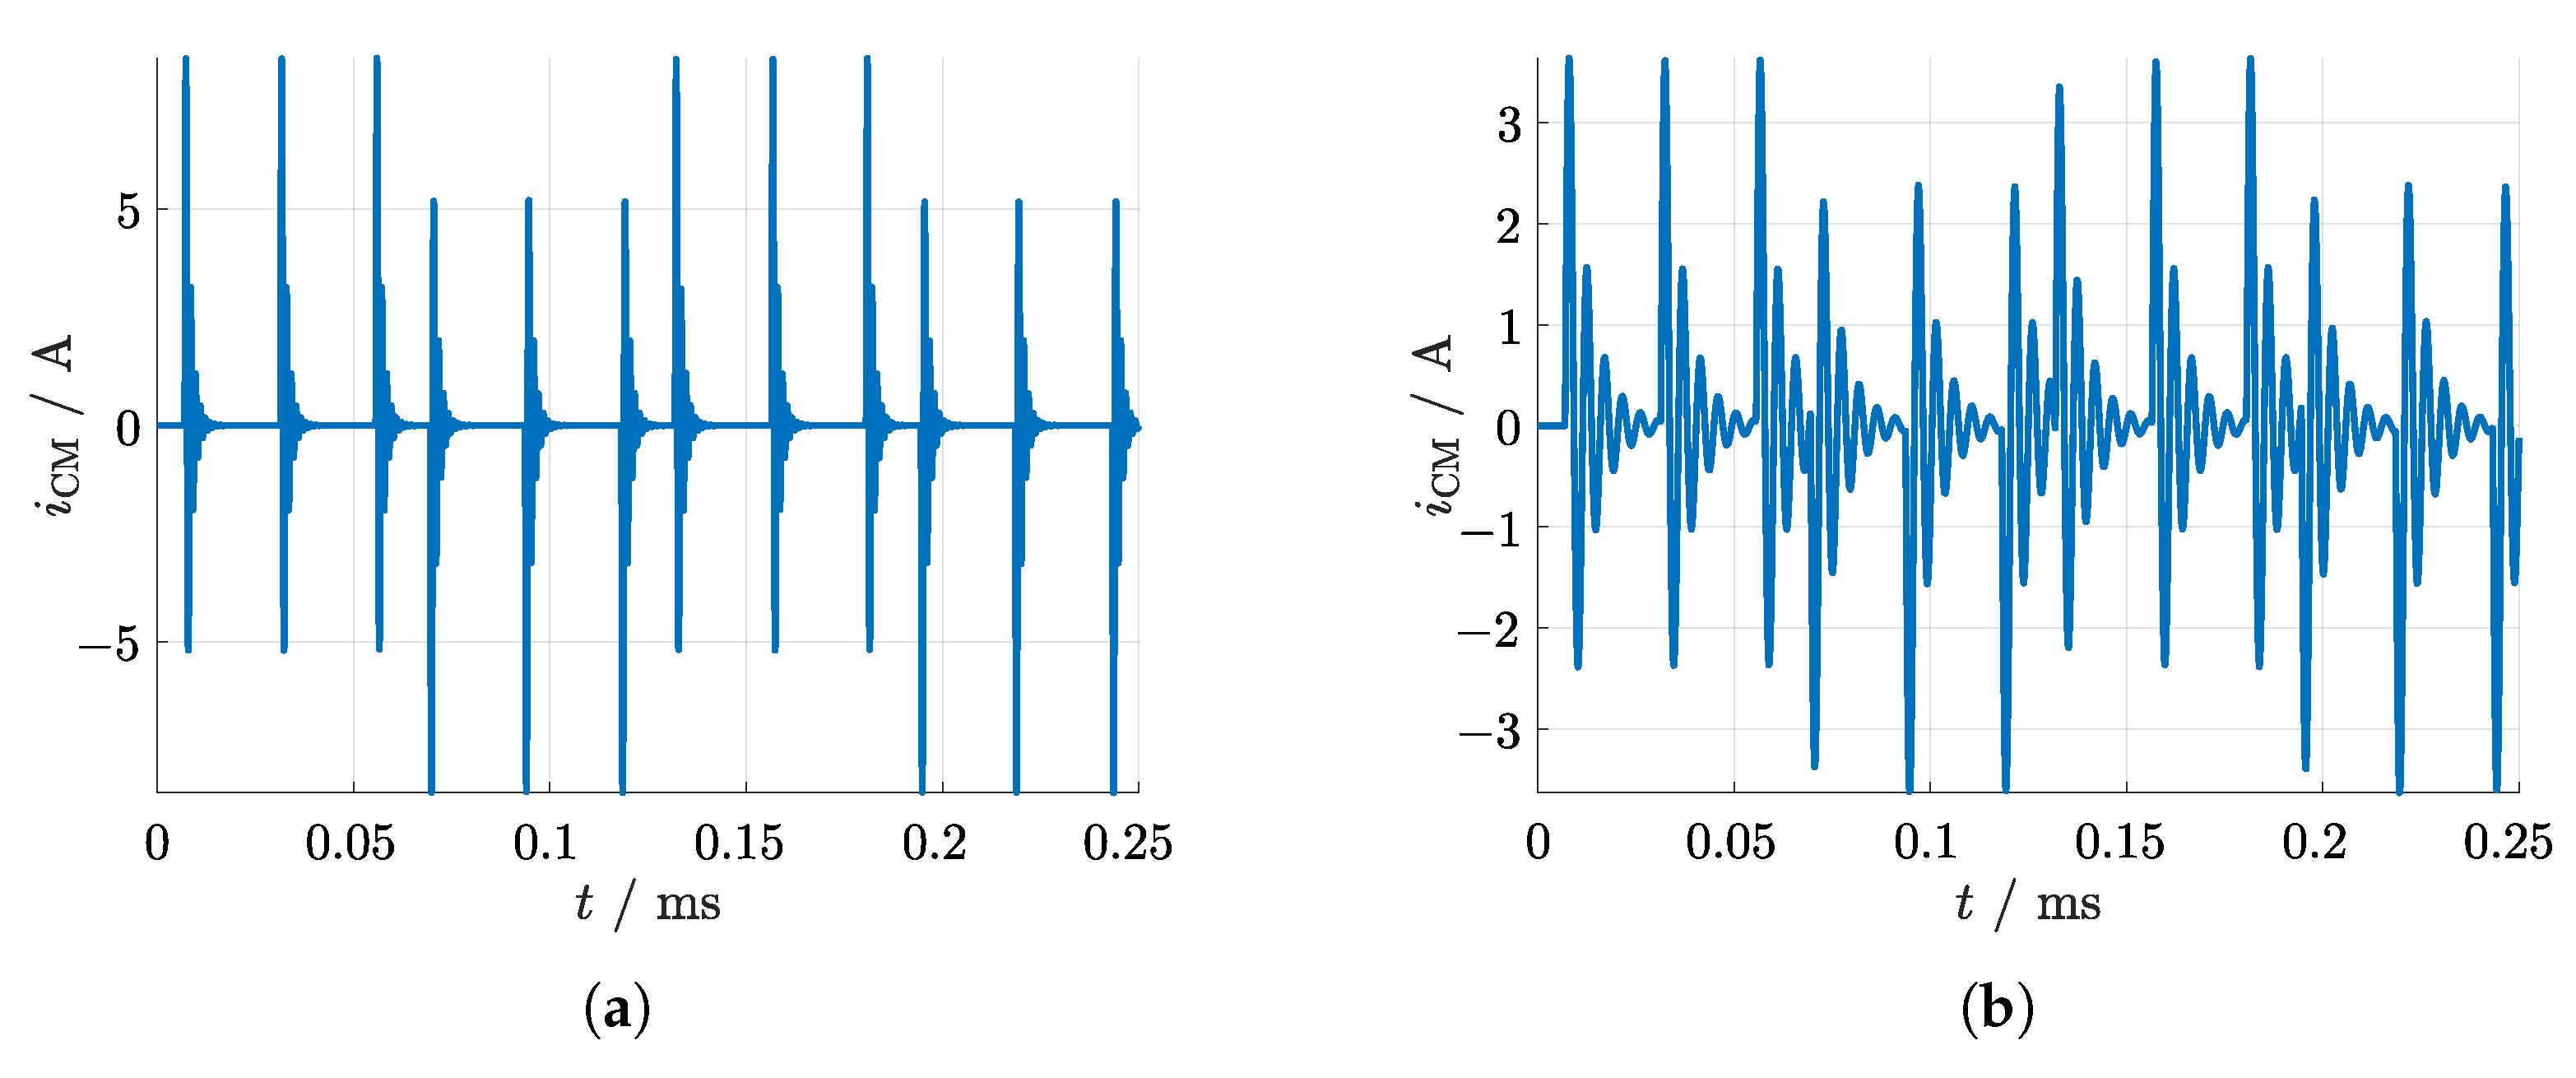
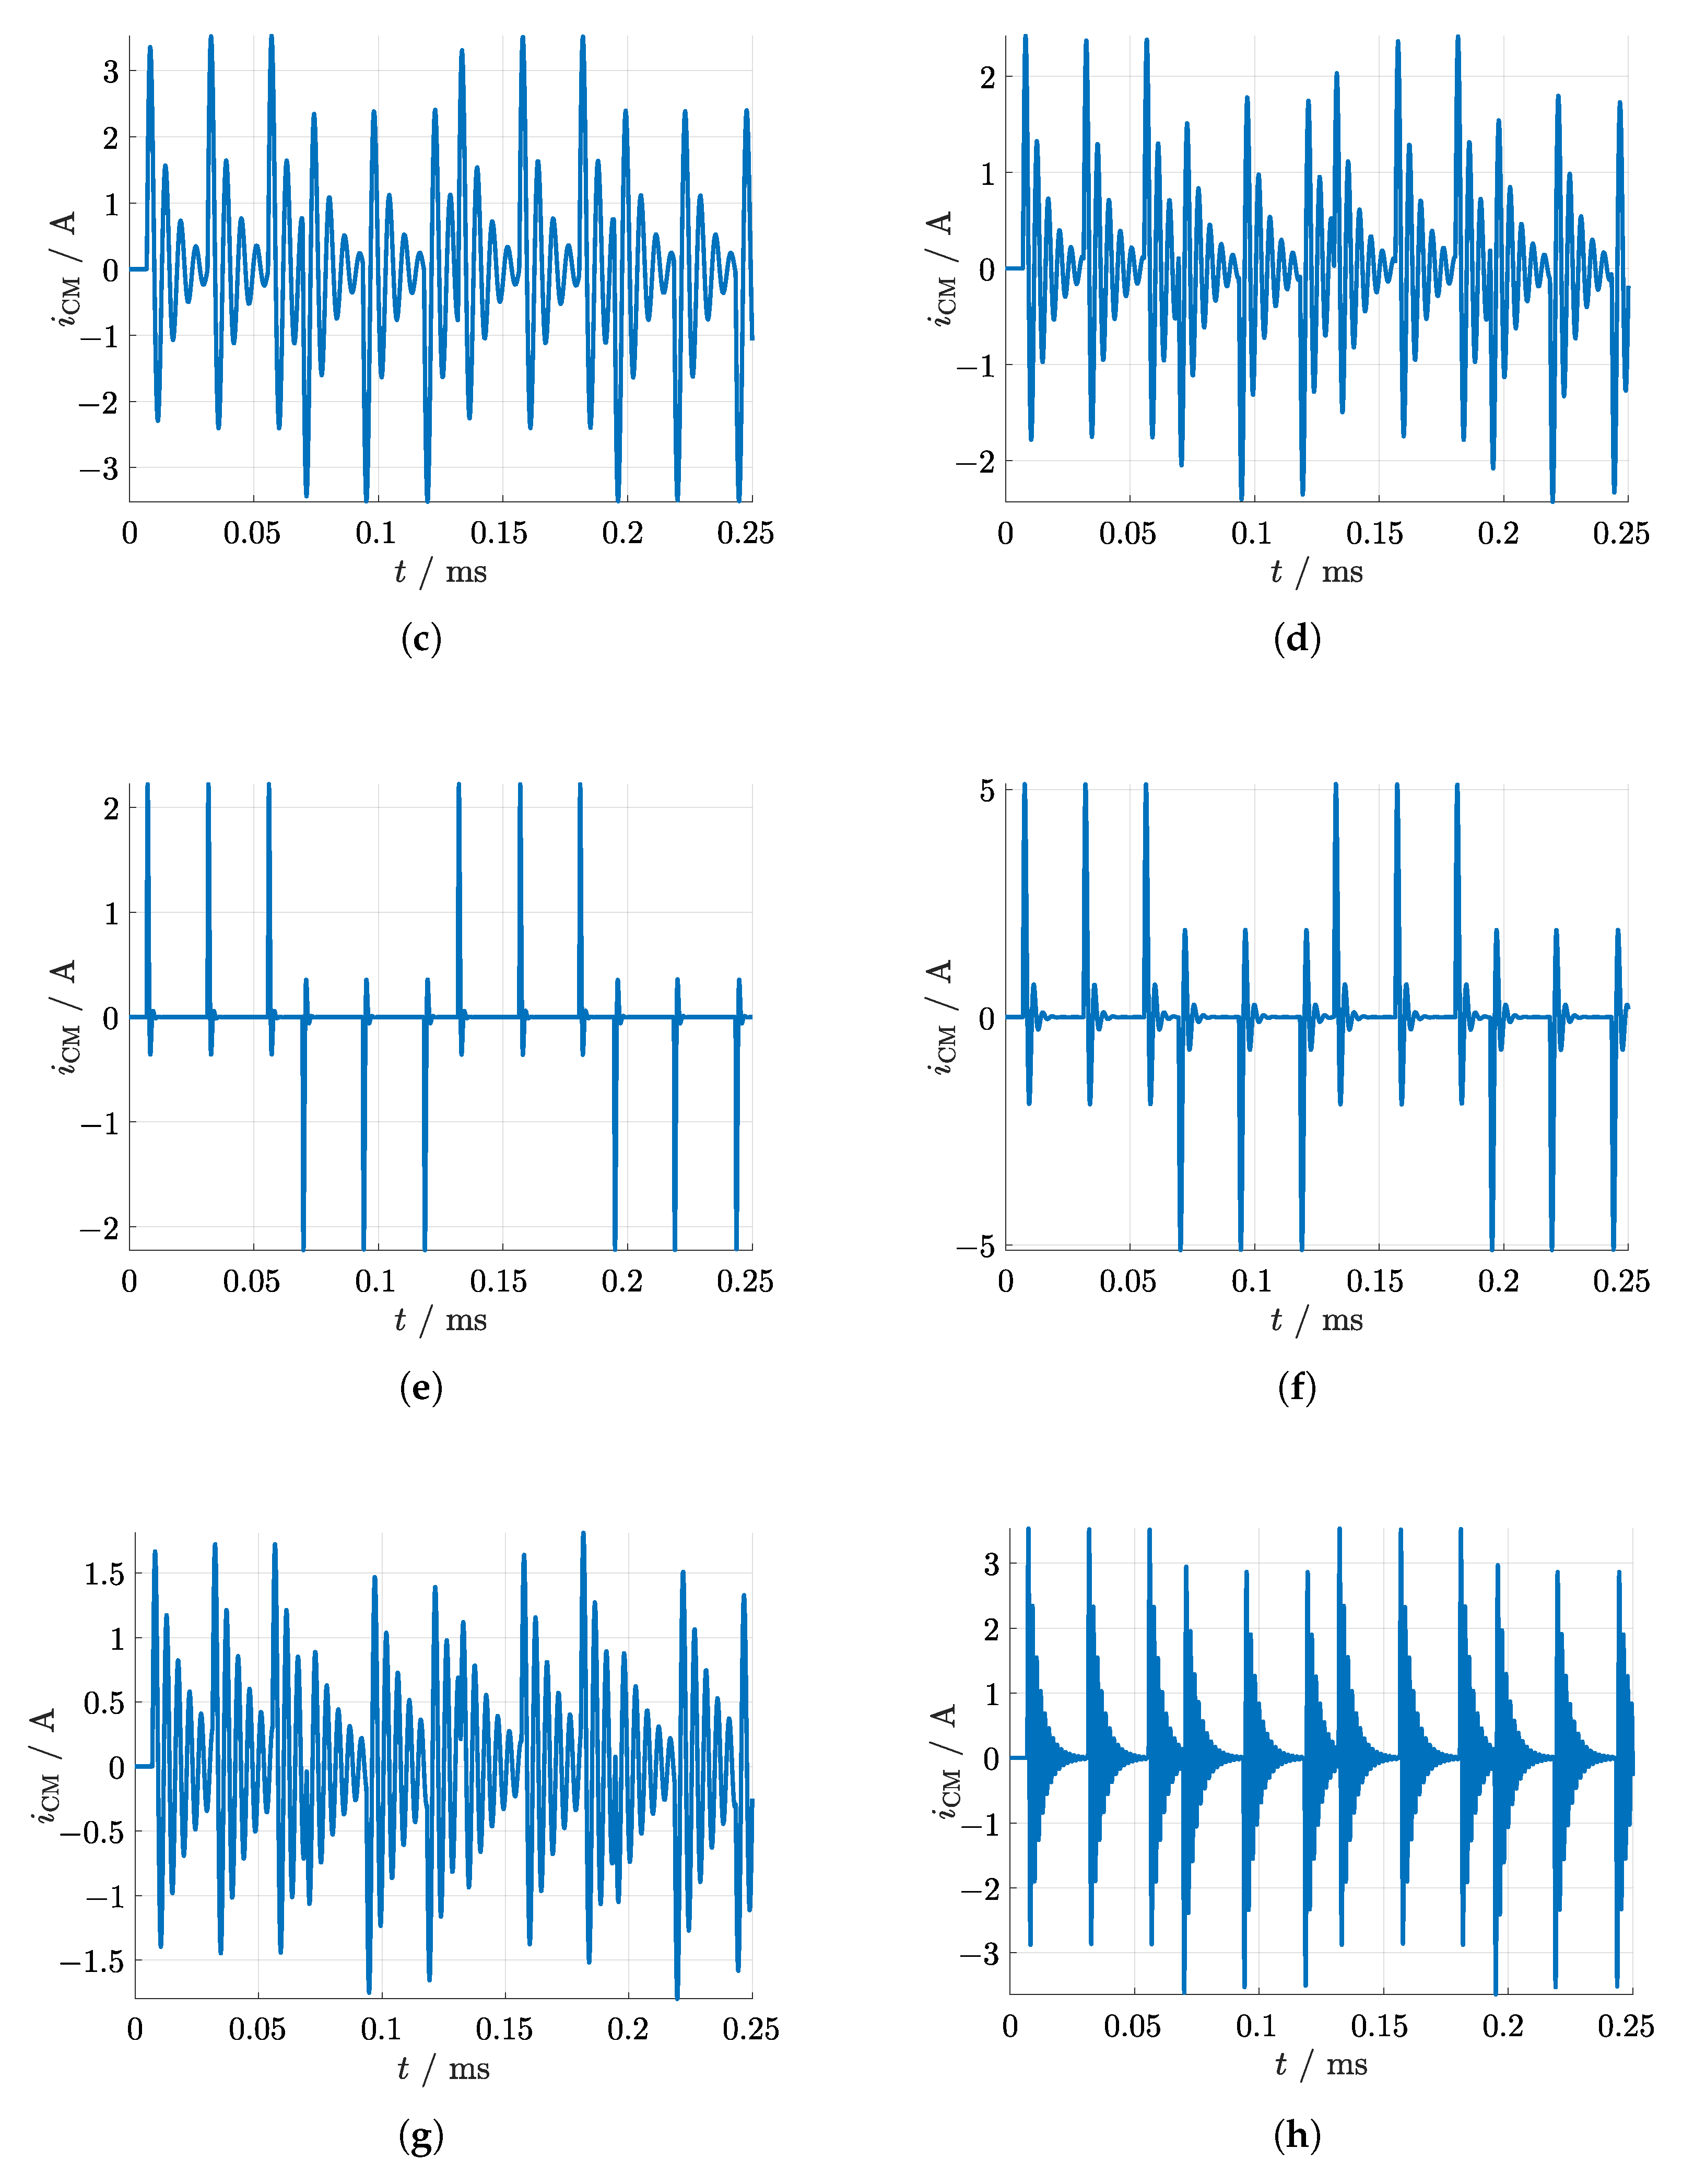
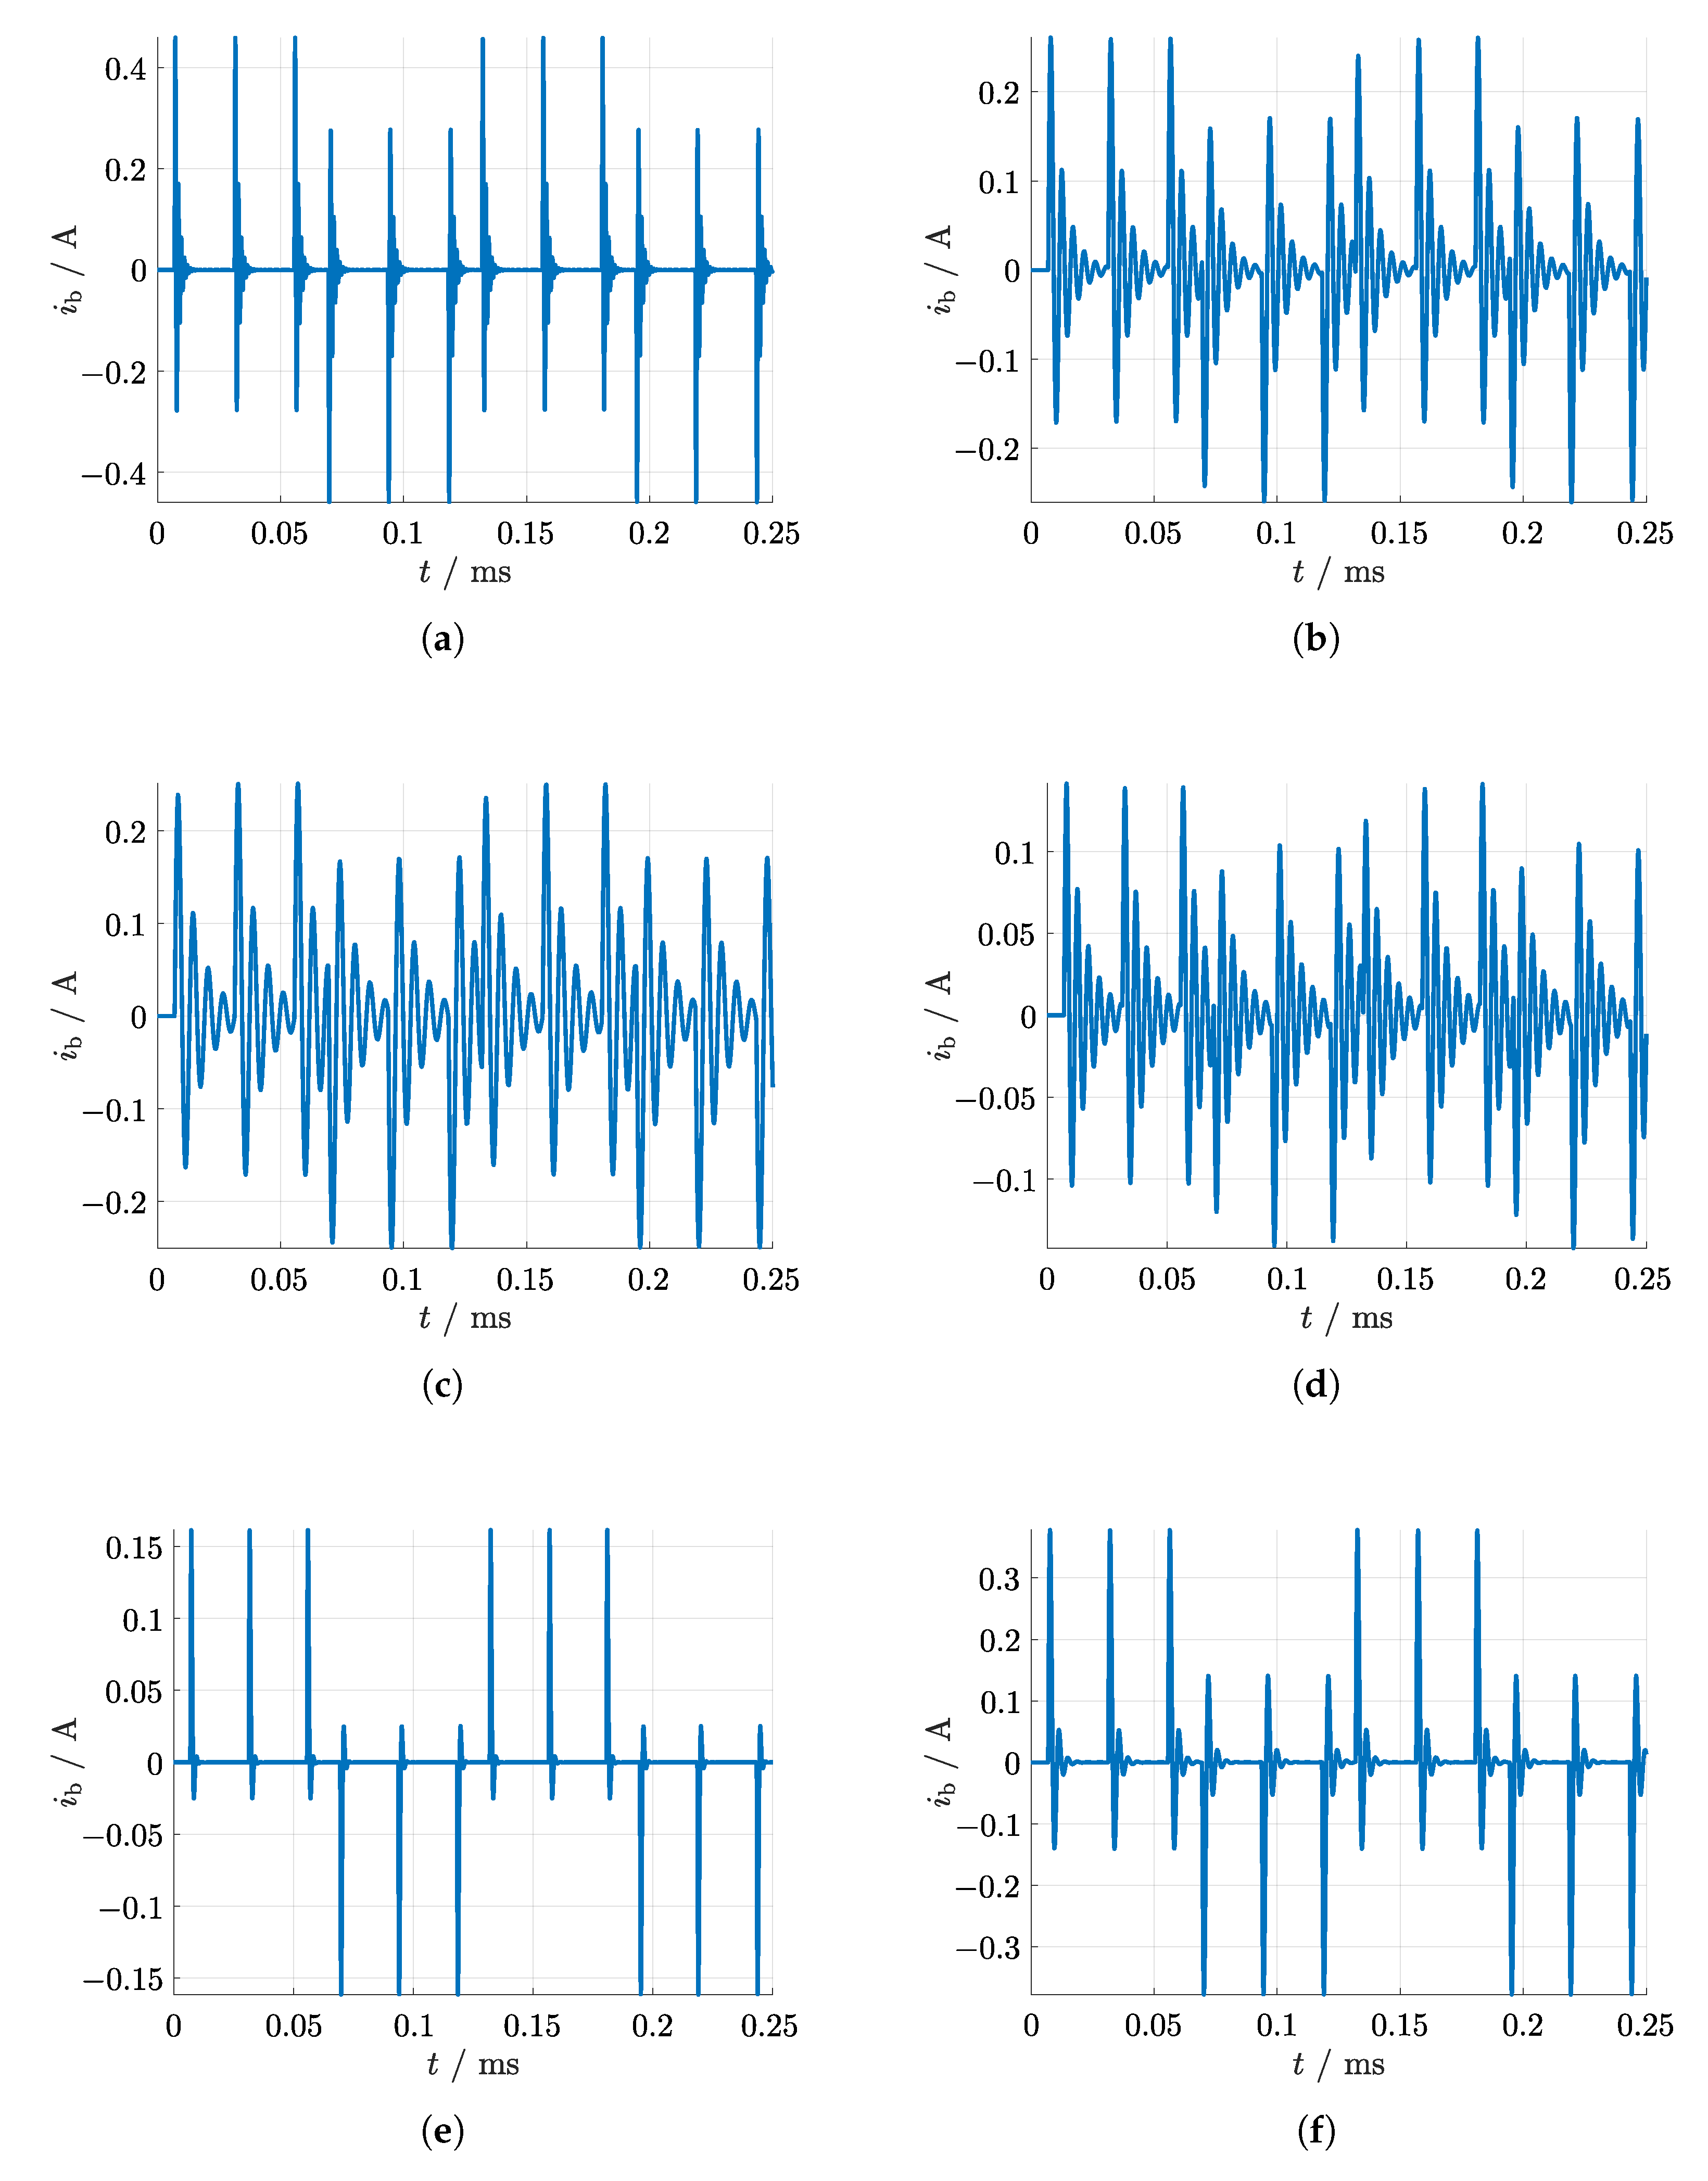
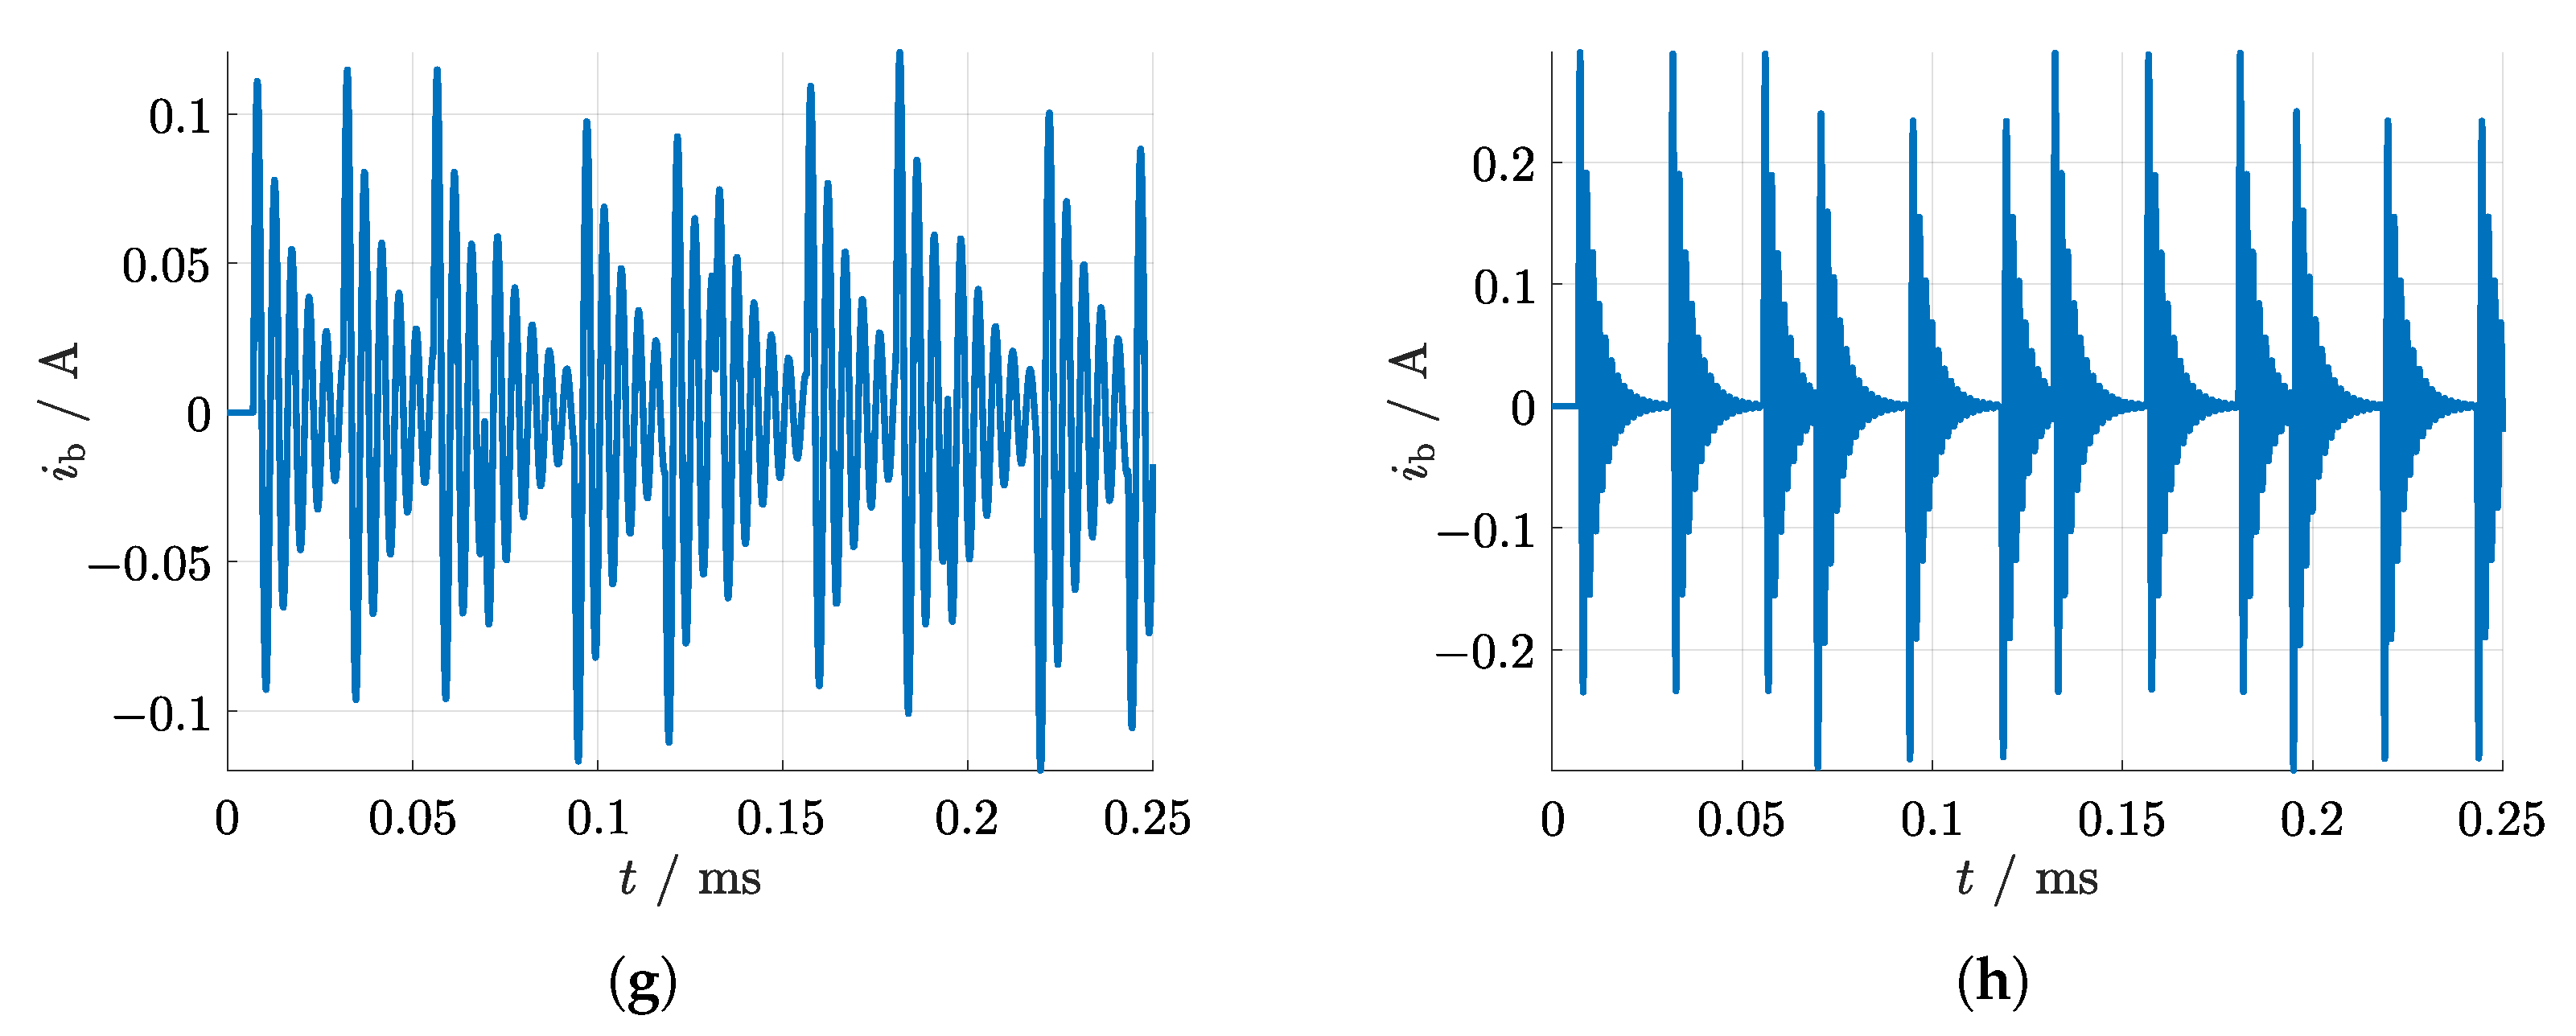
Section 2.3.2, the time-domain simulations were performed in Simulink. The results of the CM current
and HF circulating bearing current
are displayed in
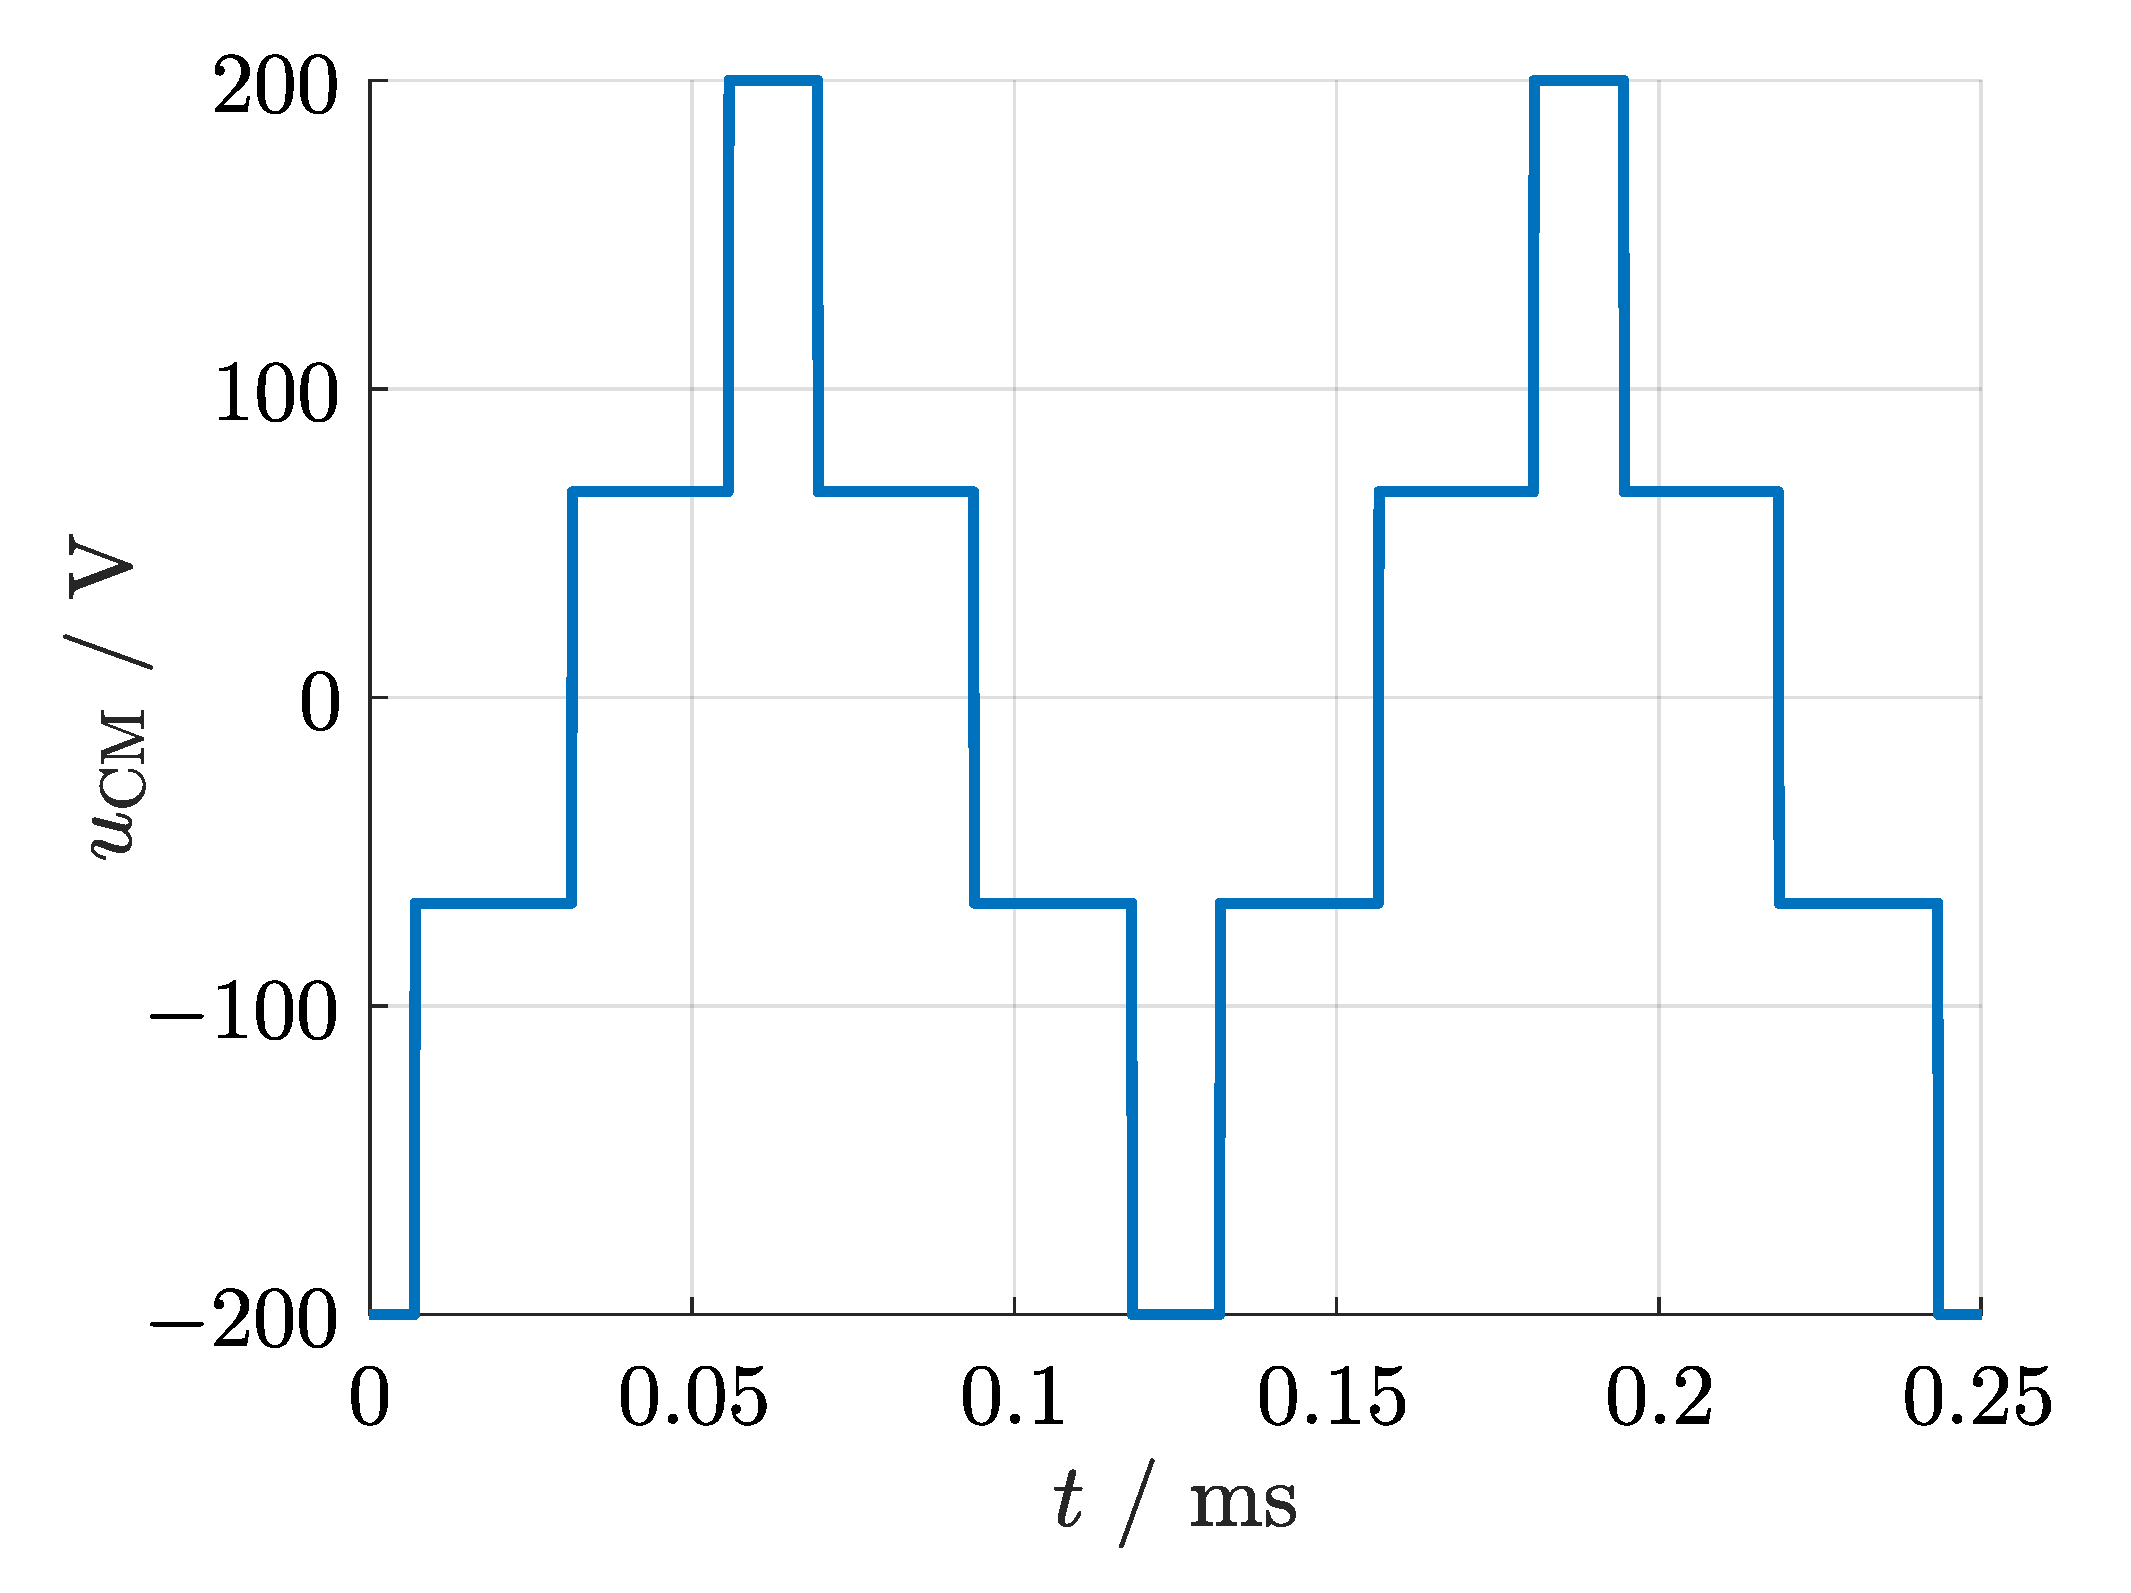
Figure 7 and
Figure 8, respectively, over a time span of
which are two periods of the CM voltage
due to the selected switching frequency of 8
(see
Figure 4). Each CM voltage transition with positive
leads to a current pulse with positive amplitude and subsequent oscillation, where the oscillation frequency is determined by the resonance frequency
(see Equation (
1)) and its damping by the resistances in the network. This occurs three times each for the transitions with positive and negative
per period of the CM voltage. The respective current amplitudes and the peak–to–peak value of
are given in
Table 6. Also listed is the ratio between the amplitudes of the circulating bearing current and the CM current, which is termed the bearing current ratio (BCR) in the literature [
3]. This ratio can also be calculated analytically via the parameters listed in
Table 4 by applying the equation of a current divider.
Despite not having the largest capacitance
, design H2 displays the largest CM current amplitude by far with roughly
, which is a factor 2.33 larger than the second largest amplitude shown by design H4 F. This can be attributed to a low number of series–connected winding turns, leading to a much lower stator endwinding leakage inductance compared to the other designs. This leads to a much larger oscillation frequency, visible in
Figure 7a, and a smaller impedance at the resonance.
This indicates that while not influencing the winding–to–stator capacitance in a significant manner, the number of winding layers still plays a major role in the formation of the CM current. However, design H2 also has the lowest BCR of approximately 5.4%, resulting in a bearing current amplitude of
. Despite similar values of the BCR and the capacitance
, resulting from the same stack length, same slot number and similar fill factor, the H6 design displays more than three times lower CM and bearing currents. The designs with four hairpin layers display the highest winding–to–stator capacitance by far mainly because of the larger slot number, leading to considerable CM current amplitudes above
and bearing current amplitudes above
. H4 R has a roughly 22% larger
than H4 F, but the 1.5 times larger endwinding leakage inductance leads to slightly smaller values of the CM and bearing currents. The BCR is very similar with values slightly above 7%. The same applies for the designs with eight hairpin layers, where H8 R has a 71% longer stack length and therefore larger
but an endwinding leakage inductance that is more than two times larger, altogether leading to similar current amplitudes. Characteristic for these two designs is the much larger damping compared to the other designs, which results from a larger stator winding resistance
since the skin effect resistance factor has a quadratic relation to the number of winding layers [
13]. This also leads to a lower difference between the bearing current amplitude and its peak–to–peak value.
The stranded winding design S1 has the lowest CM current and bearing current amplitudes, but the relatively weak damping leads to a significant difference between the bearing current amplitude and its peak–to–peak value. Despite having the smallest value of , design S2 displays relatively large current values, which is also due to the smaller value of the endwinding leakage inductance.
Generally, the bearing current waveform closely follows the CM current with relatively low amplitudes ranging from 0.121
to 0.46
, which can be attributed to the low BCR ranging from 5.4% to 8.2% for the analyzed PMSMs. This is much lower than previously established for induction machines, where BCRs up to 0.9 have been reported in some cases [
3]. Since PMSMs lack a rotor cage, the circulating bearing current is expected to flow through every lamination sheet individually, resulting in a high rotor impedance
. Whether these bearing current values could potentially endanger the bearings of such electric vehicle traction machines has to be investigated by determining the apparent bearing current density, a well-established damage indicator that is the ratio between the peak–to–peak bearing current amplitude and the Hertzian contact area [
6]. The latter tends to decrease with smaller bearing size but is also significantly influenced by the applied loads. Since the radial bearing loads are generally larger in automotive applications than the axial loads, this would yield a lower Hertzian contact area and thus larger bearing current density and worse bearing lifetime impairment if a critical value of the bearing current density were to be exceeded.
Considering the relatively similar BCR in the analyzed electric traction machines, a further decrease of the circulating bearing current could be achieved by reducing the CM current. Based on this study, the measures to achieve this could be either a reduction of the winding–to–stator capacitance
or an increase of the endwinding leakage inductance
.
can be reduced by decreasing the lamination stack length or the number of slots. Since the number of slots is fixed by the slot–pole ratio, the remaining possibility would be to shorten the lamination stack at the cost of lower power rating, as was done in the case of the H8 designs.
increases with the number of series–connected winding turns. The latter increases with the number of hairpin winding layers and decreases with an increasing number of parallel paths [
18].
Finally, it should be noted that the voltage slew rate of / chosen in this study is fairly low, even for inverters with silicon insulated gate bipolar transistors. Some of the analyzed electric traction machines are driven by inverters with wide–bandgap semiconductor devices, capable of much higher switching speeds. Accordingly, the resulting CM current and bearing current amplitudes under such conditions would increase proportionally.


