1. Introduction
The ongoing technological progress determines the need for a continuous increase in the speed of dynamical processes as well as the precision and durability of mechanical parts used for this purpose. The operation of each machine is closely related to the occurrence of the often unfavorable phenomena of mechanical structural and also self-excited vibrations caused by some kinds of friction. Thanks to the tests allowing for the identification of vibrations occurring in individual elements forming the frictional pairs, it is possible to effectively suppress the accompanying side effects, like, for instance, minimizing the dynamical system’s structural response or even reconstruction of the designed model. It is especially important because it not only allows to increase the performance of machines but also eliminates possible inaccuracies in their operation.
In machine design, it is common to perform a structural vibration analysis of specific areas of the machine. Structural vibrations can be defined as the dynamic motion of a structure caused by an external force or parametric excitation. In the case of unbalanced rotors, the vibration is caused by the imbalance of the rotor, resulting in a periodic external force acting on the structure. This force can cause the dynamic motion of the structure, which can result in additional loads on the system and potential damage or failure if not properly accounted for in the design and operation of the system.
Dynamic problems caused by dry and viscous friction or a rotating imbalance can occur in various systems, including driving and braking systems, stabilizing platforms, turbines, pumps, and others. Regardless of the type of vibration, the common factor is that the structure responds with repetitive dynamic behavior that affects its physical properties, accuracy of positioning, durability of bearings, and other factors.
Therefore, understanding and accounting for these dynamical effects is crucial in designing and operating machines that rely on rotating systems. Proper design and operation can help prevent failures and reduce downtime, leading to increased productivity and safety.
To prevent negative impacts, engineers use techniques such as damping, stiffening, and isolation to control and mitigate structural vibrations. These techniques involve mathematical modeling and time–frequency analysis, modifying the structure’s design, materials, or support systems to reduce the amplitude and frequency of vibrations or to isolate the structure from the external disturbance.
1.1. Rotating Engines
Rotating engines often induce structural vibrations in the attached or mounted structures. These vibrations are primarily caused by unbalanced forces generated by components such as rotors, crankshafts, pistons, connecting rods, or clutches.
The magnitude and frequency of these vibrations depend on various factors, including the rotation speed, mass and geometry of the engine components, as well as the stiffness and damping characteristics of the overall structure. At certain speeds, the natural frequency of the structure may coincide with the frequency of engine-generated vibrations, resulting in resonance and vibration amplification.
The effects of engine-induced vibrations can range from minor annoyances, such as rattling or shaking, to severe structural damage and failure. In extreme cases, these vibrations can lead to the fatigue, cracking, or failure of critical components such as engine mounts, brackets, or support structures.
To mitigate the effects of engine-induced vibrations, engineers employ techniques such as dynamic balancing, engine isolation, and vibration damping. Dynamic balancing involves balancing the rotating engine components to minimize unbalanced forces. Engine isolation focuses on mounting the engine on flexible mounts that absorb and dampen vibrations. Vibration damping involves the use of materials or devices, such as rubber mounts, viscoelastic materials, or tuned mass dampers, to absorb or dissipate vibrations.
The mechanism behind structural vibrations caused by rotating engines lies in the unbalanced forces generated by the rotating components. As the engine rotates, bearings, rotors, and connecting parts produce unbalanced forces with a net force in a specific direction. These unbalanced forces subject the engine mounts and the mounted or attached structure to dynamic loads, resulting in vibrations.
Overall, the mechanism of engine-induced vibrations involves a complex interaction between the rotating engine components, engine mounts, and the mounted or attached structure. The effective design and control of these components are crucial for preventing excessive vibrations and ensuring the safe and reliable operation of both the structure and the engine.
Holkup investigates the influence of pulley eccentricity on the vibration behavior of a belt drive system in [
1]. The study employs a mathematical model to predict the amplitude and frequency of the system’s vibration response.
Lakes and Sternberg examine stick–slip oscillations in a belt–pulley system with an unbalanced rotor in [
2]. They develop a mathematical model to predict the vibration response and investigate the effects of various parameters on the system’s behavior.
Sharma and Laware investigate the dynamic behavior of a belt–pulley system with an unbalanced rotor and dry friction in [
3]. Vakilzadeh and Duffar study the nonlinear dynamic behavior of a similar system in [
4]. Both studies develop mathematical models to predict the vibration response and explore the effects of various parameters.
Zhu presents an analytical model to investigate the effect of friction on the vibration response of a flexible rotor with an imbalance in [
5]. The study examines the relationship between the rotor imbalance response and friction coefficients at the contact surfaces.
In [
6], the authors investigate the nonlinear dynamics of a belt-drive system with an unbalanced rotor. They develop a mathematical model to predict the vibration response and explore the effects of various parameters, including bifurcations in the system’s response.
The stick–slip oscillations of a belt–pulley system under harmonic excitation are analyzed in [
7]. The study develops a model that considers nonlinear stick–slip contact forces between the belt and pulley, as well as the nonlinear elasticity of the belt. Results indicate that imbalance-induced stick–slip vibrations are significantly affected by excitation frequency, amplitude, phase, and belt–pulley parameters.
Another relevant paper by Duffar et al. [
8] presents a numerical model for analyzing the stick–slip vibrations of a belt–pulley system with an unbalanced rotor, accounting for nonlinear contact forces and belt elasticity. The study reveals that the vibration amplitude and frequency increase with the imbalance angular velocity, and the contact forces exhibit a complex hysteresis loop.
Lastly, Kim et al. investigate stick–slip vibrations caused by rotor imbalance in a belt-drive system in [
9]. Their numerical model considers nonlinear stick–slip contact forces and belt elasticity. Results demonstrate that imbalance-induced stick–slip vibrations are significantly affected by belt–pulley parameters and excitation frequency.
A further paper by Zhu [
10] extends the analysis to a belt–pulley system with multiple pulleys and belts, which closely resembles practical systems. Results reveal that imbalance-induced stick–slip vibrations can propagate to other belts and pulleys, with the vibration characteristics influenced by inter-belt and inter-pulley interactions.
Overall, the aforementioned studies prove the actuality of the research presented in this work and provide valuable insights into understanding and modeling structural vibrations caused by unbalanced rotors on moving bodies with friction, thereby taking into account the practical implications for the design and operation of various mechanical systems.
1.2. Contact Forces
The impact of structural vibrations on frictional contact in self-excited vibrations is significant. When a structure undergoes self-excited vibrations, its interaction with the frictional contact forms a coupled system that can lead to instability and unpredictable behavior. The frictional forces at the contact interface can either amplify or dampen the structural vibrations, resulting in a complex interaction that depends on various factors, such as the contact conditions, material properties, and system dynamics.
Self-excited vibrations can cause stick–slip or chatter, characterized by large amplitude oscillations, noise, wear, and damage to the system. The frictional forces at the contact interface can create a positive feedback loop, amplifying the structural vibrations and exacerbating stick–slip or chatter. Conversely, frictional contact can also have a damping effect on structural vibrations, reducing their amplitude and increasing system stability.
Numerous studies, including those of Holnicki-Szulc et al. [
11] and Litak et al. [
12], have investigated the influence of structural vibrations on frictional contact in self-excited vibrations. These works emphasize the importance of considering the coupled dynamics of the structure and the frictional contact in the design and analysis of systems subject to self-excited vibrations.
During vibration, a structure experiences dynamic deformation, and the frictional contact with its surroundings can significantly affect this deformation. The frictional forces at the contact interface act as external forces on the structure, either amplifying or damping the structural vibration based on the contact nature.
In cases of self-excited vibrations, the improper maintenance of frictional contact, such as between a rotating shaft and a bearing, can result in lateral vibrations. The contact intermittently breaks and re-establishes, causing stick–slip or chatter. As the contact breaks and re-establishes, impulses are generated, amplifying the lateral vibration and leading to more severe stick–slip or chatter. This phenomenon causes considerable damage and reduces the system’s lifespan.
However, frictional contact can also exhibit a damping effect on structural vibrations. The frictional forces at the contact interface function as internal damping forces, dissipating vibration energy and reducing its amplitude. This damping effect enhances system stability and prevents self-excited vibrations.
Consequently, the influence of frictional contact on structural vibrations is a complex phenomenon that relies on factors such as contact conditions, material properties, and system dynamics, including natural frequencies and damping ratios.
1.3. Self-Excited Vibrations with Friction
The examination of how rotating engines’ structural vibrations influence self-excited vibrations with friction is a specific area that has not been thoroughly explored. Over the past few years, there has been some research conducted in this domain. Studies such as [
13,
14,
15] have focused on investigating the effects of friction on rotor systems in the presence of engine-induced structural vibrations. These works delve into the mechanisms behind friction-induced vibrations, explore the factors that influence the onset and amplitude of these vibrations, and predict self-excited stick–slip whirling oscillations in rotor/stator rubbing systems. Various techniques have been explored, including altering the material properties of components, introducing damping, and modifying system designs to prevent resonance. Additionally, the significance of the dynamical coupling between energy sources and structural responses in real engineering problems is emphasized in [
16].
The above literature review, closely related to the researched topic, identified three fundamental phenomena that have an impact on the experiments conducted in the laboratory setup described further in this work. The gap between the current work and the cited literature is filled throughout the entire paper.
One of the theoretical contributions, as demonstrated in the study by Sah et al. [
17], investigates the effect of vertical high-frequency parametric excitation on self-excited motion in a delayed Van der Pol oscillator. The findings suggest that the combination of vertical parametric excitation and delay can effectively dampen self-excited vibrations. Furthermore, Thomsen [
18] provides original theoretical insights into the influence of high-frequency external excitation on friction-induced self-excited oscillations. Another notable investigation, presented in [
19], explores the nonlinear dynamics of a dry friction oscillator subjected to combined harmonic and random excitations acting solely in the vertical direction.
However, none of these cited papers address the influence of structural vibrations on real frictional contact, where the contact force undergoes variations in the normal direction. This particular phenomenon remains unexplored in experimental setups and poses significant challenges in terms of modeling elastic frictional contact. As a result, the mathematical models developed to account for this physical phenomenon primarily rely on approximate approaches.
2. Modeling the Physical System
2.1. Components of the Machine
The mechatronic system under study is depicted in
Figure 1. It consists of mainly three interconnected subsystems: a driving unit—DC motor with a driver (on the left); a belt–pulley system of energy transmission; and a chain of oscillating bodies simulating a mechanism of intensification of breaking force as established in [
20].
The oscillating chain of bodies includes a single non-symmetric pendulum (a solid angle body (D) with an equal side length in
Figure 2a), which serves as a mechanism for intensifying friction forces in the contact of the block (C) with the base (B). This kind of coupling is popular in braking systems and is used to enhance the friction force.
The motor is connected to the belt pulley through a toothed belt, transmitting the driving torque. The angular velocity of the pulley is used to determine the velocity of the conveyor belt, which acts as the excitation for the oscillating mass.
The system is designed to explore the complex interactions among the subsystems and investigate the impact of the friction force intensification mechanism on the overall behavior of the system.
In summary, the investigated mechatronic system comprises three main subsystems: a DC motor with a transmission system, a subsystem of oscillating bodies with a friction force intensification mechanism and a relatively high rotational velocity operating DC motor generating structural vibrations of the self-excited oscillator with friction.
The considered system of mechanical oscillators investigated on the laboratory experimental test stand shown in
Figure 1 can be modeled using the physical representation shown in
Figure 2.
Taking into consideration the three coupled inertia shown in the configuration, i.e., the imbalanced rotor (A), the frictional oscillator (C), and the pendulum body (D), we begin the dynamical analysis from the derivation of the mass moment of inertia of the pendulum rotating about its center of gravity (read c.g.).
2.2. The Mass Moment of Inertia of the Pendulum
Looking at the geometric figure—the angle bar in
Figure 2b—we introduce a local coordinate system attached to
O at
, divide its areas on
and
and also define vectors
and
to its centers of gravity, respectively.
The center of gravity of the angle bar is determined with respect to the axis of rotation crossing point
O and perpendicular to the axis
, assuming that it is symmetrical with respect to the axis crossing c.g. and point
O, see dotted line in
Figure 2b. According to a known formula, the distance
l being the diagonal of the square, see
Figure 2a, to the c.g. reads
, and finally
, where at symmetry,
.
When determining the mass moment of inertia
J of the pendulum body, the Steiner theorem is used twice. The angle bar’s uniformly distributed mass
is divided into two parts, as shown in
Figure 2b, where at
and
, the smaller part is ≈
and the larger one ≈
. The mass moment of inertia of the larger rectangle
, assuming the distance
between the c.g. of this part and the point
O, is equal to
. The mass moment of inertia of the smaller rectangle
, assuming the distance
between the c.g. of this part and the point
O, is equal to
. Summing both parts, the moment of inertia of the angle bar with respect to point
O follows
. After the second application of the Steiner theorem, we find the mass moment of inertia of the pendulum body with respect to its c.g.,
. The actual real value may be slightly different from the theoretical one, as the small mounting holes and spring bolts are omitted.
2.3. The Imbalanced Rotor on the Sliding Block
The subject of dynamics of a nonlinear oscillator inducing vibrations of a moving structure can be called a “rotor in motion”, and it is also a subject being developed in the context of the occurrence of imperfect energy sources.
Various phenomena occurring in systems consisting of coupled rotating elements are observed, where their imbalance plays a significant role in the formation of vibration in the structure. In works [
16,
21], such a system is considered, where the imbalanced rotor’s function is delivered by a direct-current induction motor, mounted in the center of the sliding body.
The imbalanced rotor (A) on the beam (C) being in a sliding contact with the base (B), as shown in
Figure 2a and further in
Figure 3a, is assumed as the non-ideal source of energy pumped to the considered structure.
The rotor with imbalance mass
with a lumped mass model of the imbalance of mass
, as shown in
Figure 3b, could be treated as a source of cyclic excitation of structure of the mechanical system.
2.4. Varying High-Frequency Forcing from a Driving System
This section investigates the influence of varying excitation on the dynamics of a 2-degree-of-freedom (2-DoF) mechanical system. Two mathematical models are considered: one with feedback between the oscillating mass and the driving system and another without feedback. The dynamical analysis of these models is performed, and the resulting bifurcation diagrams are presented.
The mathematical model is of the motor’s electromagnetic torque driving the moving belt—a base is represented by a first-order ordinary differential equation with respect to the rotor’s angular velocity
. It includes the constant part of the loading torque
, the total gear friction torque
from the belt–pulley gear, and the torque exerted on the belt–pulley system by the conveyed mass
. The friction force
is localized in a the contact surface between the block and the moving base at a constant normal force, which in this case depends on their relative velocity of displacement
. The model is at constant normal force
N exerted by the free block on the moving base given by Equation (
1):
where
and
, see Equation (
9), represent the static and dynamic friction torques, respectively,
, and
is the radius of the belt and pulley.
The derivation and final model of the electromagnetic torque
used in this study are presented in detail in [
22].
2.5. Controlled High-Frequency Forcing from an Unbalanced Rotor
To gain a comprehensive understanding of the system at hand and facilitate an initial analysis of its predicted real behavior and dynamic response, it is necessary to derive mathematical models for all dynamical subsystems that make significant contributions. A preliminary mathematical description of the system is mostly sufficient for accurately determining its dynamical properties and parameters.
Consider a mechanical system consisting of a block with mass
m mounted on a soft base, which is driven by a unit described in
Section 2.4. The system shown in
Figure 3 also includes an unbalanced rotor of mass
(2) and inertia
created by an eccentric disk rotating at angular velocity
. The distance from the center of mass of the disk to the rotation axis is denoted as
. The block of total mass
experiences frictional contact with the moving base, while its motion is constrained by two flexible beams (1, 4) with linear bending stiffness
and
. These beams are attached at their other ends to the stationary structure of the test stand. Additionally, the base material exhibits some elasticity
perpendicular to the surface, influencing the dynamic behavior of the tested block, here called the self-excited friction oscillator. The displacement of the oscillator in the horizontal and vertical directions is denoted by variables
and
, respectively.
In order to provide a more detailed description of the system, we derive its mathematical model to analyze its behavior. The mechanical system under consideration consists of a block on a base with a total mass of M. A DC motor with a mass is mounted on the block, and an unbalanced mass is localized at an eccentric disk rotating at a distance from the center of mass at a given angular velocity or even a function can be used to describe its time dependency with regard to a controlled modulation of the rotational velocity of the rotor with the unbalancing mass. The block, referred to as the self-excited friction oscillator, is in frictional contact with the moving base and is constrained by elastic forces from two flexible beams with linear stiffness in the bending direction, denoted as and , attached to the stationary structure of the laboratory test stand.
We assume that the soft material of the base exhibits a certain elasticity, denoted as , components of which act in the direction parallel () and perpendicular () to its surface, which affects the dynamic behavior of the block. The displacement of the oscillator in the horizontal direction is represented by the variable and in the vertical direction by the variable . The deformations of the spring beams, caused by stretching and compression, only have a horizontal component relative to the chord, neglecting deformations in other directions.
In the extended model friction model that incorporates changes of normal force in the frictional contact between the block and the moving base, the friction force is also influenced by the additional force
(see
Figure 2),
for simplification, generated by the rotating arm of the spring pendulum, which is elastically connected to the block, and also the acceleration of total mass
M in the vertical direction
—perpendicular to the horizontal
direction. The second component of acceleration in the direction perpendicular to the frictional contact comes from the mechanism of imbalance that is introduced by the unbalanced rotors attached to the block (see
Figure 3). Considering the chosen directions of the two-dimensional coordinate system, this acceleration has the opposite direction to the gravitational acceleration
g. Thus, the general formula for the friction force can be expressed as
where
and
at
, compared with Equation (
1) that does not govern the dynamical changes of normal force at the frictional contact.
The centrifugal force
generated by the unbalanced rotor attached to the block and causing high-frequency vibrations in its structure can be expressed as the product of the mass
of the rotating unbalance, the distance
between the rotor’s axis of rotation and its center of mass, and the third variable—the square of the angular velocity
of the rotor attached to the block, i.e.,
Assuming that the stretching and compression of the spring beams occur only in the horizontal direction relative to the chord, their deformations in other directions are negligibly small. The general mathematical model of the described problem can be represented by the following equations of motion:
which can be expanded to
Here,
represents the mass of the unbalanced rotor, and the following parameters:
—stiffness of the base in the
direction while the block is in the stick or creep phase; and
—stiffness of the base in the
direction. If
, then in Equation (
5a), the term
is replaced by the sliding friction force
. The force
, components of which act in the
and
directions of the local coordinate system, correspond to the centrifugal force generated by the rotating unbalanced rotor, specifically the eccentric disk acting on the rotating rotor.
It is important to note that during the rotation of the unbalanced rotor, the force acts cyclically in an upward direction, attempting to detach or press the block from or to the base, as well as the force acting towards the left or right side. This action increases or decreases the horizontal force acting on the block in frictional contact with the base. In the first case, it reduces the normal contact force between the block and the belt, while in the second case, the force cyclically increases or decreases the inertia of the block, causing the acceleration or deceleration of the block’s motion on the moving base when the relative velocity is non-zero. When , it interacts with the block in the stick or even creep phase, accelerating or decelerating the transition from stick or creep to the sliding phase.
Considering the two-dimensional nature of the problem and the orientation of the Cartesian coordinate system, the
t-dependent function of centrifugal force
can be decomposed into two mutually perpendicular components parallel to the
and
axes, delivering the components used in Equation (5a,5b), respectively:
According to the adopted law of friction, the coefficient of friction
depends on the relative velocity present in the contact zone of both bodies and is described later by function (
9).
2.6. Modeling the Pendulum-Block Coupling of Friction Force Intensification
The differential equations of motion of the two-degree-of-freedom mechanical system under consideration are derived by incorporating generalized non-conservative forces into Euler–Lagrange equations of the corresponding conservative system. A schematic diagram of the model is shown in
Figure 1b. The main (horizontal) block is driven longitudinally by the moving belt by friction forces. The load transfer between the main block of mass
m and the angular body is provided by the spring
and damper
, while the normal load from the rotating angular body on the main block is transferred by the vertical spring
and damper
. The moment of inertia of the angular body with respect to its center of rotation
O is
J, and its mass is
. The main block oscillator is also connected to the fixed support by the spring of stiffness
.
By utilizing the methodology and the model developed and identified in [
20,
23,
24], and adding the mass of the unbalanced rotor
and the external relatively high-frequency forcing components of
(see Equations (4) and (5a,5b)) to the right-hand sides of the appropriate equations describing motion in the two general coordinates
and
, we obtain the following set of second-order differential equations:
where
is a non-dimensional factor of the eccentrically rotating angle body and the friction force
F, which depends on variations of the vertical load. The expression for
F is given by
As the DC machine rotor is attached to the construction, the third dynamical Equation (5a,5b) states a coupled supplement model of which the additional forces
and
(see friction model (
8)) have to be taken into consideration for the dynamical analysis.
The friction law, which represents the dependence of the friction coefficient on the relative velocity at the contact surface,
, is given by
where
is a constant parameter controlling the amplitude of the spike in the friction coefficient. Assuming that the range of relative velocities is narrow enough, the parameter
is responsible for the decay of the friction force as the modulus of the relative velocity increases. The parameter
controls the sharpness of the curve near zero, and finally,
controls the magnitude of spikes near zero, i.e., the rate of the original drop of the friction coefficient just after the main mass leaves the creeping area.
3. The Numerical Estimation of Influence of High-Frequency Forcing
To numerically illustrate the described effect, we show a bifurcation diagram. One selects the experimentally estimated model parameters given in
Table 1 (as identified in [
20,
23,
24]). For this parameter set, the corresponding linearized conservative system has eigenfrequencies of
Hz and
Hz. In contrast to the reference [
23], no low-order internal resonances are assumed in this case.
The listed parameter values are close to those obtained from the measurements for the experimental setup depicted in
Figure 1a. However, some important parameters are challenging to precisely identify due to geometric and physical factors. Friction-induced dynamics, for example, is highly sensitive to the parameters of friction laws and the shapes of corresponding curves. Additionally, the real block interacting with the moving belt is a three-dimensional body, leading to a non-uniform distribution of normal pressure on the belt’s bottom surface. Furthermore, the exact control of the belt speed to match a target constant value is difficult, but it is achieved by applying a very precise stepper motor with an integrated current control driver of the machine. The primary objective of this study is to focusing on the major transitional effects in decelerating sliding, rather than striving for a perfect quantitative match of the dynamic states.
The mathematical model presented in the previous section was tested in two versions: a simplified version that assumes a constant rotational speed of the belt pulley and excludes the equations describing the dynamics of the stepper motor and transmission system, and a full model that considers feedback effects on the system’s dynamics.
To assess the differences between the simplified and full models, their responses to variations in the parameter were analyzed. The parameter was varied from 83 to 88 [N/m] in increments of , and simulations were performed for a duration of 40 [s]. Registration of the data series for the plot was initiated after 15 [s] to eliminate transitional dynamics.
The two overlapping bifurcation diagrams depicted in
Figure 4 illustrate the displacement of the mass block
m during subsequent stick to slip transitions, with a Poincaré map’s point appearing when the acceleration of the body crosses 0 from above. Both models exhibit the same types and order of changes in dynamics, differing mainly in the values of the bifurcation parameter for each type of change.
The full model, considering the varying rotational velocity of the engine and higher driving frequencies, exhibits period doubling at lower control parameter values compared to the simplified model. Moreover, the regions of chaotic behavior are wider in the full model. These findings indicate that the inclusion of feedback effects in the full model leads to a more complex and diverse dynamic behavior of the system.
In summary, these results provide valuable insights into the behavior of the investigated mechatronic system under varying excitation conditions and highlight the significance of incorporating feedback effects in the mathematical model for a more accurate representation of the system’s dynamics.
Significantly, both models exhibit distinct thresholds of (red) and (blue), at which the regions of chaotic behavior come to an end, respectively. This implies a transition in the dynamical nature as the bifurcation parameter increases, when comparing the simplified and more complex models.
The resulting bifurcation diagrams highlight the distinctions between the simplified and full models, providing valuable insights into the system’s behavior under higher engine-induced frequencies.
In conclusion, the numerical investigation confirms an intriguing observation. The subsequent section will delve into the response of the real system under higher vibrations, further enhancing our understanding of its behavior under different conditions and its practical implications.
5. Discussion
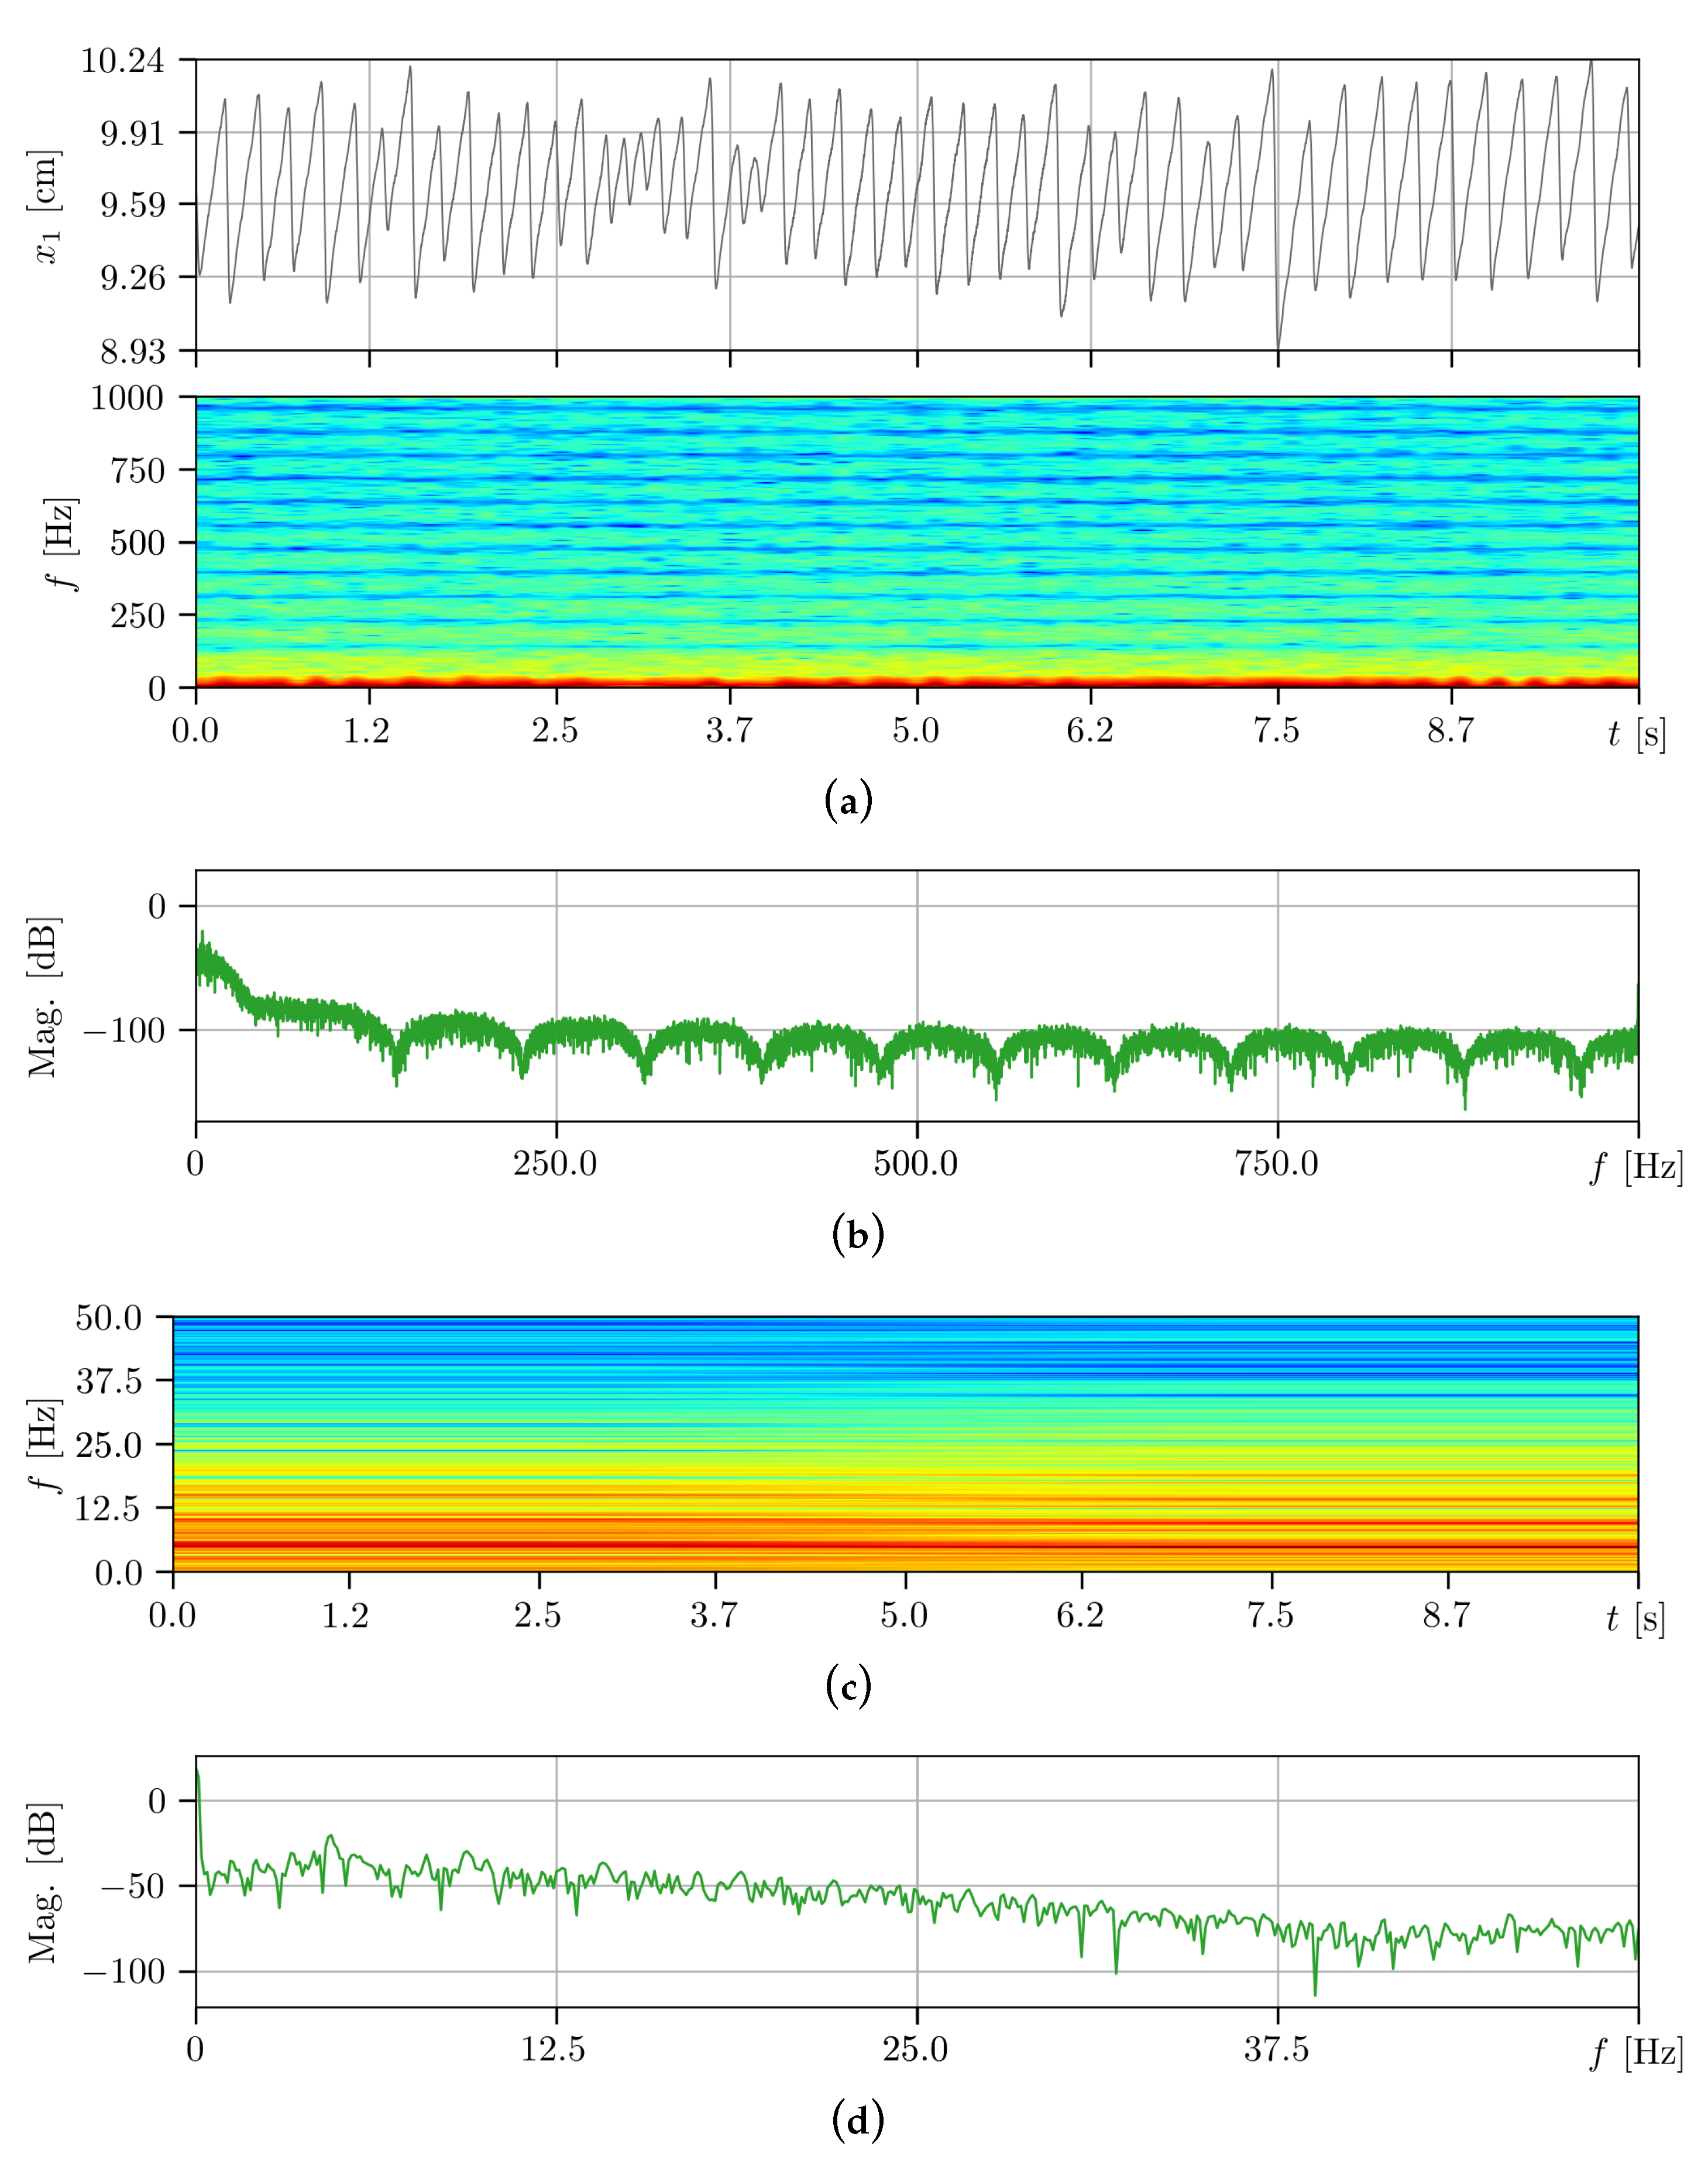
Figure 7 presents the first spectrogram of pendulum oscillations with attached springs
and
in the absence of high-frequency excitation (case 1).
Figure 7.
Time history, spectrogram, and magnitude plot of a coupled soft spring characteristic pendulum in the high (a,b) and low (c,d) frequency spectra. The base linear velocity is maintained at a constant of [degrees/s], while the structure remains unaffected by high-frequency vibrations.
Figure 7.
Time history, spectrogram, and magnitude plot of a coupled soft spring characteristic pendulum in the high (a,b) and low (c,d) frequency spectra. The base linear velocity is maintained at a constant of [degrees/s], while the structure remains unaffected by high-frequency vibrations.
In the wide frequency band of oscillations shown in
Figure 7a, several distinct high-frequency components of the pendulum oscillations are observed, which are read from the amplitude graph in [dB] in
Figure 7b. These frequencies are approximately 850, 600, and 300 [Hz], as well as the extended ones within the lowest band width of 0–50 [Hz]. The detailed distribution of multiple coexisting frequencies in this range is shown in
Figure 7c, where the values are located more precisely in
Figure 7d at 8, 6, and 4 [Hz]. The dominant frequencies of oscillations are marked by streaks with colors approaching red, indicating that the fundamental and most prominently visible frequency of the pendulum oscillations is around 4 [Hz], accompanied by a series of other frequencies resulting from the vibrations of the entire structure and the energy flow from the drive through the friction oscillator on the belt to the pendulum.
Figure 8 shows the second spectrogram of oscillations of the same pendulum but with activated high-frequency excitation at a constant value (case 2).
Figure 8.
Time history, spectrogram, and magnitude plot of a coupled soft spring characteristic pendulum in the high (a,b) and low (c,d) frequency spectra. The base linear velocity is maintained at a constant of [degrees/s]. The structure experiences high-frequency vibrations.
Figure 8.
Time history, spectrogram, and magnitude plot of a coupled soft spring characteristic pendulum in the high (a,b) and low (c,d) frequency spectra. The base linear velocity is maintained at a constant of [degrees/s]. The structure experiences high-frequency vibrations.
It is clearly visible that the entire spectrogram has higher intensity, indicating larger amplitudes of oscillations at the frequencies mentioned in the previous case. Two new but weakly visible frequencies close to 100 and 200 [Hz] have appeared (see spectrogram
Figure 8a), which are not present in
Figure 7a. The second value corresponds to the excitation frequency originating from the imbalance mounted on the block. It should be noted that the high-frequency excitation source is not attached to the pendulum but to the block vibrating on the belt. However, the vibrations are transferred to the pendulum, which, through its elastic (soft) connection with the block, becomes a mechanical vibration detector. Moreover, the streaks corresponding to the pendulum oscillations at frequencies near 14 and 16 [Hz] show more contrast.
Figure 9 presents the third spectrogram of self-excited vibrations with friction between the block and the belt, with attached flat springs
and
, in the absence of high-frequency excitation (case 3).
Figure 9.
Time history, spectrogram, and magnitude plot of the self-excited block oscillator in the high (a,b) and low (c,d) frequency spectra. The base linear velocity is maintained at a constant of [degrees/s], while the block remains unaffected by high-frequency vibrations.
Figure 9.
Time history, spectrogram, and magnitude plot of the self-excited block oscillator in the high (a,b) and low (c,d) frequency spectra. The base linear velocity is maintained at a constant of [degrees/s], while the block remains unaffected by high-frequency vibrations.
The motion of stick–slip is clearly visible in
Figure 9a and is characterized by dominant frequencies around 10, 8, and 4 [Hz] (see spectrogram
Figure 9c), where 4 [Hz] corresponds to the fundamental frequency of block vibrations on the belt, which, obviously, is shared with the previously mentioned frequency of the pendulum attached to the block. In contrast to the pendulum response, the spectrogram in
Figure 9a does not exhibit any significant features in the high-frequency range, which may be due to a stiffer contact between the block and the moving belt, the dominant role of self-excited vibrations at lower frequencies, or the laser vibration sensor’s inability to detect such weak vibration components of the block.
Figure 10 shows the fourth spectrogram of the same block vibrations but with activated high-frequency excitation at a constant value (case 4).
Figure 10.
Time history, spectrogram, and magnitude plot of the self-excited block oscillator in the high (a,b) and low (c,d) frequency spectra. The base linear velocity remains constant at [degrees/s], while the block undergoes high-frequency vibration.
Figure 10.
Time history, spectrogram, and magnitude plot of the self-excited block oscillator in the high (a,b) and low (c,d) frequency spectra. The base linear velocity remains constant at [degrees/s], while the block undergoes high-frequency vibration.
It is clearly visible that the entire spectrogram has slightly higher intensity but less clarity compared to the soft-spring-connected pendulum case. The most important observation comes from the analysis of the spectrogram
Figure 10c, where the streaks that were more distinct before the activation of this excitation become blurred. This indicates that apart from the dominant frequency of block vibrations close to 4 [Hz], there are no other frequencies of similar prominence. This is an interesting observation that shows that the periods of pure stick–slip vibrations are becoming shorter. The interruption of the previously regularly occurring vibrations of this type can be seen in the time trajectory in the range of 2.8–4 [s].
Figure 11 and
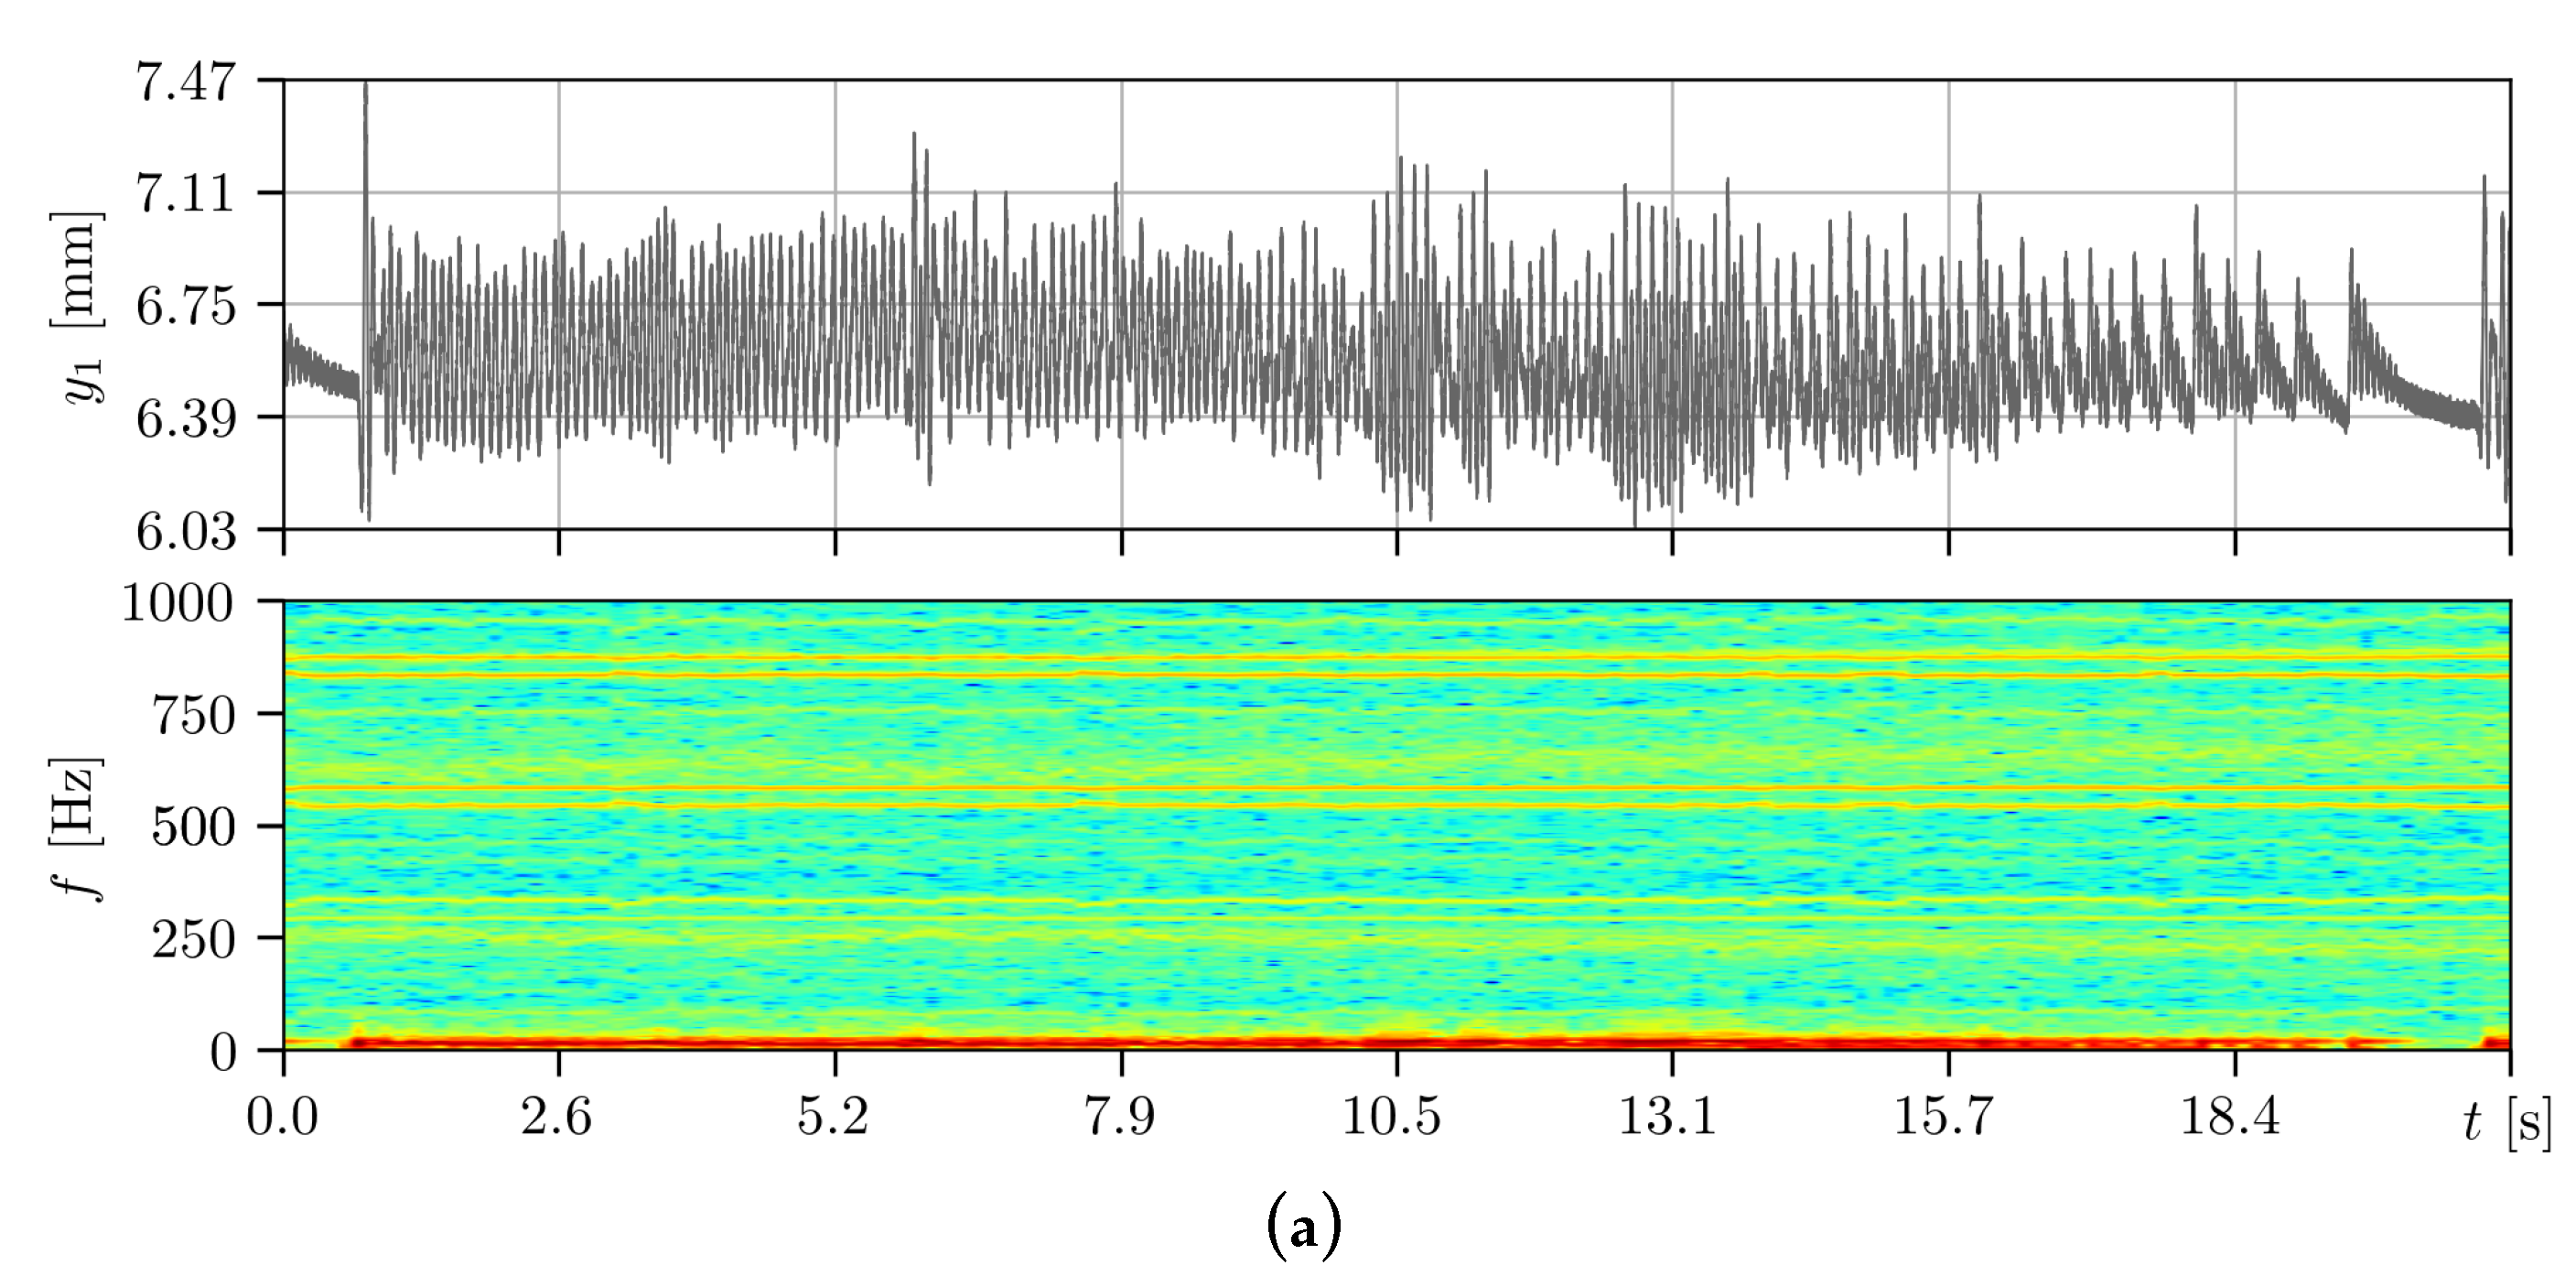
Figure 12 show the responses of the pendulum without and with activated high-frequency excitation but with a linearly decreasing velocity of the base motion (cases 5 and 6).
Figure 11.
Time history, spectrogram, and magnitude plots illustrating the response of the pendulum dynamics to a sweep step wave driving the stepper motor. The base velocity decreases linearly from [degrees/s] to 0 within 20 [s], while high-frequency forcing is not activated. The spectra are split into high ((a,b), up to 1000 [Hz]) and low ((c,d), up to 50 [Hz]) frequency ranges.
Figure 12.
Time history, spectrogram, and magnitude plots illustrating the response of the pendulum dynamics to a sweep step wave driving the stepper motor. The base velocity decreases linearly from [degrees/s] to 0 within 20 [s], accompanied by the activation of high-frequency forcing. The spectra are split into high ((a,b), up to 1000 [Hz]) and low ((c,d), up to 50 [Hz]) frequency ranges.
Similar to the first and second cases, the spectrograms differ in intensity, which increases towards warmer colors in the second case. In
Figure 11c, within the time interval of 0–13 [s], the first frequency of pendulum oscillations between 11–12 [Hz] is visible, which slowly decreases and blurs before disappearing. At the same time, within the range of approximately 9–18 [Hz], a coexisting frequency of around
[Hz] is observed. Only this frequency remains visible in
Figure 12c (when excitation is activated), while the lower frequency becomes blurred.
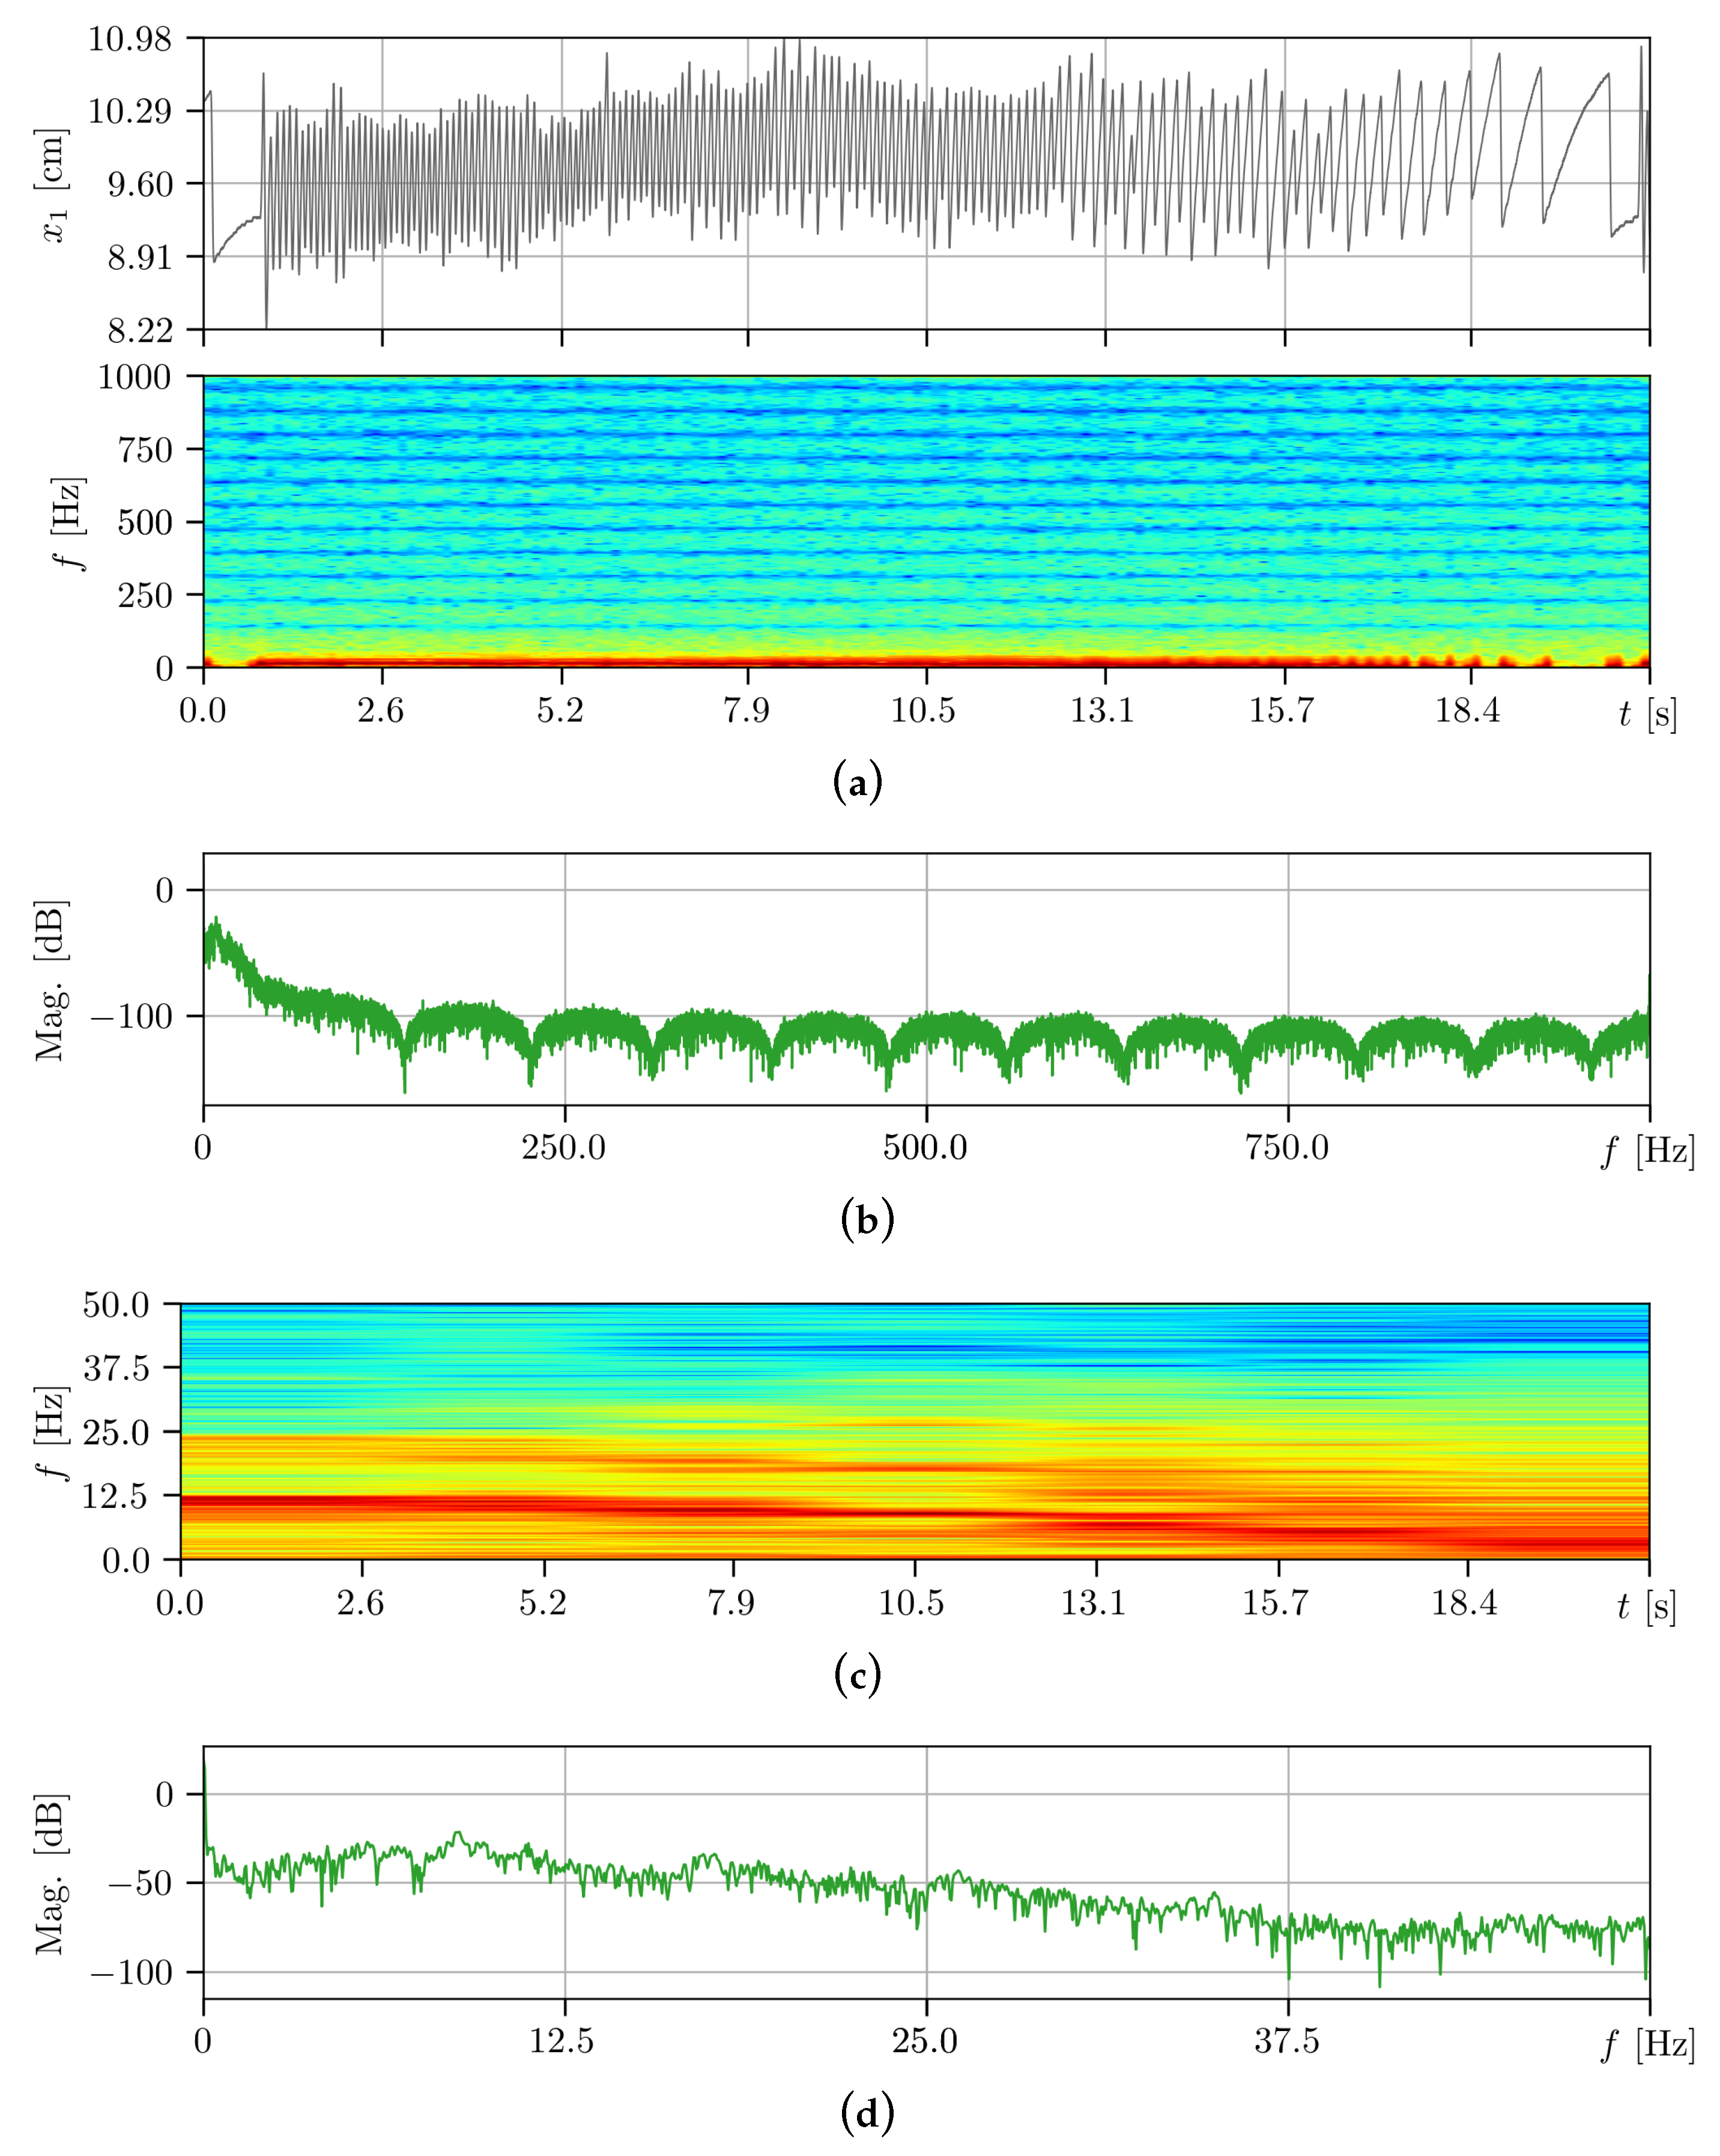
Figure 13 and
Figure 14 show the responses of the block in self-excited motion with friction without and with activated high-frequency excitation, respectively, with a linearly decreasing velocity of the base motion (cases 7 and 8).
Once again, the blurring of the spectrograms is observed, and the frequency response in spectrogram
Figure 13c exhibits several stepwise decreasing vibration frequencies (from 12 to 10 to 4 [Hz]), despite the linearly and steadily decreasing base velocity. However, the responses in
Figure 14 still clearly show the dominant and stepwise occurring frequencies of block motion, despite the presence of high-frequency excitation.
Finally, the most significant observation is that the range of vibration amplitudes on the time trajectory in
Figure 13a is much larger and more constant than in
Figure 14a. Due to the excitation applied to the structure from the motor on the block, the friction with stick–slip becomes less distinct and frequently interrupted. The faster breaking of the sliding contact between the block and the belt, manifested by the shorter duration of this contact pair in the stick phase, is the result of the vertical acceleration component
originating from the rotational motion of the imbalance.
Figure 13.
Time history, spectrogram, and magnitude plots illustrating the response of the self-excited block oscillator’s dynamics to a sweep step wave driving the stepper motor. The base velocity decreases linearly from [degrees/s] to 0 within 20 [s], while high-frequency forcing is not activated. The spectra are split into high ((a,b), up to 1000 [Hz]) and low ((c,d), up to 50 [Hz]) frequency ranges.
Figure 14.
Time history, spectrogram, and magnitude plots illustrating the response of the self-excited block oscillator’s dynamics to a sweep step wave driving the stepper motor. The base velocity decreases linearly from [degrees/s] to 0 within 20 [s], accompanied by the activation of high-frequency forcing. The spectra are split into high ((a,b), up to 1000 [Hz]) and low ((c,d), up to 50 [Hz]) frequency ranges.
It is difficult to explain the obtained experimental results, especially when dealing with a physically sensitive phenomenon like contact friction between solid bodies. The presented research results are another step and the outcome of an in-depth analysis of the observed frictional phenomena. As a result of the attempt to better identify the friction model and factors influencing its accuracy, it was noticed that the vibrations of the structure described and shown in this article have a significant impact on the sensitive and irregular states of consecutive transitional states of stick or creep (some kinds of adhesion) and sliding. For this purpose (compared to the previous design), the connection of the drive system was modified in this study by introducing a connector (a soft connector in black below the timing belt in
Figure 1), and the entire experimental setup was placed on gray polystyrene boards to reduce vibrations. However, the inclinometer detected vibrations of the structure and the self-excited frictional oscillator block with higher frequency, making it difficult to measure amplitude and distribution.Spectrograms and high-precision time trajectories turned out to be useful tools for detecting these vibrations.
6. Conclusions
The present study investigates the influence of time-varying excitation on the dynamics of a mechanical system with multiple degrees of freedom. Both studied models exhibit similar behavior and show comparable changes in their dynamical characteristics. However, the impact of excitation frequency on the system’s dynamics is clearly observable. Higher-frequency vibrations generated by motors, such as DC motors, affect the driven system’s behavior by altering its typical stick–slip response.
Although the motors attached to the structure of the sliding block on the movable base do not directly influence the solid body of the pendulum, they effectively transmit vibrations, indirectly allowing for their detection. This phenomenon is clearly observed in the presented spectrograms.
Based on the numerical simulations of bifurcation dynamics presented in this work, it can be concluded that incorporating the dynamics of transmission and unbalanced systems into the model, even in an approximate manner, has a significant impact on the system’s dynamical behavior. These findings have important implications for the design, simulation, and control of mechatronic systems, highlighting the importance of considering the full system dynamics and the influence of varying excitation on structural vibration and the behavior of the entire system.
To the best of our knowledge, the investigated influence of structural vibrations on frictional contact with variable contact force has not been previously examined in experimental setups, and practical mathematical models incorporating this physical phenomenon are practically non-existent. This is mainly due to the immense difficulty in accurately modeling elastic frictional contact. One approach to capturing the system’s response to different excitations is by introducing an intentionally excited mechanism with a relatively high frequency and observing the system’s response through spectrograms under various conditions. One suggestion is to employ a self-excited oscillator coupled with the investigated system, albeit with a soft elastic characteristic, to detect the influence of structural vibrations.
It is demonstrated that even very small amplitudes and relatively fast repeating forcing significantly alter the frictional response of the observed stick–slip or creep–slip motion of bodies experiencing structural vibrations.
The impact of time-varying excitation on a 2-degree-of-freedom mechanical system’s dynamics is investigated. Both studied models exhibit similar behavior and comparable changes in their dynamical characteristics. However, the influence of the excitation frequency on the structure is clearly evident. The higher-frequency modes induced by motors, resulting in structural vibrations, notably affect the driven system’s dynamics.
Finally, experimental observations reveal that the nature of real mechanical contacts, experiencing sliding or creep–slip friction, undergoes changes when actual driving units are integrated into the machines. Incorporating such a phenomenon in numerical modeling poses significant challenges. However, by making certain assumptions, it may be possible to incorporate other sources of high-frequency vibrations and introduce noisy, non-smooth signals of external excitation.


