1. Introduction
The optoelectronics industry is constantly evolving, demanding increased precision in product accuracy. Precise positioning is crucial, especially in the production of μLEDs, where light-emitting components have shrunk to micrometer size [
1,
2,
3,
4]. Matrix transfer technology is necessary for precise μLED positioning, presenting challenges for both linear and angle positioning. Multidimensional precision positioning is essential for the advancement of high-tech industries. In the past, precision positioning systems used optical scales or encoders as feedback signals, and interferometers were used for error correction. While this method does improve accuracy, it is limited by the optical scales’ capabilities and the assembly abilities of the mechanism, making it unsuitable for today’s rapidly developing precision manufacturing industry.
The increasing demand for components in the optoelectronics industry, along with the decreasing size of these components, places a significant emphasis on the precision of transfer technology. Various methods have been developed to enhance parallelism detection in order to meet the standard for parallelism during transfer.
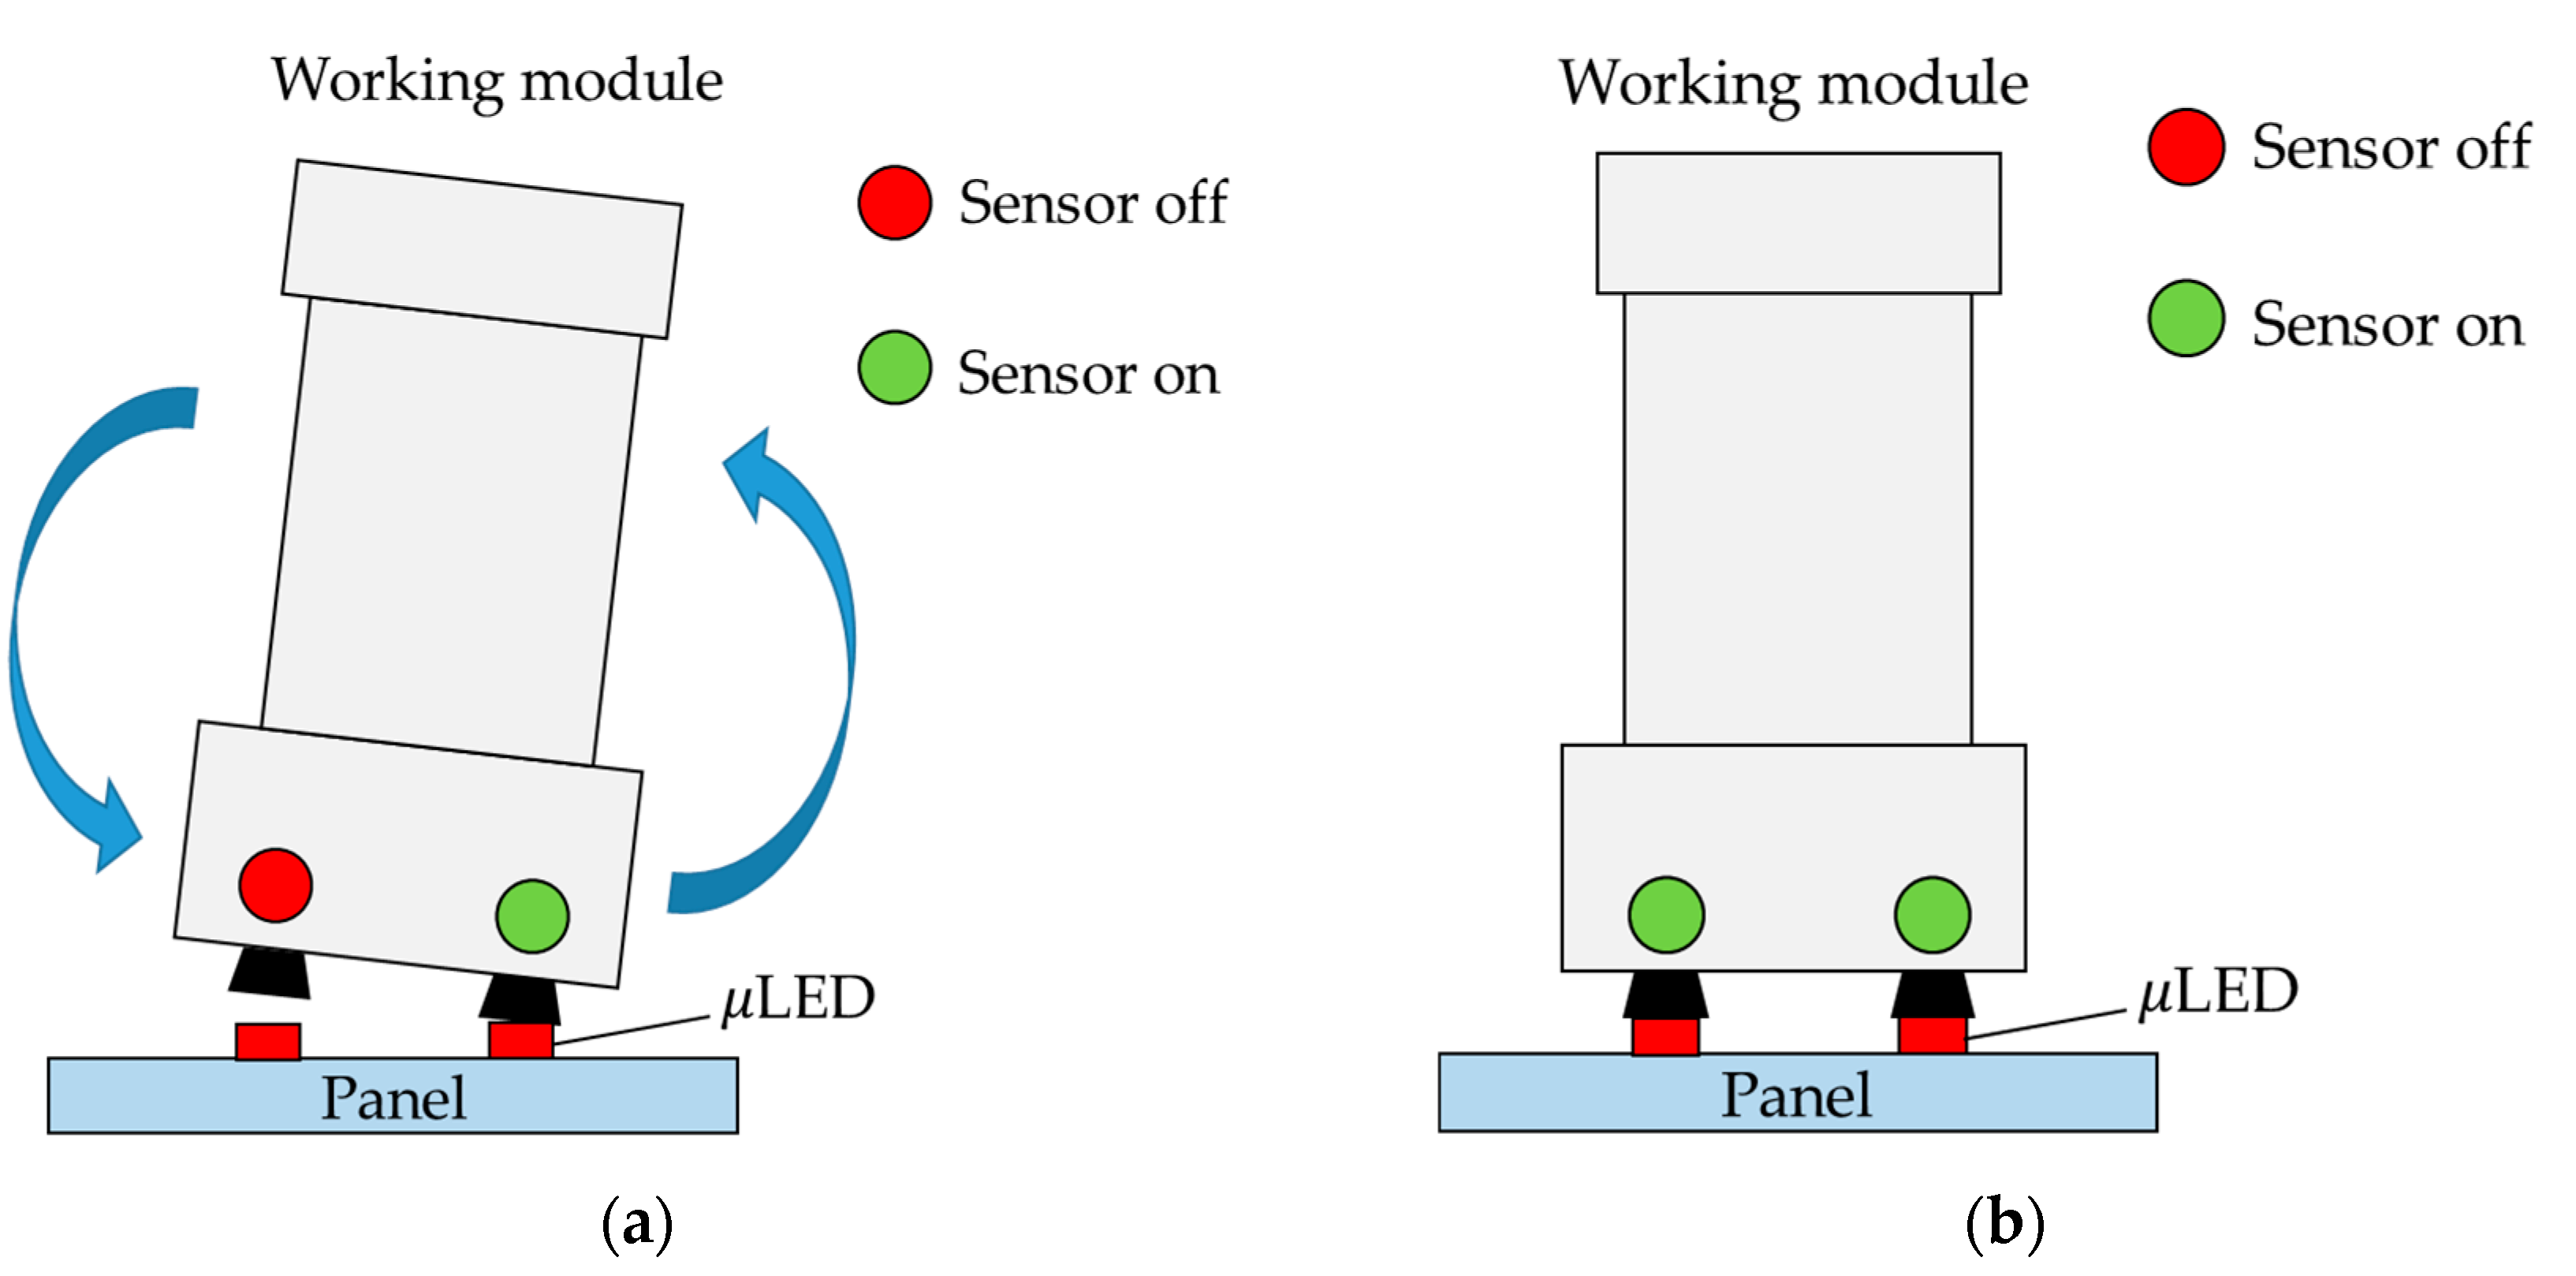
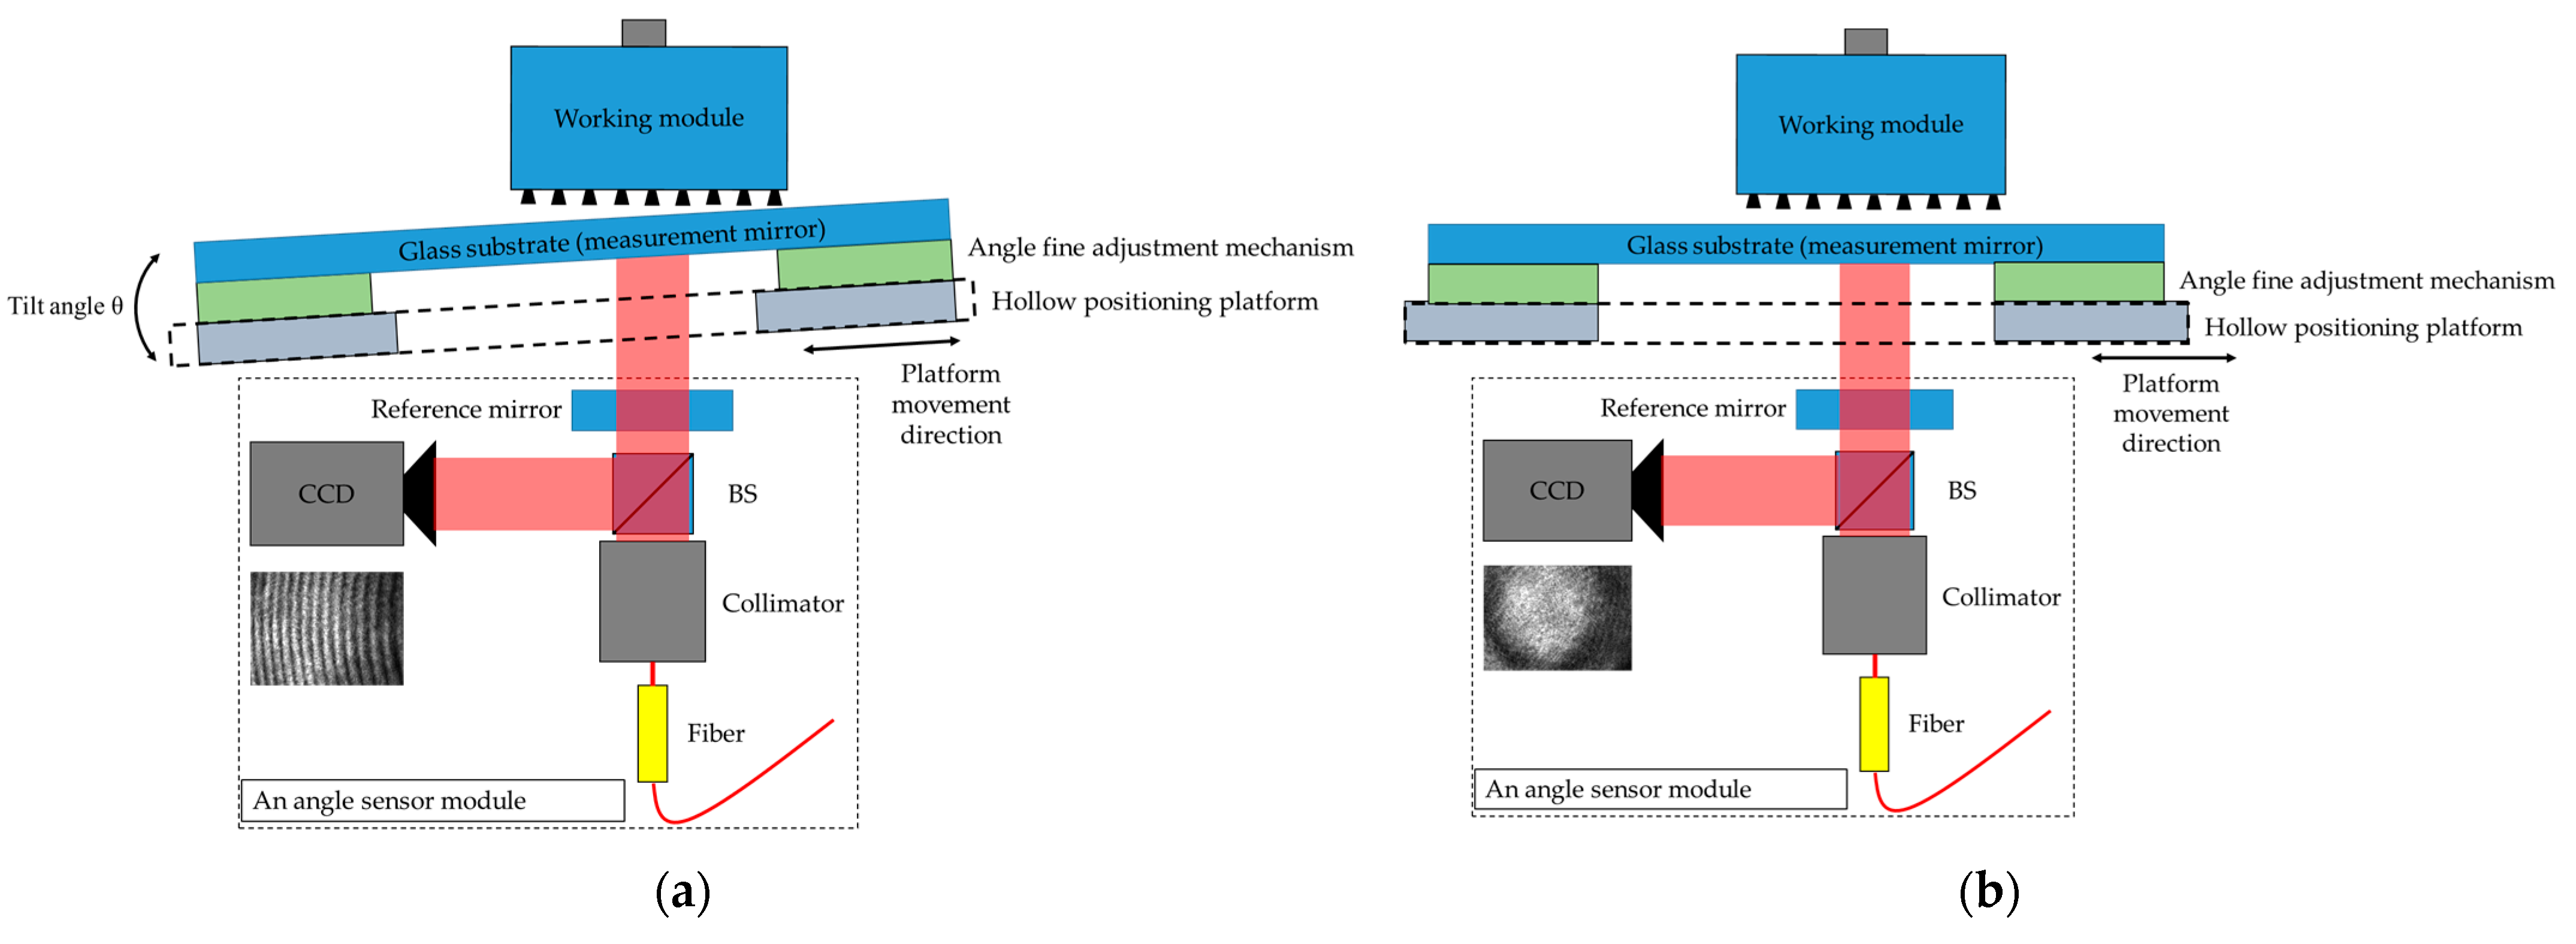
Figure 1 illustrates a contact-based transfer module, where the adjustment mechanism is triggered by a sensor to level the working module upon contact with the μLED, as depicted in
Figure 1a [
3]. Once the sensor of the working module establishes contact with the μLED on average, the transfer of the μLED can occur, as shown in
Figure 1b. However, the contact-based nature of this detection method is susceptible to causing damage to the μLED.
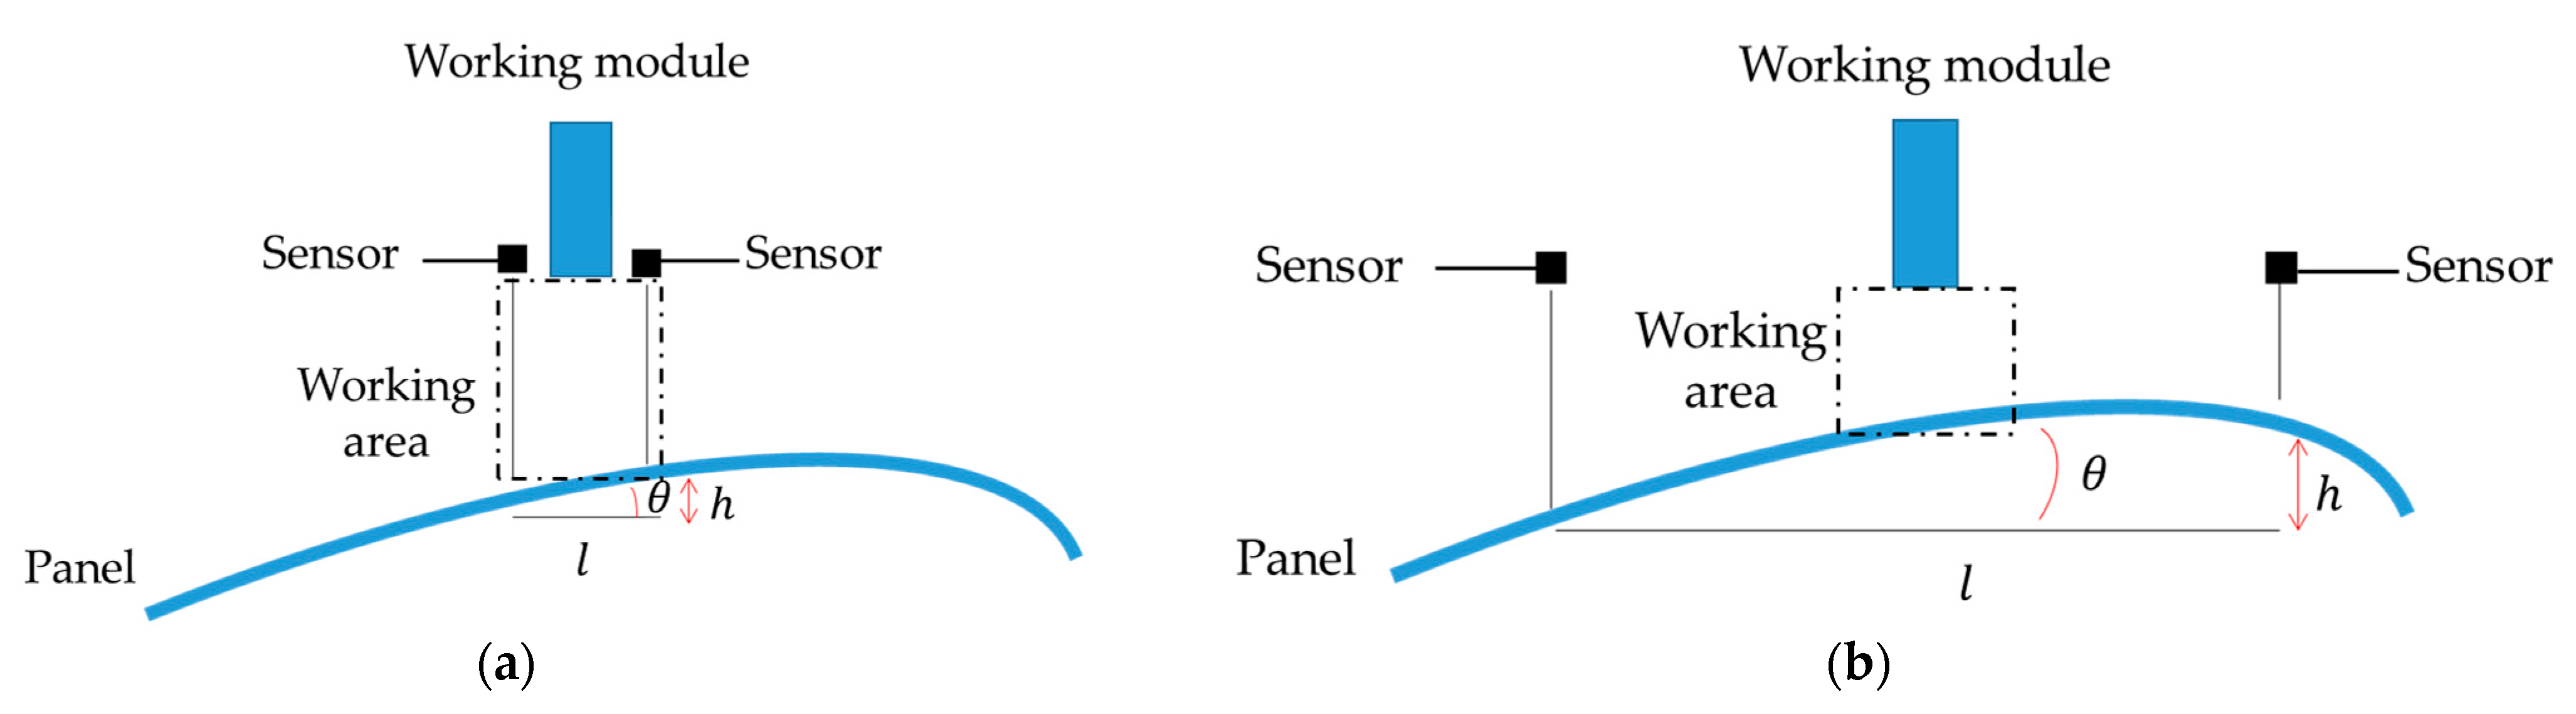
Figure 2 illustrates a noncontact detection method in which two sensors (such as laser interferometers or laser displacement sensors) are utilized to determine the angle of the panel. Equation (1) represents the formula for this method, with “
l” representing the distance between the two sensors, “
h” denoting the measurement deviation between the two sensors, and “
θ” indicating the tilt angle of the panel. The distance “
l” is a crucial parameter to the measurement resolution of the tilt angle “
θ”. The target panel is a thin glass plate, so the deformation is different in each location. When the sensing spots are located in the working area, the resolution of the tilt angle is rough, as depicted in
Figure 2a. If we want to enhance the resolution, the sensing spots will stay away from the working area, as demonstrated in
Figure 2b. It means we need to tradeoff between the resolution and the position certainty.
As a solution to achieve a noncontact method and precise parallel positioning, an improved active leveling retention system is imperative to meet the requirements of the industry. This study strives to develop a leveling retention mechanism for glass substrates that integrates machine learning with Fabry–Perot interferometry. By taking into account the optical structure, machine learning control, and feedback, the system enhances the current industry technologies for precise parallelism correction. By employing machine learning for training based on the interference image, this research successfully tackles the accuracy and sensitivity issues associated with traditional methods.
2. Materials and Methods
2.1. Fabry–Perot Interferometer (FPI)
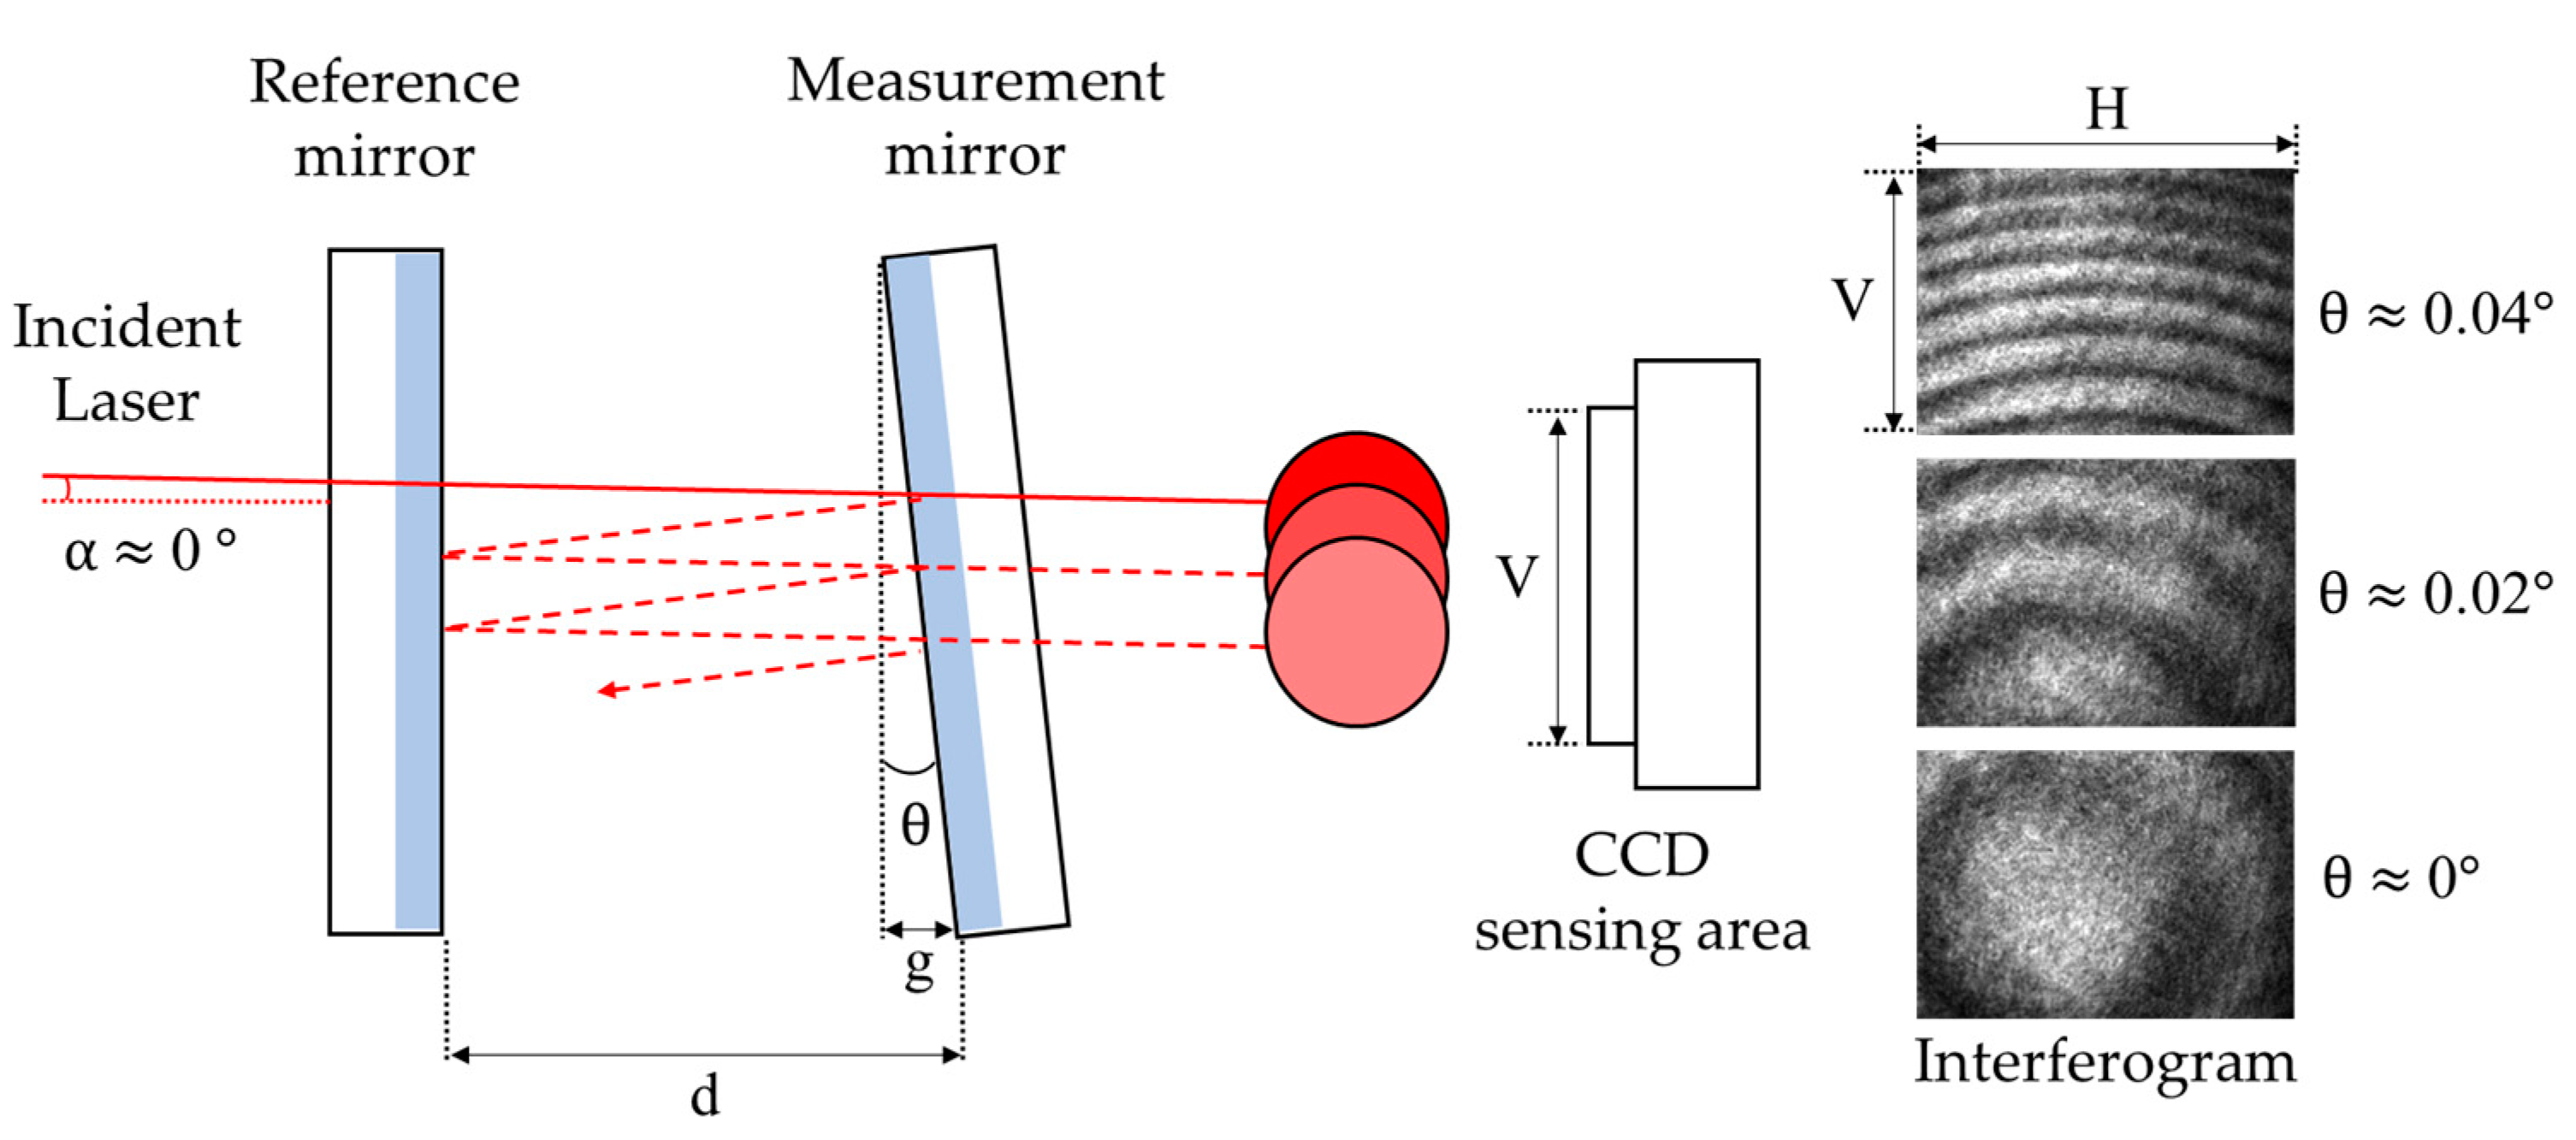
The Fabry–Perot interferometer (FPI) is a precise optical device that uses the principle of interference to analyze and manipulate light. It comprises two parallel plane mirrors forming an optical cavity, as illustrated in
Figure 3. The light is directed into the cavity and undergoes multiple reflections between the mirrors, leading to constructive and destructive interference. The interference pattern is observed as a series of bright and dark fringes, which are indicative of the parallelism of the resonant cavity [
5]. When the two mirrors in the FPI are more parallel to each other, the interference fringes exhibit better contrast and clarity. The density of interference fringe patterns is related to the divergence angle of the incident light beam. In this study, the incident angle “α” is approximately 0°. Consequently, the variation in the interference fringes allows us to measure and assess the parallelism of the resonant cavity with great accuracy [
6]. In the context of Fabry–Perot interferometry, using mirrors with high reflectivity is theoretically preferred to achieve finer fringe patterns [
7]. However, since the main objective of this study is to maintain the horizontal angular position of the substrate. The substrate is usually with low reflectivity, such as 10~20% reflectivity. For this reason, the two mirrors with 20% reflectivity are employed as the experiment’s optical cavity.
The number of interference fringes can be employed to calculate the angle and displacement of the plane mirrors, thereby enabling the determination of the parallelism of the resonant cavity, as demonstrated in
Figure 4. The density of interference fringes is directly proportional to the tilt angle. Equations (2) and (3) can accurately determine the degree of parallelism of the resonant cavity.
In this study, the measurement of displacements is carried out by detecting the changes in interference patterns generated by the resonant cavities. Based on
Figure 4, the distance between the resonant cavities is denoted by “
d”, and the
mth dark fringe is represented by “
m”. The laser light used in the study has a wavelength of 632.8 nm, indicated by the symbol “
λ”. The displacement of the measurement mirror is represented by “
g”, while “H” and “
V” denote the sensing range of the CCD, which are 4.845 mm and 3.615 mm, respectively. By multiplying the number of fringes by half the wavelength, the displacement of the measurement mirror “
g” can be obtained. Dividing the displacement by the sensing range of the CCD allows for the calculation of the “
θ”.
2.2. Machine Learning
The fundamental principles of machine learning include three main methods: supervised learning, unsupervised learning, and reinforcement learning. Supervised learning utilizes labeled data to train a model for making predictions or classifications [
8,
9]. Unsupervised learning explores unlabeled data to discover hidden structures and relationships [
10]. Reinforcement learning focuses on an agent learning through interactions with an environment to maximize cumulative rewards and make sequential decisions [
11].
This research conducted an experiment using supervised learning, specifically the classification algorithm, to develop a forecasting model for gathered interference patterns. Supervised learning entails utilizing a labeled dataset to construct a model capable of recognizing patterns and correlations between input and output information, yielding precise predictions when novel data are acquired. Classification is a form of the algorithm used in supervised learning to assign test data into distinct groups, such as identifying and categorizing specific information in a database to draw conclusions [
12,
13].
According to recent research studies [
14,
15], machine learning technologies are widely employed to process interferometric fringes or patterns. Furthermore, specific fields such as optics and biology are incorporating machine learning algorithms into their applications [
16,
17]. Previously, these applications relied on the manual determination of interferometric fringes or patterns. However, with the advent of machine learning technology, these applications can now be executed efficiently, paving the way for automation possibilities.
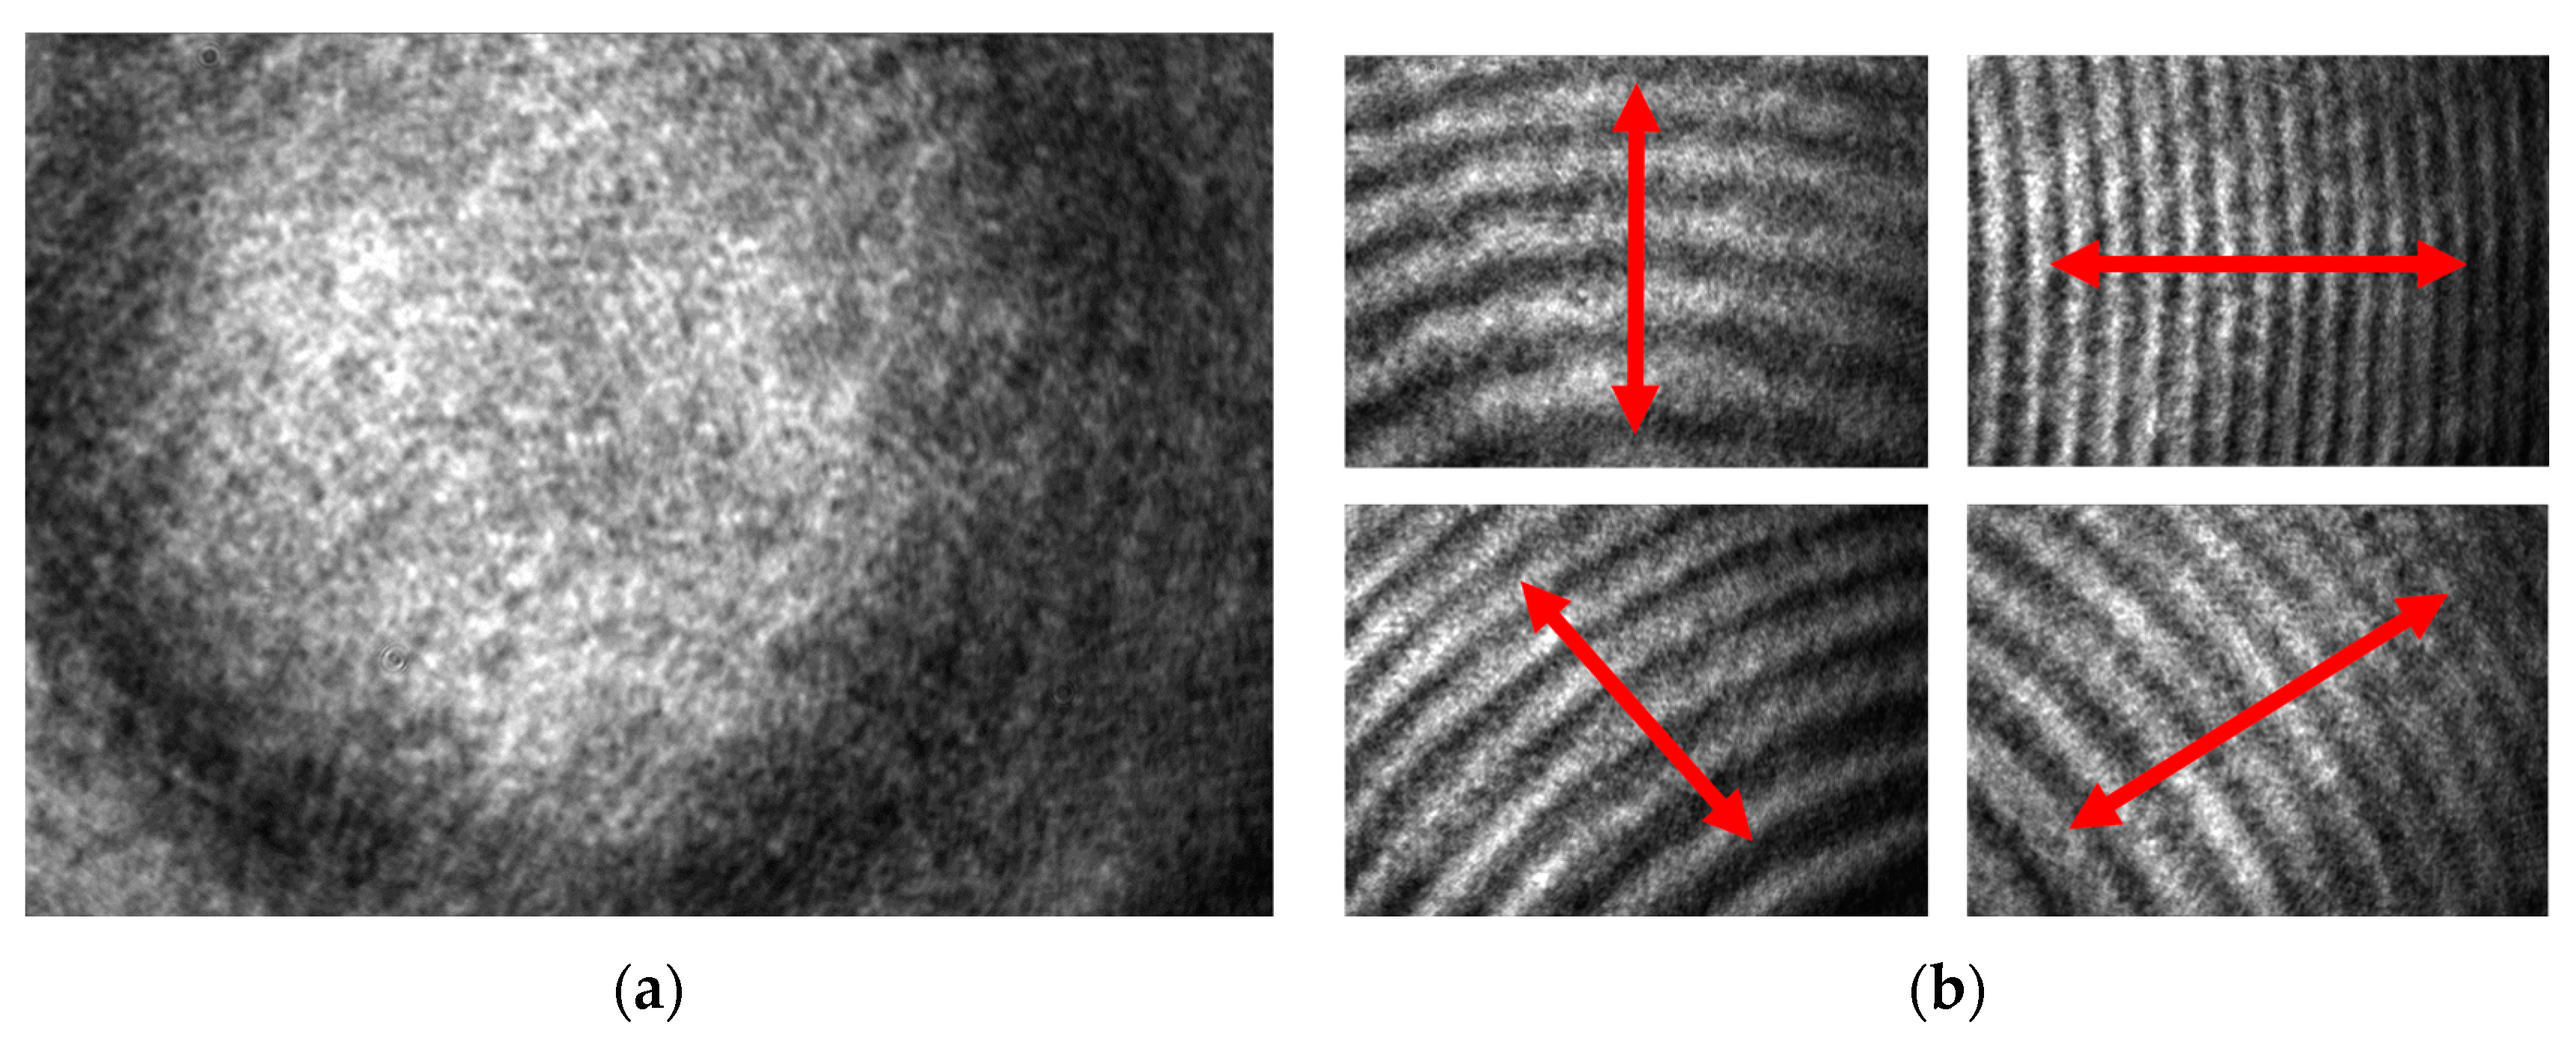
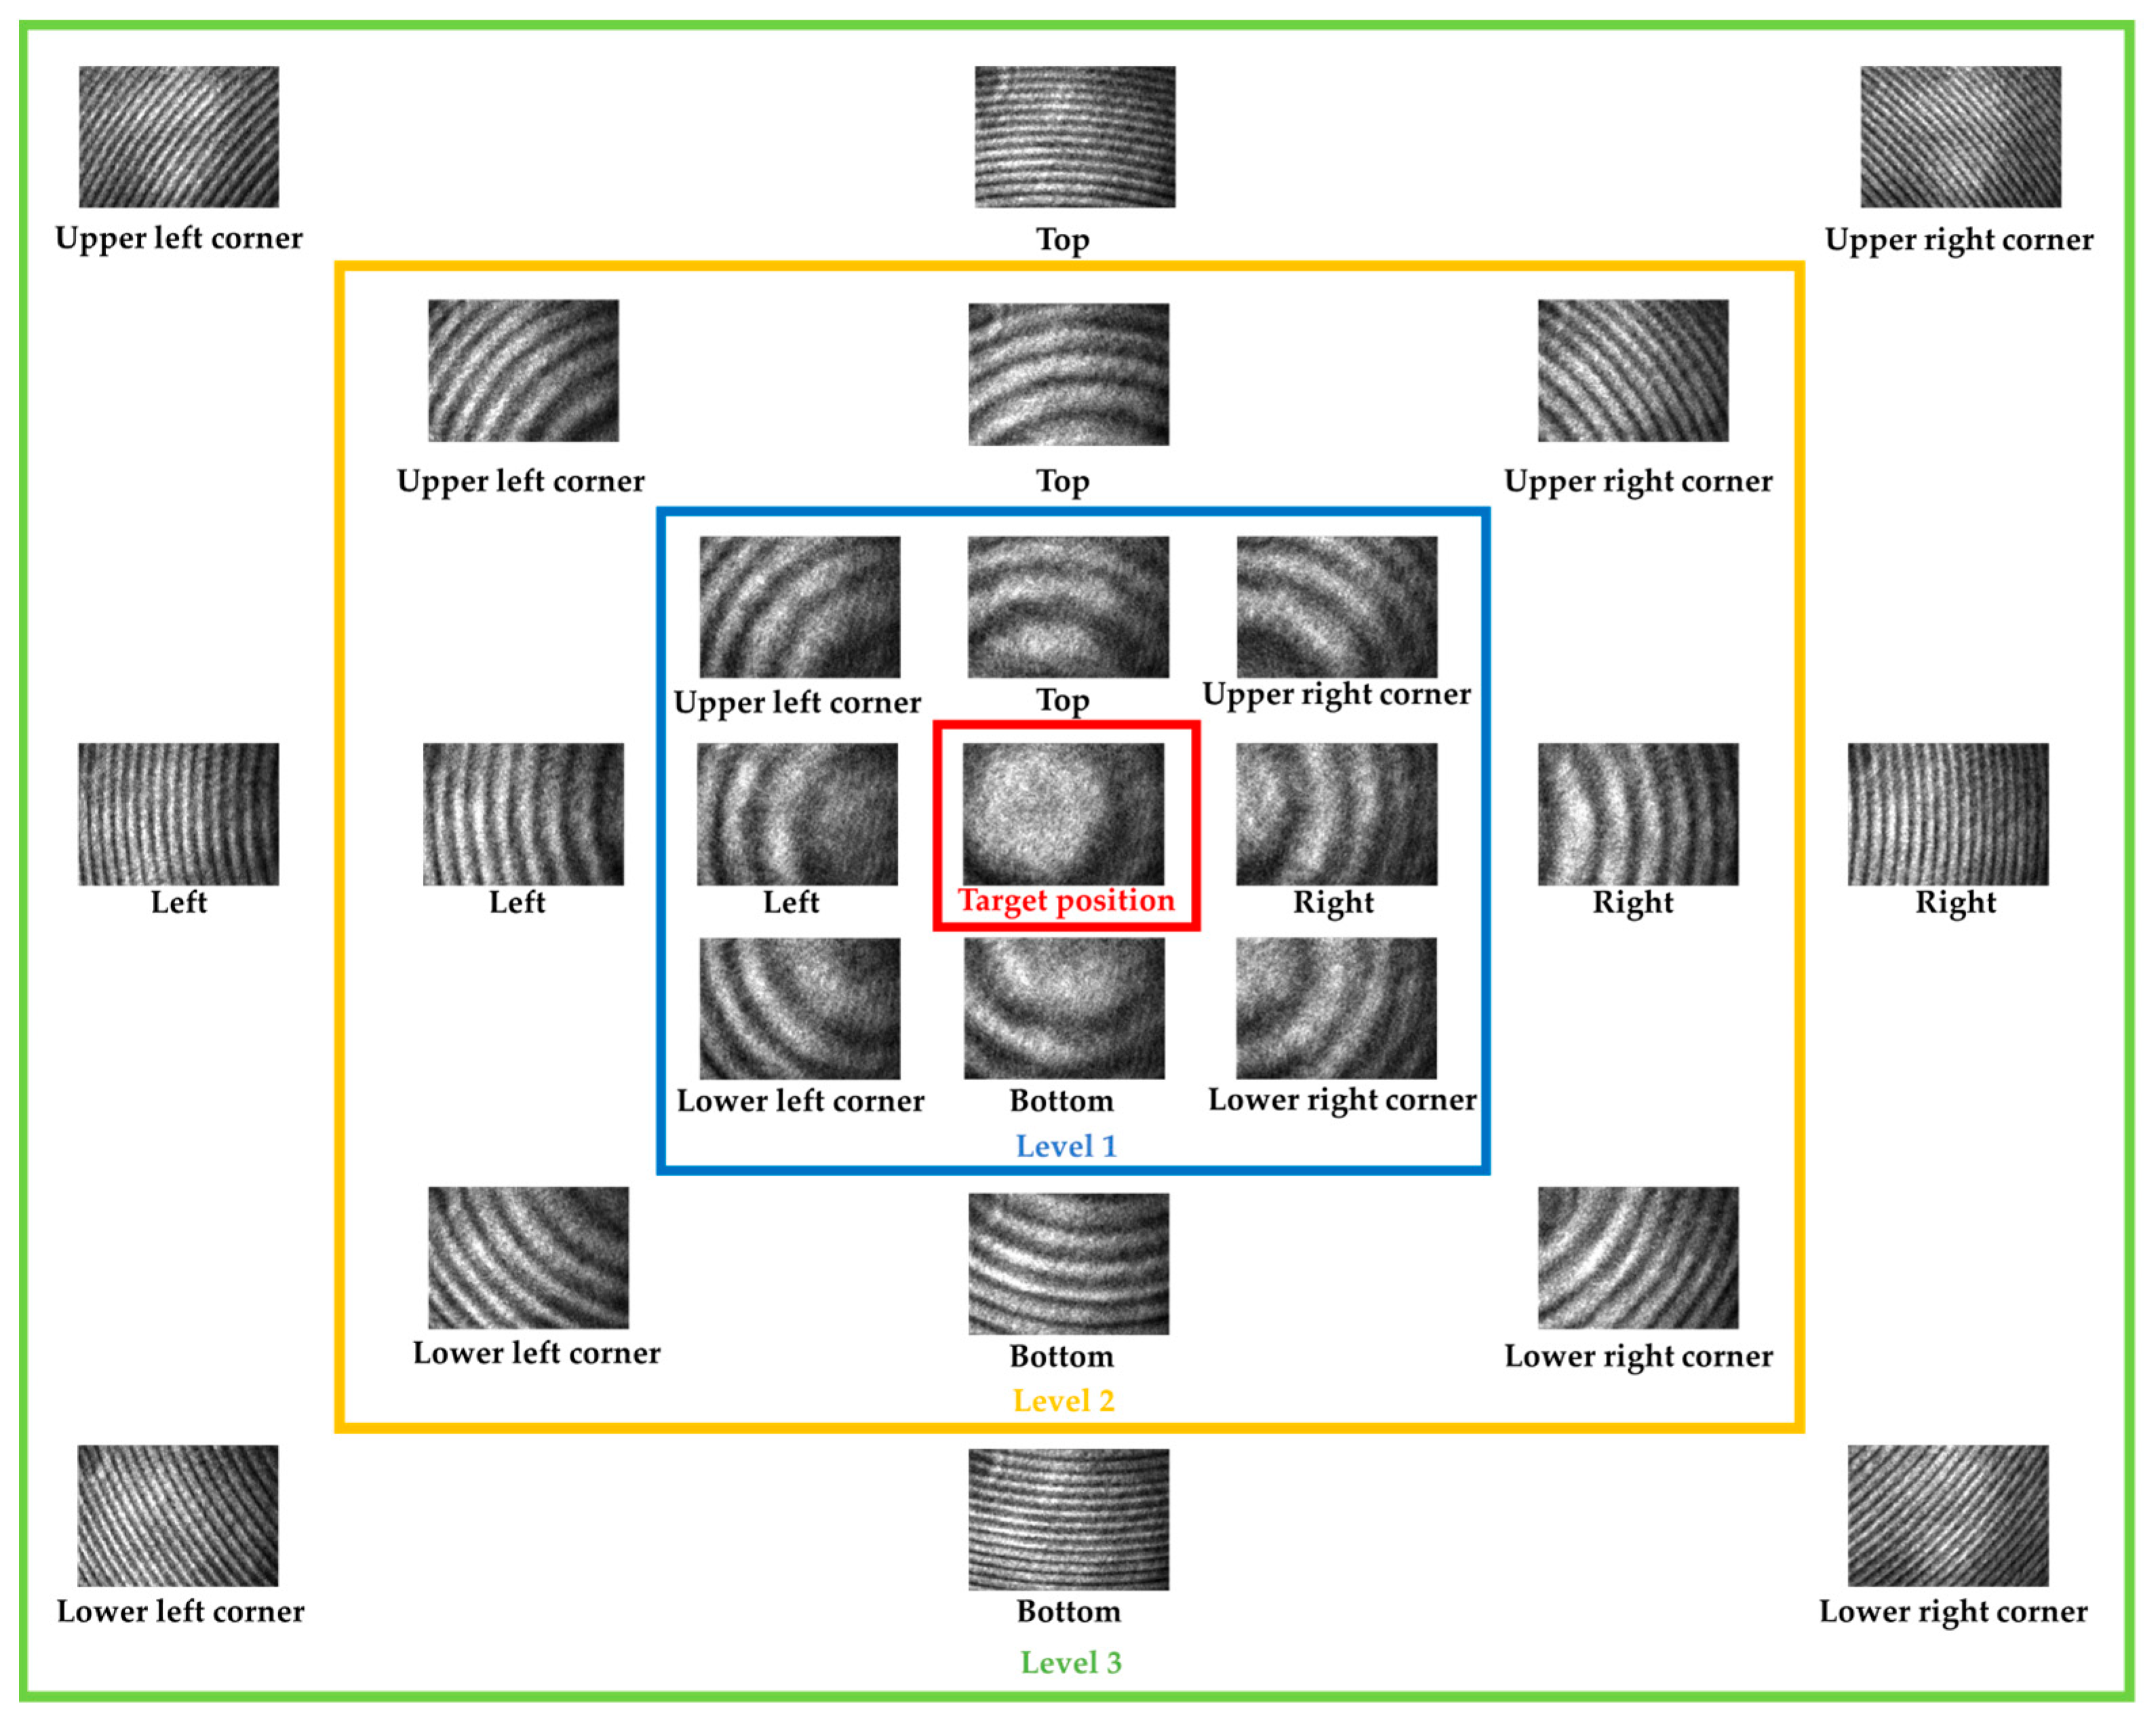
In this study, we applied this method to establish a database of interference fringe images. The database of fringe images is categorized into three levels: Level 1, Level 2, and Level 3, as shown in
Figure 5. There are about 100 training images in each location. When there is only Level 1 classification, the fringe patterns covered by the blue border are approximately 26.9 arc seconds to 282.9 arc seconds, resulting in lower resolution. To address this resolution issue, we introduced the Level 2 classification. This classification extends eight additional fringe patterns with different inclination angles beyond the Level 1 classification, indicated by the orange border. In this case, the angles of Level 1 patterns range from 26.9 arc seconds to 90.3 arc seconds, while the Level 2 patterns span 90.3 arc seconds to 282.9 arc seconds. The classification approach in Level 3 is similar to Level 2. It further extends eight distinct fringe patterns with varying inclination angles, enclosed by the green border, beyond the Level 2 patterns. The angles of Level 2 patterns range from 90.3 arc seconds to 144.4 arc seconds, while the Level 3 patterns range from 144.4 arc seconds to 282.9 arc seconds, resulting in higher resolution. This classification method involves learning the patterns of each level to identify and predict the inclination position of interference fringes, continuously adjusting the angles to the target position through iterative refinement. The correction magnitudes are constant, which is shown as follows: Level 1 about is 100 arc seconds, and Level 2 is about 200 arc seconds. Level 3 is about 400 arc seconds.
The neural network structure of the Inception v3 has gained widespread adoption in the realm of visual perception tasks and image processing applications, owing to its remarkable ability to capture intricate patterns and features, as evidenced by its outstanding performance in several studies [
18,
19]. In this research, we present a novel approach that leverages the power of Inception v3 to automatically detect interference fringes in images that are generated by FPI. Interference patterns are of utmost importance in various domains, such as precision measurement and sensing, where the precise recognition of these fringes is crucial for obtaining dependable information. In addition to Inception v3, there are other modules available for image recognition, including Inception v4, Xception, Residual Net, and many others [
20,
21]. These modules have been extensively utilized and validated, each with its own unique architecture and performance advantages. When selecting an image recognition module, consider your specific needs and application scenario to choose the most suitable one.
During the preliminary testing phase of the machine learning algorithm and database, the outcomes have been summarized in
Table 1. Out of the 6 testing interferometric patterns, the angular positions were accurately identified. This serves as compelling evidence that both the algorithm and the database meet the specific requirements of this research endeavor.
3. Development of Proposed Optical Mechanism
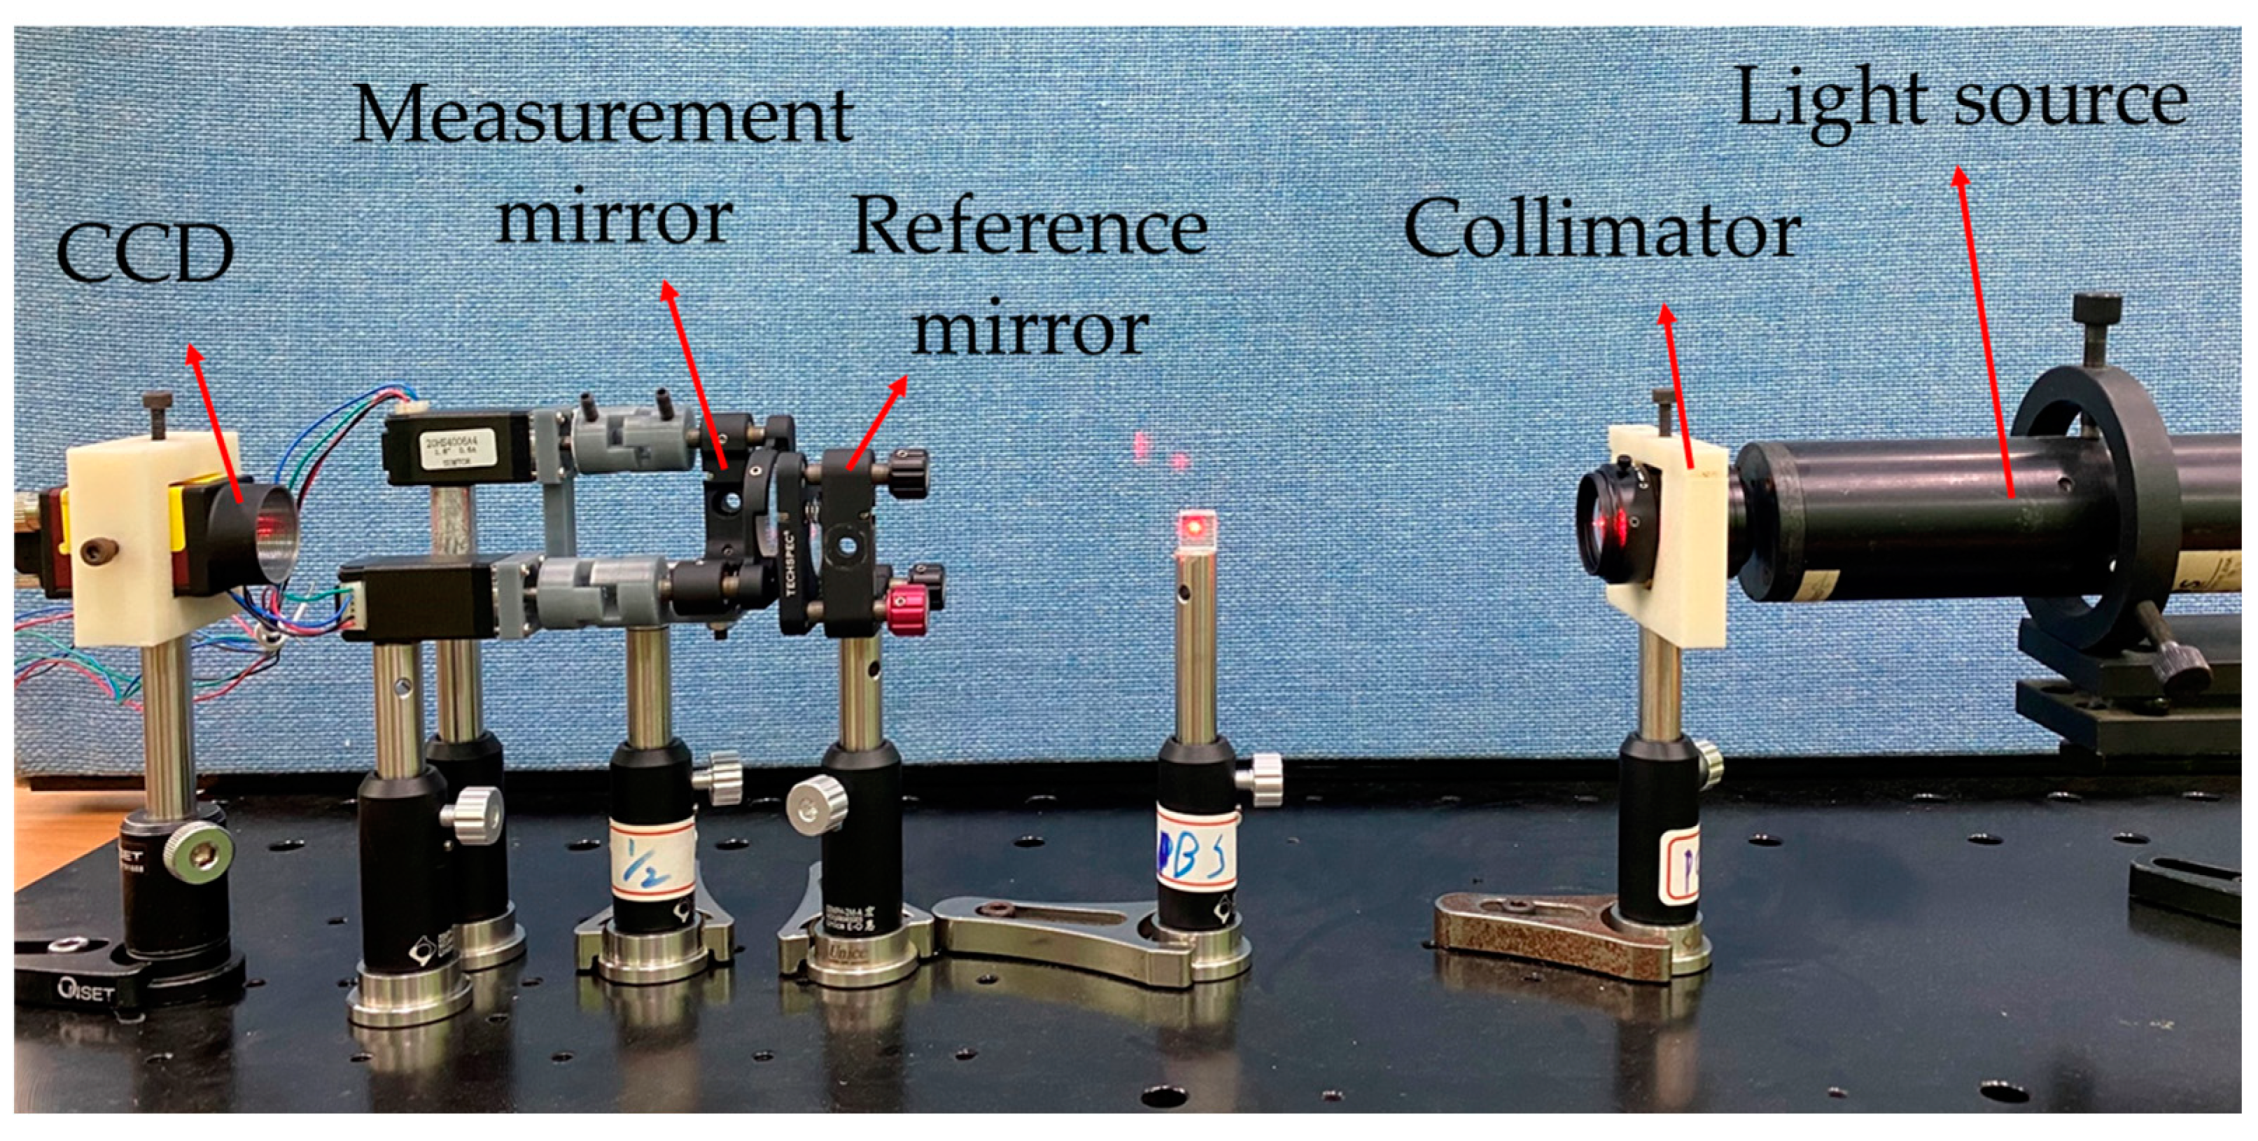
This study proposed an optical mechanism based on an FPI, as illustrated in
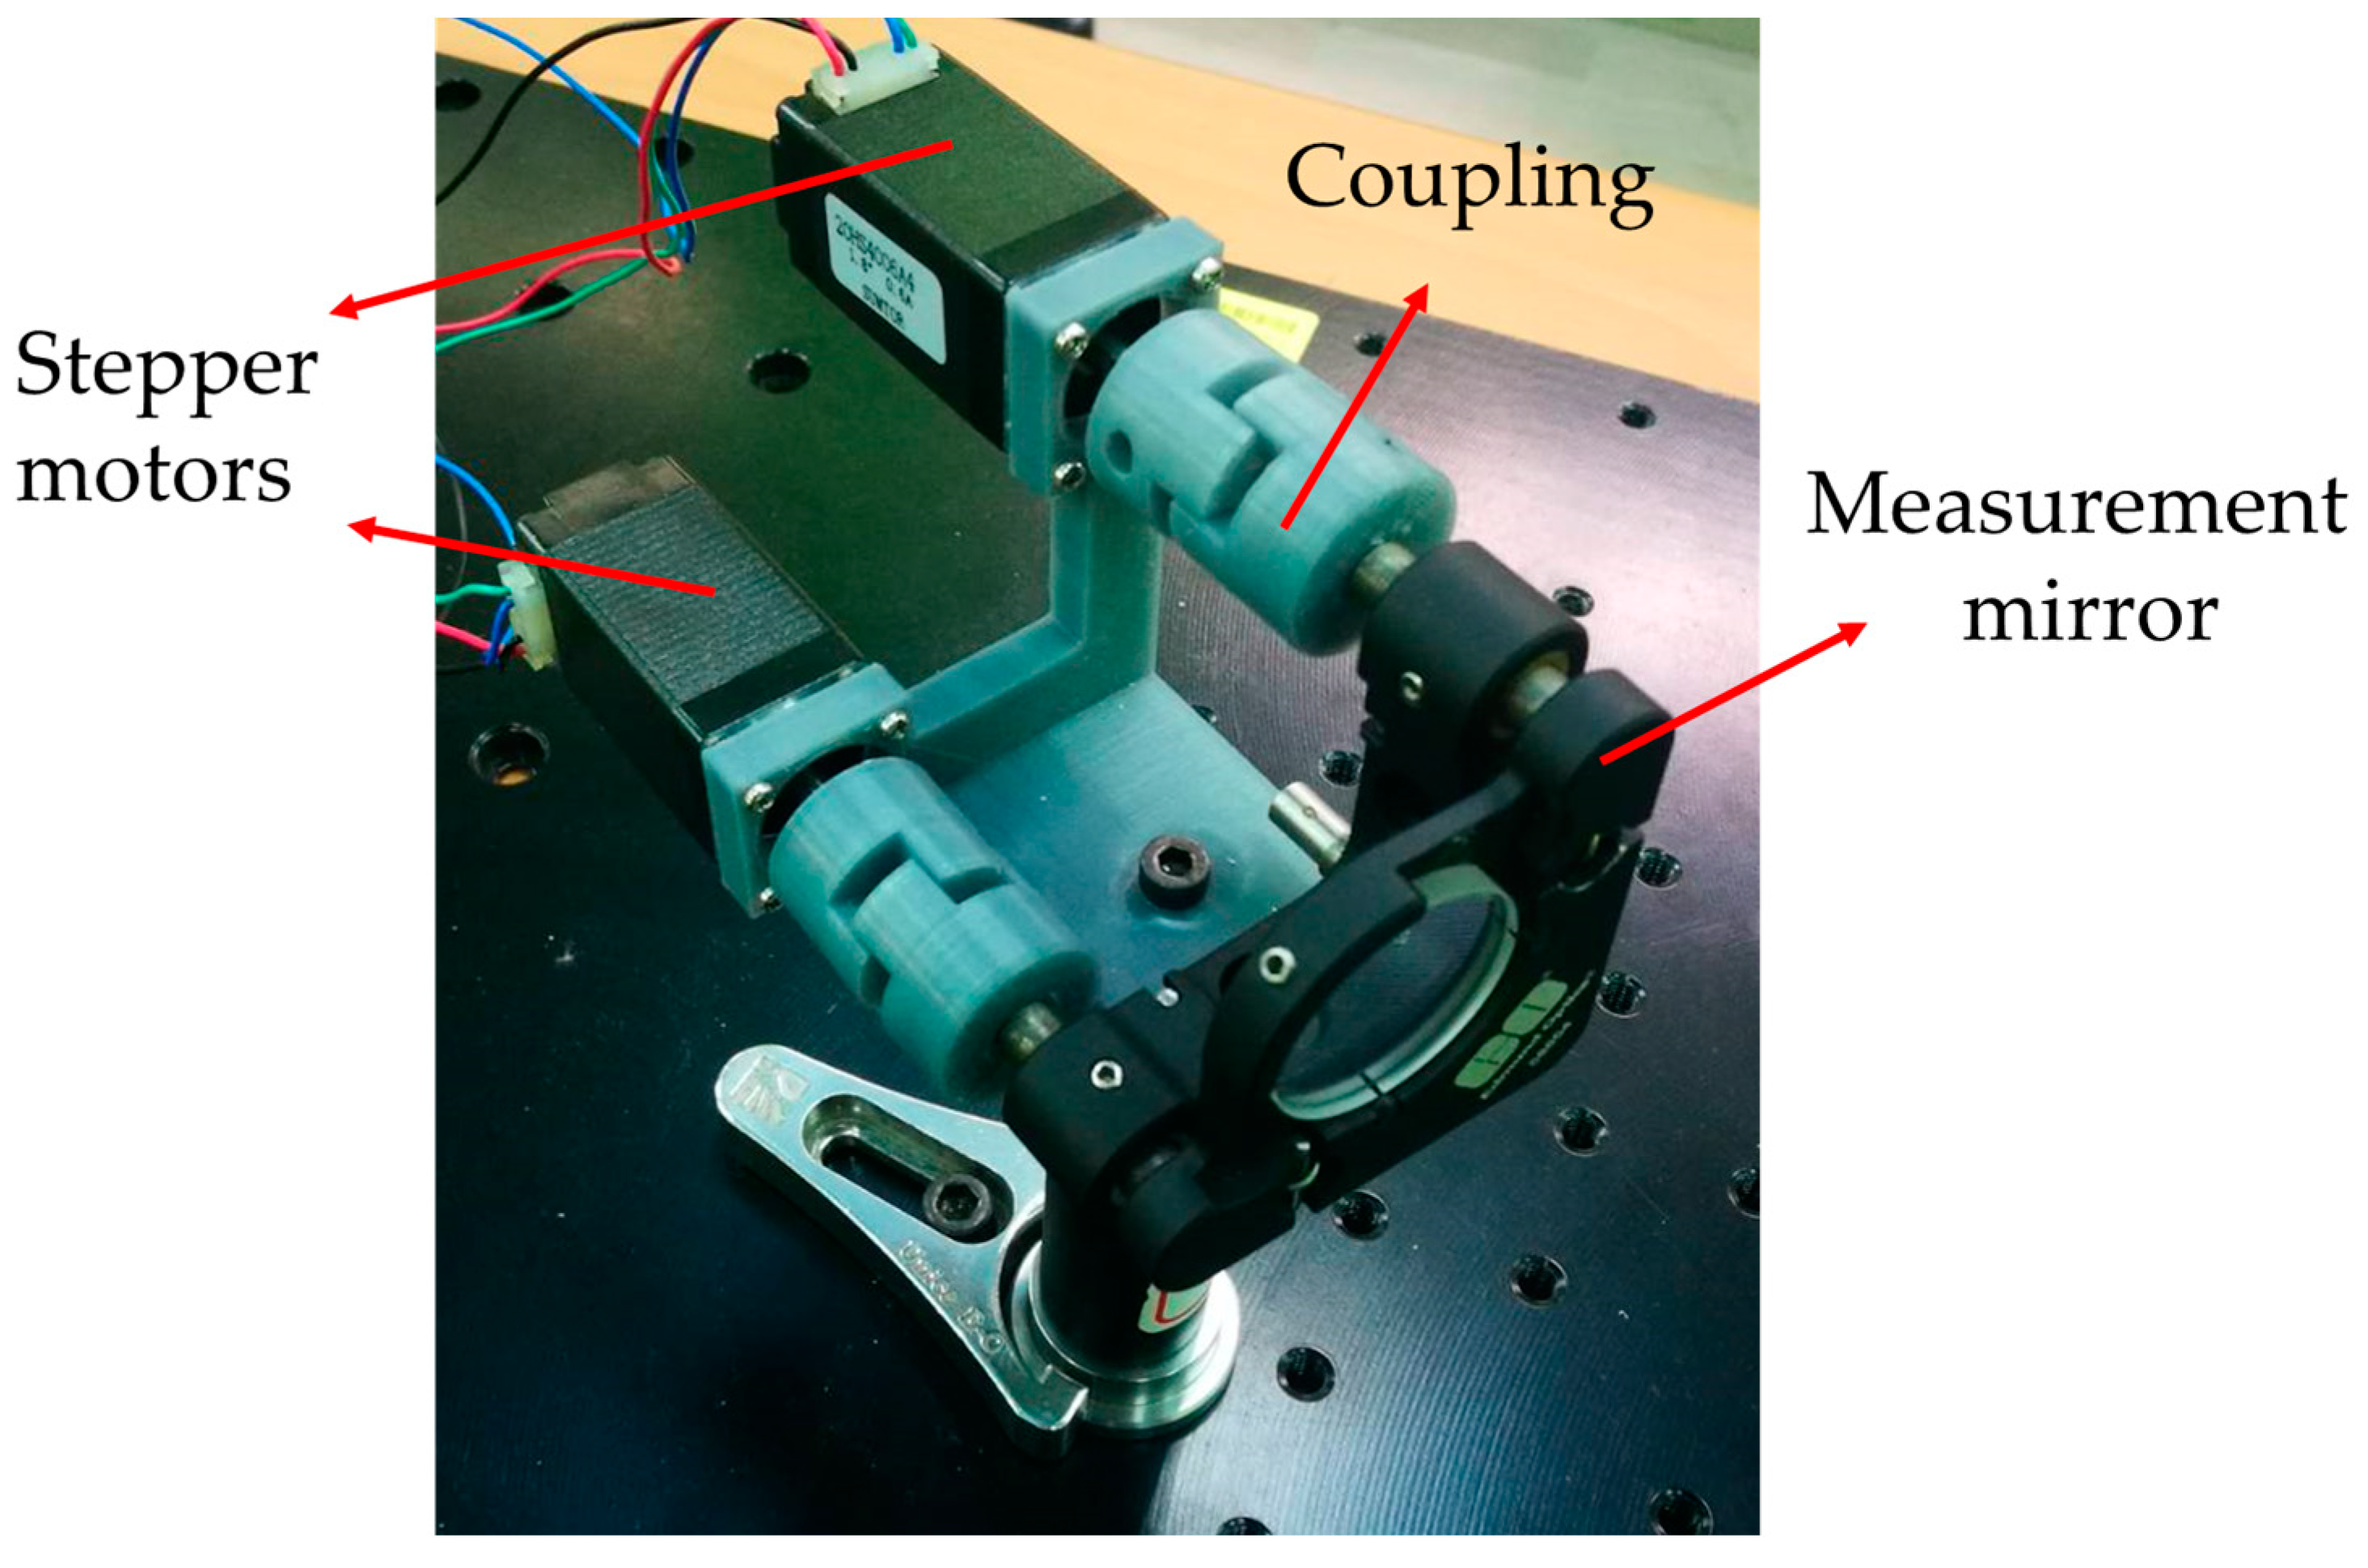
Figure 6. A laser light source is first collimated and then directed toward the pair of primary interferometer mirrors. The interference pattern is obtained by the CCD. To improve the performance of the interferometer, the two stepping motors with adjustable angles were integrated at the rear of the measurement mirror, as shown in
Figure 7. This allowed for the automatic correction of any deviations from perfect parallelism in the resonant cavity. After establishing the offset angle, the motors can be governed to fine-tune the pitch and yaw angles, ensuring accurate and stable interferometric measurements.
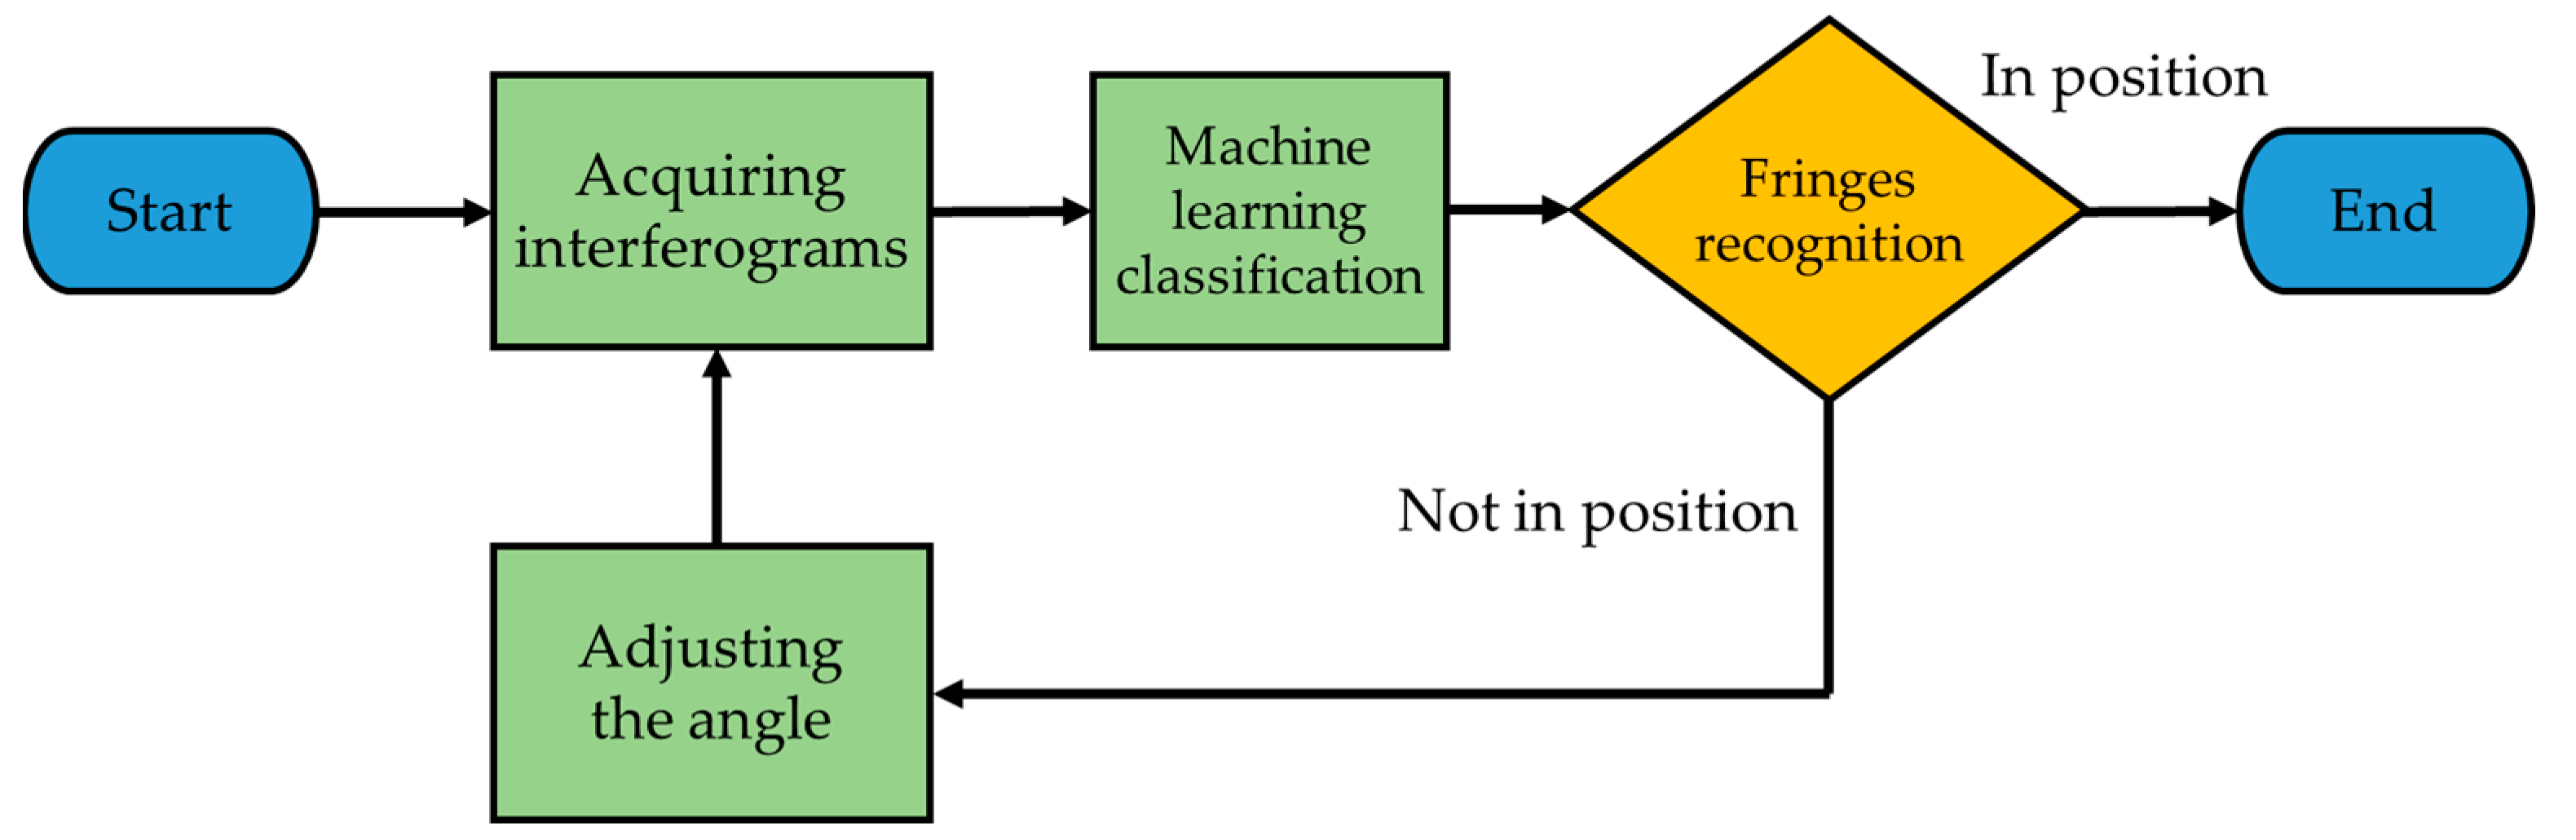
In this study, the experimental procedure involves several steps to detect changes in the parallelism of the resonant cavity. First, the current interference image is obtained, and then a machine learning-based detection mechanism is used to identify any shift in the parallelism. This mechanism accurately classifies the interference image and converts the recognition result into an angle that indicates the degree of shift. Once the angle is determined, the stepper motor is controlled to adjust the parallelism accordingly. After the adjustment is made, the interference image is obtained again to confirm that the parallelism has been restored. The entire experimental procedure is illustrated in
Figure 8, which shows the steps involved in detecting and correcting any shift in the parallelism of the resonant cavity. This approach is an effective method to maintain the stability of the resonant cavity and ensure accurate measurements in various scientific and engineering applications.
4. Experiment Result and Discussion
In this study, various experiments were conducted using Level 1, Level 2, and Level 3 classifications to identify and correct any shift in the parallelism of the resonant cavity. The experiments involved randomly adjusting the resonance cavity angle and using a machine learning algorithm to determine the type of interference fringe patterns. The stepping motors were regulated to rectify the angular deviation, and the corrective procedure was iterated until the determined outcome reached the target position.
Figure 9,
Figure 10,
Figure 11 and
Figure 12 show the experimental results for the Level 1, Level 2, and Level 3 classifications.
The outcome of the Level 1 classification demonstrates that the segmentation of angular deviations is inadequate. The correction step of each segmentation is pre-determined, and if it is set too small, it will require numerous correction steps to reach the target angular position. Conversely, if the correction step is excessively large, it will fail to converge to a stable target angular position. Consequently, the results of the Level 1 classification experiment are not included in the following discussion.
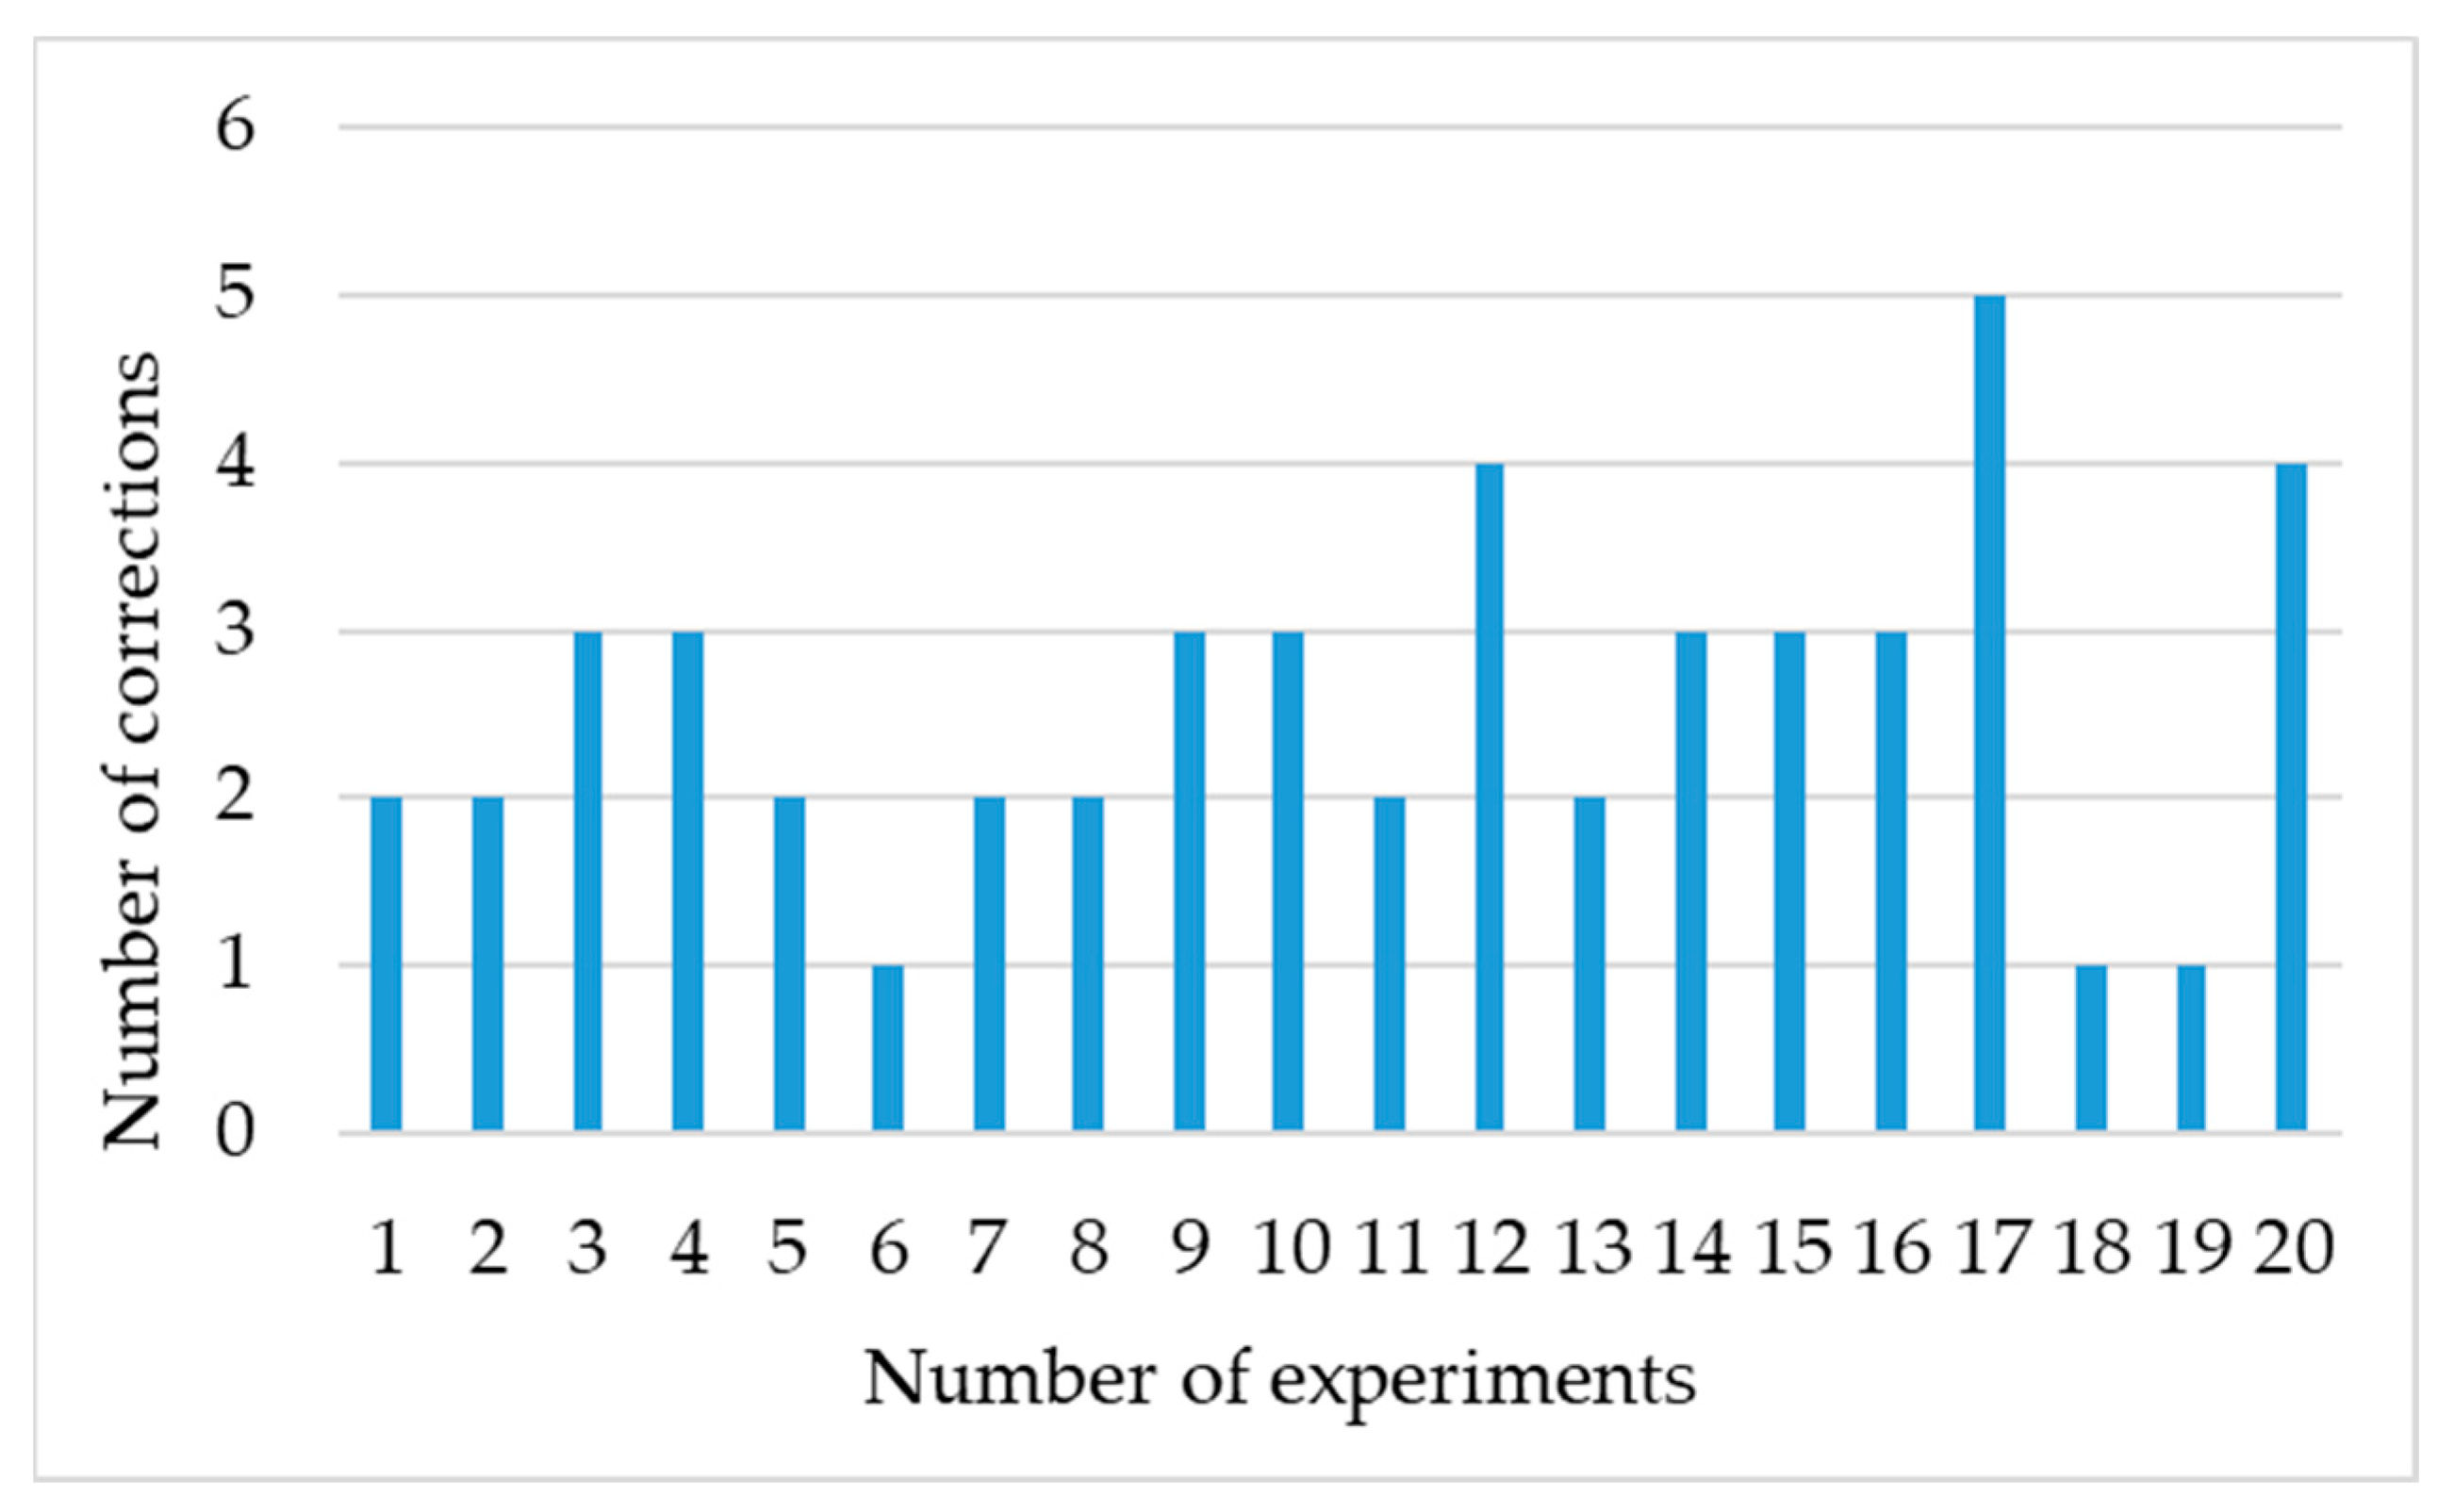
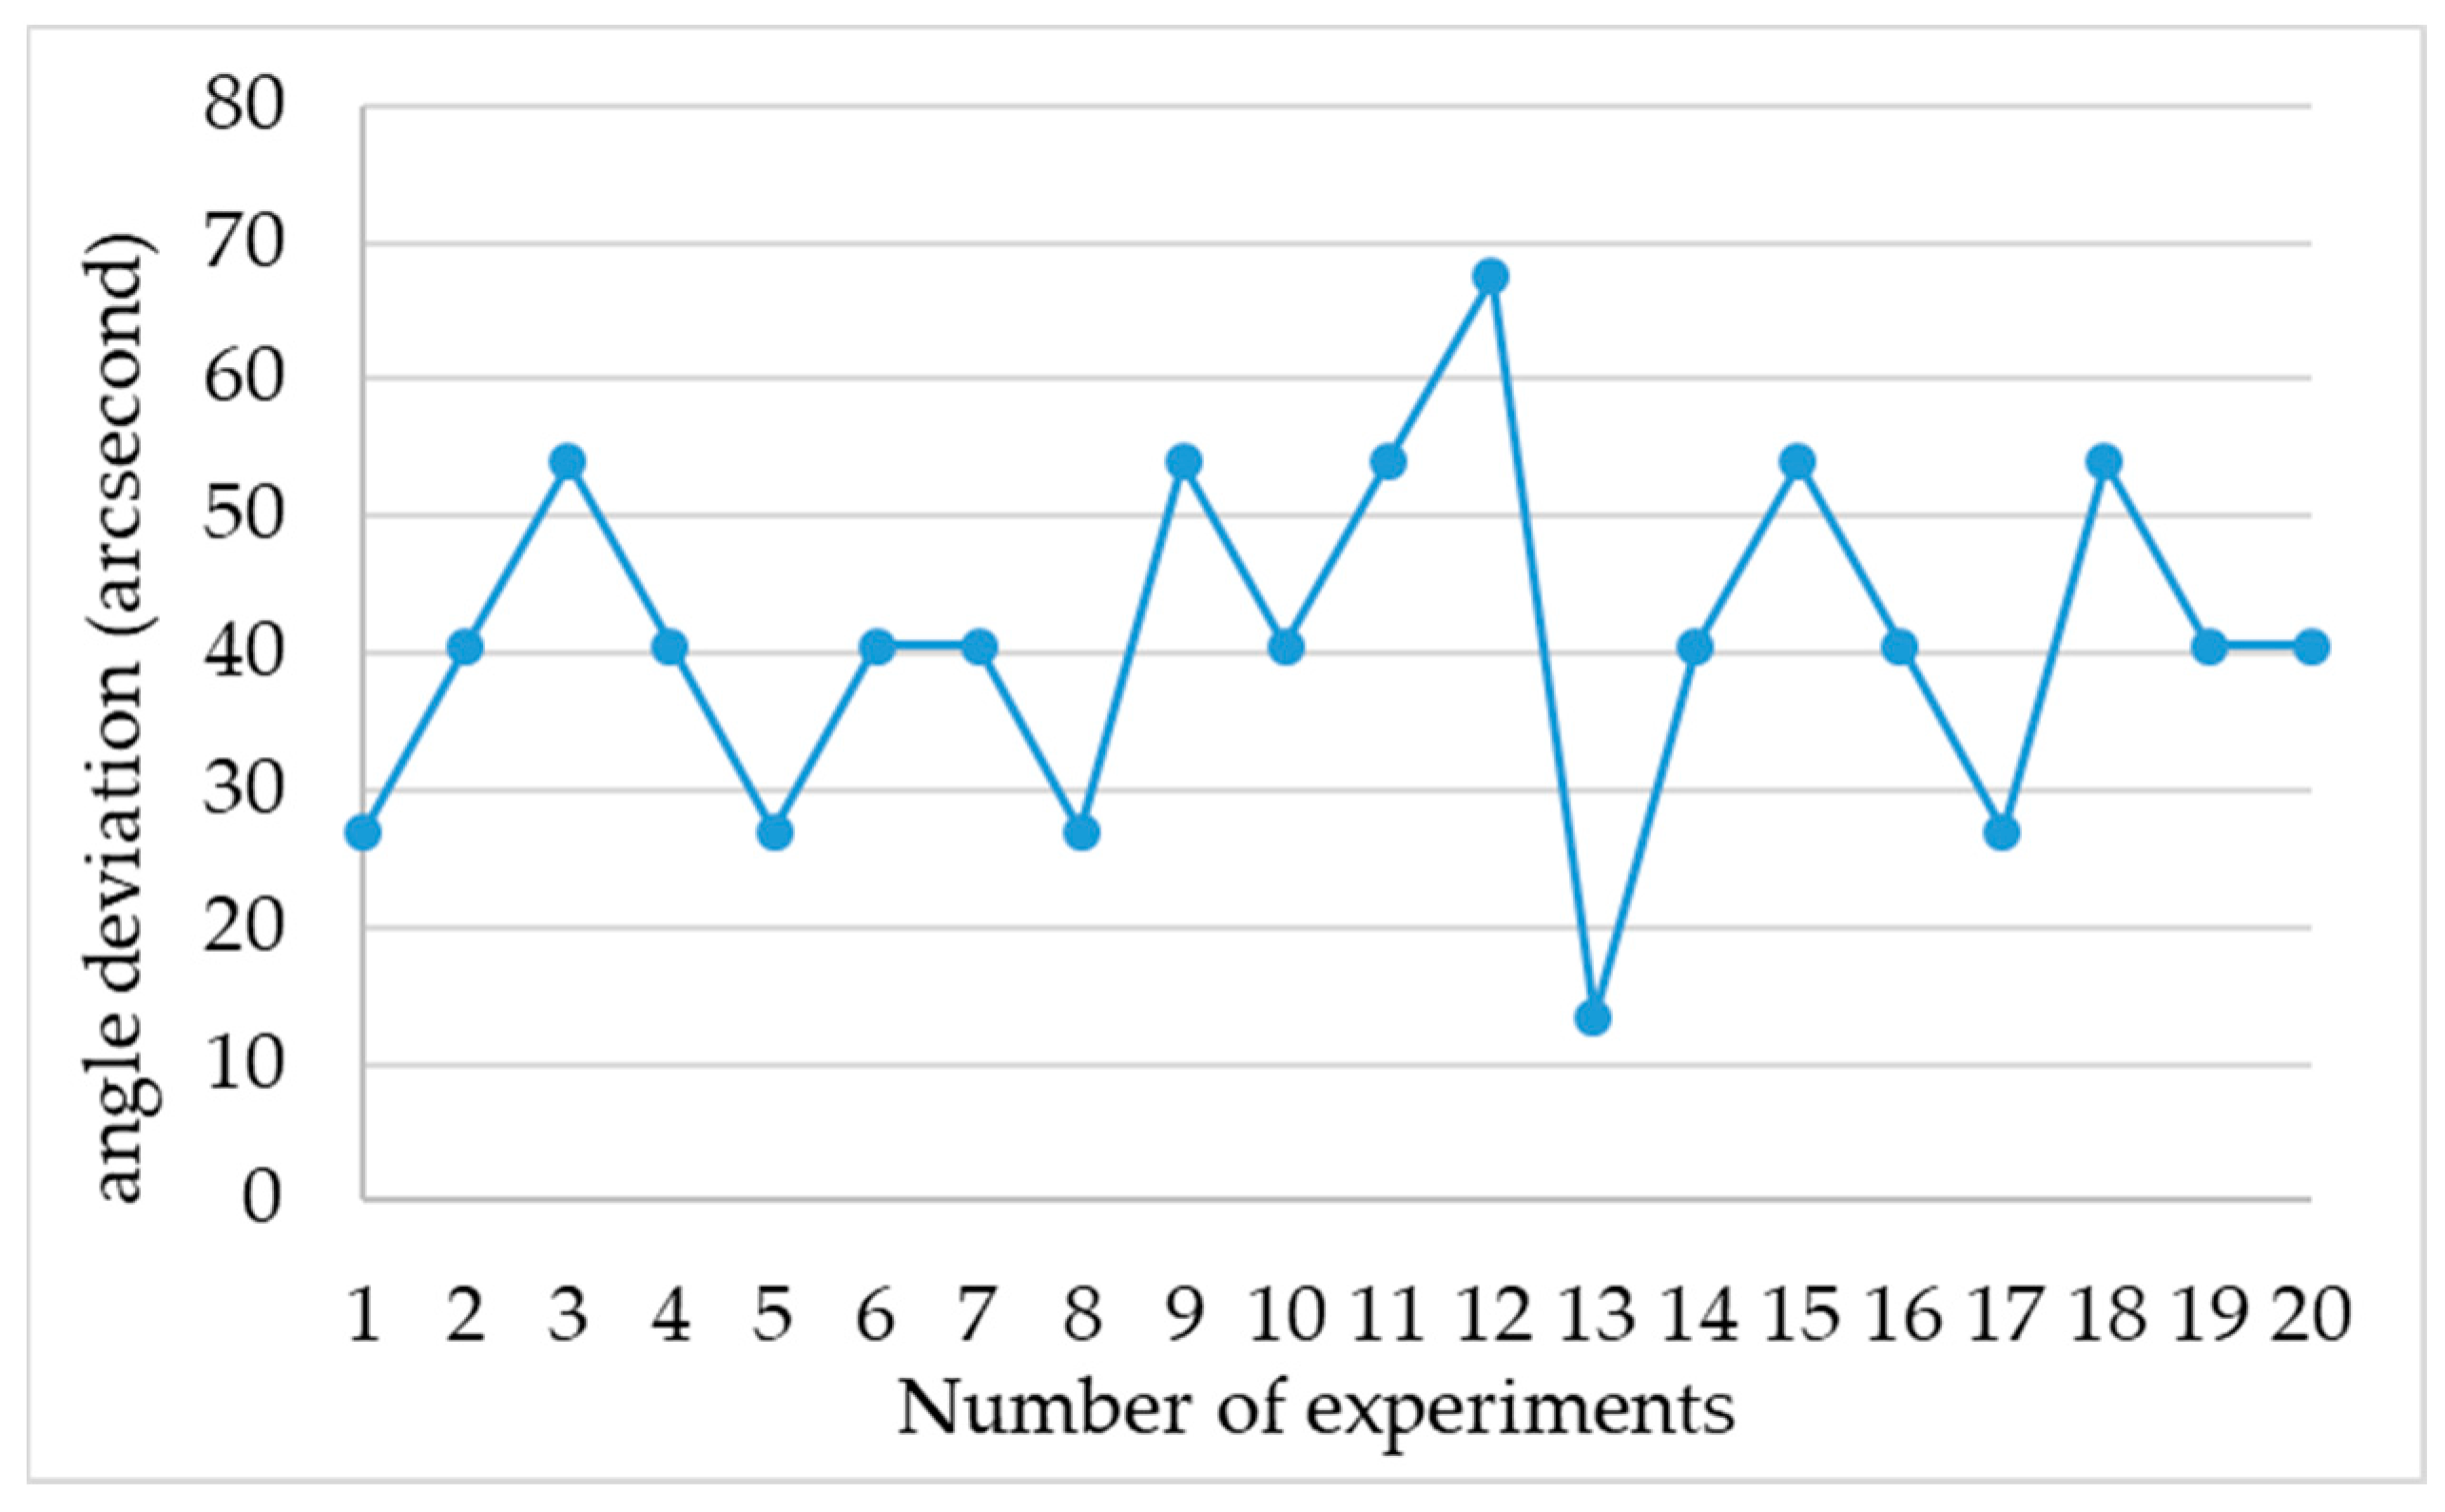
Table 2 presents the experimental results for the Level 2 classification showing that, on average, 2.55 adjustment times were adequate to re-establish the parallelism of the resonant cavity, as illustrated in
Figure 9. The average parallelism error was 41.18 arc seconds, as shown in
Figure 10. Additionally, the post-correction error demonstrated a standard deviation of approximately 12.43 arc seconds. These results demonstrate the effectiveness of the proposed method in accurately detecting and correcting any shift in the parallelism of the resonant cavity, which can help improve the accuracy and stability of various scientific and engineering applications that rely on precise measurements.
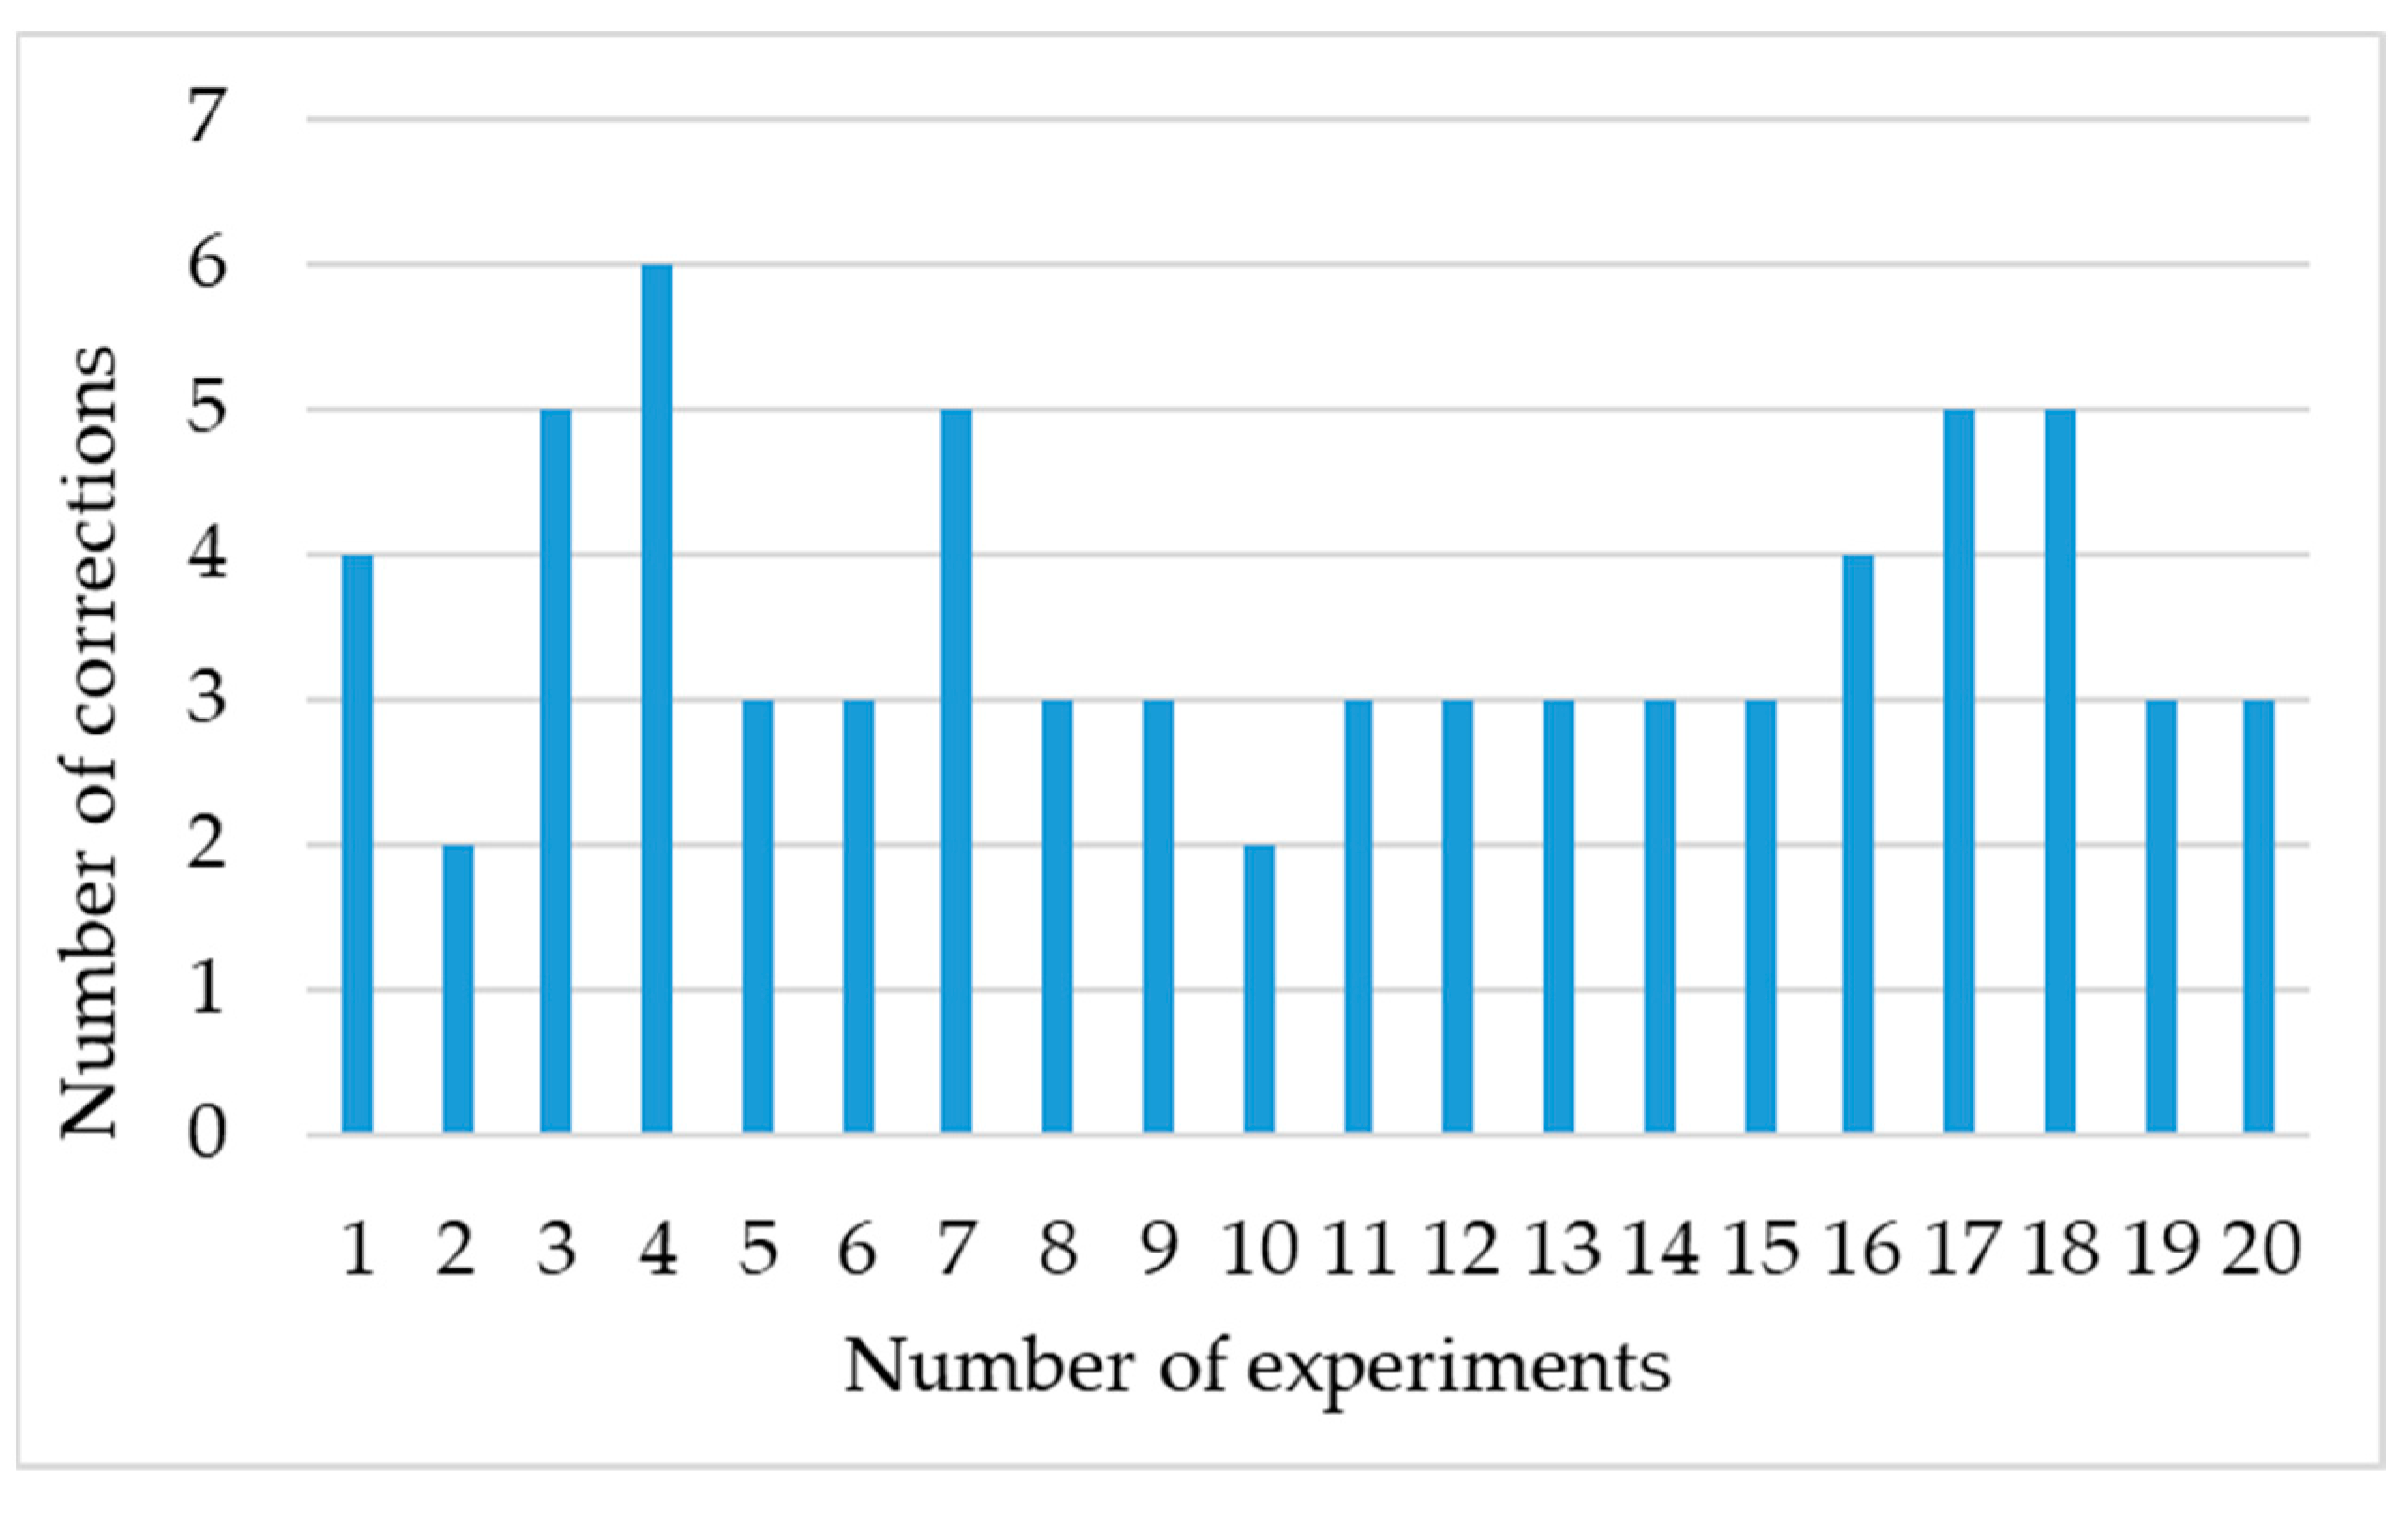
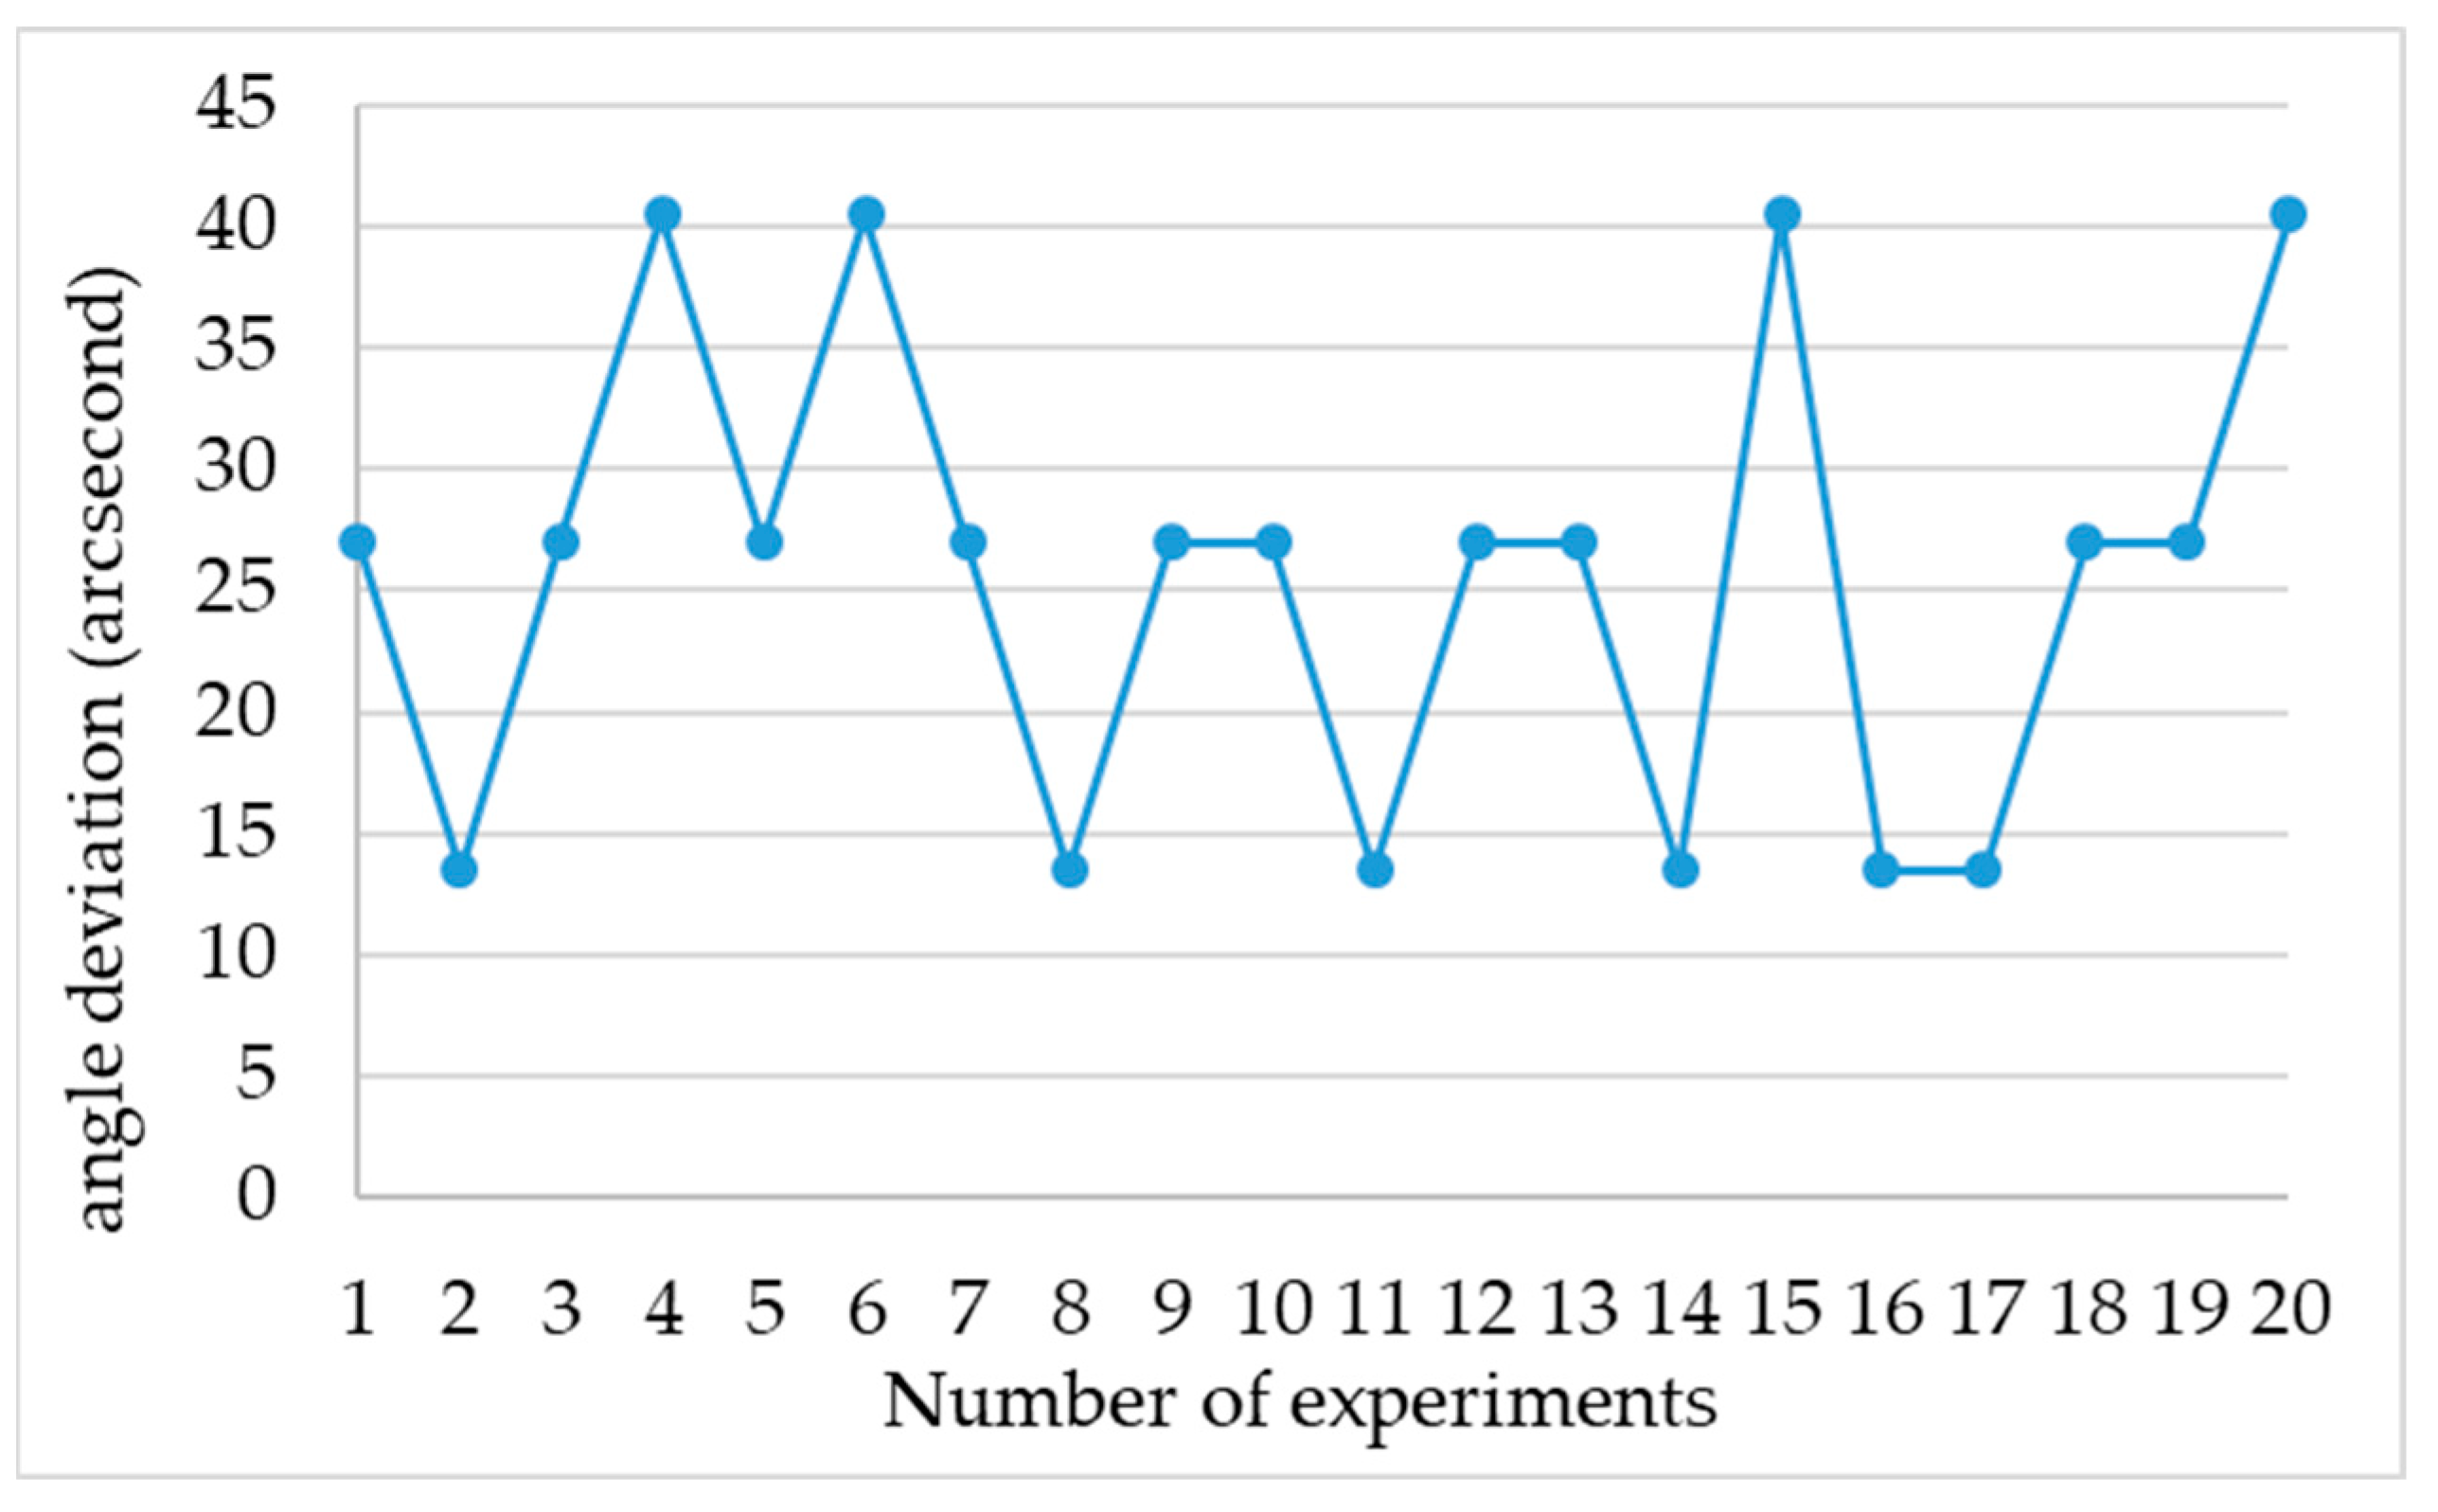
The results of the experiment for the Level 3 classification are presented in
Table 3. According to the experimental data, the resonator cavity’s parallelism could be adjusted with an average of 3.55 corrections (as shown in
Figure 11). The average angle deviation was found to be 25.65 arc seconds, as illustrated in
Figure 12. After applying corrections, the standard deviation of the error was reduced to approximately 9.45 arc seconds.
It is important to note that the resonator cavity’s parallelism plays a crucial role in its performance. Therefore, the small standard deviation of the error suggests that the proposed method is highly effective in correcting the parallelism of the resonator cavity. These results demonstrate the feasibility and reliability of our experimental setup for Level 3 classification. This method can be applied to various resonator cavity systems, making it a versatile and useful tool for researchers and engineers in the field of photonics.
The concept’s application is illustrated in
Figure 13. Maintaining the posture between the target substrate and the working module is a critical issue in precision mechanical engineering and the semiconductor industry during the manufacturing process. The guiding system’s tolerance of the positioning stage causes each target position to have a specific angular posture, which increases the product’s defective rate. The proposed system is designed to maintain the angular posture, particularly in positioning applications. The experimental results demonstrate the high potential of this method in posture maintenance for these industries.
5. Conclusions
In order to ensure glass substrate leveling maintenance, this experiment has developed a method that combines machine learning algorithms and sensing technologies. This method is designed to accurately detect and maintain the flatness of glass substrates during various manufacturing processes, ensuring that the final products meet the highest standards of quality and precision. The method proposed in this study not only mitigates the risk of damage from contact with μLED but also effectively addresses the challenge of limited resolution caused by sensor distance. This study utilizes machine learning to improve the precision of an interferometer system, achieving a resolution of 13.5 arc seconds. The experimental results show that the system can restore parallelism with an average correction error of 41.18 arc seconds and a standard deviation of approximately 12.43 arc seconds after about three corrections in the Level 2 classification experiment. In the Level 3 classification experiment, the system can restore parallelism with an average correction error of 25.65 arc seconds and a standard deviation of approximately 9.45 arc seconds after about four corrections. These findings demonstrate the potential of the proposed optical mechanism in enhancing precision mechanical engineering and semiconductor industries.
To further improve the system, advanced imaging software and control systems will be integrated, and the data classifications will be expanded to create a more comprehensive calibration system. This will enable the system to better meet the increasingly demanding requirements of these industries.
Author Contributions
Conceptualization, C.-P.C.; methodology, C.-P.C. and Y.-C.W.; software, S.-C.C. and C.-C.C.; validation, C.-P.C., S.-C.C. and C.-C.C.; formal analysis, C.-P.C., S.-C.C. and C.-C.C.; investigation, C.-P.C., S.-C.C. and C.-C.C.; resources, C.-P.C.; data curation, C.-P.C. and C.-C.C.; writing—original draft preparation, S.-C.C. and C.-P.C.; writing—review and editing, S.-C.C. and C.-P.C.; visualization, S.-C.C.; supervision, C.-P.C. and Y.-C.W.; project administration, C.-P.C. and Y.-C.W.; funding acquisition, C.-P.C. and Y.-C.W. All authors have read and agreed to the published version of the manuscript.
Funding
This research was funded by National Science and Technology Council, R. O. C. (Taiwan), grant no. MOST 111-2221-E-415-011.
Data Availability Statement
Data sharing not applicable.
Conflicts of Interest
The authors declare no conflict of interest.
References
- Wu, M.-H.; Fang, Y.-H. Picking-Up and Placing Process for Electronic Devices and Electronic Module. U.S. Patent US 20160268491 A1, 15 September 2016. [Google Scholar]
- Mizuno, T.; Tomoda, K.; Oohata, T. Method of Transferring Device. U.S. Patent US 20100258543 A1, 14 October 2010. [Google Scholar]
- Golda, D.; Higginson, J.A.; Bibl, A.; Parks, P.A.; Bathurst, S.P. Mass Transfer Tool Manipulator Assembly. U.S. Patent US 9308649 B2, 12 June 2016. [Google Scholar]
- Li, Y.-C.; Lai, Y.-H.; Lin, T.-Y. Method for Transferring Light-Emitting Elements onto a Package Substrate. U.S. Patent US 9583450 B2, 28 February 2017. [Google Scholar]
- Fabry, C.; Perot, A. Theorie et applications d’une nouvelle methode de spectroscopie interferentielle. Ann. Chim. Ser. 7 1899, 16, 115–144. [Google Scholar]
- Gangopadhyay, T.K.; Mandal, S.; Dasgupta, K.; Basak, T.K.; Ghosh, S.K. Modeling and analysis of an extrinsic Fabry-Perot interferometer cavity. Appl. Opt. 2005, 44, 3192–3196. [Google Scholar] [CrossRef] [PubMed]
- Shyu, L.H.; Chang, C.P.; Wang, Y.C. Influence of intensity loss in the cavity of a folded Fabry-Perot interferometer on interferometric signals. Rev. Sci. Instrum. 2011, 82, 063103. [Google Scholar] [CrossRef] [PubMed]
- Mohri, M.; Rostamizadeh, A.; Talwalkar, A. Foundations of Machine Learning; MIT Press: Cambridge, MA, USA, 2018. [Google Scholar]
- Wang, P.; Fan, E.; Wang, P. Comparative analysis of image classification algorithms based on traditional machine learning and deep learning. Pattern Recognit. Lett. 2021, 141, 61–67. [Google Scholar] [CrossRef]
- Montavon, G.; Kauffmann, J.; Samek, W.; Müller, K.R. Explaining the predictions of unsupervised learning models. In xxAI-Beyond Explainable AI, Proceedings of the International Workshop, Held in Conjunction with ICML 2020, Vienna, Austria, 18 July 2020; Revised and Extended Papers; Springer International Publishing: Cham, Switzerland, 2022; pp. 117–138. [Google Scholar]
- Brunke, L.; Greeff, M.; Hall, A.W.; Yuan, Z.; Zhou, S.; Panerati, J.; Schoellig, A.P. Safe learning in robotics: From learning-based control to safe reinforcement learning. Annu. Rev. Control Robot. Auton. Syst. 2022, 5, 411–444. [Google Scholar] [CrossRef]
- Caruana, R.; Niculescu-Mizil, A. An empirical comparison of supervised learning algorithms. In Proceedings of the 23rd International Conference on Machine Learning, Pittsburgh, PA, USA, 25–29 June 2006; pp. 161–168. [Google Scholar]
- Niculescu-Mizil, A.; Caruana, R. Predicting good probabilities with supervised learning. In Proceedings of the 22nd International Conference on Machine Learning, Bonn, Germany, 7–11 August 2005; pp. 625–632. [Google Scholar]
- Kou, K.; Wang, C.; Lian, T.; Weng, J. Fringe slope discrimination in laser self-mixing interferometry using artificial neural network. Opt. Laser Technol. 2020, 132, 106499. [Google Scholar] [CrossRef]
- Madipadaga, A.; Gannavarpu, R. Investigation of temporally varying fringe pattern defects using machine learning for optical metrology. In Proceedings of the SPIE 11552, Optical Metrology and Inspection for Industrial Applications VII, 115520L, Online Only, China, 11–16 October 2020. [Google Scholar]
- Omar, E.Z. Investigation and classification of fibre deformation using interferometric and machine learning techniques. Appl. Phys. B 2020, 126, 54. [Google Scholar] [CrossRef]
- Nissim, N.; Dudaie, M.; Barnea, I.; Shaked, N.T. Real-Time Stain-Free Classification of Cancer Cells and Blood Cells Using Interferometric Phase Microscopy and Machine Learning. Cytom. Part A 2020, 99, 511–523. [Google Scholar] [CrossRef] [PubMed]
- Szegedy, C.; Vanhoucke, V.; Ioffe, S.; Shlens, J.; Wojna, Z. Rethinking the inception architecture for computer vision. In Proceedings of the IEEE Conference on Computer Vision and Pattern Recognition, Las Vegas, NV, USA, 27–30 June 2016; 2016; pp. 2818–2826. [Google Scholar]
- Li, Z.; Zhang, L.; Zhang, Z.; Xu, R.; Zhang, D. Speckle classification of a multimode fiber based on Inception V3. Appl. Opt. 2022, 61, 8850–8858. [Google Scholar] [CrossRef] [PubMed]
- Al-Karawi, A. Stacked Cross Validation with Deep Features: A Hybrid Method for Skin Cancer Detection. Tehnički Glas. 2022, 16, 33–39. [Google Scholar] [CrossRef]
- Vinay, A.; Bhat, N.; Khurana, P.S.; Lakshminarayanan, V.; Nagesh, V.; Natarajan, S.; Sudarshan, T.B. AFMB-Net: DeepFake Detection Network Using Heart Rate Analysis. Tehnički Glas. 2022, 16, 503–508. [Google Scholar] [CrossRef]
| Disclaimer/Publisher’s Note: The statements, opinions and data contained in all publications are solely those of the individual author(s) and contributor(s) and not of MDPI and/or the editor(s). MDPI and/or the editor(s) disclaim responsibility for any injury to people or property resulting from any ideas, methods, instructions or products referred to in the content. |
© 2023 by the authors. Licensee MDPI, Basel, Switzerland. This article is an open access article distributed under the terms and conditions of the Creative Commons Attribution (CC BY) license (https://creativecommons.org/licenses/by/4.0/).


