
Influence of Cutting Parameters and Tool Geometry on Topography of Hard Turned Surfaces


Institute of Manufacturing Science, Faculty of Mechanical Engineering and Informatics, University of Miskolc, H-3515 Miskolc, Hungary
Machines 2023, 11(6), 665; https://doi.org/10.3390/machines11060665
Submission received: 22 May 2023
/
Revised: 15 June 2023
/
Accepted: 19 June 2023
/
Published: 20 June 2023
(This article belongs to the Section Advanced Manufacturing)
Abstract
:Three-dimensional topography measurement is a focus area of precision machining because it provides detailed information on the functional behavior of contacting surfaces. The purpose of this study is to analyze how the process parameters and the edge geometry of the cutting insert influence the topographical characteristics of hardened 16MnCr5 steel surfaces and to determine the favorable combinations of technology parameter values based on the analyzed topography parameters (Ssk, Sku, Sz, Sa, Sk, Spk, Svk). A research question is whether the analyzed parameters can be substituted by each other or not. A hard turning experiment was carried out based on a full factorial design of experiments, and the areas of the machined surfaces were scanned and analyzed by analysis of variance, regression analysis (response function), and correlation analysis. It was found that there are strong correlations between the topography parameters that allow the substitution of one with another; the main influencing cutting parameter is the feed rate for both insert types. The contributions of the study are the numerical information with regard to the correlations among the topography parameters, as well as the extent of the influence of cutting parameters.
1. Introduction
Hard turning is one of the most commonly used technologies in the precision machining of steel parts due to its high efficiency. If surface texture characteristics allow, grinding can be replaced by hard turning because the same accuracy and surface quality can be achieved and further finishing operations may not be required [1,2]. Several physical and mechanical factors influence the chip formation mechanism in hard turning, e.g., dynamic effects, cutting temperature, hardness, stress distribution [3]. These complex mechanisms affect not only the surface state, but also the topography, either directly or indirectly. Hard turning requires no coolant and lubricant, but white layer formation is a risk of the technology. The tooling and resource costs are high, as well as the machining efficiency [4]. Therefore, an in-depth analysis of the technology itself, together with the cutting mechanism, is crucial in order to obtain utilizable results useful for the machining industry. As a result of this need, the focus of the mainstream studies is the comprehensive analysis of the process parameters, either via statistical methods or neural networks [5,6]. In this study, a detailed design of the experiment is the basis of the statistical-based analysis of the surface topography data obtained. To overcome the difficulties of the hard turning technology, a special hard machining center was used in the experiments, and the design of the experiment (the number of setups) was planned to provide enough information based on relatively small changes in the process parameters. In precision machining, the surfaces of the parts must fulfill several functional requirements. Many of them can be designed based on surface texture and topography features and parameters, whose values are determined by the cutting parameters, among other material, machine-tool, and equipment-related factors [7]. Three-dimensional topography measurement allows for the in-depth analysis of topographical characteristics to use more parameters and analytics rather than those which are available in 2D topography analysis. At the same time, the 3D technique is more accurate due to the much higher number of scanned surface points and provides more details about the surfaces [8,9]. Three-dimensional surface topography analysis is applied for surfaces machined by various technologies and can provide information on the effectiveness of the applied machining technology [10]. Beyond turning [11,12] and grinding [13], the relatively new technologies are the current focus of topography studies, including precision milling [14] and additive procedures [15,16]. Most of the studies focus on the selection of optimal process parameters [17,18]. Although 3D measurement is less time- and cost-efficient than its 2D counterpart, it is useful in high-tech industries [19].
Some of the widely studied and most important functional and tribological requirements of precision machined parts are wear resistance, load-bearing capacity, and lubricant retention ability. Topography parameters provide information regarding these properties, among others. The maximum height (Sz) and arithmetical mean height (Sa) are widely applied parameters in the machining industry. However, if a more detailed analysis is required, it is recommended to apply further parameters [20]. In academic research or technology development, studying the connections among the topographical parameters is essential [21]. As an example, Shi et al. investigated the friction and wear characteristics of random surfaces based on the Sa and kurtosis (Sku) parameters, and identified clear connections between these characteristics and topography parameters [22].
Machining technologies such as burnishing or honing are performed to remove the upper part of the surface peaks, causing the surface to be filled and characterized by high load-bearing capacity and favorable wear resistance [23]. The skewness (Ssk) value of such a surface is negative, and if the kurtosis (Sku) value is high, the wear resistance [24,25] and the lubricant retention ability increase [26]. At the same time, high Sku, due to the large number of sharp peaks, reduces the friction of a contacting surface [27]. Contradictory findings have been reported for the Sku parameter: one example is its influence on the lubricant retention ability, it has been found to increase with the decrease in Sku [28], while another study found no connection between them [29]. It was also reported that higher moments of the height distribution (Ssk and Sku) are sensitive to the measurement setup [30] and the technological parameters [31]. Krawczyk et al. analyzed Inconel 718 steel based on the Ssk and Sku parameters and found that they are useful in detecting surface irregularities [32]. Peng et al. compared additively manufactured parts, upon which heat treatment was and was not applied, and found that the Ssk and Sku parameters are suitable for the characterization of the surfaces [33]. According to Kulis et al., who analyzed milled surfaces, the peak height (Sp), Ssk, and Sku parameters provide no clear information on the effects of the cutting parameters [34]. Karmiris-Obratanski et al. carried out an in-depth analysis of the Ssk connected to surfaces machined by electro-discharge machining and found that Ssk is not significantly influenced by the machining parameters [35]. Pawlus et al. studied the surface topography of 20MnCr5 steel and found that Sp/Sz and Sq/Sa characterize the height distribution of a surface more precisely than the Ssk and the Sku parameters [36].
The Sk parameter group also provides information on the functional characteristics. The Sk parameter group is derived from the material ratio curve [37]. The core height (Sk) and the reduced valley depth (Svk) provide information on the lubricant retention ability of a surface [36,38]. The reduced peak height (Spk) is related to the load-baring capacity and the wear resistance. If its value is relatively low, the running-in phase of a contacting part is short and the surface reaches its filled feature faster.
In machining, several cutting and process factors influence the result variables, such as topography, accuracy, and material properties. For analyzing the relatively complex determinants and the interactions among the influencing factors and results, analysis of variance (ANOVA) and other statistical methods are recommended. Javidikia et al. applied ANOVA and a response function method for roughness analysis in their turning experiment and focused on the effects of various lubrication types [39]. Kulisz et al. analyzed the equity of means and variances for 3D topography parameters [27]. Kluz et al. applied regression analysis and used the Sku parameter for studying the efficiency of diamond burnishing [40].
The purpose of this study is to analyze some common and functionally important topography parameters to determine how they are affected by the cutting parameters and different cutting insert geometries and the best combinations of these influencing factors to obtain a surface quality that fulfills the functional requirements, such as wear resistance, load-baring capacity, or fluid retention ability.
The novelties of the study are that the results obtained for a widely used material were analyzed by several up-to-date statistical methods and their outcomes were compared and that innovative cutting inserts (developed in 2022) were used in the experiments and compared in the study.
A hard turning experiment was carried out where three cutting parameter (depth-of-cut, cutting speed, and feed rate) values were varied, using different cutting inserts. The insert used is one of the latest innovations of the manufacturer concerning its material and coating. The topography parameters of the machined surfaces were determined and studied by analysis of variance (ANOVA), response function method, and correlation analysis. The topography parameters examined were skewness (Ssk), kurtosis (Sku), maximum height (Sz), arithmetical mean height (Sa), core height (Sk), reduced peak height (Spk), reduced valley depth (Svk), and two additional coefficients, the Spk/Sk and Svk/Sk rates.
2. Material and Methods
The machined material was a 16MnCr5 case hardened steel with HRC hardness values of 60–63. External cylindrical surfaces with 60 mm diameter and 13 mm length were machined. The physical and mechanical properties and the chemical composition of the material are summarized in Table 1 and Table 2.
The hard turning experiment was carried out on a hard machining center EMAG VSC 400 DDS (EGAM Salach GmbH, Salach, Germany). The tool holder used was PCLNR 2020-K12. In the experiment, two inserts were used, the 4NC-CNGA 120408-type standard and its wiper counterpart. The radii of the inserts was rε = 0.8 mm. Three cutting parameters were varied on three levels: the depth-of-cut (ap), the cutting speed (vc), and the feed rate (f). The design of the experiment (full factorial design) is presented in Table 3. The machining was carried out dry.
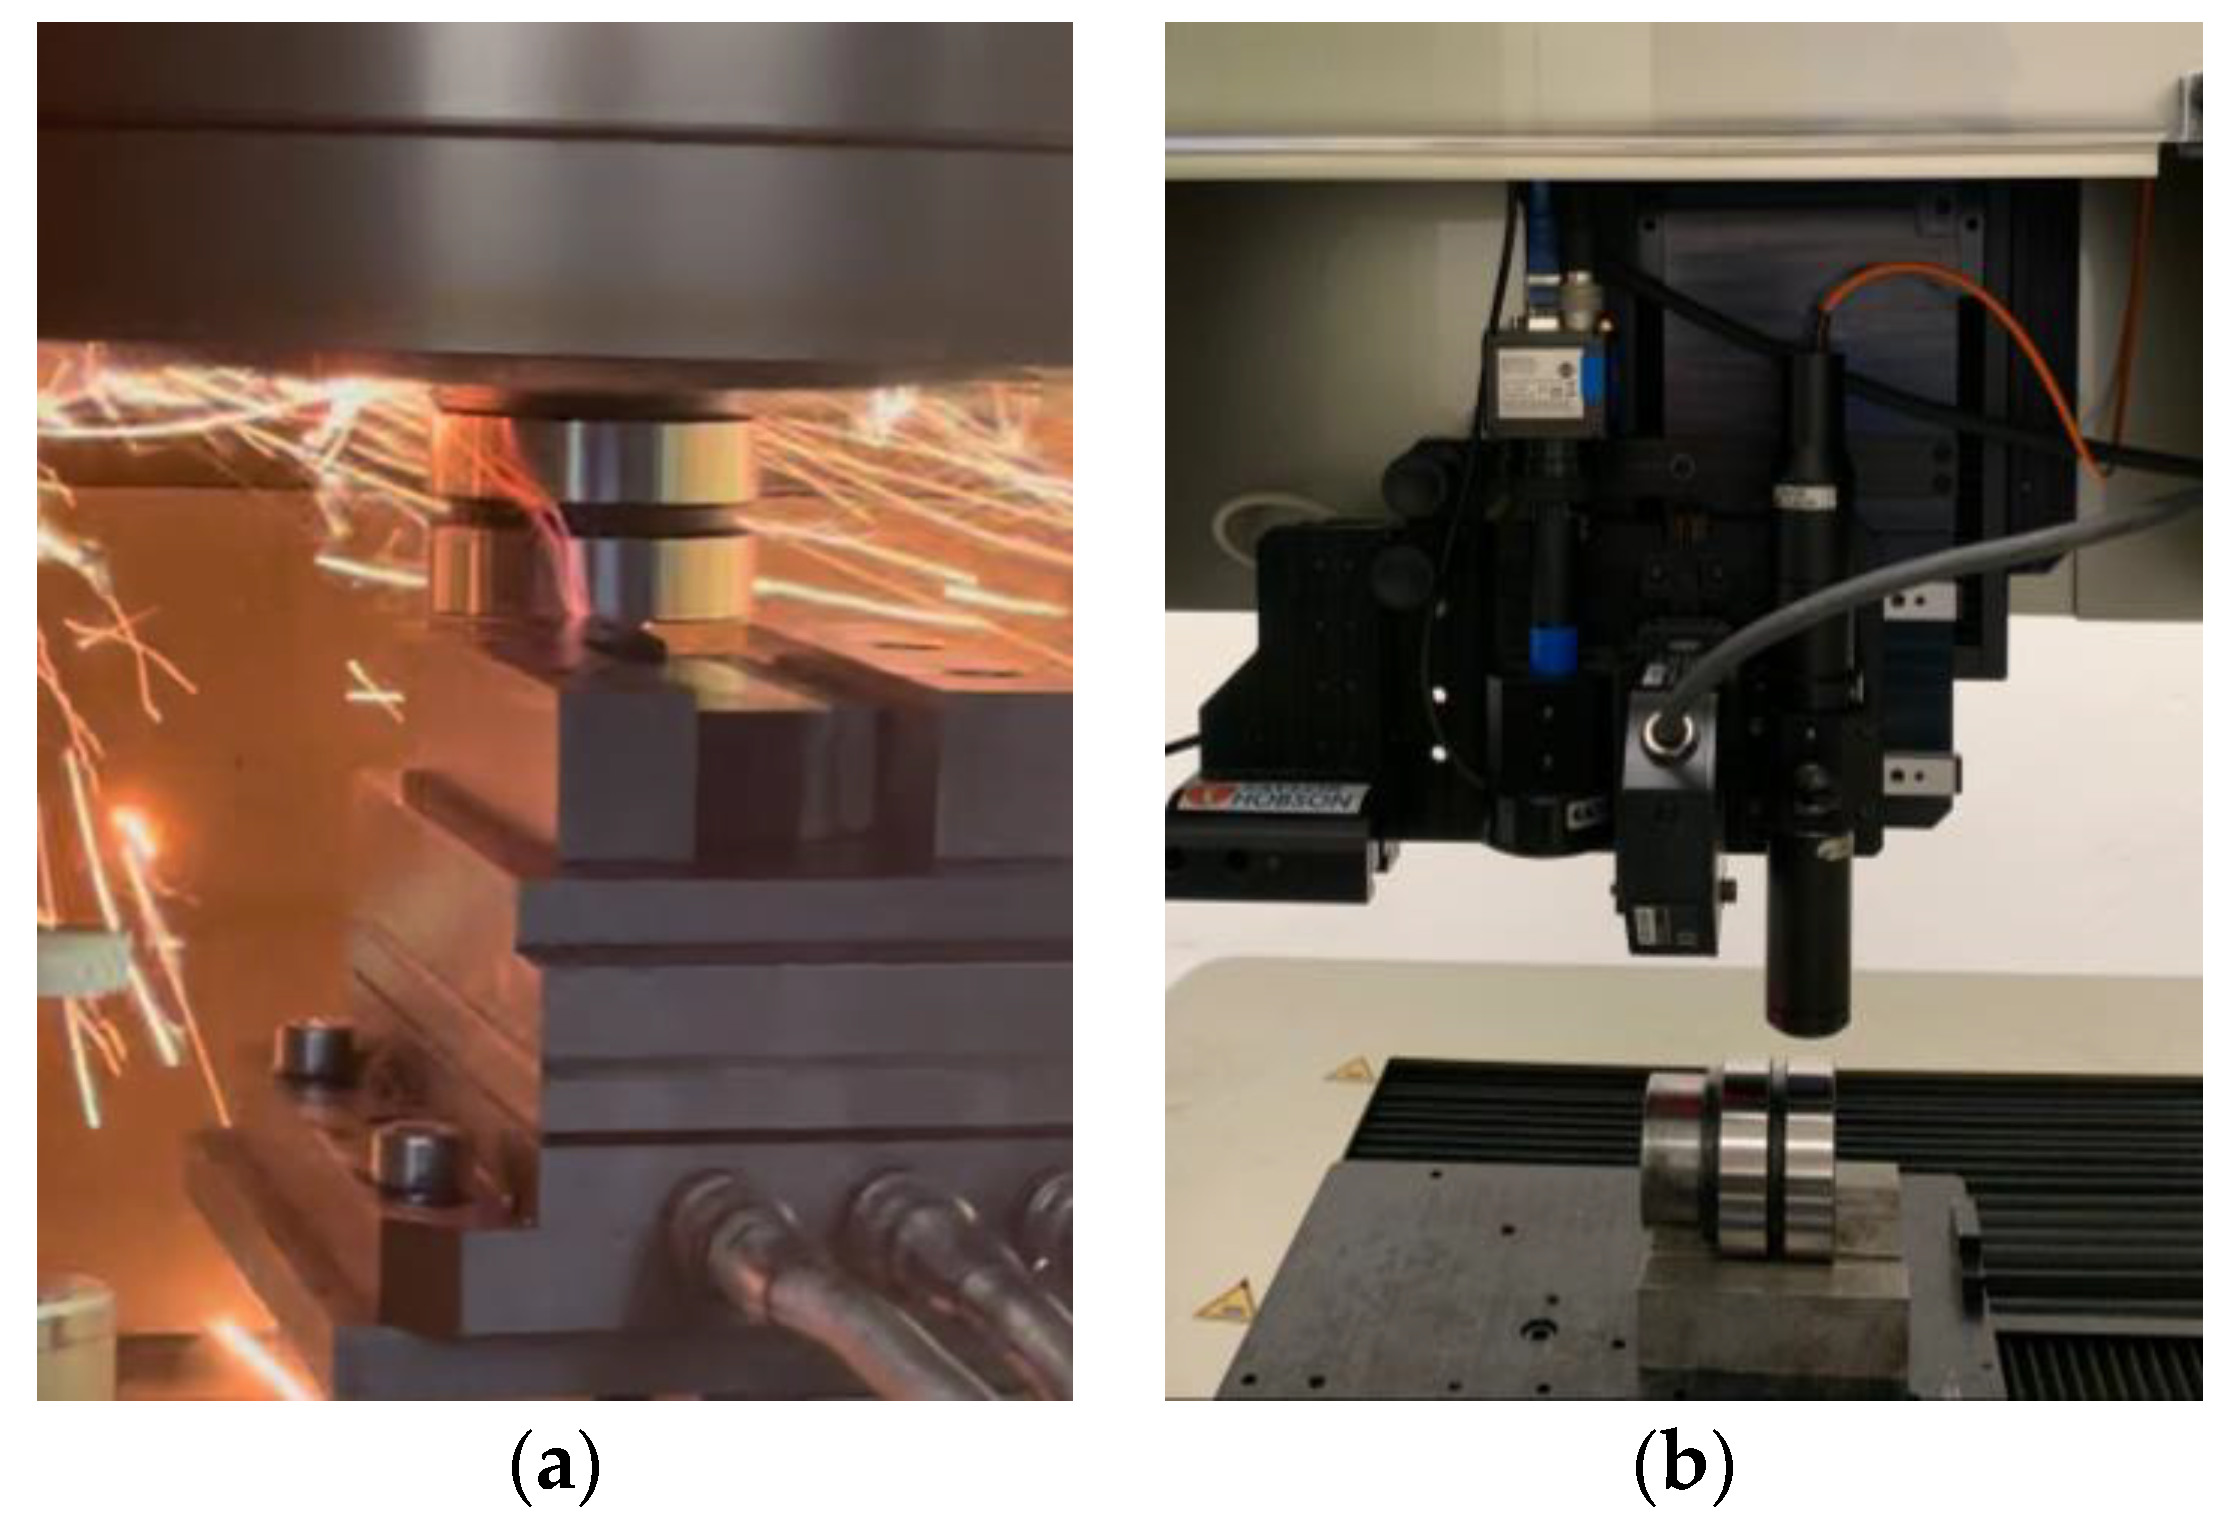
The surface topography measurement was carried out on a 3D equipment-type Altisurf 520 (Altimet, Marin, France). For the scanning, a confocal chromatic sensor (type CL2) was used. Its resolutions were 1 µm, 1 µm, and 0.012 µm in x, y, and z directions, respectively. The scanning speed was 2000 µm/s. The cut-off lengths were 0.08, 0.25, and 0.8 mm, depending on the periodicity of the machined surfaces; the evaluation areas of the surfaces were 2 × 2 mm. In Figure 1, the positions of a workpiece in the machine tool and the topography measuring equipment are presented. For the analysis of the topography data, the software AltiMap Premium v6.2 (Altimet, France) and OriginPro 2022 (Originlab, Northampton, MA, USA) were used.
3. Results and Analysis
3.1. Normality Test and Analysis of Variance
To obtain numerical information concerning the means with which the cutting parameters influence the analyzed topography parameter values, one-way ANOVA calculations were carried out for each topography parameter. The two main conditions of ANOVA are that the variances of the considered groups of data have to be closely equal, and the distribution of the data has to be normal. In ANOVA, one data group includes the data that resulted from the machining at one level of one cutting parameter. In the experiment, three cutting parameters were analyzed at three levels each for machining by a cutting insert and two inserts were compared. In the case of one type of insert, a single cutting parameter value belongs to nine setups (parameter level combination), where three levels of the other two cutting parameters vary. For example, the data group of the 0.05 mm depth-of-cut includes the data (of a single topography parameter) of surfaces S1–S9 (first row of Table 3), and the cutting speed and feed rate vary at three levels each. In summary, normality indicators of nine groups must be analyzed for each topography parameter and one cutting insert. In the case of seven topography parameters and two inserts, the normality of 126 groups has to be analyzed.
For analyzing the normality, Shapiro–Wilk tests were carried out for the considered groups. This test is suitable for small amounts of data. The test is a hypothesis test, and the null hypothesis is that the sample results from a normal distribution. The W statistic of the test expresses the goodness of fit to the normal distribution. The p value of the test provides information on the acceptance or rejection of the null hypothesis. If the p value is lower than a preliminary determined α value (significance level), then the null hypothesis should be rejected, i.e., the sample is not generated from a normal distribution. If the p value is higher than the α, it indicates that there is not enough proof that the sample results are from an abnormal distribution. The usual value of the α is 0.05, and it is applied in this study as well.
The W and p values are summarized in Table A1. Based on the p values, in Table 4, the results of the normality tests are summarized. In 90 groups, the normality cannot be rejected, and in 36, the normality is rejected.
The analysis of variance (ANOVA) is useful to find the significance of the machining parameters and their effects on other qualifying variables of the machined surfaces [42]. The one-way ANOVA is applied for a topography parameter that belongs to one cutting parameter, with all three parameter levels. Nine topography datapoints belong to one level, which form one data group, and three data groups (three levels) of a cutting parameter must be compared in ANOVA. In the case of one topography parameter, one analysis has to be carried out for one cutting parameter, and in the analysis, the variances of three data groups are compared. This indicates that in the case of two cutting inserts, six analyses of variance have to be carried out for one topography parameter.
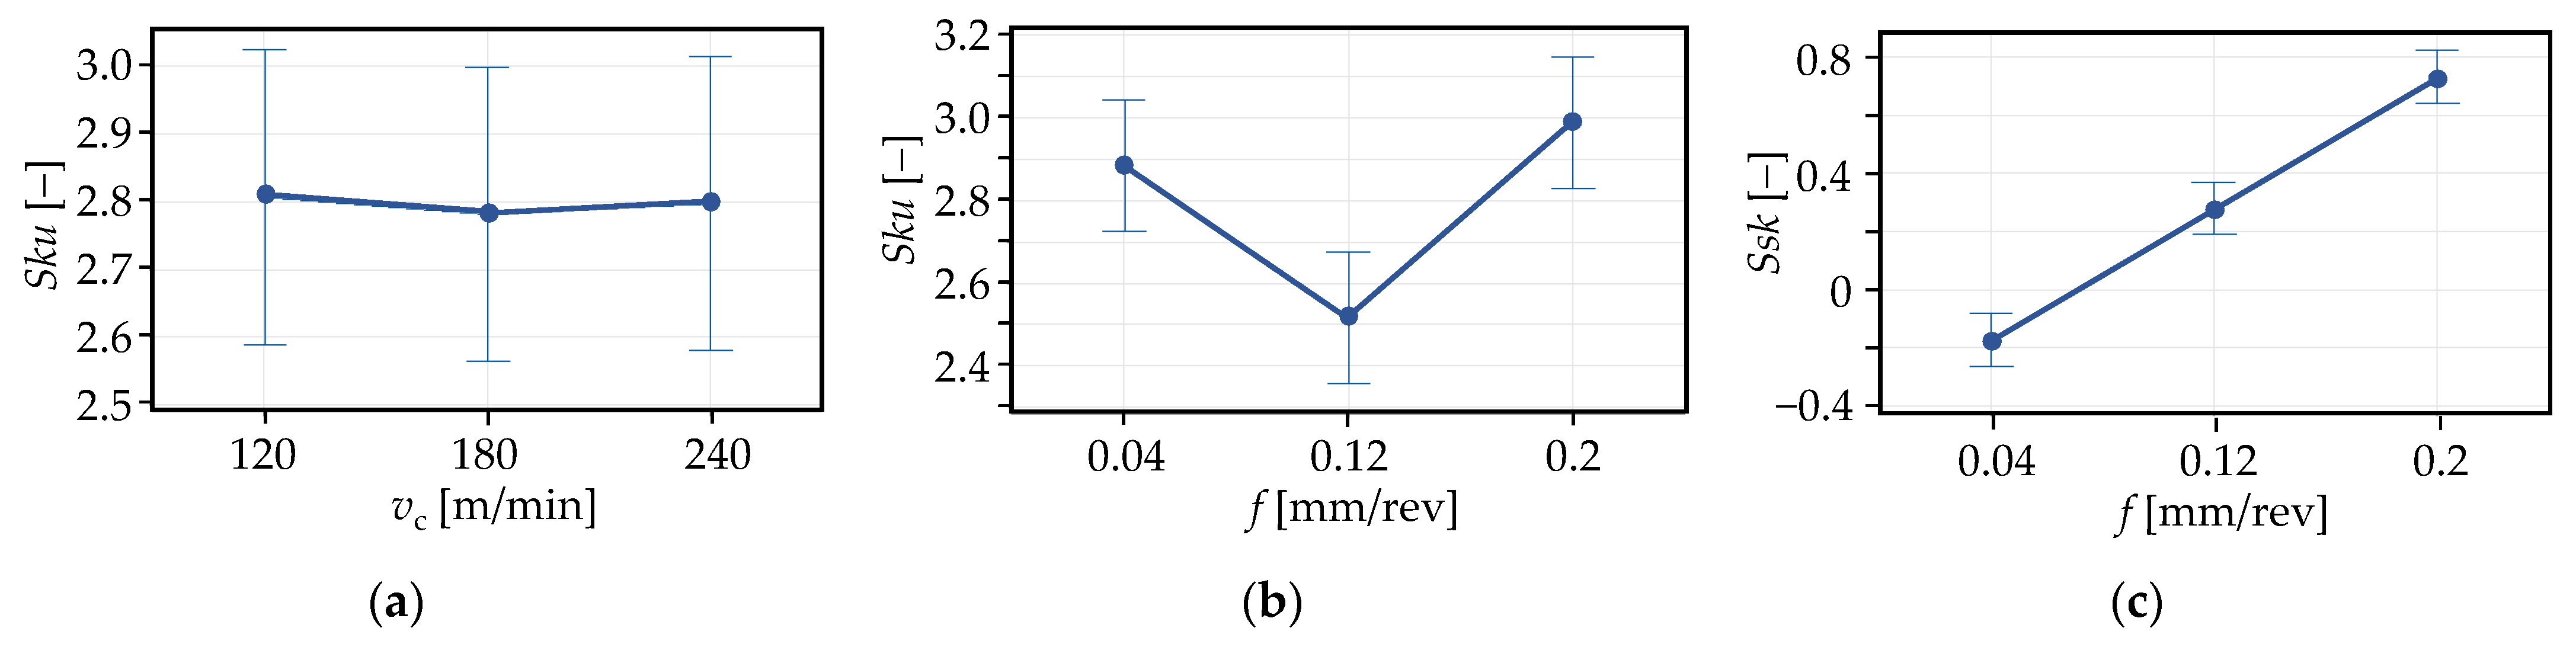
In the test, the F statistic is applied; it compares the variation within a group (topography data connected to a cutting parameter level) to the variation between the analyzed groups. If the F value is relatively high, this indicates that the variation between the sample means is higher than the variation within the samples. The null hypothesis of the analysis is that there is no significant difference between the group means. If the F value is high, the p value is relatively low. If the p value is under the preliminary designated α value, the null hypothesis is rejected (the means are probably not equal); if it is higher, there is not enough proof to reject it. In Figure 2a, the means are relatively close to each other, and in Figure 2b, there is a significant difference between them. In Figure 2c, the variances are relatively low, the means differ from each other significantly, and they increase as a function of the feed rate (there is a strong correlation between them), which indicates that there must be a connection between the cutting and the topography parameter. In the present study, α = 0.05 was chosen.
In this experiment, three analyses of variance belong to one topography parameter. In the case of seven topography parameters and two cutting inserts, the potential number of analyses is 42. However, based on the normality tests, the normality cannot be rejected in only 21 cases, and the analyses of variance can be interpreted only for these cases. In Table 5, the F and p values are summarized for the analyzed topography parameters. The results for which the normality condition is fulfilled are underlined in the columns of the p values. Where the p values are lower than 0.05, the means of the groups are not equal, which indicates that the topography parameter values might depend on the considered cutting parameter values if the two parameters correlate with each other. Where the p is higher than 0.05, the cutting parameter probably has no influence on the topography parameter.
As can be observed from the data, none of the analyzed topography parameters are influenced (the means do not deviate significantly) by the depth-of-cut (ap) or the cutting speed (vc), and all of them are influenced (the means differ from each other significantly) by the feed rate (f).
However, considering only the cases for which the normality is valid, the following conclusions can be drawn:
- Spk and Svk were not influenced by the depth-of-cut when the standard insert was used. Ssk, Sku, Sa, and Sk were not influenced by the depth-of-cut when the wiper insert was used.
- Ssk, Sz, Sa, Spk, and Svk were not influenced by the cutting speed when the standard insert was used. Ssk, Sku, Sa, Sk, and Svk were not influenced by the cutting speed when the wiper insert was used.
- Sku, Spk, and Svk were influenced by the feed rate when the standard insert was used. Ssk and Sku were influenced by the feed rate when the wiper insert was used.
3.2. Analysis of the Topography Parameters
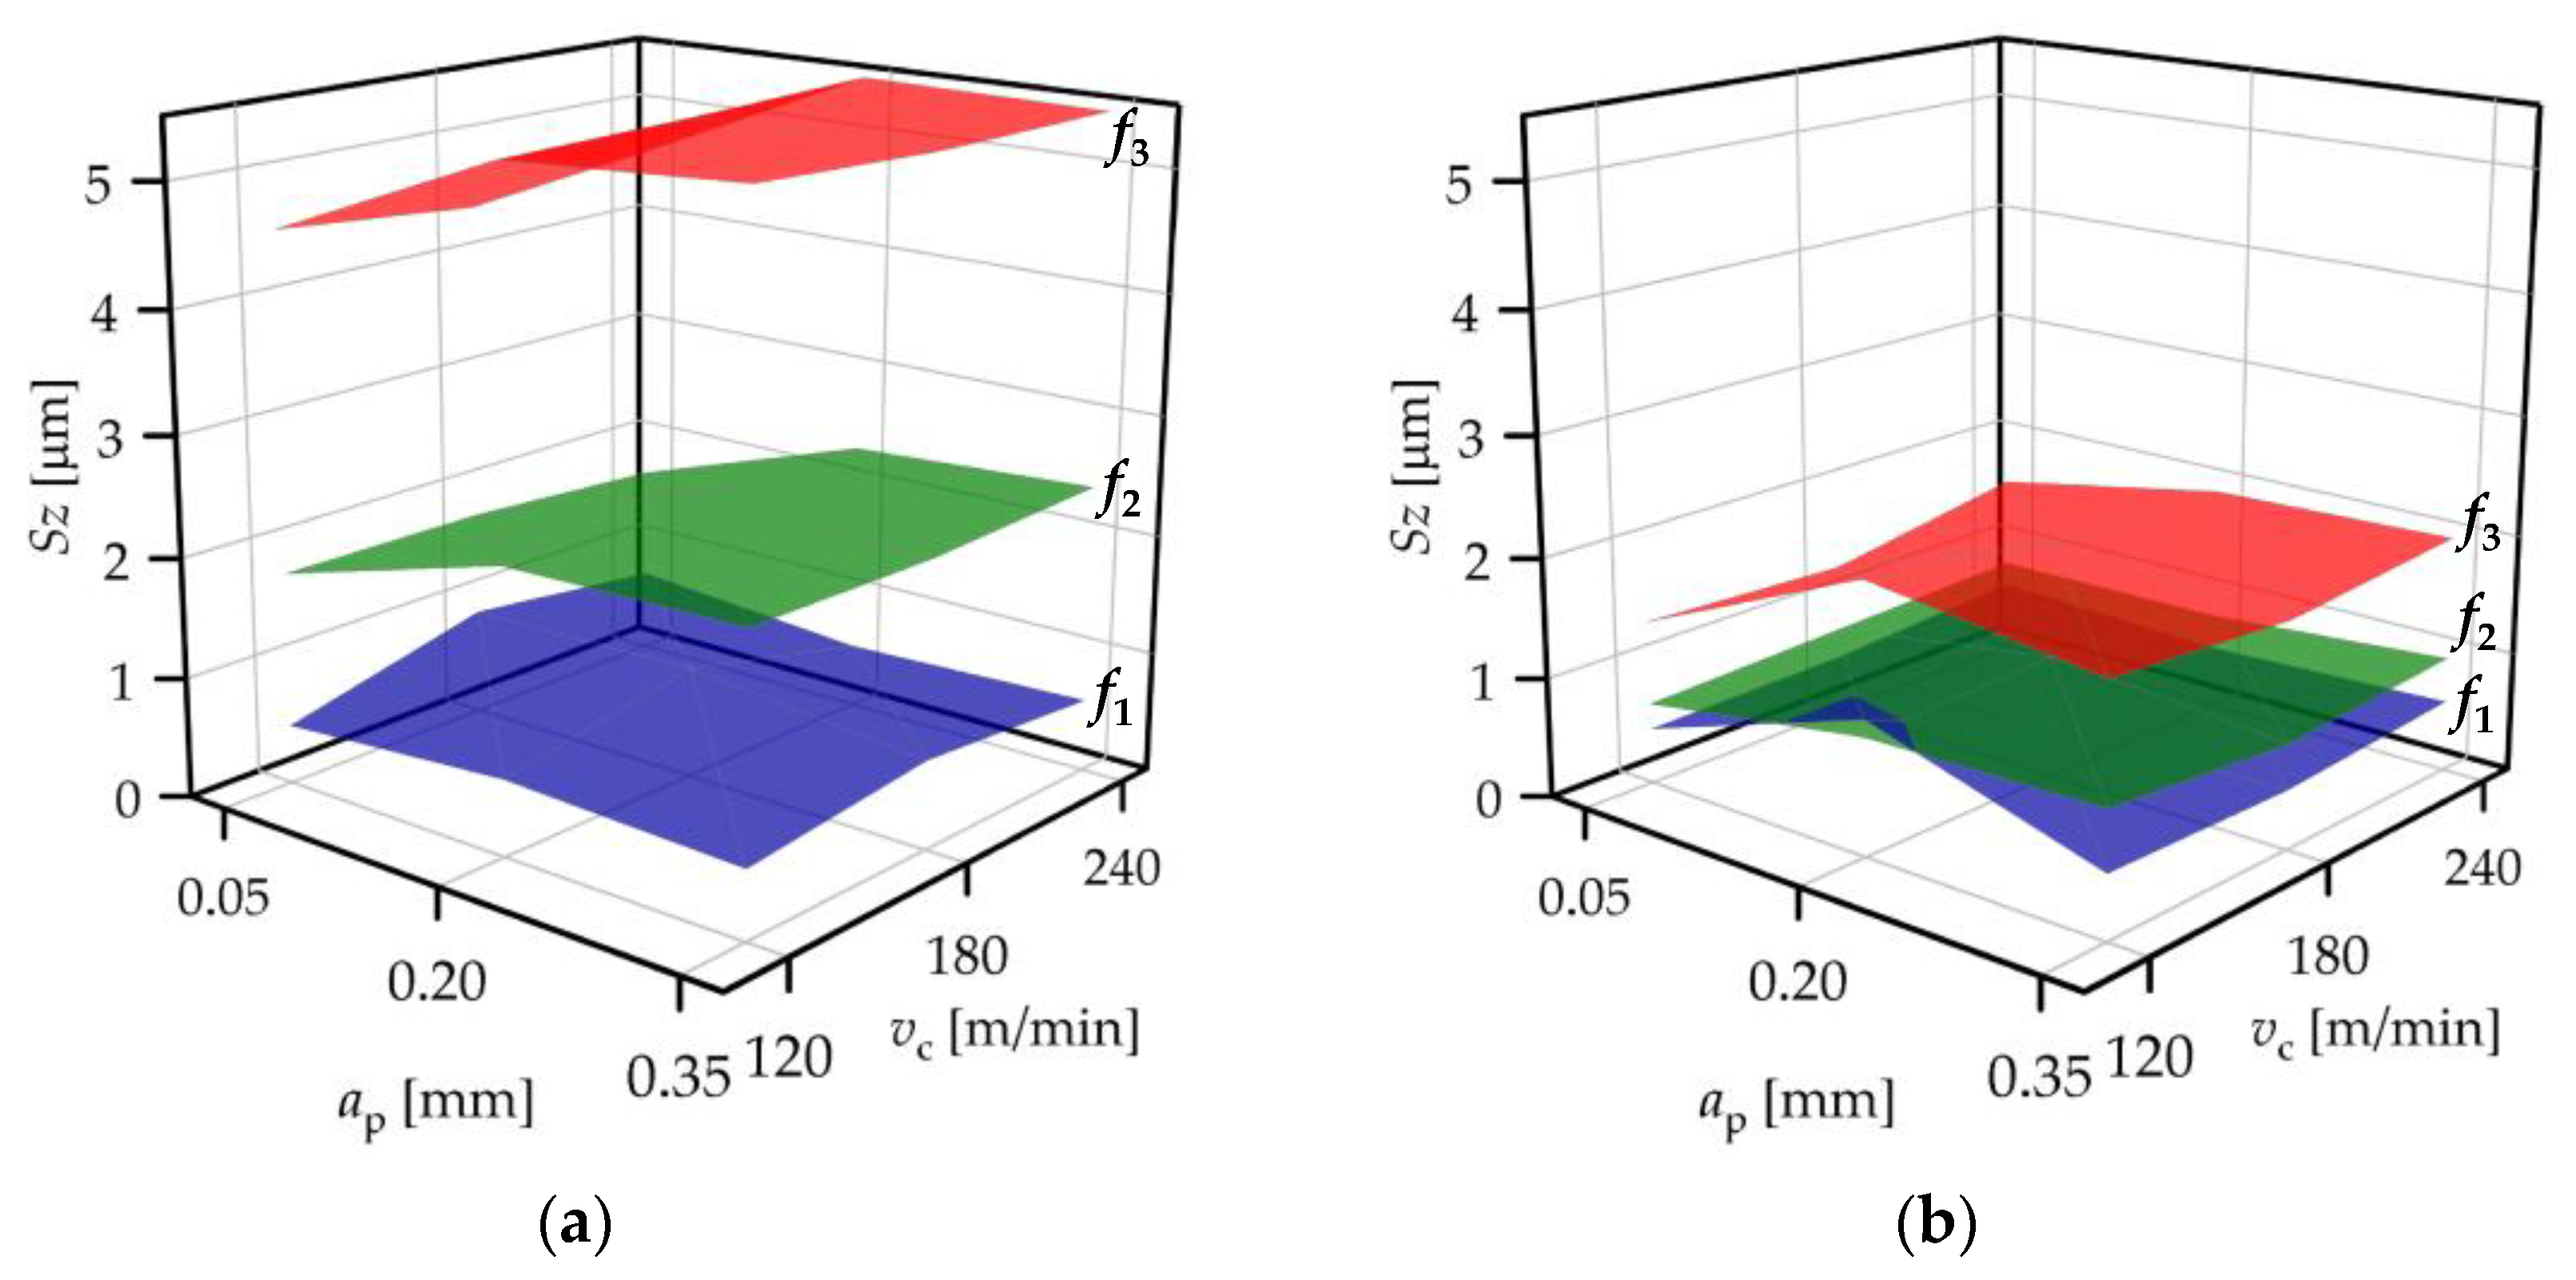
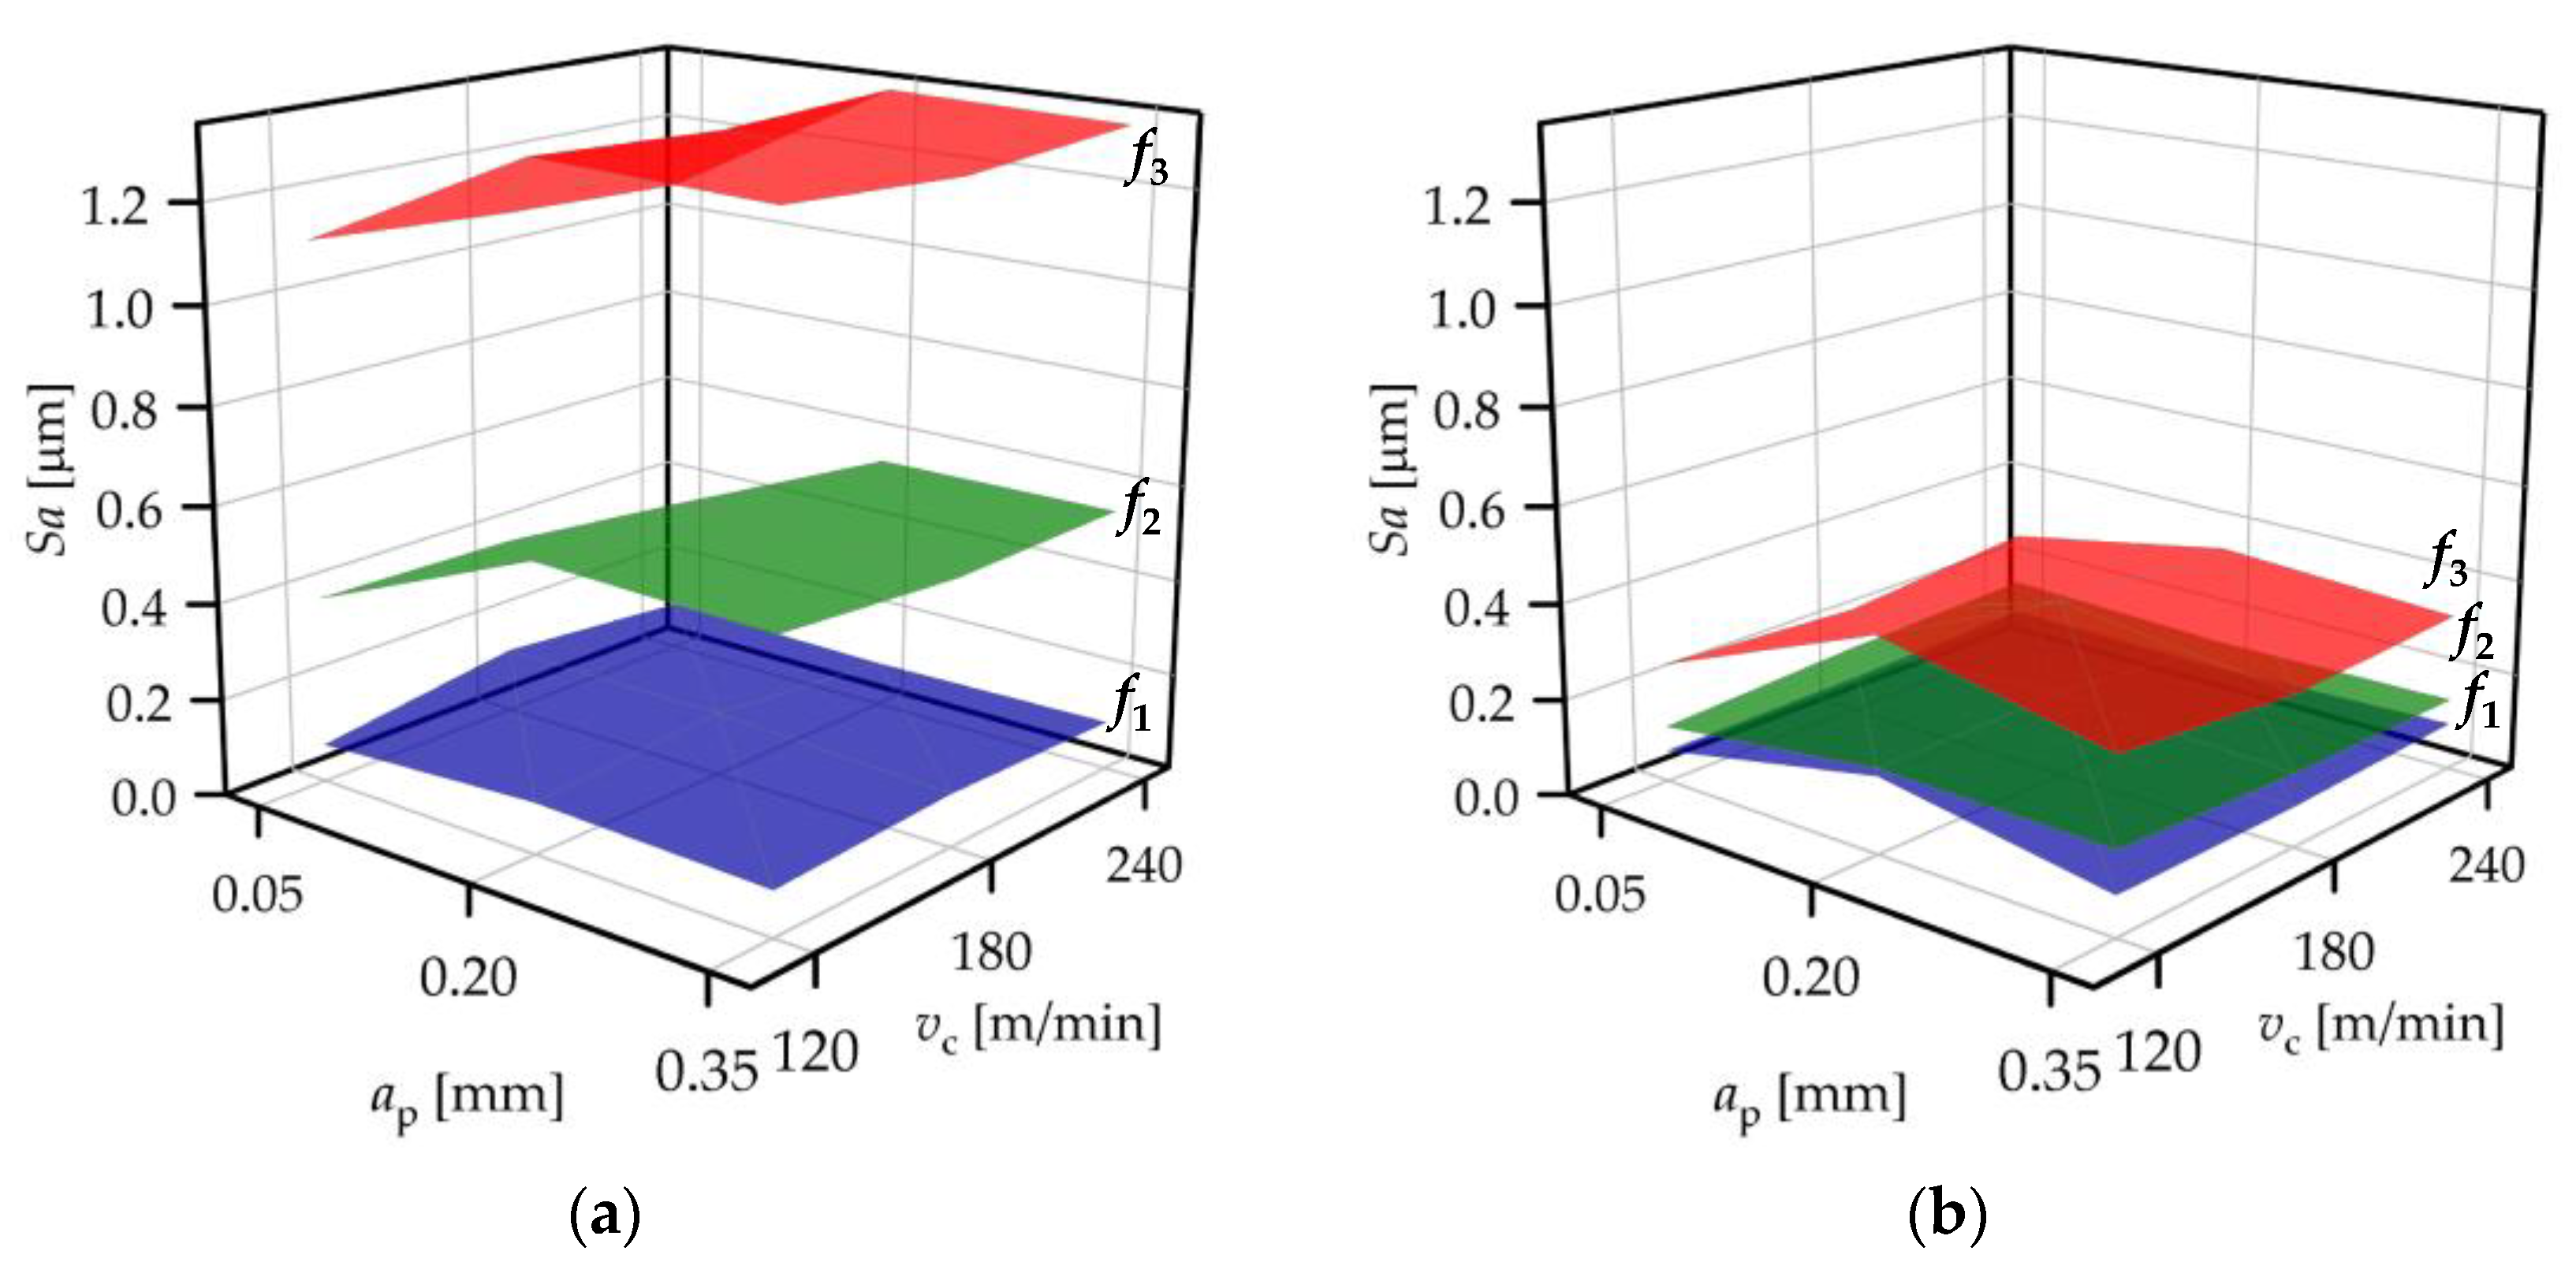
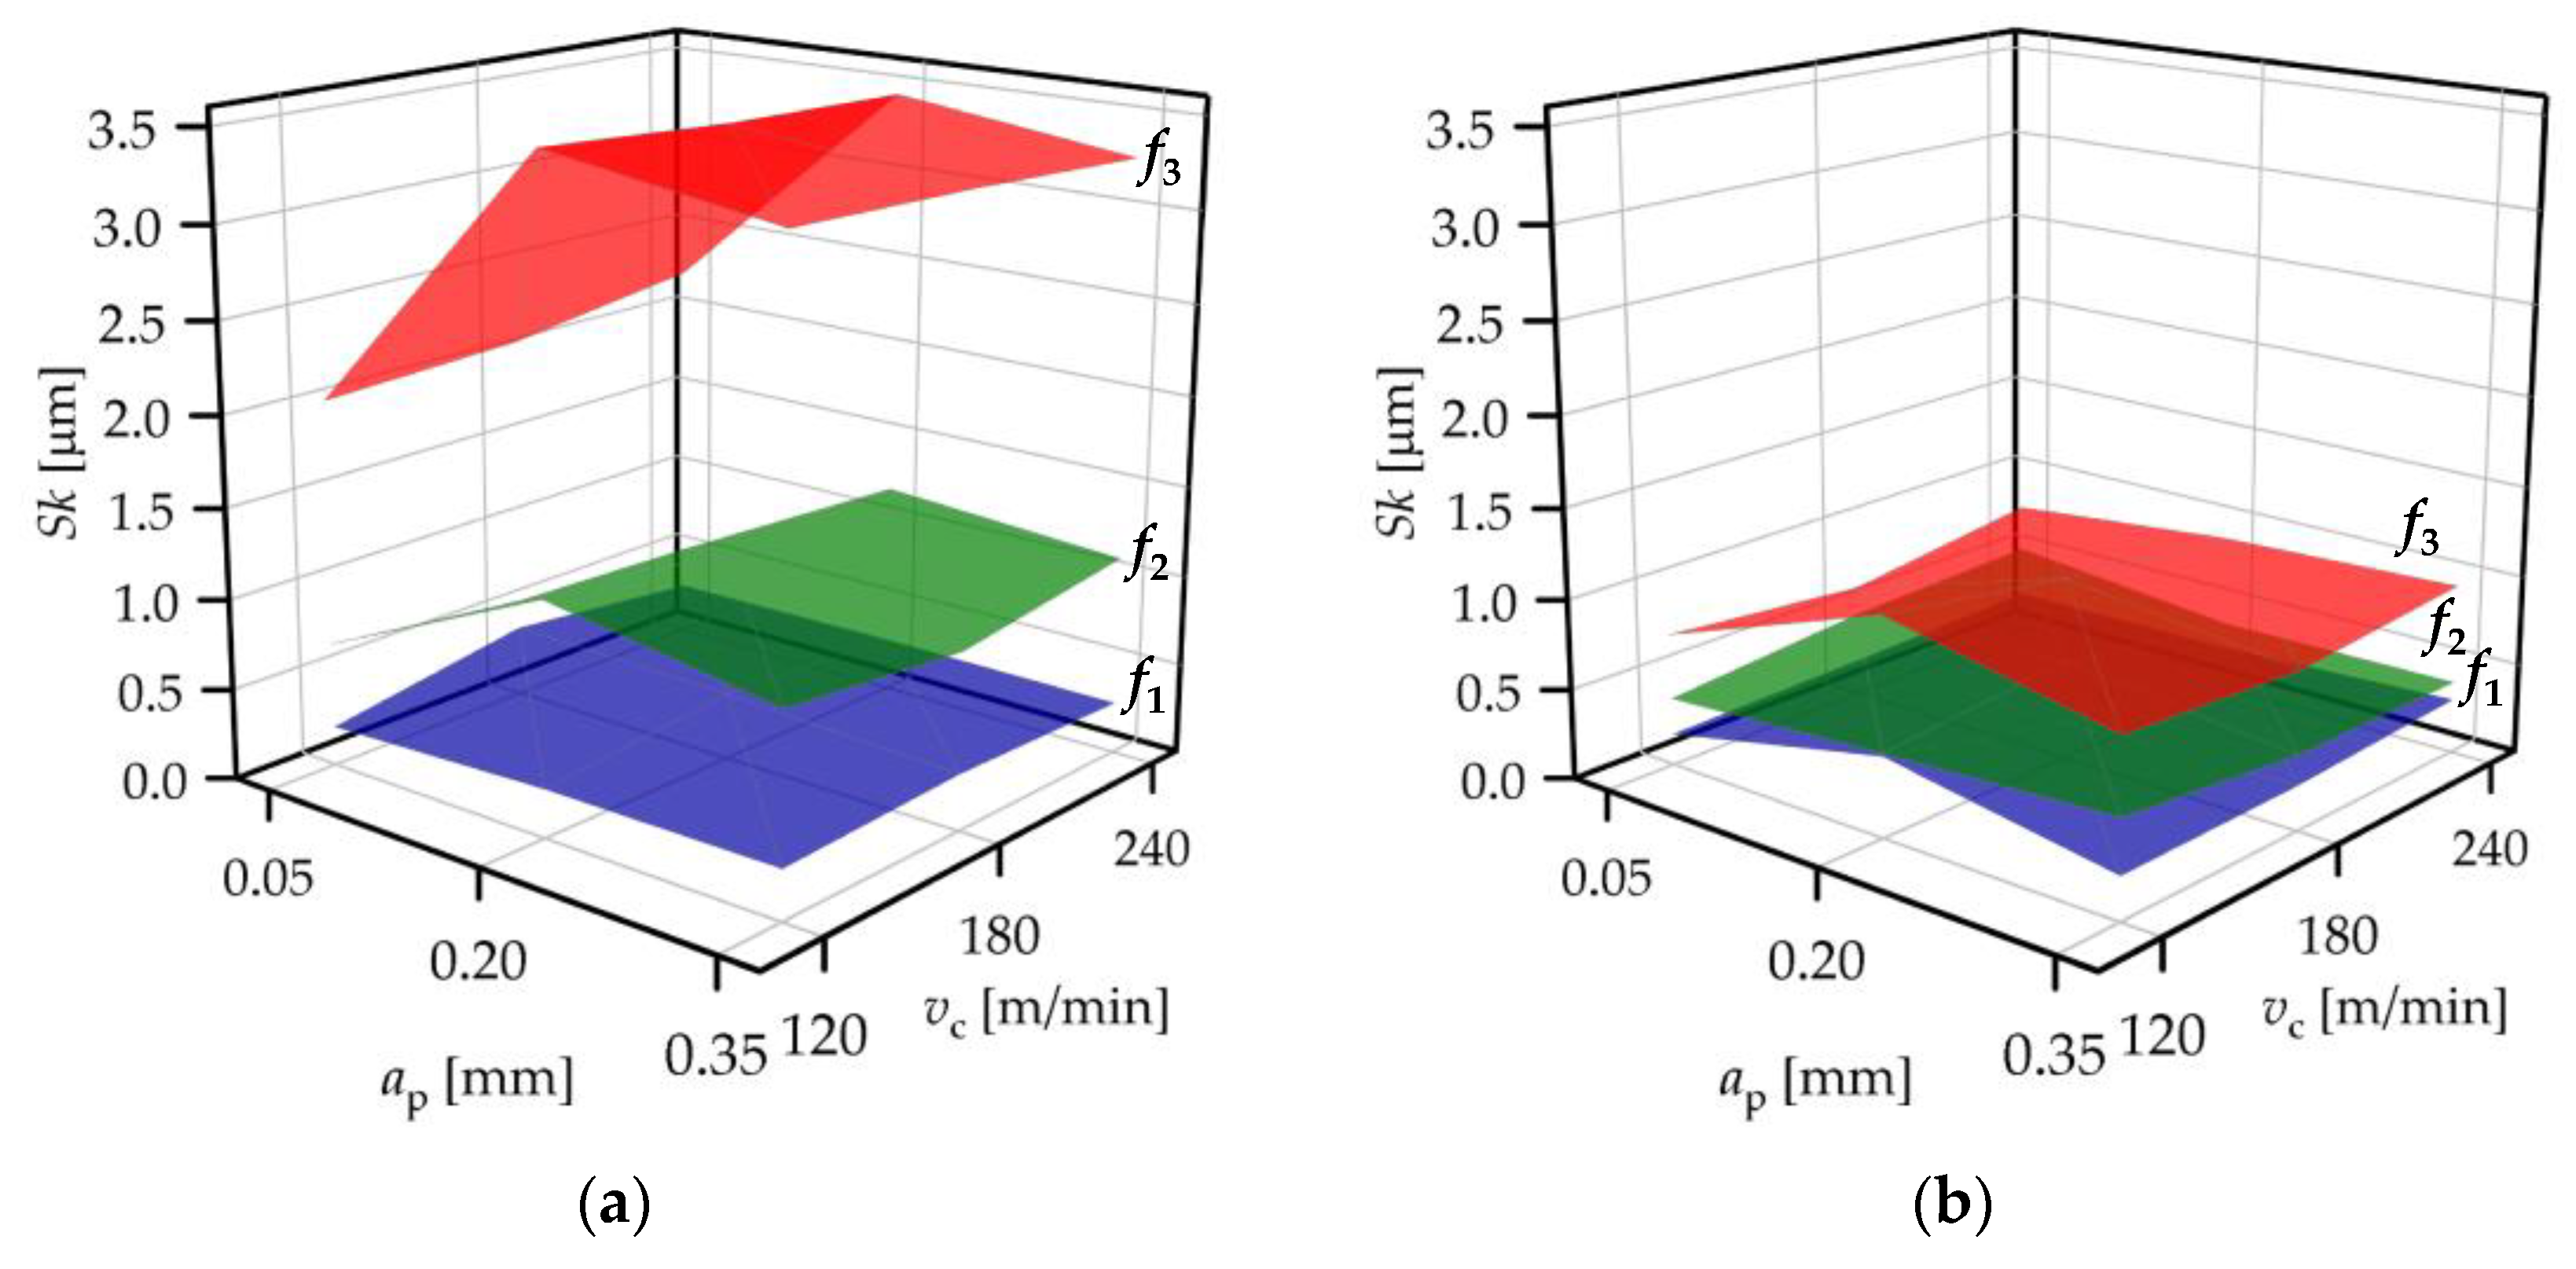
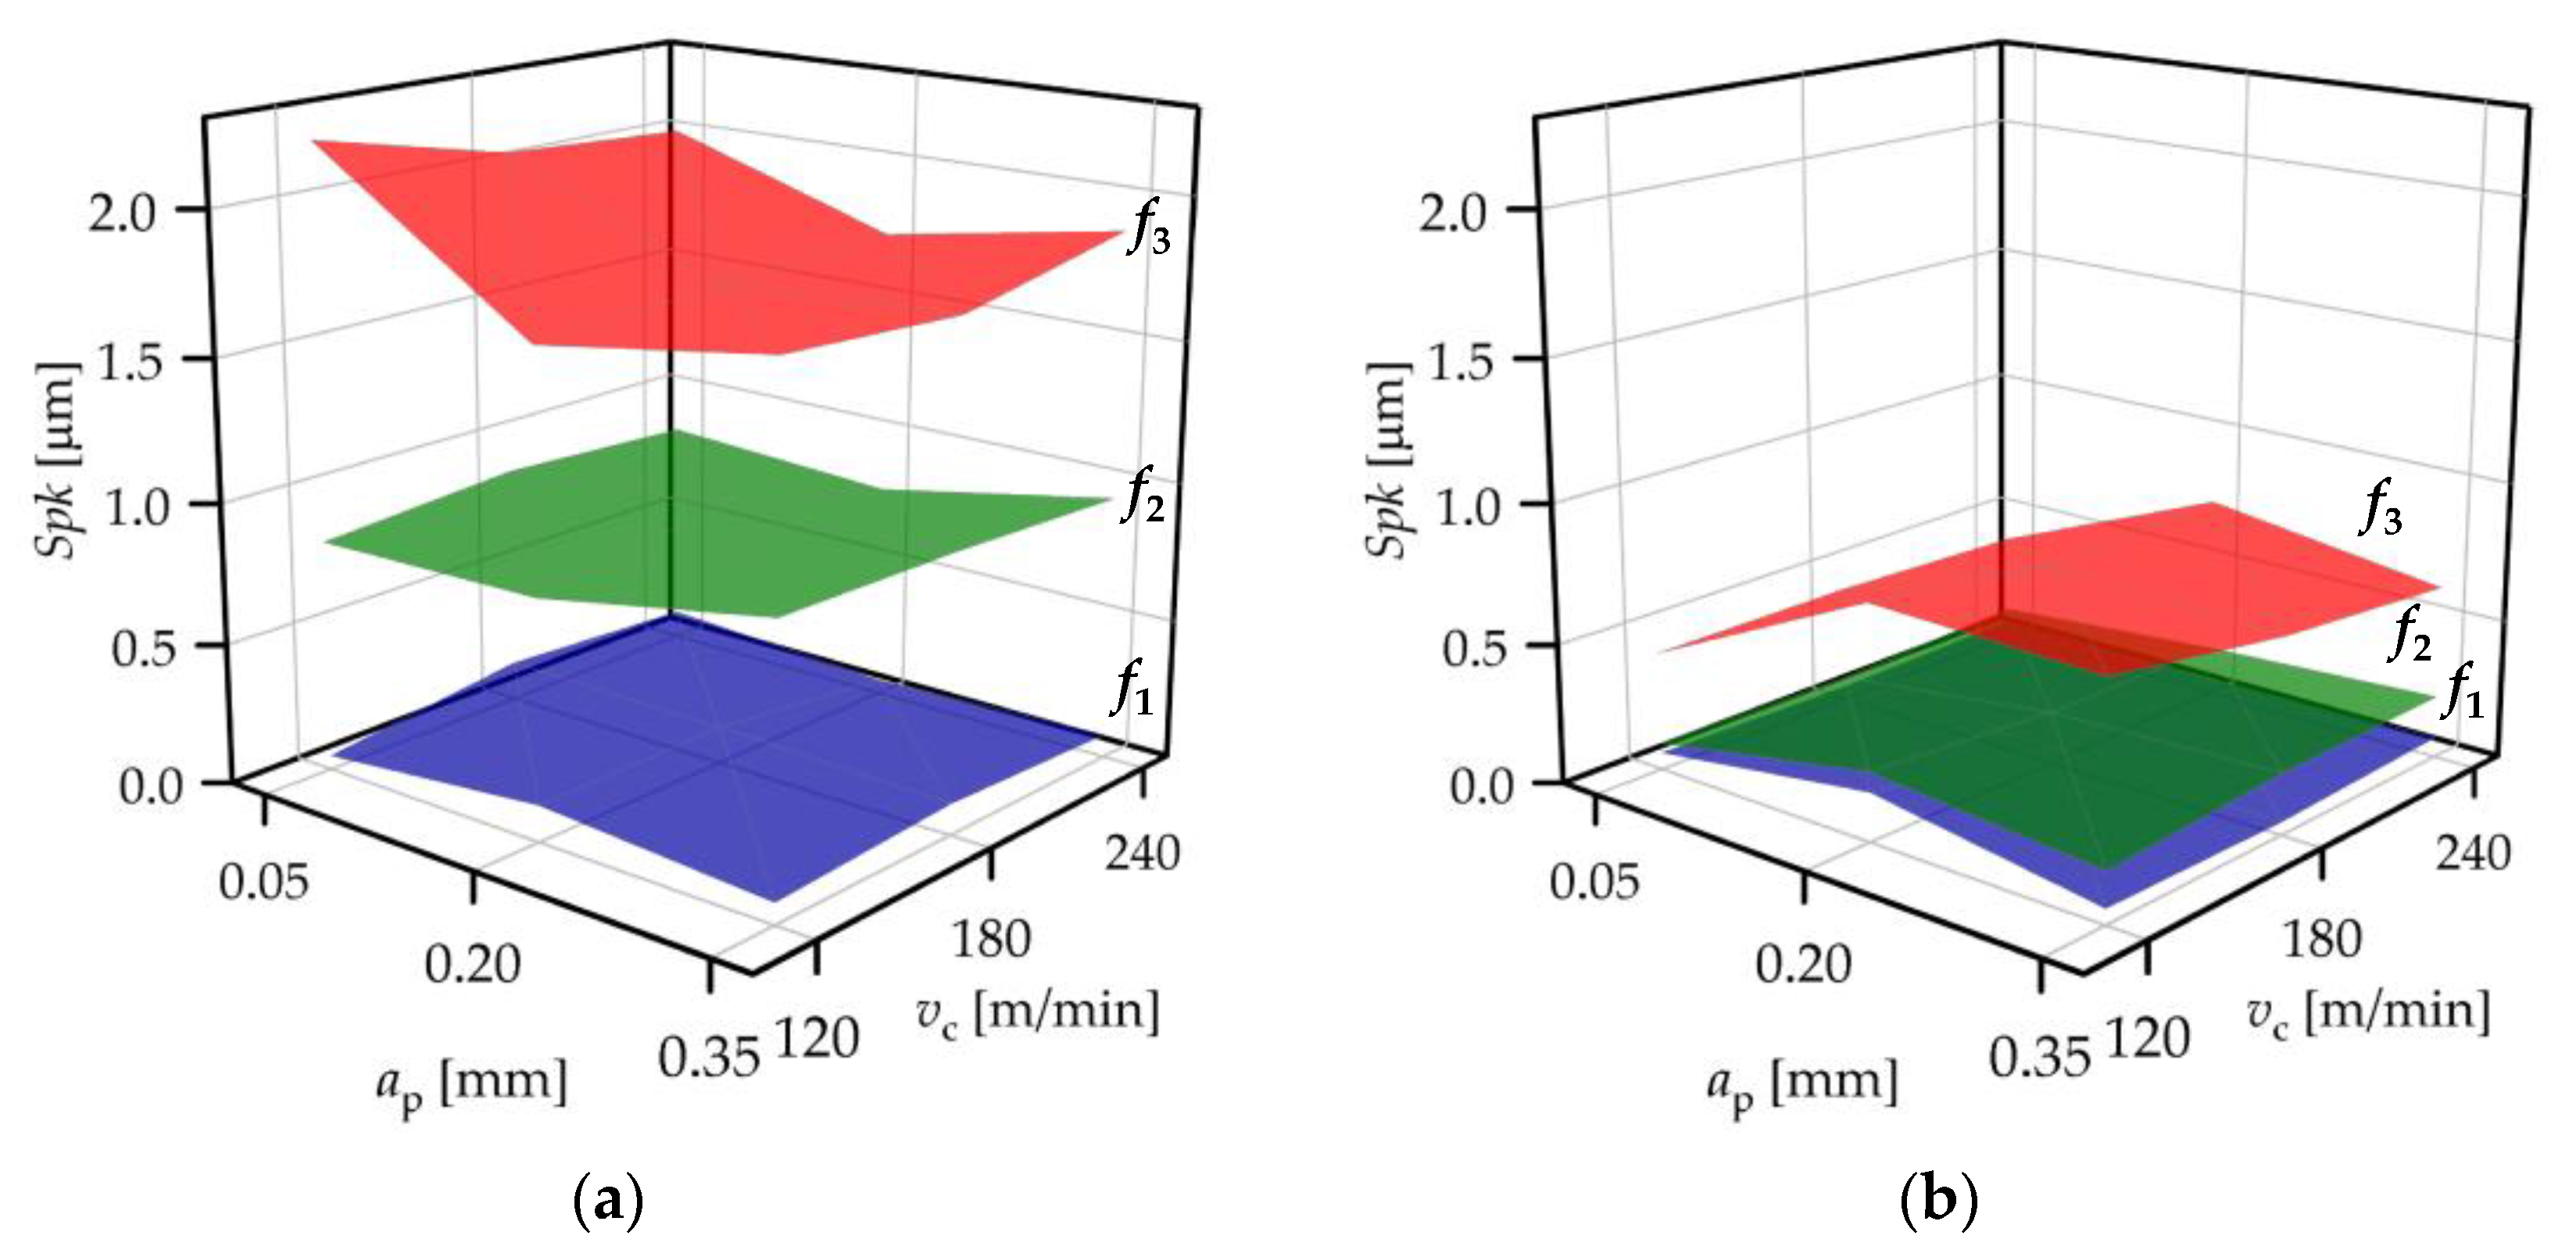
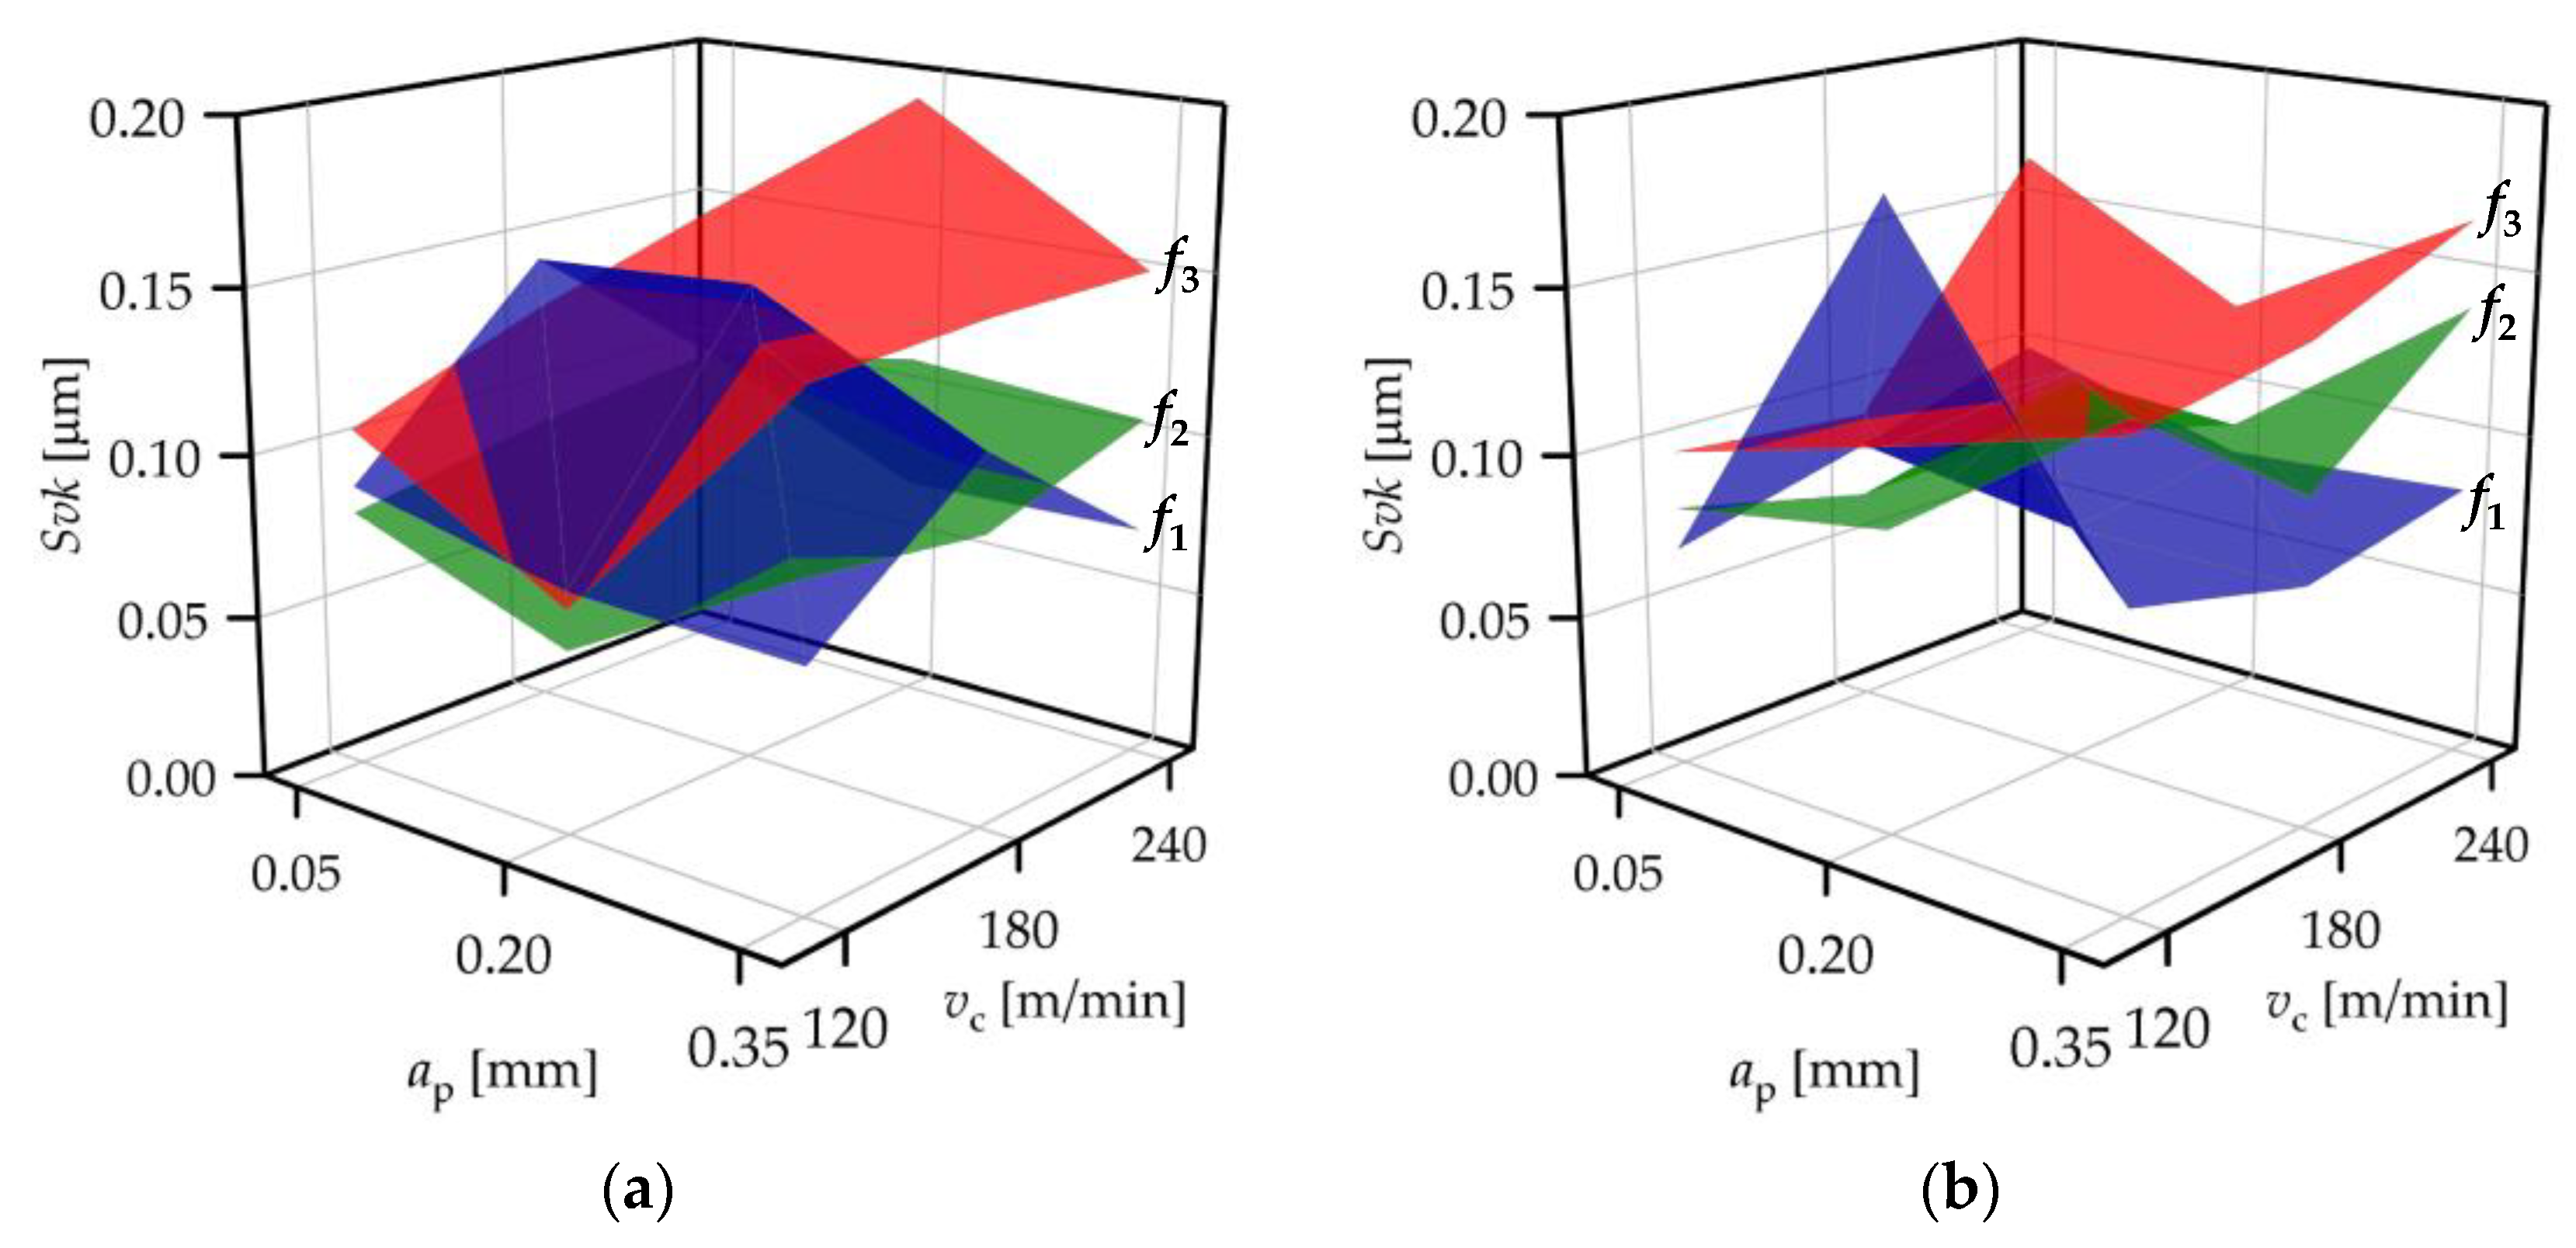
The ANOVA test provides information on whether the means of the topography parameter values connected to one cutting parameter level show significant deviation or not. The positions of the confidence intervals of the means did not provide appropriate information on the effects of cutting parameters in this study because in some cases, the normality was not fulfilled. Tendencies (e.g., whether a topography parameter increases or decreases as a function of a cutting parameter) can be analyzed by the actual values of the topography parameters. In Figure 3, Figure 4, Figure 5, Figure 6, Figure 7, Figure 8 and Figure 9 the topography parameter values are demonstrated by surface plots separated based on the feed rates applied: f1 = 0.04 mm/rev, f2 = 0.12 mm/rev, and f3 = 0.2 mm/rev. In the figures, the separated surfaces demonstrate the measured datapoints. In most of the topography parameters, the datapoints of each feed rate level are clearly separated, which is more obvious in the case of the surfaces machined by the standard insert, and not valid for the parameter Svk. Regression functions were constructed for the obtained topography data (see Section 3.3).
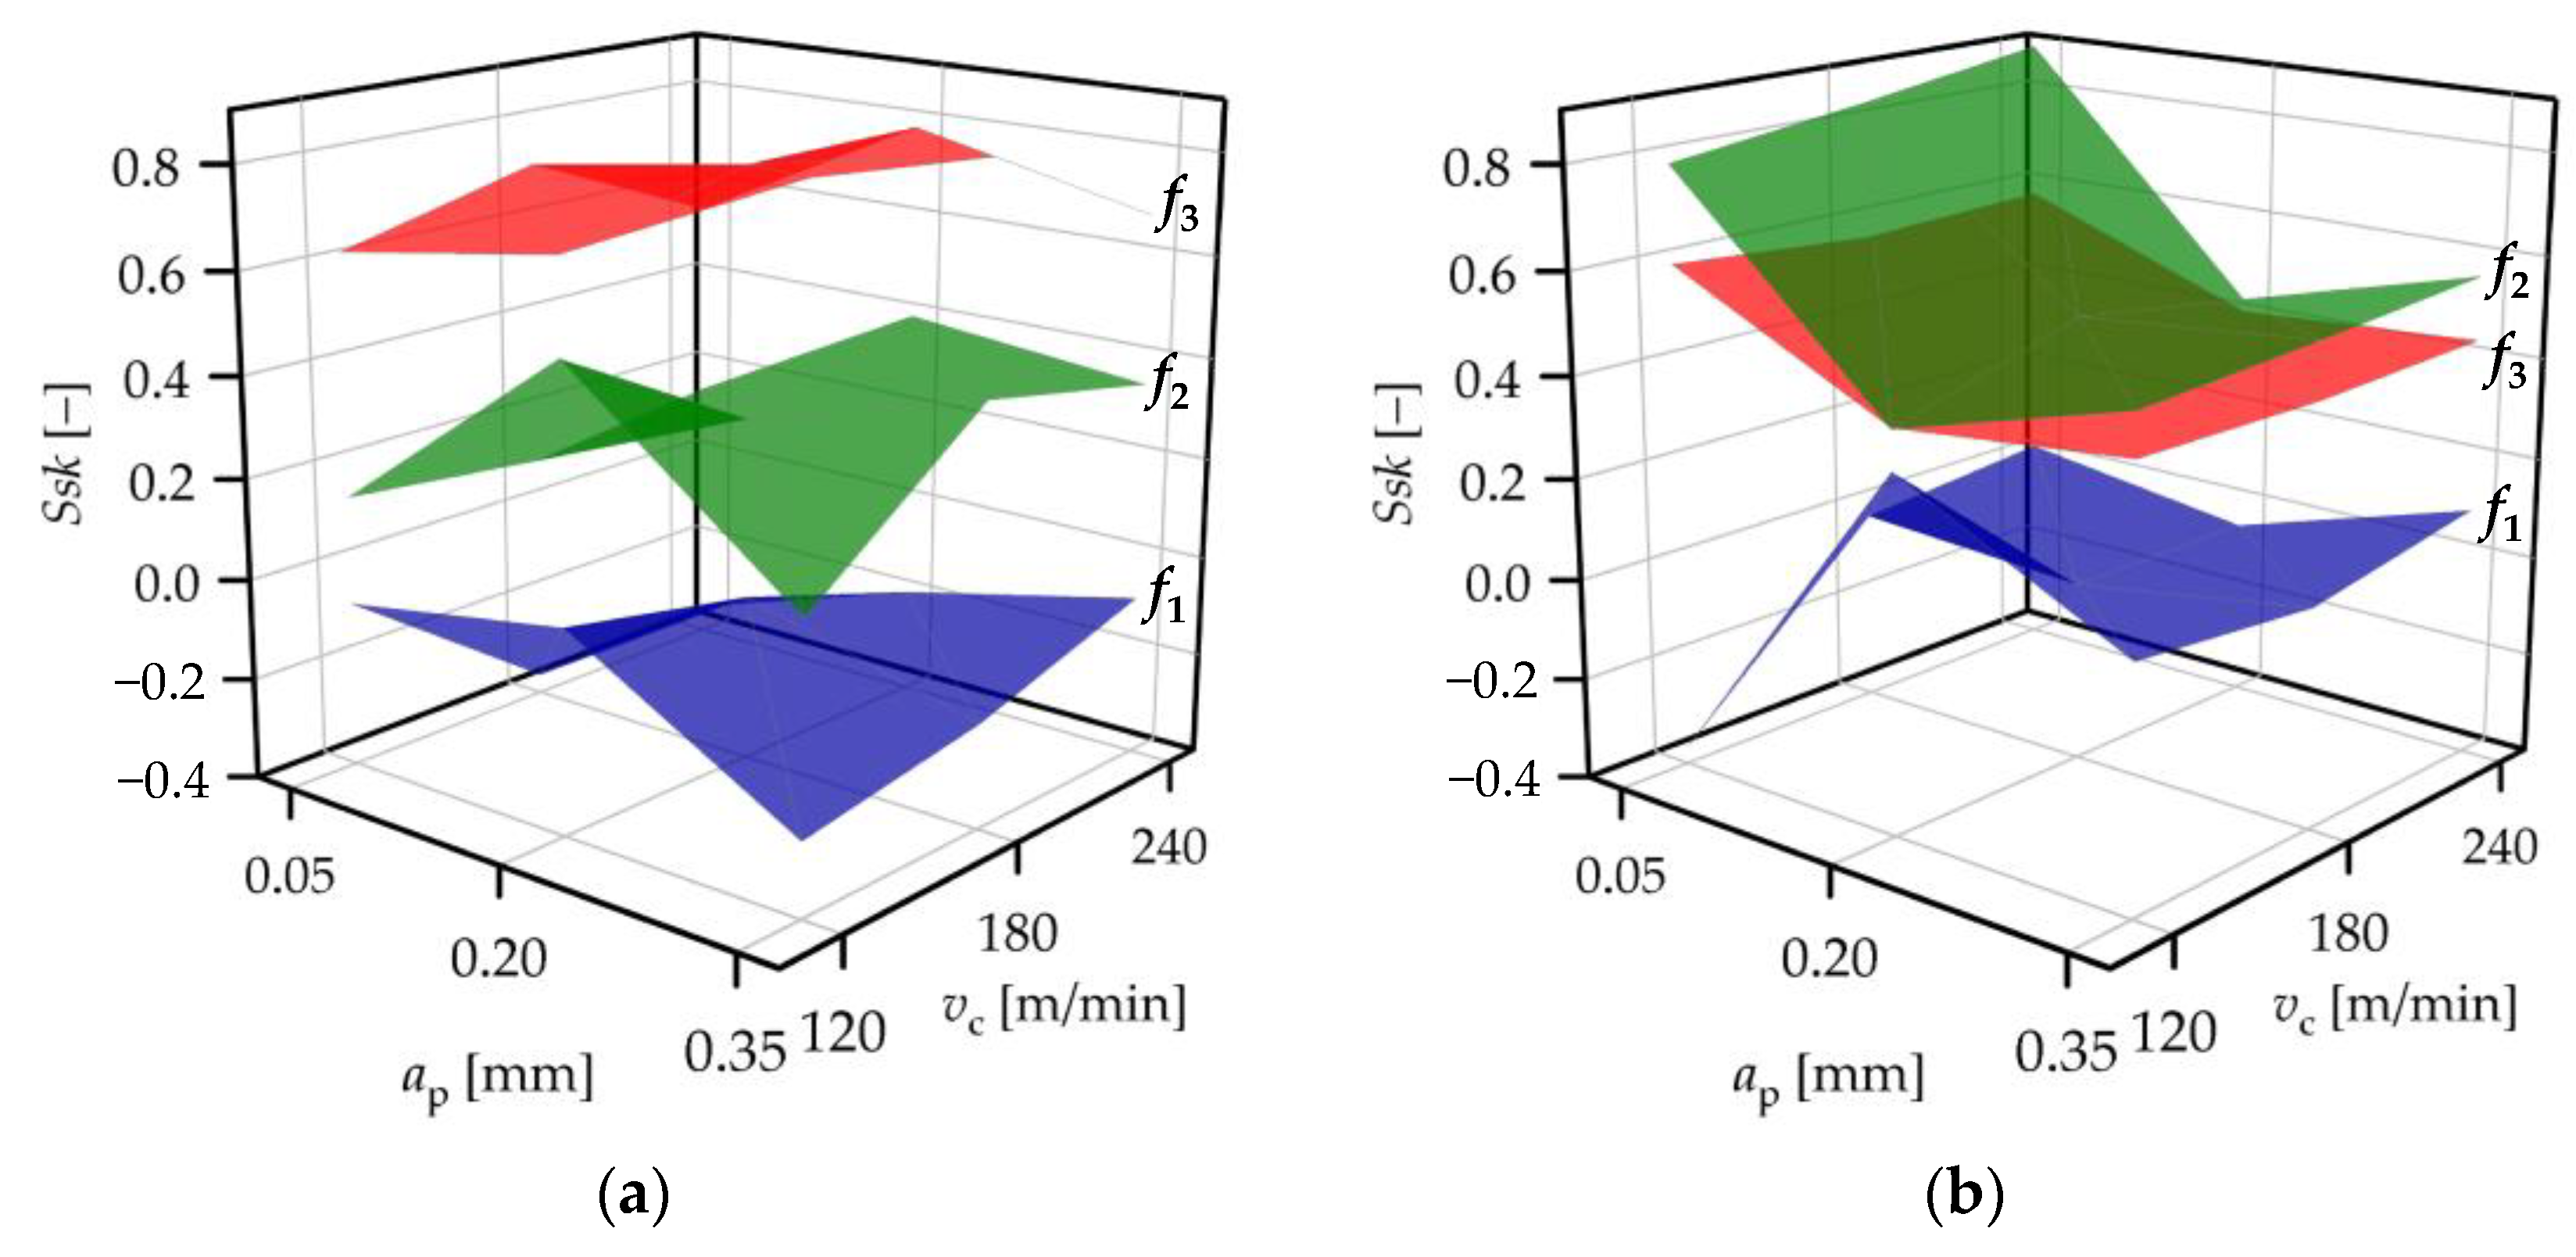
When the standard insert was used, the Ssk values varied between −0.37 and 0.30, 0.38, and 0.89, and 0.38 and 0.60 at feed rates 0.04, 0.12, and 0.2 mm/rev, respectively (Figure 3a). This indicates that there is no clear connection between the Ssk and the feed rate, because the Ssk ranges do not increase with the feed rate. When the wiper insert was used, these ranges were −0.36–0.01, 0.10–0.51, and 0.55–0.90, which indicates that the feed rate might influence the Ssk parameter, since the Ssk ranges increase with the feed rate (Figure 3b). Using the standard insert, the Ssk values vary around the value 0, and some of them are below 0 at feed rate 0.04 mm/rev. When using the wiper insert, most of the Ssk values are below 0 at the lowest feed rate. These surfaces are the most filled ones in their peak zones, i.e., the load-baring capacity and the wear resistance are the highest among the machined surfaces, which confirms the findings of [33].
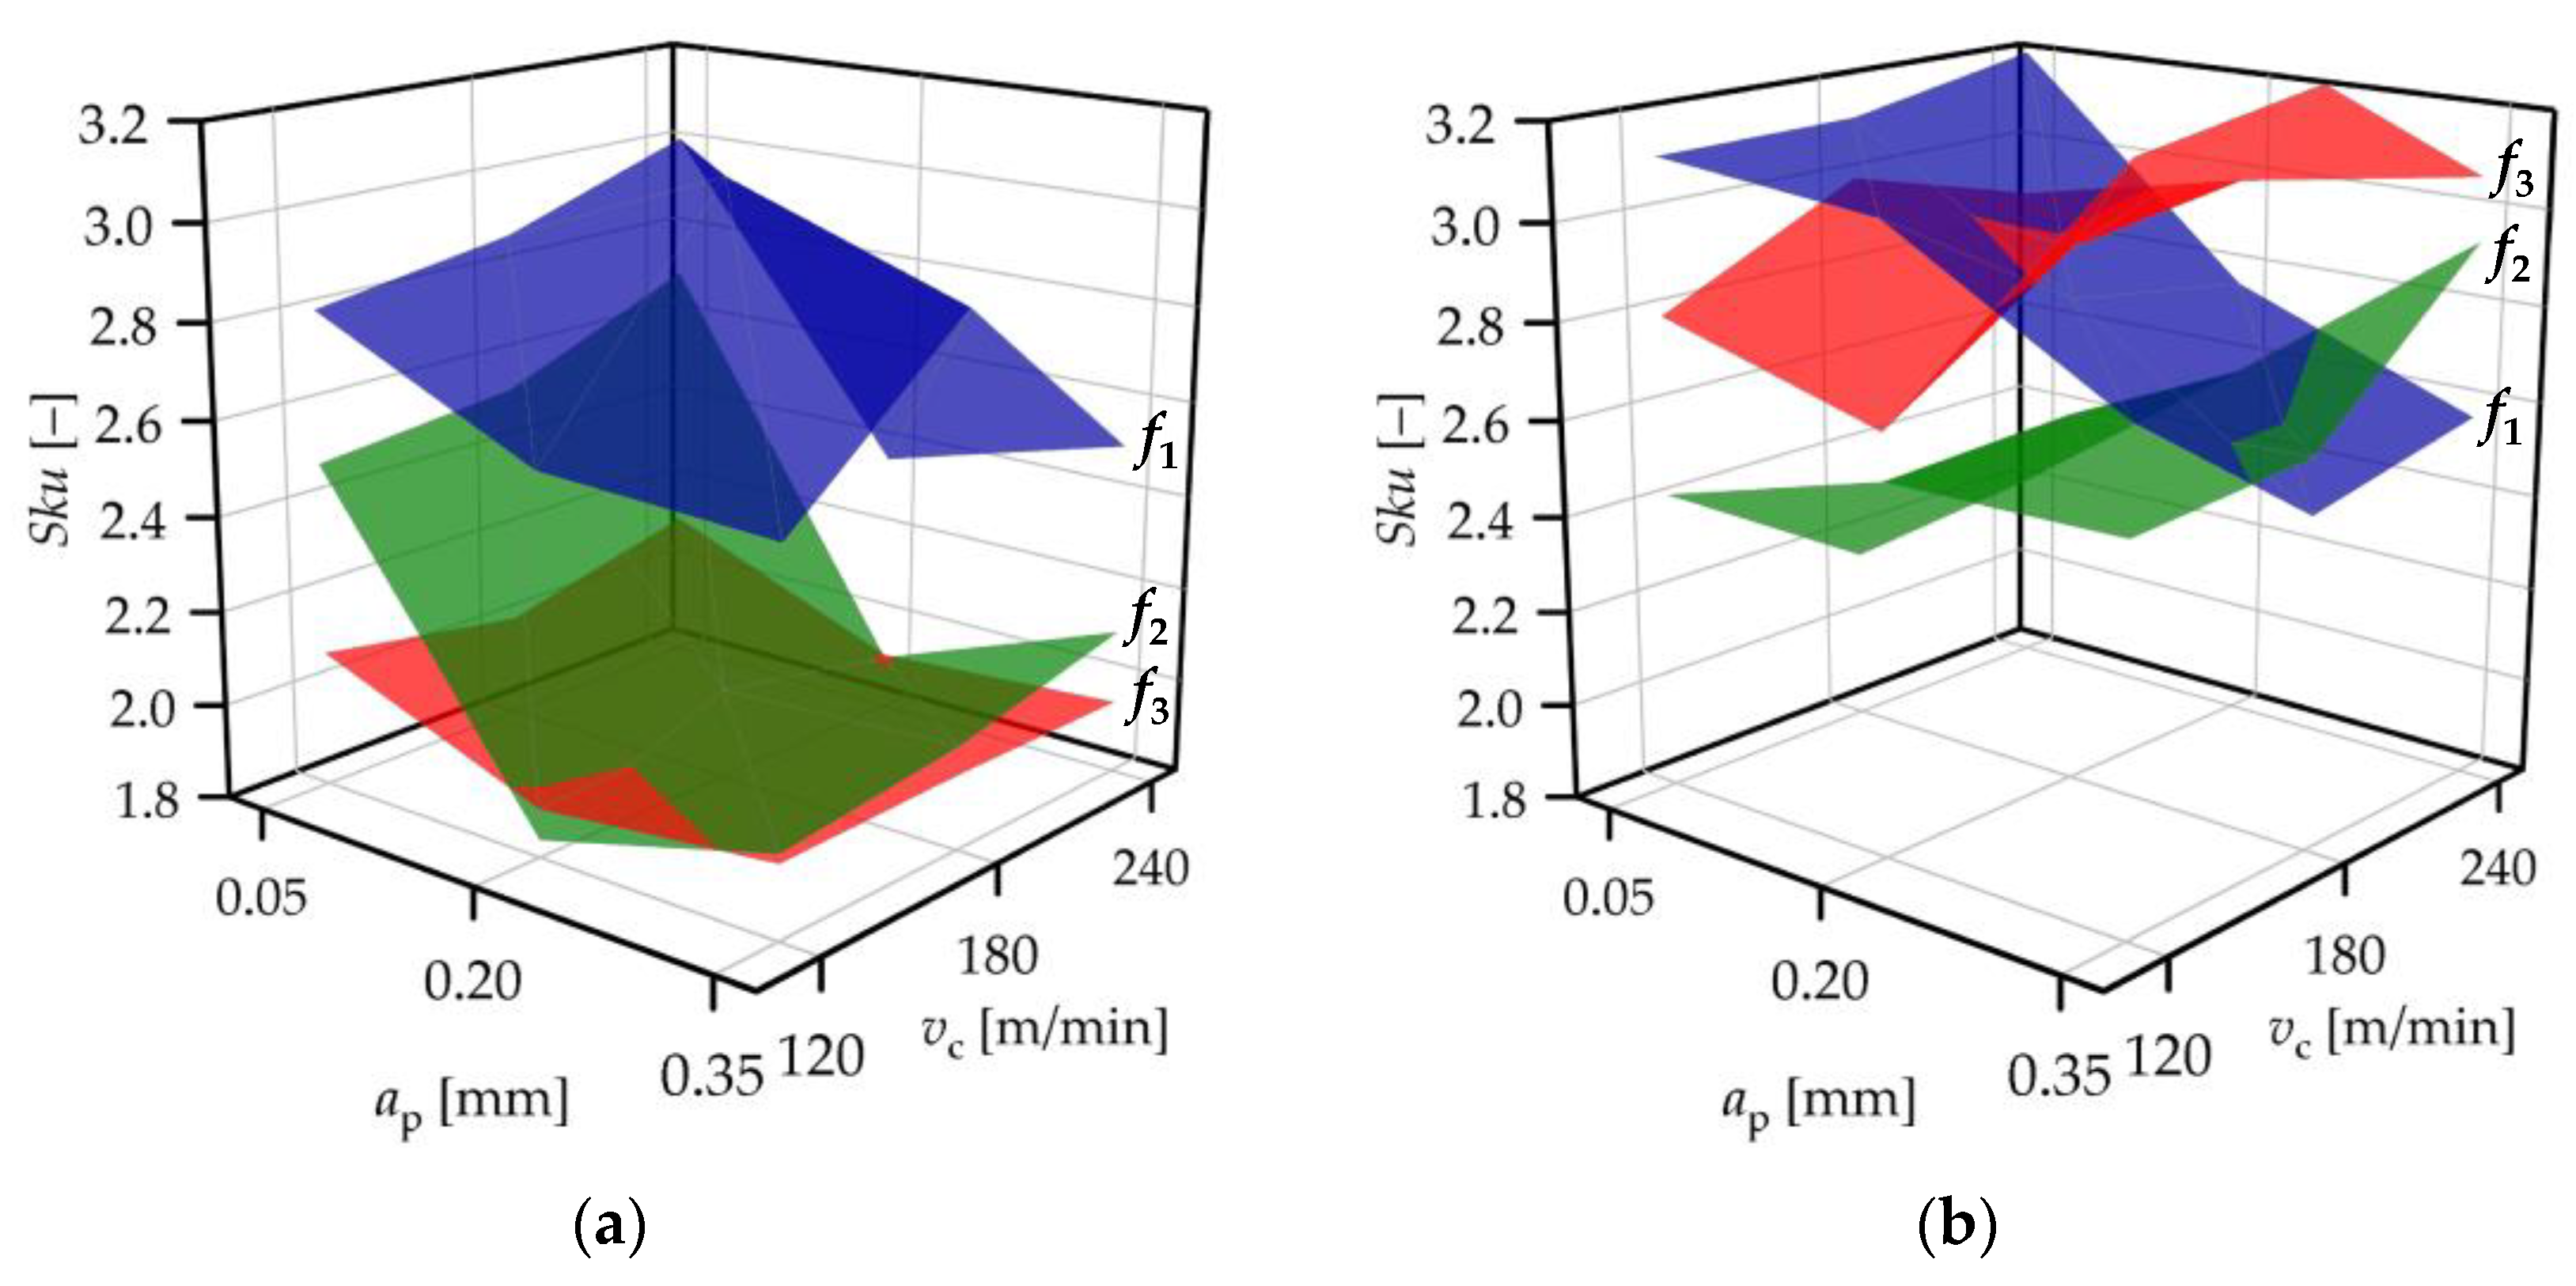
When the standard insert was used, the Sku values varied between 2.37 and 3.07, 1.84 and 2.70, and 1.90 and 2.12 at feed rates 0.04, 0.12, and 0.2 mm/rev, respectively (Figure 4a). This indicates that there is no clear connection between Sku and the feed rate, because the Sku ranges strongly overlap each other. When the wiper insert was used, these ranges were 2.49–3.20, 2.16–2.93, and 2.66–3.32, which indicates that the feed rate probably does not influence the Sku parameter. In Figure 4b, it can be observed that the Sku ranges increase with the feed rate at the levels 0.12 and 0.2 mm/rev; however, the range connected to the feed rate 0.04 mm/rev overlaps the other two. At the same time, the topography values connected to the 0.04 mm/rev feed rate decrease with the depth-of-cut, which is not valid for the other two groups. Sku provides information on the rate of sharp peaks and valleys. A kurtosis higher than 3 indicates more of these, and when the sharp peaks are worn (relatively quickly), the surface becomes more filled. The surfaces that were machined at 0.04 mm/rev by the standard insert have the Sku values closest to 3. When the wiper insert was used, the Sku values were around or above 3 at the 0.04 mm/rev feed rate and the 0.05 mm depth-of-cut cutting parameter value combination, as well as at the 0.2 mm/rev and 0.35 mm combination.
When the standard insert was used, the Sz values varied between 0.49 and 0.93 µm, 1.65 and 2.42 µm, and 4.41 and 5.51 µm at feed rates 0.04, 0.12, and 0.2 mm/rev, respectively (Figure 5a). This indicates that there is a clear connection between Sz and the feed rate, because the Sz ranges increase with the feed rate. When the wiper insert was used, these ranges were 0.46–1.12 µm, 0.68–1.03 µm, and 1.30–2.23 µm, which indicates that the feed rate might influence the Sz parameter (Figure 5b). Although the 0.04 and 0.12 mm/rev ranges overlap, the topography values connected to the 0.12 mm/rev are mostly higher at the same ap–vc combinations. A high-quality and wear-resistant surface is characterized by low Sz values, which indicates that the application of a low feed rate is best to reach this purpose.
When the standard insert was used, the Sa values varied between 0.08 and 0.13 µm, 0.34 and 0.59 µm, and1.07 and 1.34 µm at feed rates 0.04, 0.12, and 0.2 mm/rev, respectively (Figure 6a). When the wiper insert was used, these ranges were 0.06–0.16 µm, 0.12–0.18 µm, and 0.23–0.44 µm (Figure 6b). The same interpretation can be made here as in the case of Sz, and it should be noted that Sa is the most common parameter in part drawings.
When the standard insert was used, the Sk values varied between 0.22 and 0.40 µm, 0.51 and 1.28 µm, and 2.03 and 3.54 µm at feed rates 0.04, 0.12, and 0.2 mm/rev, respectively (Figure 7a). When the wiper insert was used, these ranges were 0.17–0.44 µm, 0.38–0.55 µm, and 0.64–1.20 µm, respectively (Figure 7b). The topography parameter ranges and their means are well separated, which indicates that the topography parameter values are influenced by the feed rate. The topography parameter values connected to the feed rate are relatively close to each other when the wiper insert is applied, and their means are significantly lower than the results for the standard insert.
When the standard insert was used, the Spk values varied between 0.05 and 0.14 µm, 0.79 and 1.00 µm, and 1.67 and 2.21 µm at feed rates 0.04, 0.12, and 0.2 mm/rev, respectively (Figure 8a). When the wiper insert was used, these ranges were 0.05–0.18 µm, 0.08–0.25 µm, and 0.40–0.83 µm, respectively (Figure 8b). The topography parameter ranges and their means are well-separated, which indicates that the topography parameter values are influenced by the feed rate. The topography parameter values connected to the feed rate are relatively close to each other when the wiper insert is applied, and their means are significantly lower.
When the standard insert was used, the Svk values varied between 0.07 and 0.15 µm, 0.06 and 0.11 µm, and 0.07 and 0.19 µm at feed rates 0.04, 0.12, and 0.2 mm/rev, respectively (Figure 9a). When the wiper insert was used, these ranges were 0.07–0.19 µm, 0.07–0.14 µm, and 0.09–0.17 µm, respectively (Figure 9b). It can be observed that the topography parameter values are not influenced by the feed rate, as the value ranges as well as the values are random.
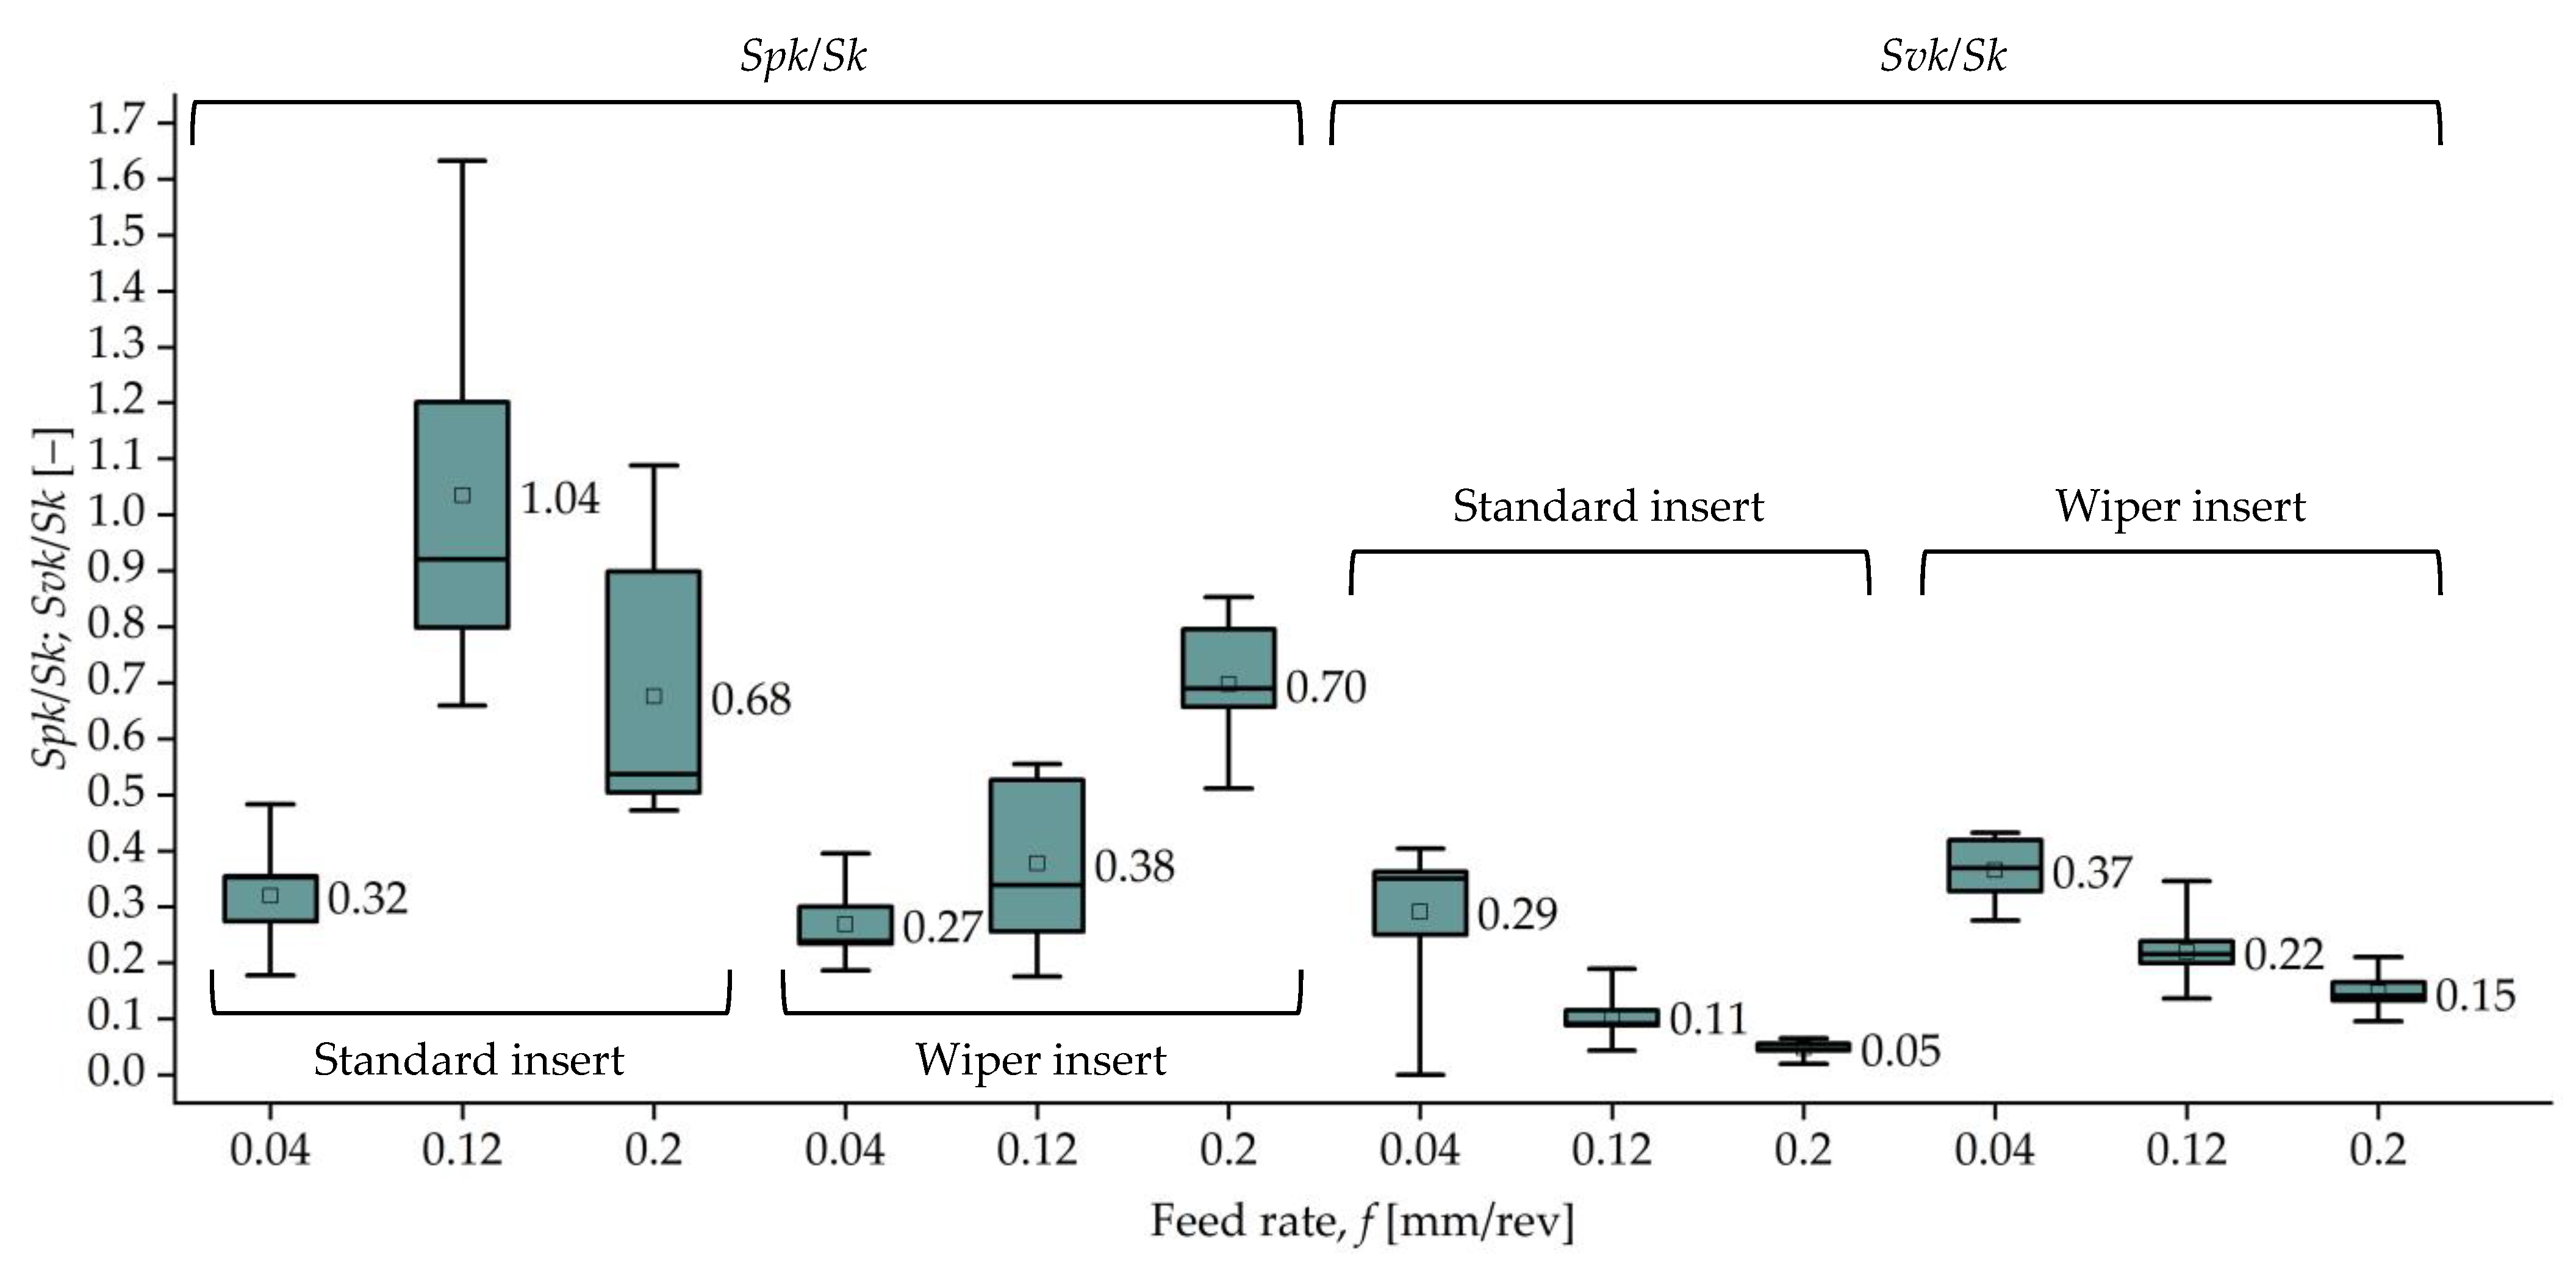
Concerning the Sk topography parameter group (Sk, Spk, and Svk), it is worth evaluating the results by coefficients created from the parameters. The Spk/Sk rate provides information on the initial wear characteristics of a contact surface. The lower its value, the shorter the initial wear phase (running-in). At the same time, when the upper part of the surface is worn, the bearing ratio is increased, which results in a better load-baring capacity. Concerning lubrication, a higher Svk/Sk rate indicates relatively low valleys, which is useful for the lubricant retention ability of a surface. Independently of the cutting insert used, low Spk/Sk rates were obtained at the lowest (f = 0.04 mm/rev) feed rate; the value of the Spk was around one-third of the Sk in both cases. Concerning the Svk/Sk rate, similar results were obtained, where the most favorable value (highest Svk/Sk rate) was the lowest feed rate. The value of Svk was around one-third of the Sk value (Figure 10). The Svk/Sk rates decreased with the feed rate in the cases of both inserts.
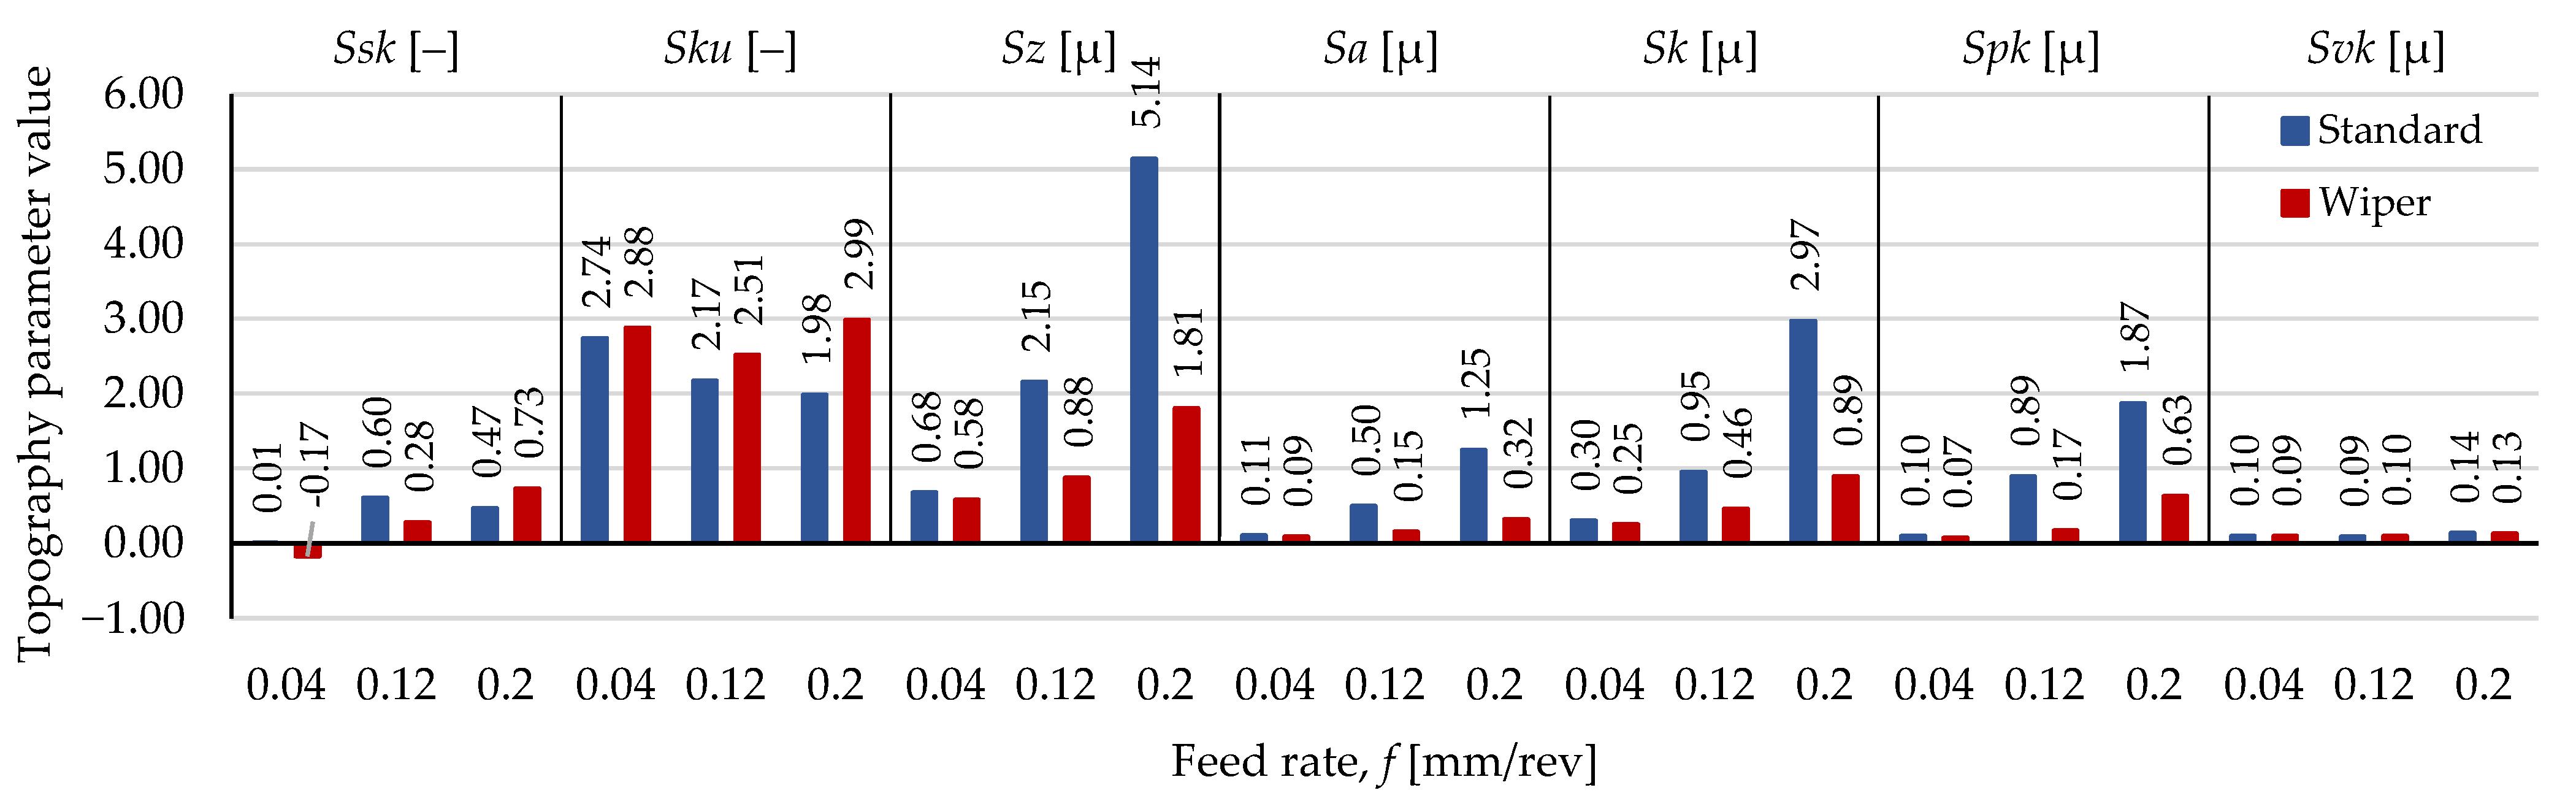
The means of the topography parameters of surfaces machined by standard and wiper inserts are presented in Figure 11. Cutting inserts with a wiper cutting edge provide favorable roughness results than the ones with standard edge under the same cutting conditions [43].
The means of the Ssk values vary around zero, and no tendency can be observed in relation to the two types of inserts. The means of the Sku values of the surfaces machined by the wiper insert are higher than those machines by standard insert. The percentage differences (if the values connected to the standard insert are 100%) are 5, 16, and 51% at 0.04, 0.12, and 0.2 mm/rev feed rates, respectively. The means of the Sz, Sa, Sk, and Spk values of surfaces machined by the wiper insert are lower than those machined by the standard insert at all of the analyzed feed rates. In the case of Sz, the percentage decreases are 14, 59, and 65% in the increasing order of the feed rate levels. These values for Sa are 16, 69, and 74%; for Sk, they are 15,52, and 70%; and for Spk, they are 27, 81, and 66%. In the case of the Svk parameter, the values connected to the wiper insert are 5% lower at 0.04 and 0.2 mm/rev feed rates and 12% higher at 0.12 mm/rev. If lower Ssk is favorable, the wiper insert is recommended at 0.04 and 0.12 mm/rev feed rates. If higher Sku yet lower Sz, Sa, Sk, and Spk are favorable, the wiper insert is recommended at all three of the analyzed feed rates. This confirms the results of [43]. The Svk values are relatively close to each other at the analyzed feed rate levels; therefore, a clear recommendation cannot be made based on the analyzed feed rates.
3.3. Response Functions for the Topography Parameters
Quadratic response functions were constructed for the obtained topography data (Equation (1)). The β coefficients are summarized in Table A2.
where S designates the topography parameter.
The response function is constructed for the measured data. The coefficient of determination (R2) is suitable to obtain information with regard to how well a response function fits the measured data. In Table 6, these values are summarized. In the case of the standard cutting insert, the Svk parameter is strong (0.49 < R2 < 0.81) and the fit of the other parameters is extremely strong (0.81 < R2 < 1).
When the wiper insert was used, strong relationships were obtained for the parameters Sku and Svk, while extremely strong for the others. These findings indicate that the quadratic form can be considered suitable.
The R2 is suitable to obtain information regarding the extent to which the cutting parameters and their interactions influence the topography parameter values (Table 7). The strongest single influencing cutting parameter is the feed rate for all of the topography parameters. If both the single parameters and their interactions are considered, the following can be stated. When the standard insert was used, the cutting parameter with the strongest influence was the feed rate in the case of the topography parameters Ssk, Sku, and Spk (41.3–97.5%); the f2 in the case of Sa, Sz, and Sk was within the range 88.6–97.12%, and the vcf interaction in the case of Svk was 38.3%. When the wiper insert was used, the most influential cutting parameter was the feed rate in the case of the topography parameter Ssk (89.9%); the f2 in the case of Sa, Sz, Sk, and Spk were in the range 83.1–86.3%, and the apf interaction in the case of Sku and Svk were in the range of 11.6–33.3%.
4. Discussion of the Results
In this study, 3D topography parameters are analyzed. Essentially, in the case of 2D topography analysis, the measurements are recommended to be repeated three times. In 3D measurement, due to the large amount of surface data, repetition is not necessary. An evaluated 3D area in this experiment incorporates 2000 2D profiles because the resolution of the 2 × 2 mm area is 1 µm in both the x and y directions. This is strengthened by the fact that the machined surfaces are homogeneous.
As a result of the topography parameter value analysis, it was found that the Ssk parameter does not increase with the feed rate when the standard insert is used, but increases when the wiper insert is used. In the case of the depth-of-cut and cutting speed, no similar tendencies were found; they are not applicable for optimizing the Ssk parameter. The Sku parameter does not increase clearly with the feed rate when either inserts were used. In the case of the depth-of-cut and cutting speed, no tendencies were found; the cutting parameters are not perfectly applicable for optimizing the Sku parameter. The Sz, Sa, Sk, and Spk parameters clearly increase with the feed rate when either insert was used. The feed rate can be applied for optimizing these topography parameters. The datapoints of a feed rate level are relatively close to each other, the surface plots are closely parallel to the axes of depth-of-cut and cutting speed, and no clear tendencies in the values were found. This indicates that the depth-of-cut and the cutting speed are not suitable for optimizing the Sz, Sa, Sk, and Spk parameters. Concerning Svk, it was found that none of the cutting parameters are capable of optimizing the Svk parameter. Similarly to the Ssk parameter, by applying the analyzed cutting parameter values, it is possible to designate topography parameter value ranges of expected values.
If the selection of the most suitable cutting parameter combination is intended based on the topography parameter values, the following findings can be summarized for the topography parameters analyzed. A low Ssk value is aimed for if a wear-resistant surface is specified. The lowest Ssk value was −0.37, which was obtained at the 0.04 mm/rev feed rate (ap = 0.05 mm; vc = 120 m/min) with the standard insert, and −0.36 at 0.04 mm/rev feed rate (ap = 0.05 mm; vc = 180 m/min) when the wiper insert was used. A low Sku value is favorable if sharp peaks should be avoided (due to debris formation); and a high value if fluid retention ability is intended. The lowest values (1.84 and 2.16) were obtained at the 0.12 mm/rev feed rate (ap = 0.2 mm; vc = 120 m/min; and ap = 0.05 mm; vc = 180 m/min) when the standard and wiper inserts were used, respectively. The highest values (3.07 and 3.32) were obtained at the 0.04 and 0.2 mm/rev feed rate (ap = 0.2 mm; vc = 180 m/min; and ap = 0.35 mm; vc = 180 m/min) when the standard and wiper inserts were used, respectively. Generally, the surface quality can be considered as high if the Sz or Sa values are low. The lowest Sz values were 0.49 and 0.46 µm; the lowest Sa values were 0.08 and 0.06 µm when the standard and wiper inserts were applied, respectively. All of these values were obtained at the 0.04 mm/rev feed rate (ap = 0.05 mm; vc = 120 m/min). A low Spk value is favorable if a wear-resistant surface is specified, and a high Svk is desirable if good lubricant retention ability is specified. The lowest Spk values (0.05 and 0.046 µm) were obtained at a 0.04 mm/ref feed rate (ap = 0.05 mm; vc = 120 m/min; and ap = 0.35 mm; vc = 180 m/min) when standard and wiper inserts were used, respectively. The highest Svk values (0.193 and 0.186 µm) were obtained at the 0.02 and 0.04 mm/ref feed rates (ap = 0.2 mm; vc = 240 m/min; and ap = 0.2 mm; vc = 120 m/min) when the standard and wiper inserts were used, respectively.
The results of the response function construction indicate that, concerning the vc and ap parameters, their influencing powers for the analyzed topography parameters are relatively low. The ap and vc themselves determine the topography values at 0.1–11.4% and 0–11.9%, respectively. The , , and the apvc terms determine the topography values at 0–9.7%, 0–10.2%, and 0.1–8.1%, respectively. The terms that incorporate the feed rate have a stronger influence on the topography parameters.
The Sa and Sz parameters are still the most frequently used and most widely known parameters for assessing the quality of a surface. The Ssk and Sku parameters can be considered difficult to use, because clear tendencies between them and the cutting parameters are relatively difficult to observe and they are ultimately sensitive to some topographical characteristics (e.g., sharp peaks).
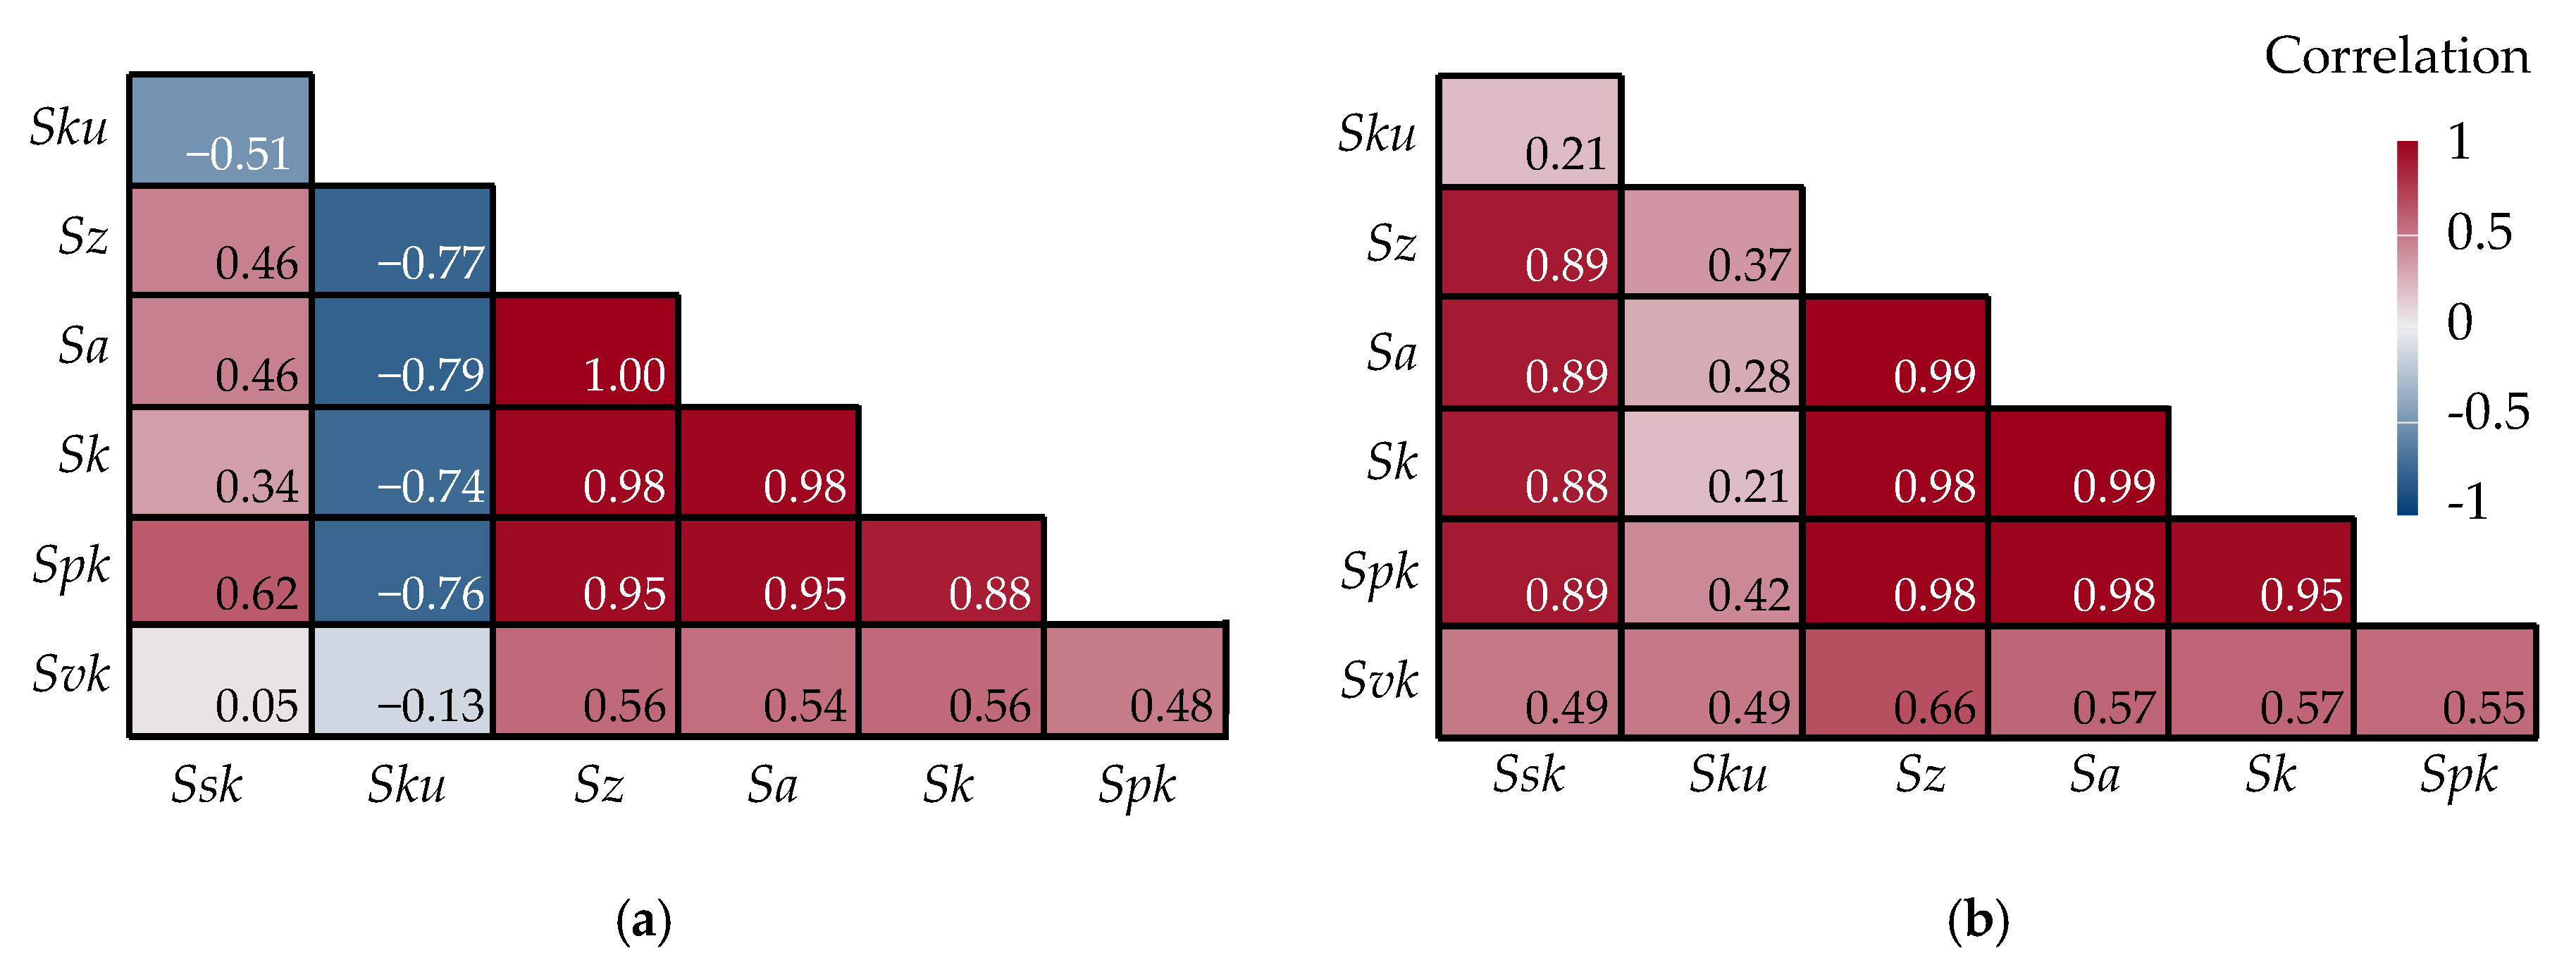
The relationship between two variables is extremely strong if 0.9 < r < 1; strong if 0.7 < r < 0.9; medium if 0.4 < r < 0.7; weak if 0.2 < r < 0.4; and extremely weak if 0 < r < 0.2. In Figure 12, the correlation coefficients (r) are summarized. Sz has an extremely strong connection with the Sa, Sk, and Spk parameters when either the standard or the wiper insert is used (0.95–1). Sa also has an extremely strong connection with Sz, Sk, and Spk (0.95–1). The correlation between Sz and Sku is strong but negative when the standard insert (−0.77) is used. The correlation between the Sz and Ssk is strong (almost extremely strong) when the wiper insert (0.89) is used. The correlation between Sa and Sku is strong but negative when the standard insert (−0.79) is used. The correlation between Sa and Ssk is strong (almost extremely strong) when the wiper insert (0.89) is used. These strong and extremely strong correlations indicate that the Sa and Sz parameters could be useful in assessing surface characteristics related to those connected to the Ssk, Sku, Sk and Spk parameters, which matches the findings of [20].
In Table 8, the correlation coefficients of parameters determining functional or tribological characteristics of a surface are summarized. The information reveals the limited applicability of the Ssk and Sku parameters. Concerning the surfaces machined by the standard insert, the Ssk parameter has a medium–strong connection with the Spk parameter. The Sku parameter has a strong, negative relationship with the Sk and Spk parameters. In the case of the wiper insert, the correlations between the Ssk–Sk and Ssk–Spk pairs are almost extremely strong; and the Ssk–Svk pair correlation is medium strength. There are also medium correlations between the Sku–Spk and the Sku–Svk pairs.
Different results were obtained when analyzing the Spk/Sk and Svk/Sk rates. When the standard insert is used, there are strong or extremely strong correlations between the Ssk–Spk/Sk and the Sku–Svk/Sk pairs and a strong negative correlation between the Ssk–Svk/Sk pair. When the wiper insert is used, there is an extremely strong correlation between the Ssk–Spk/Sk pair, a strong negative correlation between the Ssk–Svk/Sk pair, and a medium correlation between the Sku–Spk/Sk pair. If these rates are considered more exact than the single Spk and Svk parameters, it can be concluded that the Ssk parameter has a strong or extremely strong relationship with the Spk/Sk and the Svk/Sk rates. A generalizable yet strong relationship cannot be observed for the Sku parameter based on the present experimental results. This result confirms the findings of [34].
5. Conclusions
An in-depth hard turning experiment was carried out for case-hardened 16MnCr5 steel, in which the cutting parameters ap, vc, and f were varied at three levels, and two different cutting inserts were used. The cutting parameter ranges were: ap = 0.05–0.35 mm; vc = 120–240 m/min; and f = 0.04–0.2 mm/rev. Topography parameters (Ssk Sku, Sz, Sa, Sk, Spk, Svk) were analyzed based on 3D topography scanning and analysis. Based on these circumstances and process parameters, the following were found.
- A total of 126 data groups were analyzed for normality by the Shapiro–Wilk test. In 90 groups, normality could not be rejected, and in 36, the normality was rejected.
- Where the ANOVA test was carried out (normality fulfilled), the following statements can be made: the Sku, Spk, and Svk parameters were influenced by the feed rate when the standard insert was used, and Ssk and Sku were influenced by the feed rate when the wiper insert was used.
- When the standard insert was used, the strongest influencing cutting parameter was f in the case of the topography parameters Ssk, Sku, and Spk; f2 in the case of Sa, Sz, and Sk; and the vcf interaction in the case of Svk. When the wiper insert was used, the strongest influencing cutting parameter was f in the case of the topography parameter Ssk; f2 in the case of Sa, Sz, Sk, and Spk; and the apf interaction in the case of Sku and Svk.
- Based on the correlation analysis, it can be stated that the Sa and Sz parameters could be useful in assessing surface characteristics related to the functional or tribological properties connected to the Ssk, Sku, Sk, and Spk parameters.
- The Ssk parameter has a strong or extremely strong relationship with the Spk/Sk and the Svk/Sk rates, which indicates the possibility for substituting Ssk for the rate parameters.
As a generalization of the findings, the following can be stated. The feed rate of the hard turning technology is not only suitable for optimizing the maximum and the arithmetic heights of the profile, but also for optimizing other functionally important topography parameters. Correlations among the topography parameters are worth examining, because in cases where the correlation is strong, one parameter can be substituted by another with an identical purpose. It can also be stated that comprehensive statistical analyses in 3D topography studies result in numerically reliable findings.
The novelty of this study is that innovative cutting inserts were compared in an in-depth machining experiment by varying all the cutting parameters of hard turning at three levels. A widely used case-hardened material was used in the experiment and the cutting parameters were set according to the tool manufacturer’s recommendation. Topography parameters that are important in the functional behavior of contacting components were involved in the study and the relationships among them were analyzed by ANOVA, regression, and correlation analysis.
The research will be extended in the future to other, similar case-hardened material grades, such as 20MnCr5, and the topography parameters will be studied with the same statistical methods for grinding as a conventional precision machining technology in order to compare the obtained results.
Funding
This research received no external funding.
Institutional Review Board Statement
Not applicable.
Informed Consent Statement
Not applicable.
Data Availability Statement
Not applicable.
Conflicts of Interest
The author declares no conflict of interest.
Appendix A

Table A1.
Results of the Shapiro–Wilk normality test (W statistics and p value).
| Insert | Cutting Data | Ssk | Sku | Sz | Sa | Sk | Spk | Svk | ||||||||
|---|---|---|---|---|---|---|---|---|---|---|---|---|---|---|---|---|
| W | p | W | p | W | p | W | p | W | p | W | p | W | p | |||
| Standard | ap (mm) | 0.05 | 0.872 | 0.130 | 0.915 | 0.355 | 0.810 | 0.026 | 0.801 | 0.021 | 0.771 | 0.010 | 0.852 | 0.078 | 0.887 | 0.186 |
| 0.2 | 0.747 | 0.005 | 0.766 | 0.008 | 0.826 | 0.040 | 0.823 | 0.037 | 0.796 | 0.018 | 0.859 | 0.093 | 0.883 | 0.168 | ||
| 0.35 | 0.812 | 0.028 | 0.778 | 0.011 | 0.818 | 0.033 | 0.818 | 0.033 | 0.776 | 0.011 | 0.852 | 0.079 | 0.876 | 0.142 | ||
| vc (m/min) | 120 | 0.913 | 0.341 | 0.873 | 0.132 | 0.860 | 0.096 | 0.861 | 0.098 | 0.845 | 0.065 | 0.907 | 0.293 | 0.882 | 0.165 | |
| 180 | 0.901 | 0.258 | 0.800 | 0.021 | 0.852 | 0.078 | 0.854 | 0.083 | 0.814 | 0.029 | 0.884 | 0.173 | 0.899 | 0.249 | ||
| 240 | 0.937 | 0.549 | 0.893 | 0.215 | 0.853 | 0.081 | 0.849 | 0.073 | 0.826 | 0.041 | 0.872 | 0.131 | 0.918 | 0.377 | ||
| f (mm/rev) | 0.04 | 0.890 | 0.199 | 0.944 | 0.627 | 0.923 | 0.417 | 0.929 | 0.473 | 0.918 | 0.378 | 0.920 | 0.395 | 0.836 | 0.052 | |
| 0.12 | 0.884 | 0.175 | 0.857 | 0.088 | 0.738 | 0.004 | 0.781 | 0.012 | 0.870 | 0.123 | 0.924 | 0.429 | 0.939 | 0.574 | ||
| 0.2 | 0.802 | 0.021 | 0.866 | 0.112 | 0.715 | 0.002 | 0.721 | 0.002 | 0.741 | 0.004 | 0.911 | 0.321 | 0.932 | 0.503 | ||
| Wiper | ap (mm) | 0.05 | 0.919 | 0.388 | 0.872 | 0.129 | 0.865 | 0.108 | 0.894 | 0.218 | 0.921 | 0.404 | 0.720 | 0.002 | 0.768 | 0.009 |
| 0.2 | 0.913 | 0.339 | 0.910 | 0.314 | 0.889 | 0.193 | 0.874 | 0.134 | 0.902 | 0.265 | 0.793 | 0.017 | 0.881 | 0.162 | ||
| 0.35 | 0.924 | 0.426 | 0.896 | 0.231 | 0.829 | 0.044 | 0.836 | 0.053 | 0.837 | 0.054 | 0.826 | 0.040 | 0.905 | 0.282 | ||
| vc (m/min) | 120 | 0.948 | 0.667 | 0.938 | 0.561 | 0.908 | 0.304 | 0.902 | 0.263 | 0.928 | 0.460 | 0.798 | 0.020 | 0.920 | 0.396 | |
| 180 | 0.941 | 0.588 | 0.984 | 0.981 | 0.867 | 0.113 | 0.897 | 0.236 | 0.921 | 0.400 | 0.805 | 0.024 | 0.926 | 0.446 | ||
| 240 | 0.953 | 0.727 | 0.953 | 0.720 | 0.830 | 0.045 | 0.851 | 0.077 | 0.869 | 0.120 | 0.828 | 0.042 | 0.890 | 0.200 | ||
| f (mm/rev) | 0.04 | 0.928 | 0.458 | 0.914 | 0.345 | 0.599 | 0.000 | 0.696 | 0.001 | 0.798 | 0.020 | 0.563 | 0.000 | 0.629 | 0.000 | |
| 0.12 | 0.902 | 0.261 | 0.894 | 0.220 | 0.924 | 0.430 | 0.928 | 0.465 | 0.921 | 0.400 | 0.910 | 0.313 | 0.904 | 0.274 | ||
| 0.2 | 0.978 | 0.954 | 0.969 | 0.884 | 0.892 | 0.211 | 0.963 | 0.827 | 0.982 | 0.972 | 0.864 | 0.105 | 0.949 | 0.682 | ||
Table A2.
Parameters of the response functions of the topography parameters.
| β0 | β1 | β2 | β3 | β11 | β22 | β33 | β12 | β13 | β23 | ||
|---|---|---|---|---|---|---|---|---|---|---|---|
| Standard insert | Ssk | −0.7754 | −0.3392 | 0.0011 | 18.1603 | 3.8672 | 0.000000 | −57.0061 | −0.0036 | −7.0882 | −0.0009 |
| Sku | 2.6876 | −4.1695 | 0.0106 | −12.7357 | 8.6985 | −0.000027 | 29.4687 | −0.0034 | 2.5132 | 0.0022 | |
| Sa | −0.0433 | 1.2206 | 0.0004 | −0.3570 | −3.5973 | −0.000001 | 28.0512 | 0.0005 | 4.9007 | −0.0012 | |
| Sz | −0.3005 | 3.8343 | 0.0077 | −4.2442 | −11.2526 | −0.000020 | 117.8880 | −0.0008 | 20.9708 | −0.0019 | |
| Sk | 0.2555 | 6.0296 | 0.0000 | −13.8065 | −17.5195 | 0.000001 | 106.9340 | −0.0012 | 25.5389 | −0.0014 | |
| Spk | −0.3094 | −1.5050 | 0.0015 | 8.9316 | 4.2114 | −0.000005 | 13.9748 | 0.0017 | −5.4125 | −0.0008 | |
| Svk | 0.0008 | −0.1270 | 0.0018 | −1.4901 | 0.2790 | −0.000005 | 4.2648 | −0.0005 | 1.0125 | 0.0028 | |
| Wiper insert | Ssk | −0.3629 | 1.4551 | −0.0008 | 4.9441 | −5.1165 | −0.000002 | −0.0556 | 0.0046 | 2.1590 | 0.0016 |
| Sku | 4.2310 | −2.4694 | −0.0035 | −20.7776 | 1.4988 | 0.000006 | 65.8160 | −0.0001 | 17.7944 | 0.0115 | |
| Sa | 0.1477 | 0.9556 | −0.0013 | −0.6355 | −2.0748 | 0.000004 | 8.2057 | −0.0009 | 1.4354 | −0.0009 | |
| Sz | 1.3660 | 4.1173 | −0.0097 | −7.3540 | −9.4770 | 0.000026 | 49.8099 | −0.0041 | 10.7340 | 0.0050 | |
| Sk | 0.3117 | 2.1808 | −0.0027 | −0.3833 | −4.3785 | 0.000009 | 18.0677 | −0.0028 | 3.0132 | −0.0030 | |
| Spk | 0.2374 | 1.6341 | −0.0019 | −3.8877 | −4.3193 | 0.000006 | 28.2292 | −0.0010 | 6.0757 | −0.0033 | |
| Svk | 0.2625 | 0.2208 | −0.0018 | −0.9264 | −0.2793 | 0.000004 | 1.8021 | −0.0006 | 0.6701 | 0.0033 | |
References
- Mallick, R.; Kumar, R.; Panda, A.; Sahoo, A.K. Current status of hard turning in manufacturing: Aspects of cooling strategy and sustainability. Lubricants 2023, 11, 108. [Google Scholar] [CrossRef]
- Mamalis, A.G.; Kundrak, J.; Horvath, M. On a novel tool life relation for precision cutting tools. J. Manuf. Sci. Eng. 2005, 127, 328–332. [Google Scholar] [CrossRef]
- Kundrak, J.; Palmai, Z. Application of general tool-life function under changing cutting conditions. Acta Polytech. Hung. 2014, 11, 61–76. [Google Scholar] [CrossRef]
- Kundrak, J.; Mamalis, A.G.; Szabo, G.; Palmai, Z.; Gyani, K. Numerical examination of residual stresses developing during hard turning at different rake angles. Int. J. Adv. Manuf. Technol. 2017, 89, 1989–1999. [Google Scholar] [CrossRef]
- Vaxevanidis, N.M.; Kechagias, J.D.; Fountas, N.A.; Manolakos, D.E. Evaluation of Machinability in Turning of Engineering Alloys by Applying Artificial Neural Networks. Open Constr. Build. Technol. J. 2014, 8, 389–399. [Google Scholar] [CrossRef] [Green Version]
- Fountas, N.; Koutsomichalis, A.; Kechagias, J.D.; Vaxevanidis, N.M. Multi-response optimization of CuZn39Pb3 brass alloy turning by implementing Grey Wolf algorithm. Fract. Struct. Integr. 2019, 50, 584–594. [Google Scholar] [CrossRef] [Green Version]
- Jouini, N.; Revel, P.; Thoquenne, G. Influence of surface integrity on fatigue life of bearing rings finished by precision hard turning and grinding. J. Manuf. Process. 2020, 57, 444–451. [Google Scholar] [CrossRef]
- Elbah, M.; Laouici, H.; Benlahmidi, S.; Nouioua, M.; Yallese, M. Comparative assessment of machining environments (dry, wet and MQL) in hard turning of AISI 4140 steel with CC6050 tools. Int. J. Adv. Manuf. Technol. 2019, 105, 2581–2597. [Google Scholar] [CrossRef]
- Li, S.; Chen, T.; Qiu, C.; Wang, D.; Liu, X. Experimental investigation of high-speed hard turning by PCBN tooling with strengthened edge. Int. J. Adv. Manuf. Technol. 2017, 92, 3785–3793. [Google Scholar] [CrossRef]
- Arnold, D.C.M.; de Oliveira, V.C.; Kazmierczak, C.S.; Tonietto, L.; Menegotto, C.W.; Gonzaga, L.; da Costa, C.A.; Veronez, M.R. A critical analysis of red ceramic blocks roughness estimation by 2D and 3D methods. Remote Sens. 2021, 13, 789. [Google Scholar] [CrossRef]
- Zhao, T.; Zhou, J.M.; Bushlya, V.; Stahl, J.E. Effect of cutting edge radius on surface roughness and tool wear in hard turning of AISI 52100 steel. Int. J. Adv. Manuf. Technol. 2017, 91, 3611–3618. [Google Scholar] [CrossRef] [Green Version]
- Gao, H.; Ma, B.; Singh, R.P.; Yang, H. Areal surface roughness of AZ31B magnesium alloy processed by dry face turning: An experimental framework combined with regression analysis. Materials 2020, 13, 2303. [Google Scholar] [CrossRef]
- Grzesik, W.; Zak, K.; Kiszka, P. Comparison of Surface textures generated in hard turning and grinding operations. Procedia CIRP 2014, 13, 84–89. [Google Scholar] [CrossRef] [Green Version]
- Lu, X.; Hu, X.; Jia, Z.; Liu, M.; Gao, S.; Qu, C.; Liang, S.Y. Model for the prediction of 3D surface topography and surface roughness in micro-milling Inconel 718. Int. J. Adv. Manuf. Technol. 2017, 94, 2043–2056. [Google Scholar] [CrossRef]
- Charles, A.; Elkaseer, A.; Thijs, L.; Hagenmeyer, V.; Scholz, S. Effect of process parameters on the generated surface rough-ness of down-facing surfaces in selective laser melting. Appl. Sci. 2019, 9, 1256. [Google Scholar] [CrossRef] [Green Version]
- Sanaei, N.; Fatemi, A. Analysis of the effect of surface roughness on fatigue performance of powder bed fusion additive manufactured metals. Theor. Appl. Fract. Mech. 2020, 108, 102638. [Google Scholar] [CrossRef]
- Kumar, R.; Seetharamu, S.; Kamaraj, M. Quantitative evaluation of 3D surface roughness parameters during cavitation exposure of 16Cr–5Ni hydro turbine steel. Wear 2014, 320, 16–24. [Google Scholar] [CrossRef]
- Mesicek, J.; Ma, Q.P.; Hajnys, J.; Zelinka, J.; Pagac, M.; Petru, J.; Mizera, O. Abrasive surface finishing on SLM 316L parts fabricated with recycled powder. Appl. Sci. 2021, 11, 2869. [Google Scholar] [CrossRef]
- Kundrak, J.; Nagy, A.; Markopoulos, A.P.; Karkalos, N.E. Investigation of surface roughness on face milled parts with round insert in planes parallel to the feed at various cutting speeds. Cut. Tools Technol. Syst. 2019, 91, 87–96. [Google Scholar] [CrossRef]
- Wrobel, N.; Rejek, M.; Krolczyk, J.; Franka, M.; Gupta, M.K.; Sliwinski, M.; Krolczyk, G. Parametric assessment of surface topography and its influence on joint tightness of non-separable joints for thin wall applications. Appl. Sci. 2022, 12, 8917. [Google Scholar] [CrossRef]
- Yong, Q.; Chang, J.; Liu, Q.; Jiang, F.; Wei, D.; Li, H. Matt Polyurethane coating: Correlation of surface roughness on measurement length and gloss. Polymers 2020, 12, 326. [Google Scholar] [CrossRef] [Green Version]
- Shi, R.; Wang, B.; Yan, Z.; Wang, Z.; Dong, L. Effect of surface topography parameters on friction and wear of random rough surface. Materials 2019, 12, 2762. [Google Scholar] [CrossRef] [Green Version]
- Zhu, L.; Guan, Y.; Wang, Y.; Xie, Z.; Lin, J.; Zhai, J. Influence of process parameters of ultrasonic shot peening on surface roughness and hydrophilicity of pure titanium. Surf. Coat. Technol. 2017, 317, 38–53. [Google Scholar] [CrossRef]
- Liang, G.; Schmauder, S.; Lyu, M.; Schneider, Y.; Zhang, C.; Han, Y. An Investigation of the influence of initial roughness on the friction and wear behavior of ground surfaces. Materials 2018, 11, 237. [Google Scholar] [CrossRef] [Green Version]
- Sedlacek, M.; Gregorcic, P.; Podgornik, B. Use of the roughness parameters Ssk and Sku to control friction—A method for designing surface texturing. Tribol. Trans. 2017, 60, 260–266. [Google Scholar] [CrossRef]
- Naylor, A.; Talwalkar, S.C.; Trail, I.A.; Joyce, T.J. Evaluating the surface topography of pyrolytic carbon finger prostheses through measurement of various roughness parameters. J. Funct. Biomater. 2016, 7, 9. [Google Scholar] [CrossRef] [Green Version]
- Kulisz, M.; Zagórski, I.; Matuszak, J.; Klonica, M. Properties of the surface layer after trochoidal milling and brushing: Experimental study and artificial neural network simulation. Appl. Sci. 2020, 10, 75. [Google Scholar] [CrossRef] [Green Version]
- Kovacs, Z.; Viharos, Z.J.; Kodacsy, J. The effects of machining strategies of magnetic assisted roller burnishing on the resulted surface structure. Mater. Sci. Eng. 2018, 448, 012002. [Google Scholar] [CrossRef] [Green Version]
- Ba, E.C.T.; Dumont, M.R.; Martins, P.S.; Drumond, R.M.; Martins da Cruz, M.P.; Vieira, V.F. Investigation of the effects of skewness Rsk and kurtosis Rku on tribological behavior in a pin-on-disc test of surfaces machined by conventional milling and turning processes. Mater. Res. 2021, 24, e20200435. [Google Scholar] [CrossRef]
- Nagy, A. Investigation of the effect of areal roughness measurement length on face milled surface topographies. Cut. Tools Technol. Syst. 2021, 94, 60–69. [Google Scholar] [CrossRef]
- Kovalev, A.; Yazhao, Z.; Hui, C.; Meng, Y. A Concept of the effective surface profile to predict the roughness parameters of worn surface. Front. Mech. Eng. 2019, 5, 31. [Google Scholar] [CrossRef]
- Krawczyk, B.; Szablewski, P.; Mendak, M.; Gapinski, B.; Smak, K.; Legutko, S.; Wieczorowski, M.; Miko, E. Surface topography description of threads made with turning on Inconel 718 shafts. Materials 2023, 16, 80. [Google Scholar] [CrossRef]
- Peng, P.W.; Yang, J.C.; Lee, W.F.; Fang, C.Y.; Chang, C.M.; Chen, I.J.; Hsu, C.; Yang, T.S. Effects of heat treatment of selective laser melting printed Ti-6Al-4V specimens on surface texture parameters and cell attachment. Appl. Sci. 2021, 11, 2234. [Google Scholar] [CrossRef]
- Kulisz, M.; Zagórski, I.; Józwik, J.; Korpysa, J. Research, modelling and prediction of the influence of technological parameters on the selected 3D roughness parameters, as well as temperature, shape and geometry of chips in milling AZ91D alloy. Materials 2022, 15, 4277. [Google Scholar] [CrossRef]
- Karmiris-Obratanski, P.; Zagorski, K.; Cieslika, J.; Papazoglou, E.L.; Markopoulos, A.P. Surface topography of Ti 6A l4V ELI after high power EDM. Procedia Manuf. 2020, 47, 788–794. [Google Scholar] [CrossRef]
- Pawlus, P.; Reizer, R.; Wieczorowski, M. Parametric characterization of machined textured surfaces. Materials 2023, 16, 163. [Google Scholar] [CrossRef]
- Pawlus, P.; Reizer, R.; Wieczorowski, M.; Krolczyk, G. Material ratio curve as information on the state of surface topography—A review. Precis. Eng. 2020, 65, 240–258. [Google Scholar] [CrossRef]
- Johansson, S.; Nilsson, P.H.; Ohlsson, R.; Anderberg, C.; Rosen, B.G. New cylinder liner surfaces for low oil consumption. Tribol. Int. 2008, 41, 854–859. [Google Scholar] [CrossRef]
- Javidikiaa, M.; Sadeghifar, M.; Songmene, V.; Jahazi, M. Analysis and optimization of surface roughness in turning of AA6061-T6 under various environments and parameters. Procedia CIRP 2021, 101, 17–20. [Google Scholar] [CrossRef]
- Kluz, R.; Bucior, M.; Dzierwa, A.; Antosz, K.; Bochnowski, W.; Ochal, K. Effect of diamond burnishing on the properties of FSW joints of EN AW-2024 aluminum alloys. Appl. Sci. 2023, 13, 1305. [Google Scholar] [CrossRef]
- Longhai Special Steel. Available online: https://www.steelss.com/Carbon-steel/16mncr5.html (accessed on 10 January 2023).
- Balanou, M.; Karmiris-Obratanski, P.; Leszczynska-Madej, B.; Papazoglou, E.L.; Markopoulos, A.P. Investigation of surface modification of 60CrMoV18-5 steel by EDM with Cu-ZrO2 powder metallurgy green compact electrode. Machines 2021, 9, 268. [Google Scholar] [CrossRef]
- Abbas, A.T.; El Rayes, M.M.; Al-Abduljabbar, A.A.; Ragab, A.E.; Benyahia, F.; Elkaseer, A. Effects of tool edge geometry and cutting conditions on the performance indicators in dry turning AISI 1045 steel. Machines 2023, 11, 397. [Google Scholar] [CrossRef]
Figure 1.
(a) Hard turning and (b) topography measurement of the workpiece.

Figure 2.
Differences between the groups means (95% confidence interval for the mean)—(a) no significant difference, (b) significant difference, (c) significant difference and clear connection between the cutting and the topography parameter.
Figure 2.
Differences between the groups means (95% confidence interval for the mean)—(a) no significant difference, (b) significant difference, (c) significant difference and clear connection between the cutting and the topography parameter.

Figure 3.
Skewness values (Ssk) for (a) standard insert and (b) wiper insert.

Figure 4.
Kurtosis values (Sku) for (a) standard insert and (b) wiper insert.

Figure 5.
Maximum height values (Sz) for (a) standard insert and (b) wiper insert.

Figure 6.
Arithmetical mean height values (Sa) for (a) standard insert and (b) wiper insert.

Figure 7.
Sk values for (a) standard insert and (b) wiper insert.

Figure 8.
Spk values for (a) standard insert and (b) wiper insert.

Figure 9.
Svk values for (a) standard insert and (b) wiper insert.

Figure 10.
Comparison of the standard insert and wiper insert based on the Spk/Sk and Svk/Sk rates.

Figure 11.
Means of the topography parameters.

Figure 12.
Correlogram for the analyzed topography parameters—(a) standard insert, (b) wiper insert.
Figure 12.
Correlogram for the analyzed topography parameters—(a) standard insert, (b) wiper insert.

Table 1.
Physical and mechanical properties of 16MnCr5 [41].
Table 1.
Physical and mechanical properties of 16MnCr5 [41].
| Tensile Strength | Yield Strength | Elongation | Thermal Conductivity | Specific Heat | Melting Temperature |
|---|---|---|---|---|---|
| 1158 MPa | 1034 MPa | 15% | 16 N/mK | 500 J/kgK | 1370–1400 °C |
Table 2.
Chemical composition of 16MnCr5 (ISO 683-3:2022).
| C | Si | Mn | Cr | S | P |
|---|---|---|---|---|---|
| 0.14–0.19 | <0.40 | 1.00–1.30 | 0.80–1.10 | <0.035 | <0.025 |
Table 3.
Design of experiment—cutting data and the machines’ surfaces (Si).
| Cutting Speed, vc (m/min) | |||||||||||
|---|---|---|---|---|---|---|---|---|---|---|---|
| 120 | 180 | 240 | |||||||||
| Feed Rate, f (m/rev) | |||||||||||
| Insert | 0.04 | 0.12 | 0.20 | 0.04 | 0.12 | 0.20 | 0.04 | 0.12 | 0.20 | ||
| Depth-of-cut, ap (mm) | 0.05 | Standard | S1 | S2 | S3 | S4 | S5 | S6 | S7 | S8 | S9 |
| 0.20 | S10 | S11 | S12 | S13 | S14 | S15 | S16 | S17 | S18 | ||
| 0.35 | S19 | S20 | S21 | S22 | S23 | S24 | S25 | S26 | S27 | ||
| 0.05 | Wiper | S28 | S29 | S30 | S31 | S32 | S33 | S34 | S35 | S36 | |
| 0.20 | S37 | S38 | S39 | S40 | S41 | S42 | S43 | S44 | S45 | ||
| 0.35 | S46 | S47 | S48 | S49 | S50 | S51 | S52 | S53 | S54 | ||
Table 4.
Results of the normality test.
| Cutting Data | ||||||||||
|---|---|---|---|---|---|---|---|---|---|---|
| ap (mm) | vc (m/min) | f (mm/rev) | ||||||||
| 0.05 | 0.2 | 0.35 | 120 | 180 | 240 | 0.04 | 0.12 | 0.2 | ||
| Standard insert | Ssk | NR | R | R | NR | NR | NR | NR | NR | R |
| Sku | NR | R | R | NR | R | NR | NR | NR | NR | |
| Sz | R | R | R | NR | NR | NR | NR | R | R | |
| Sa | R | R | R | NR | NR | NR | NR | R | R | |
| Sk | R | R | R | NR | R | R | NR | NR | R | |
| Spk | NR | NR | NR | NR | NR | NR | NR | NR | NR | |
| Svk | NR | NR | NR | NR | NR | NR | NR | NR | NR | |
| Wiper insert | Ssk | NR | NR | NR | NR | NR | NR | NR | NR | NR |
| Sku | NR | NR | NR | NR | NR | NR | NR | NR | NR | |
| Sz | NR | NR | R | NR | NR | R | R | NR | NR | |
| Sa | NR | NR | NR | NR | NR | NR | R | NR | NR | |
| Sk | NR | NR | NR | NR | NR | NR | R | NR | NR | |
| Spk | R | R | R | R | R | R | R | NR | NR | |
| Svk | R | NR | NR | NR | NR | NR | R | NR | NR | |
Legend: NR—normality not rejected; R—normality rejected.
Table 5.
Results of the ANOVA analysis.
| Insert | Cutting Parameter | Topography Parameter | |||||||||||||
|---|---|---|---|---|---|---|---|---|---|---|---|---|---|---|---|
| Ssk | Sku | Sz | Sa | Sk | Spk | Svk | |||||||||
| F | p | F | p | F | p | F | p | F | p | F | p | F | p | ||
| Standard | ap | 0.43 | 0.658 | 2.17 | 0.137 | 0.20 | 0.820 | 0.25 | 0.784 | 0.76 | 0.477 | 0.05 | 0.948 | 0.10 | 0.903 |
| vc | 0.02 | 0.976 | 0.20 | 0.823 | 0.00 | 0.996 | 0.00 | 0.997 | 0.00 | 1.000 | 0.00 | 0.997 | 2.67 | 0.090 | |
| f | 36.49 | 0.000 | 26.04 | 0.000 | 404.5 | 0.000 | 371.5 | 0.000 | 101.3 | 0.000 | 547.1 | 0.000 | 6.87 | 0.004 | |
| Wiper | ap | 0.55 | 0.584 | 0.17 | 0.846 | 0.87 | 0.434 | 0.84 | 0.442 | 0.52 | 0.601 | 0.96 | 0.398 | 1.67 | 0.208 |
| vc | 0.03 | 0.972 | 0.01 | 0.985 | 0.11 | 0.900 | 0.11 | 0.896 | 0.08 | 0.921 | 0.08 | 0.924 | 0.6 | 0.556 | |
| f | 107.2 | 0.000 | 10.31 | 0.001 | 68.37 | 0.000 | 68.62 | 0.000 | 75.6 | 0.000 | 70.3 | 0.000 | 3.73 | 0.039 | |
Table 6.
Coefficients of determination (R2) for the measured data.
| Insert | Topography Parameter | ||||||
|---|---|---|---|---|---|---|---|
| Ssk | Sku | Sa | Sz | Sk | Spk | Svk | |
| Standard | 83.1% | 85.9% | 99.6% | 99.6% | 98.3% | 98.7% | 69.3% |
| Wiper | 95.3% | 71.9% | 94.1% | 95.2% | 92.3% | 97.1% | 54.7% |
Table 7.
Coefficients of determination (R2) for the cutting parameters and their interactions.
| Insert | Topography Parameter | Cutting Parameters | ||||||||
|---|---|---|---|---|---|---|---|---|---|---|
| ap | vc | f | ap2 | vc2 | f2 | apvc | apf | vcf | ||
| Standard | Ssk | 1.5% | 0.2% | 41.3% | 0.8% | 0.2% | 27.1% | 1.2% | 5.7% | 33.1% |
| Sku | 9.7% | 0.2% | 63.3% | 6.5% | 0.1% | 54.5% | 7.4% | 47.1% | 44.6% | |
| Sa | 1.4% | 0.0% | 93.8% | 1.0% | 0.0% | 96.9% | 1.0% | 50.1% | 69.5% | |
| Sz | 1.2% | 0.0% | 93.6% | 0.9% | 0.0% | 97.1% | 1.0% | 49.8% | 70.6% | |
| Sk | 3.6% | 0.0% | 82.2% | 2.3% | 0.0% | 88.6% | 2.7% | 56.8% | 61.7% | |
| Spk | 0.1% | 0.0% | 97.5% | 0.0% | 0.0% | 96.2% | 0.1% | 32.1% | 72.7% | |
| Svk | 0.1% | 11.9% | 21.8% | 0.2% | 10.2% | 28.2% | 1.9% | 15.8% | 38.3% | |
| Wiper | Ssk | 2.4% | 0.2% | 89.9% | 1.5% | 0.2% | 86.7% | 1.9% | 50.2% | 65.1% |
| Sku | 1.1% | 0.0% | 2.1% | 1.3% | 0.0% | 7.1% | 0.8% | 11.6% | 2.2% | |
| Sa | 2.3% | 0.5% | 79.7% | 1.1% | 0.4% | 84.8% | 0.9% | 48.4% | 54.6% | |
| Sz | 3.6% | 0.3% | 78.0% | 2.2% | 0.2% | 84.2% | 1.9% | 53.5% | 56.5% | |
| Sk | 1.6% | 0.4% | 82.7% | 0.8% | 0.3% | 86.3% | 0.5% | 45.9% | 57.0% | |
| Spk | 4.4% | 0.5% | 75.0% | 2.8% | 0.5% | 83.1% | 2.3% | 55.8% | 50.7% | |
| Svk | 11.4% | 0.1% | 20.9% | 9.7% | 0.2% | 23.1% | 8.1% | 33.3% | 23.4% | |
Table 8.
Correlations for the tribology-related topography parameters.
| Topography Parameter | ||||||
|---|---|---|---|---|---|---|
| Insert | Sk | Spk | Svk | Spk/Sk | Svk/Sk | |
| Standard | Ssk | 0.34 | 0.62 | 0.05 | 0.89 | −0.73 |
| Sku | −0.74 | −0.76 | −0.13 | −0.19 | 0.94 | |
| Wiper | Ssk | 0.88 | 0.89 | 0.49 | 0.92 | −0.82 |
| Sku | 0.21 | 0.42 | 0.49 | 0.53 | 0.28 | |
Disclaimer/Publisher’s Note: The statements, opinions and data contained in all publications are solely those of the individual author(s) and contributor(s) and not of MDPI and/or the editor(s). MDPI and/or the editor(s) disclaim responsibility for any injury to people or property resulting from any ideas, methods, instructions or products referred to in the content. |
© 2023 by the author. Licensee MDPI, Basel, Switzerland. This article is an open access article distributed under the terms and conditions of the Creative Commons Attribution (CC BY) license (https://creativecommons.org/licenses/by/4.0/).
Share and Cite
MDPI and ACS Style
Molnar, V. Influence of Cutting Parameters and Tool Geometry on Topography of Hard Turned Surfaces. Machines 2023, 11, 665. https://doi.org/10.3390/machines11060665
AMA Style
Molnar V. Influence of Cutting Parameters and Tool Geometry on Topography of Hard Turned Surfaces. Machines. 2023; 11(6):665. https://doi.org/10.3390/machines11060665
Chicago/Turabian StyleMolnar, Viktor. 2023. "Influence of Cutting Parameters and Tool Geometry on Topography of Hard Turned Surfaces" Machines 11, no. 6: 665. https://doi.org/10.3390/machines11060665
Note that from the first issue of 2016, this journal uses article numbers instead of page numbers. See further details here.