Article

Experimental Investigation and Modeling of Force-Induced Surface Errors for the Robot-Assisted Milling Process

1
Shanghai Hanghe Intelligent Technology Corporation, Shanghai 201699, China
2
School of Mechanical Engineering, Shanghai Jiao Tong University, Shanghai 200240, China
*
Author to whom correspondence should be addressed.
These authors contributed equally to this work.
Machines 2023, 11(6), 655; https://doi.org/10.3390/machines11060655
Submission received: 23 April 2023 / Revised: 9 June 2023 / Accepted: 15 June 2023 / Published: 18 June 2023
(This article belongs to the Special Issue Advanced Manufacturing and Quality Control for Engines)

Abstract

:
A series of experiments were performed aiming at controlling milling force-induced surface errors in the robot-assisted milling process, for the sub-area of the multi-stiffener reinforced inner wall of complex cylindrical thin-walled casting parts, to investigate the relationship between surface errors, milling forces, and robot-assisted milling parameters. Firstly, based on the design of experiments (DoE) method, milling forces and surface errors were investigated based on a series of experiments with different groups of milling parameters. Secondly, the modeling of milling forces, surface errors, and milling parameters was realized by means of response surface methodology (RSM), then the parametric expression was obtained of the robot-assisted milling process. Finally, the parameters of the milling process toward the surface error were obtained based on an evolutionary algorithm. The results show that the surface errors are different for the different milling styles of down milling and up milling. In up milling processes, the surface errors are positive, and the actual material removal amounts are generally higher than the nominal ones, while negative in down milling processes. The surface errors induced by milling forces can be effectively controlled and reduced using process optimization in the robot-assisted milling process, while maintaining relatively high milling forces and high machining efficiency. This provides theoretical support for industry applications.

1. Introduction

Complex cylindrical parts are widely used in machinery in the aerospace field, engineering, and other fields, due to their light weight, simple casting molding process, and complex internal geometric structure for carrying various types of onboard electrical equipment and other devices [1,2,3,4,5], such as aerospace cabins and other key structural components. The quality of the finish processing is significant in improving reliability and application performance. With technical improvements being achieved in the casting modeling process, the structural integration of the cylindrical parts is becoming more and more complex. These new properties require not only a gradual increase in the design accuracy of the cylindrical structure parts, but also the development of processing and manufacturing technology to keep pace with the product development. The milling of casting cylindrical parts is the typical surface multi-area machining process, with complex structure, a large amount of material removal, and a long manufacturing time. As a necessary process of cylindrical part processing, the milling process of casting cylindrical parts is an important step to controlling the accuracy of the final wall thickness, and guaranteeing processing efficiency. However, nowadays, the milling process of casting cylindrical parts mainly relies on workers’ experience to achieve milling trajectories by artificial teaching and offline programming, due to the lack of a wall-thickness-oriented control model, which relies on the ideal model and stable milling conditions. This process fails to deal with the casting geometric variations in the cylindrical part, and leads to the milling errors of thickness or overcutting. What is more, the robotic milling process generally needs to be manually programmed for different workpieces, which is labor-intensive, low-efficiency, has poor dimensional accuracy and batch-production consistency, and struggles to meet the needs of multi-model and batch production.
Robotic-assisted milling has many advantages, such as good flexibility, large working space, and low equipment cost. It is more and more widely used in the machining process of multi-species and small batch parts [6], which can achieve efficient machining of multi-species parts with different size specifications. However, due to the weak rigidity characteristics both of the robotic-assisted milling system, and the thin-walled cylindrical parts, it is difficult to control the surface errors induced by the milling forces in the milling process [7]. Compared to computer numerical control (CNC) machine tools, the stiffness of the robotic-assisted milling system, consisting of industrial heavy-duty robots, is only 1/50 to 1/20 of the general CNC machine tools [8]. According to previous studies, approximately 1 mm of trajectory deviation will be generated under the cutting force of 500 N at the end of the industrial robotic milling system, whereas the trajectory deviation is less than 0.01 mm on the end of CNC machine tools under the same load. Nowadays, the process design and offline programming of robotic-assisted milling systems for casting cylindrical parts mainly rely on repeated manual adjustments according to workers’ experience [9], which is unstable, and sensitively affected by working conditions, resulting in low efficiency and precision. Therefore, the key issue to improving the application capability of the robot-assisted milling system is learning how to realize machining-error control in the process of robotic-assisted milling for thin-walled and weak rigid cylindrical parts. The typical robotic-assisted milling process for casting cylindrical parts is shown in Figure 1 below.
In the process of robotic-assisted milling, machining error is not only a common parameter for evaluating the quality of machined surfaces, but also a key index used to reflect the machining process capability. Both are closely related to the process parameters [10]. Therefore, we intend to study the parametric expression of the milling force in the machining process with different milling parameters, and to establish expression models of the relationship between the milling parameters and the milling force, as well as the surface error after machining [11,12]. This will optimize the performance of the milling process, and improve processing technology for the robotic-assisted milling processes used in casting cylindrical parts.
In recent years, several studies have been conducted on the effect of process parameters on the milling quality. Abou-El-Hossein et al. [13] investigated the statistical law between different milling parameters and milling forces, based on a large amount of experimental data using the response surface method, and established a cutting force model with prediction validation. Ratnam et al. [14] investigated the effect of process parameters on machining performance during turn-mill machining using the Taguchi method, and the experiment results show that the amount of feed, cutting speed, and cutting depth have different degrees of influence on the surface roughness and surface hardness. Ni et al. [15] conducted robotic-assisted milling experiments on 7075-T651 high-strength aerospace aluminum alloy under certain postures. The effect of process parameters such as milling depth, spindle speed, and feed rate on the milling performance was investigated by introducing contribution rate, based on the analysis of variance (ANOVA), considering the milling load and surface quality as the study objects. The results showed that the contribution of milling depth to the milling load was 69.25%. In addition, the surface quality after milling will directly affect the overall performance of the machined parts. Vakondios et al. [16] investigated the effect of different milling strategies on the surface roughness of the end milling of the Al7075-T6 alloy. For each milling strategy, milling experiments were conducted under different cutting conditions, and mathematical models of surface roughness for each strategy were established, based on regression analysis and the ANOVA method. Hassanpour et al. [17] measured the surface roughness of a nickel-based alloy at different milling speeds, feed rates, and milling depths, and established a quadratic model for predicting the surface roughness based on experimental data analysis. The model showed that the feed rate had the greatest effect on the surface roughness. The material removal rate is the main dynamic characteristic that affects the machining surface error during the robot-assisted milling process. Persoons et al. [18] studied and analyzed the robot cutting parameters based on the traditional cutting theory, and pointed out that there is a coupling relationship between the robot cutting removal rate and cutting force. A dynamic model was proposed, to predict the surface quality of the workpiece. In addition, Huang et al. [19] showed that normal cutting force, tangential feed rate, and tool speed are also important factors affecting the material removal rate, and the study by Whitney [20] and Ren [21] also showed similar conclusions. To further calculate the effect of cutting parameters on the material removal rate, Song et al. [22] discussed and quantified the relationship between feed rate, tool speed, robot stiffness, cutting force, and material removal rate (MRR), and a prediction model of material removal speed was developed, to predict the error due to the variation in material removal speed during the robot-assisted milling process.
In most of the aforementioned studies, the effects of material properties were considered, as well as the machining methods and the robot itself, on the machining performance of the robotic assistant. However, there is less research on the influence law between milling process parameters; such as milling depth, spindle speed, feed rate; and milling force as well as surface error under a certain position of the robot milling processing system, which cannot effectively guide the accurate regulation of the robot milling processing error of the inner wall of casting cylindrical parts.
Robot-assisted milling parameters are directly related to the machining quality, efficiency, and performance of the milling system. Generally, the design of process parameters is mostly based on the experience of mechanical engineers. A great deal of research by academics has focused on designing process parameters for different milling processes [23,24].
In terms of improving the quality of the milling process, Xu et al. [25] studied the comprehensive effects of milling process parameters and robot posture on machining results through extensive experiments, and effectively reduced the cutting forces to improve the surface quality, based on a multi-objective optimization method. S.vijay et al. [26] optimized the process parameters, such as milling speed, feed per tooth, and milling depth in the milling process, using the Taguchi method and ANOVA, and achieved a better machining efficiency. Based on this, Hou et al. [27] combined the Taguchi method, response surface methodology, and genetic algorithm for parameter design, and applied them to the parameter optimization of the milling process. The optimal milling parameters were obtained, to improve the milling machining capacity and machining quality. In considering the machining time and energy consumption, Li et al. [28] optimized the spindle speed and feed rate for different combinations of cutting depth and cutting width parameters, considering the cutting energy efficiency and machining time cost as the optimization objectives. E. Budak et al. [29] optimized the process parameters with maximum material removal rate as the optimization objective, and with machining surface quality and machining power as constraints in robot-assisted milling. Y Altinas et al. [30] established a cutting parameter optimization model, to maximize the material removal rate, by selecting the cutting speed, feed rate, cutting depth, and cutting width. Kumar et al. [31] obtained the key parameters in end milling using the Taguchi method for the modeling and optimization of cutting parameters, and the optimal milling process parameters were determined based on a genetic algorithm. Campatelli et al. [32] optimized process parameters such as cutting speed, cutting depth, and feed rate, using the response surface method for minimizing the power consumption in carbon steel milling. Tang et al. [33] proposed a multi-objective parameter optimization method, to obtain the optimal parameter solutions for maximum energy efficiency and minimum production time. Velchev et al. [34] proposed a parameter optimization method for steel turning, to investigate the effect of the blade grade, feed, and cutting depth on the minimum energy consumption. In addition, Qin et al. [35] significantly reduced the overall tool deflection during robotic machining, by optimizing workpiece posture. Kuram et al. [36] evaluated specific energy, tool life, and surface roughness through milling parameters such as cutting speed, cutting depth, and feed rate. Single and multi-objective optimization studies were carried out using this mathematical model.
Most of the above studies reveal the influence law between process parameters and the machining efficiency, as well as the energy efficiency, from experiments, and optimize the process parameters, with lower consideration given to the influence of process parameters on the surface error of robot-assisted milling of the inner wall of casting cylindrical parts. Furthermore, choosing the optimal parameter combinations from the experimental data set can fail to satisfy the global optimization solution.
According to the above literature, most researchers have studied the effects of material properties, milling methods, and the robot itself on the robot-assisted milling performance. However, there are fewer studies on the parametric representation and surface-error control of the robot-assisted milling process of complex inner walls of casting cylindrical parts under certain postures.
For this reason, in this study, we designed experiments to study the relationship between the machining surface quality, and the milling process parameters of aluminum-alloy casting cylindrical parts. Firstly, through designing the parameters of the milling process, and performing milling machining experiments, the milling force and the surface error after machining under different process parameters were obtained. Secondly, the response surface model of milling forces and surface errors could be established under different machining process parameters. Finally, we established the process optimization model, and performed process optimization research based on the evolutionary optimization algorithm, to obtain the milling process at the optimal machining error. The experimental study provides an important reference for the practical factory application of robot-assisted milling of complex thin-walled and cylindrical casting parts. The optimal design of machining parameters can improve the surface quality and the performance of the robot-assisted milling process.

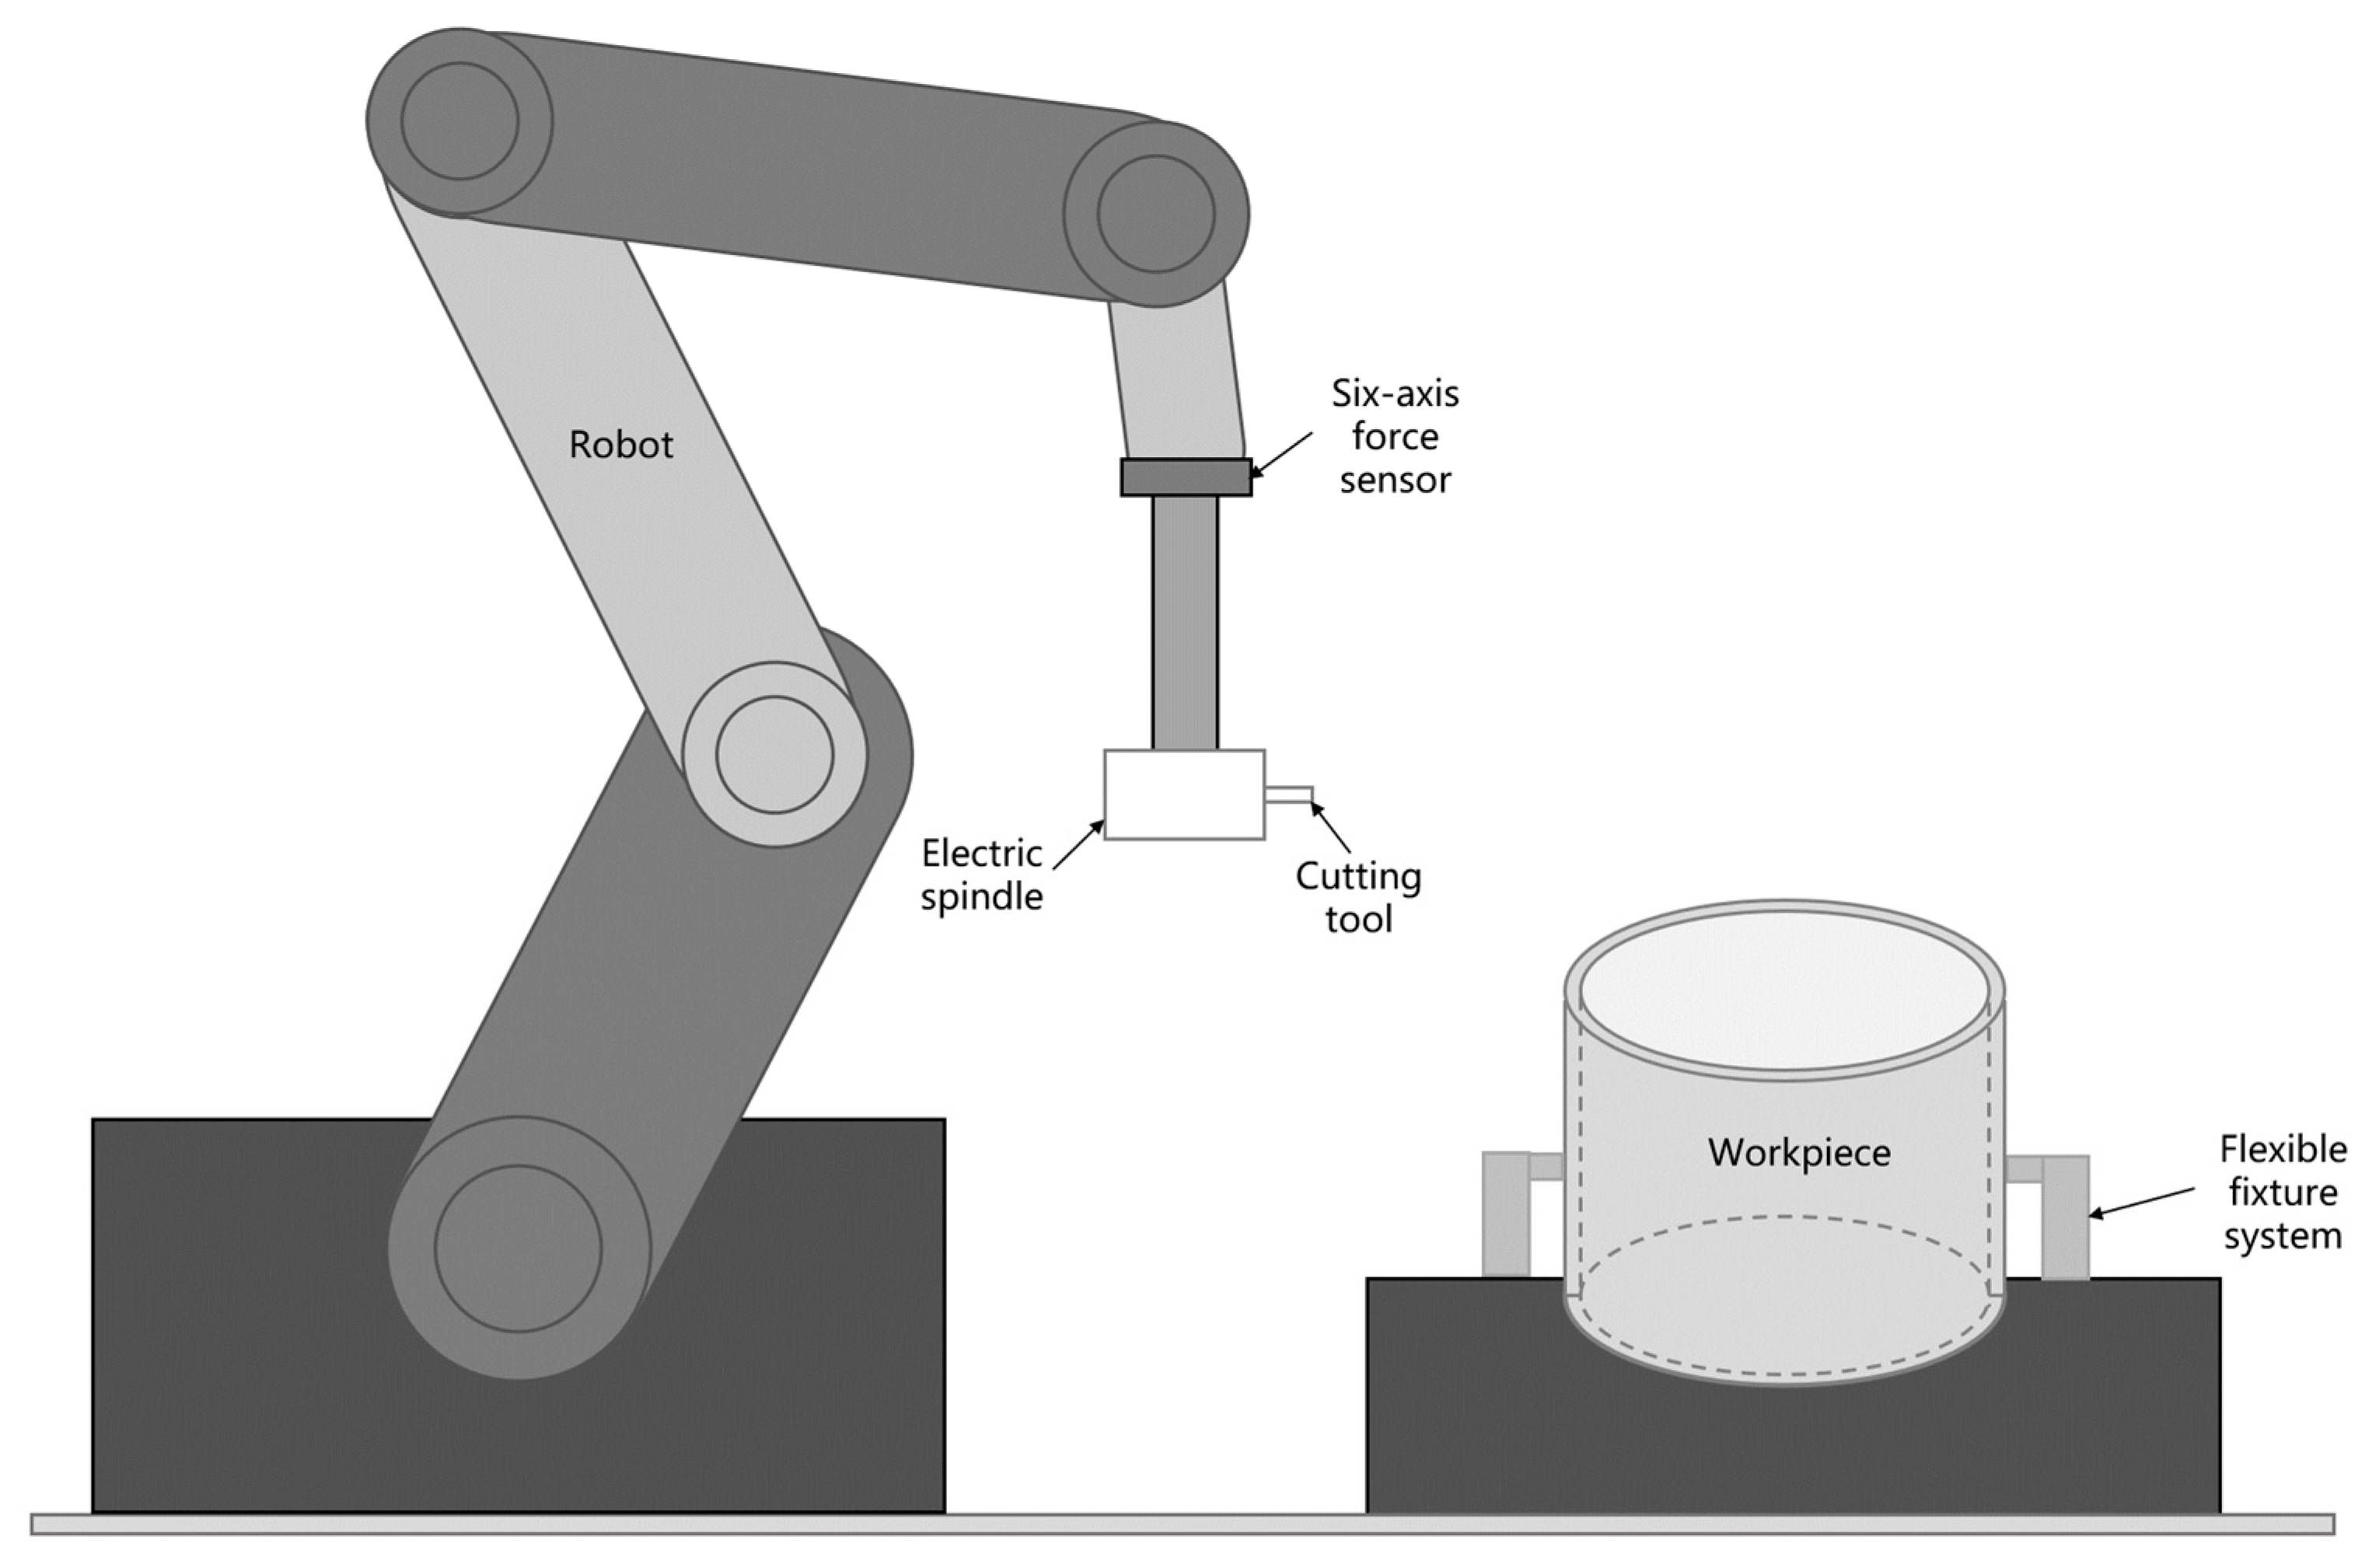
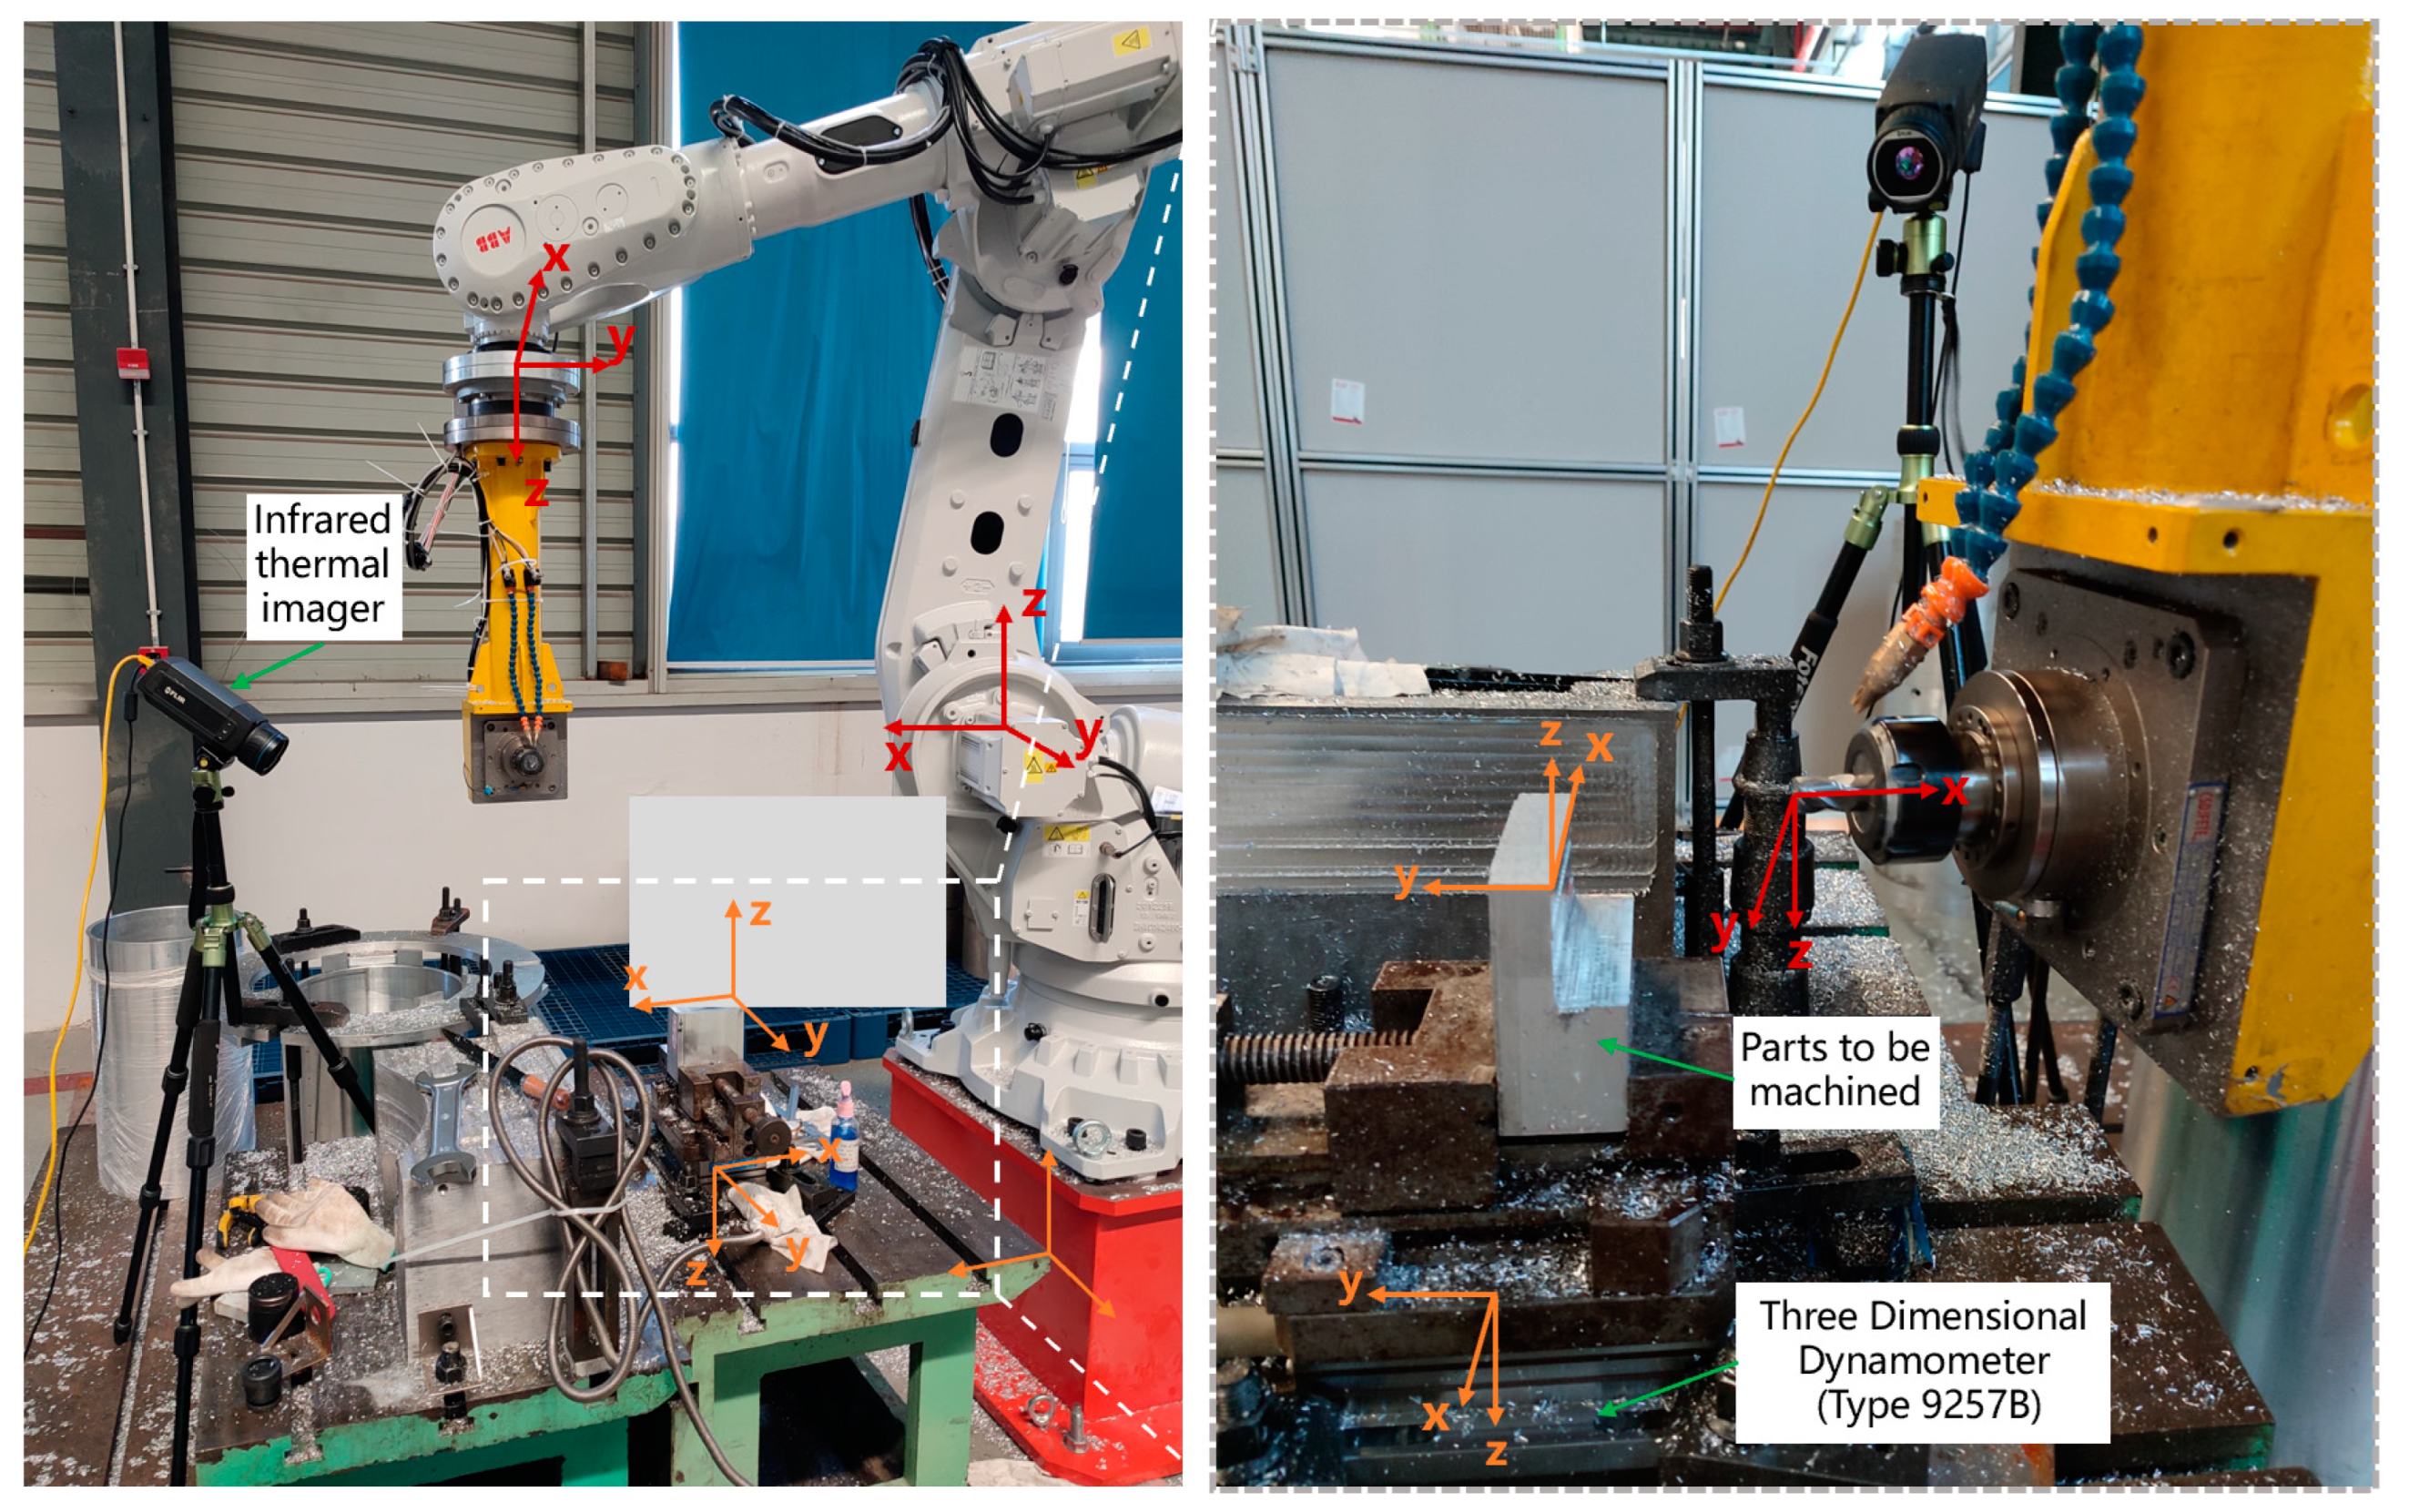
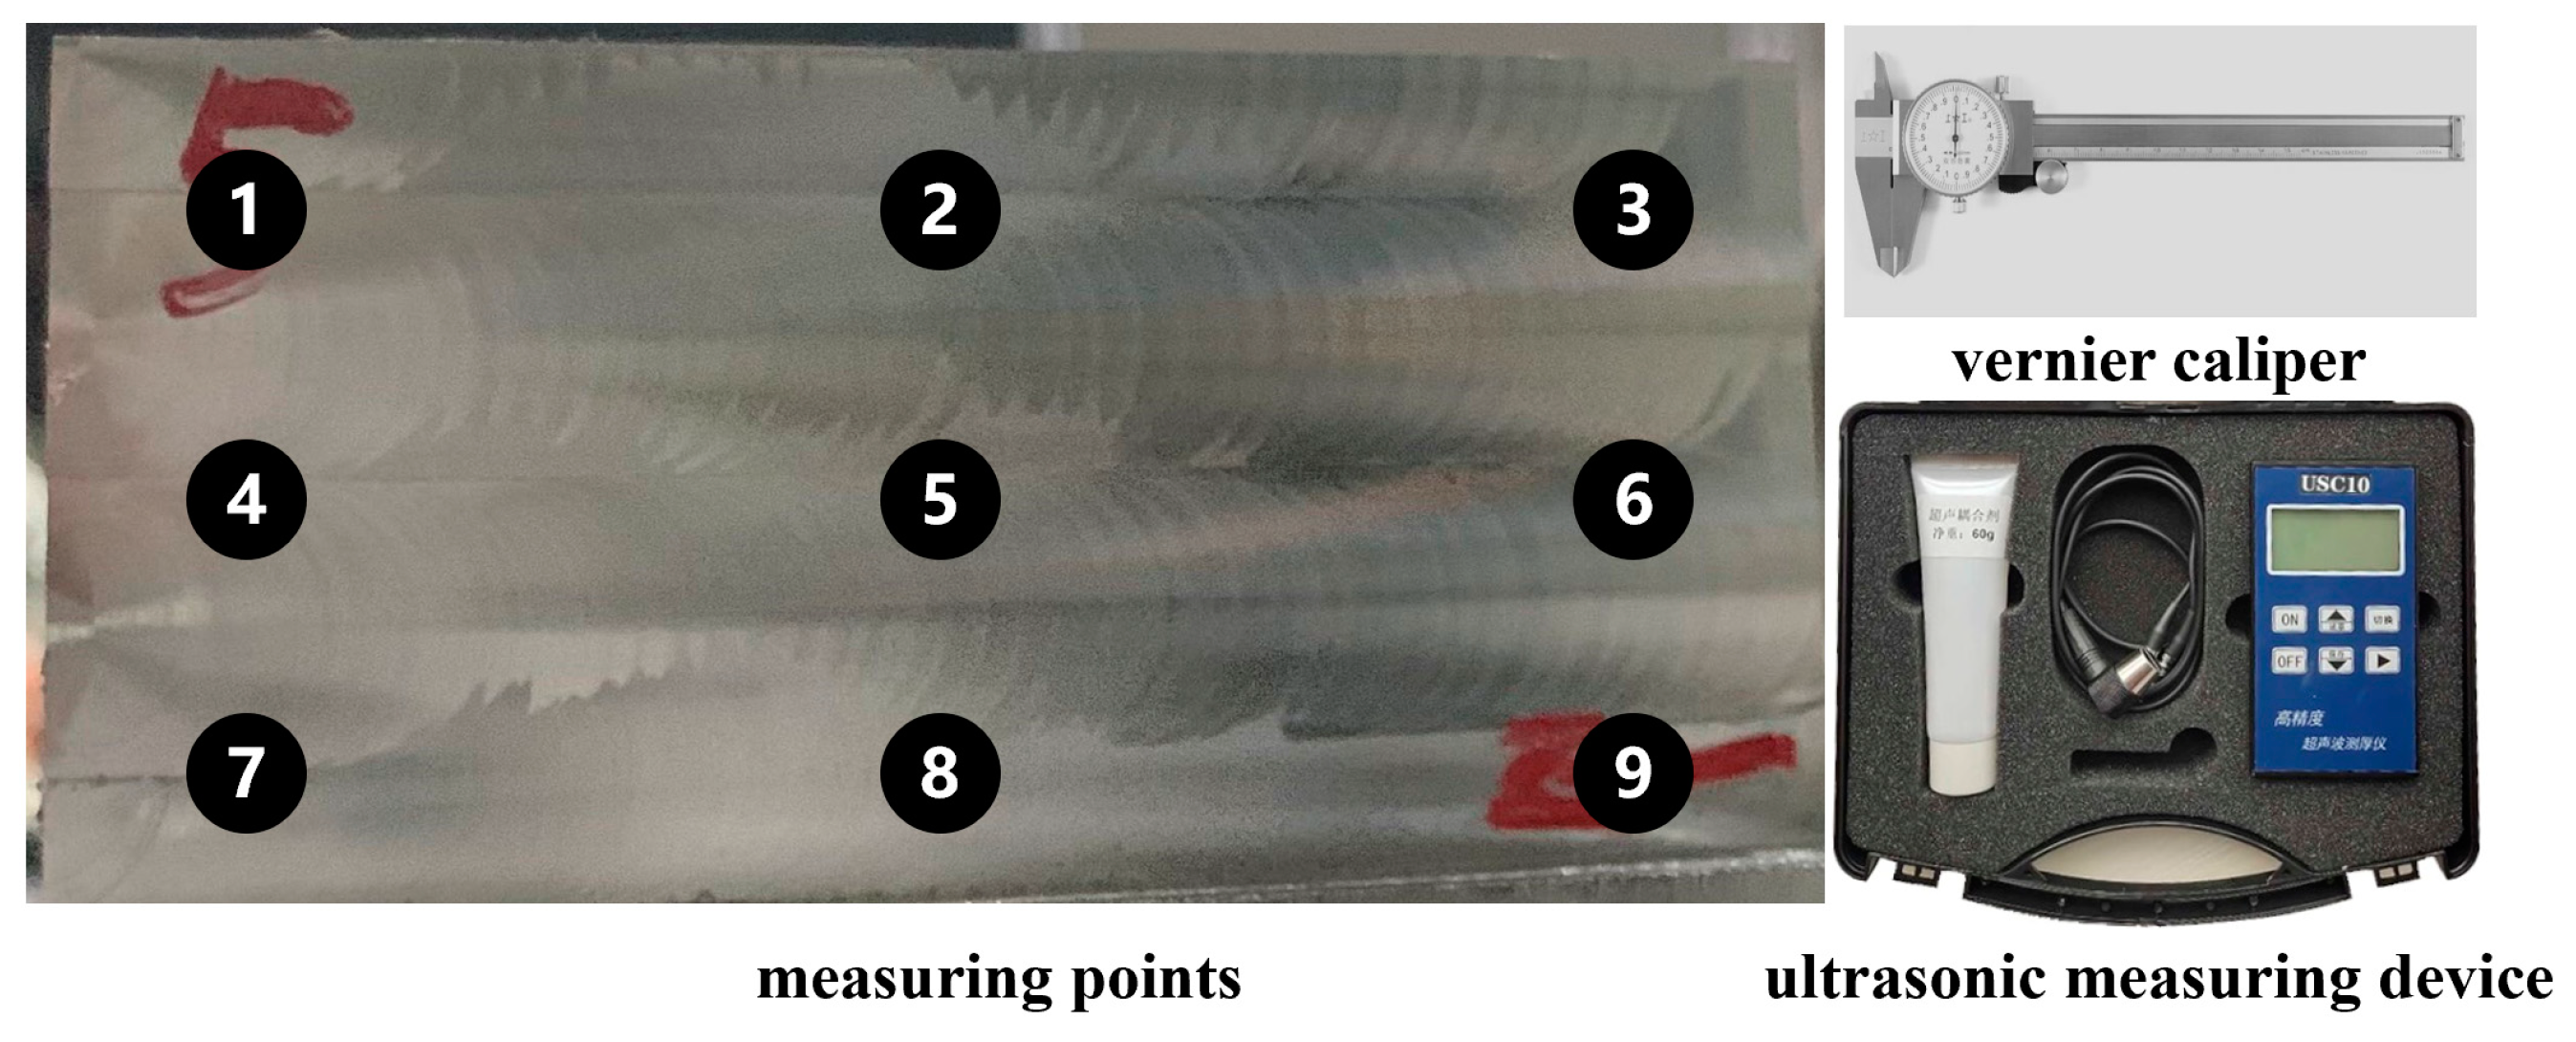
2. Experimental Setup

The surface errors that occur during robotic milling are mainly due to variations in milling forces during the milling process. Therefore, the surface error of the workpiece can also be referred to as force-induced surface error. The purpose of the experiment in this paper is to study the milling force and the machining error of the machined surface under different milling processing parameters of the robot-assisted milling system. Experiments were analyzed and investigated through the following three steps: (1) milling experiments, through designing milling process parameters, performing milling experiments with different machining parameters, and obtaining the corresponding machined surfaces; (2) milling force measurement, using the force sensor to measure the milling forces during the milling process, and obtain the milling forces of different milling processes; and (3) surface measurement, to measure the quality of the machined surface before and after the milling process, to obtain the machined surface error.
Machining experiments were performed using a robot-assisted milling machining system. A typical square experimental sample workpiece was designed to study the milling performance under different milling processing parameters. The sample workpiece material was the ZL114A aluminum alloy. The workpiece size of the milling sample is 100 mm × 100 mm × 40 mm, as shown in Figure 2. The workpiece of the machining sample is clamped to the force-measurement instrument, to record the milling force during the machining process in real time.
As shown in Figure 2, the machining equipment was designed for the milling of the complex inner wall of casting cylindrical parts, consisting of an industrial-grade robot end-mounted extension bar. The movable fixture was fixed to the Kistler three-way dynamometer (Type 9257B). The collected data were filtered to obtain the change in milling forces during machining. Each experiment went through two processes, rough milling and finish milling; the finish-milling process used minimum quantity lubrication (MQL) milling to obtain the final machined surface. A helical 4-edge milling cutter with PVD coating was used in the machining process.
Experimental parameters and experimental protocols were developed using Taguchi’s experimental design methodology, based on processing requirements. The machining parameters of the finish milling process are shown in Table 1. The experimental design was used to perform the machining experiments, with different combinations of machining parameters. The effect of the milling process parameters on the milling force and the machining error was studied, to obtain the optimal milling process parameters. Using orthogonal experimental design, four levels were selected for each milling parameter, and a total of eighteen groups of experiments were performed, of which the last two groups were designed as validation experiments. Each milled surface is planned with nine measuring points, and the surface was measured before and after machining, using the vernier caliper and ultrasonic measuring device. This gave the surface error of the workpiece, as shown in Figure 3.
The specific experimental process is as follows. Firstly, the rough parts went through multiple rough-milling processes, to make the surface error of the machined area consistent. The rough-milling process was carried out with micro-cutting depth and high speed, to ensure the uniformity of the machined surface error, and to measure the initial machined surface error. Finally, the finish-milling process was carried out, to obtain the machined surface with different combinations of machining parameters, and to measure the machined surface error. The experimental design and results are shown in Table 2.

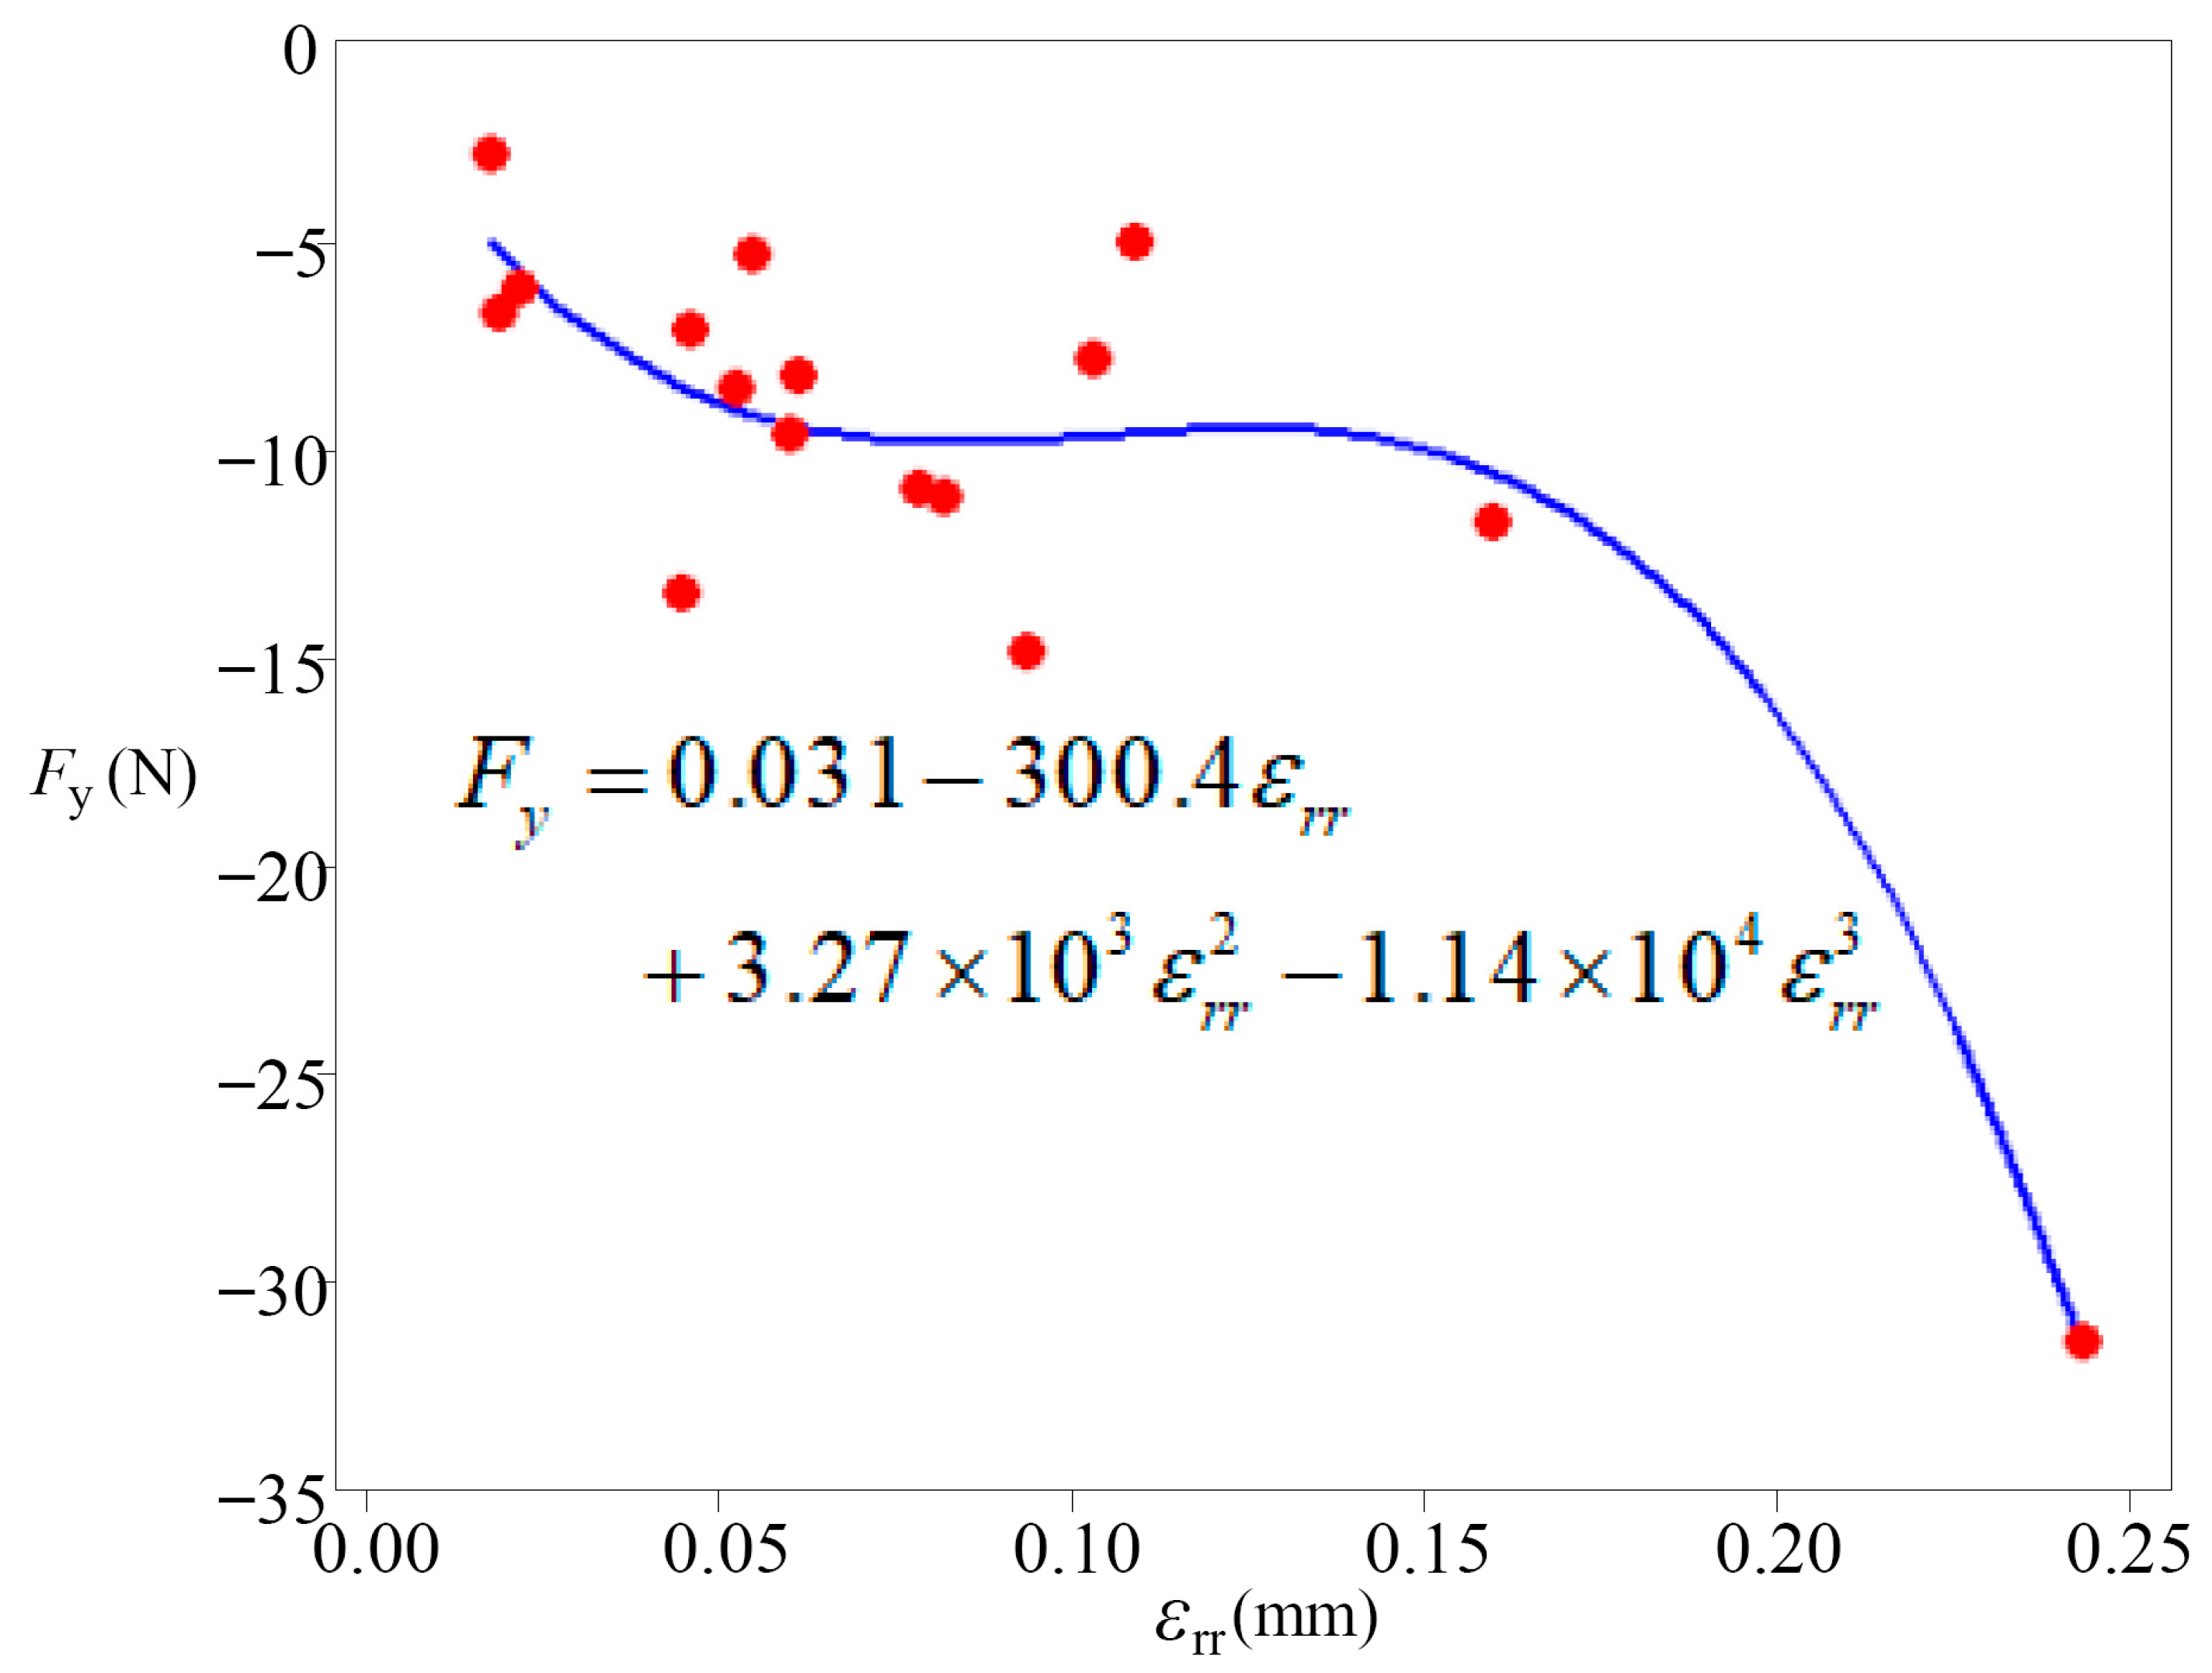
3. Model Construction Based on the Response Surface Methodology

Response surface methodology is a mathematical method that integrates experimental design and statistical analysis, which is widely applied in different fields to study the influence of multiple process parameters on the objective parameters. By establishing a regression analysis model of multiple input influencing parameters and target parameters, complex response relationships can be fitted with good robustness [37,38]. A generalized quadratic regression model expression is shown in the following equation:
Y = f ( X ) = b 0 + i = 1 k b i X i + i = 1 k 1 j = i + 1 k b i j X i X j + i = 1 k b i i X i 2 + ε
where b 0 is the constant coefficient, b 1 , b 2 b k and b 11 , b 22 b k k are the coefficients of the one-degree term and quadratic term of the RSM, respectively, b 12 , b 13 b ( k 1 ) k denotes the coefficient of the cross-effect term; X i and X j are the input variables of the design X = [ v , f , a p , a e ] , Y is the target variable Y = [ F x , F y , F z , E r r ] t .
As shown in Table 1, for this study, we mainly selected process parameters, such as spindle speed, feed rate, and cutting depth, that have an impact on milling force and machining deformation, to study their influence laws on the machining performance. In order to accurately express the influence law of each machining parameter on the milling force and the surface error caused by the machining deformation, the relationship model between them and the machining parameters is established with RSM, as shown in the following equation:
F x = 1.20 × 10 2 1.55 × 10 2 v 4 . 57 × 10 3 f + 60 . 7 a p 5.74 a e + 2.86 × 10 1 v f + 2.81 × 10 3 v a p 1.37 × 10 4 v a e 1.04 × 10 3 f a p 3.19 f a e 4.92 a p a e 7.20 × 10 8 v 2 + 3.09 × 10 4 f 2 7.30 a p 2 + 6 . 97 × 10 1 a e 2
F y = 6.01 3.51 × 10 3 v 1 . 33 × 10 2 f + 1 . 50 × 10 1 a p + 8.52 × 10 1 a e + 4.39 × 10 2 v f + 5.73 × 10 4 v a p + 8.40 × 10 6 v a e 2.22 × 10 2 f a p 2.11 × 10 1 f a e 9.67 × 10 1 a p a e + 2.05 × 10 8 v 2 + 6.42 × 10 2 f 2 2.10 a p 2 + 5 . 38 × 10 2 a e 2
F z = 1.95 × 10 2 + 3.05 × 10 2 v + 3 . 90 × 10 3 f + 3 . 08 × 10 1 a p 1.73 × 10 1 a e 2.44 × 10 1 v f 4.74 × 10 3 v a p + 1.29 × 10 4 v a e 3.83 × 10 2 f a p + 2.59 × 10 2 f a e + 4.0 a p a e 5.90 × 10 7 v 2 2.90 × 10 4 f 2 1.64 a p 2 + 8 . 16 × 10 2 a e 2
ε r r = 0.09 + 3.07 × 10 5 v 8 . 96 f + 0 . 436 a p 6.77 × 10 2 a e + 4.34 × 10 4 v f 9.43 × 10 6 v a p 8.43 × 10 7 v a e 1.87 f a p + 0.974 f a e + 4.26 × 10 3 a p a e 1.20 × 10 9 v 2 + 4.11 f 2 6.49 × 10 2 a p 2 + 1 . 96 × 10 3 a e 2
The correlation coefficient of the regression model is a measurement of the degree of model fitting, and is calculated as follows. The expression can be described as an equation:
R 2 = S S R S S T
where SSR is the sum of squares of the differences between the predicted and actual values of all observations in the regression model; SST is the sum of squares of the differences between all observations and their mean values. The results of the correlation coefficients of the regression models established in this paper are shown in Table 3, and the values are all close to 1, indicating the validity of the regression models above.

4. Experimental Results and Analysis

For this section, the results of the above experiments were analyzed, to obtain the machining surface error with different milling-processing parameters, as well as the characteristics of the milling force and its relationship with the machining surface error for different machining processes. We did this by choosing the optimal machining surface error, and designing the machining process that formed this surface error, and then improving milling performance in practical engineering applications.

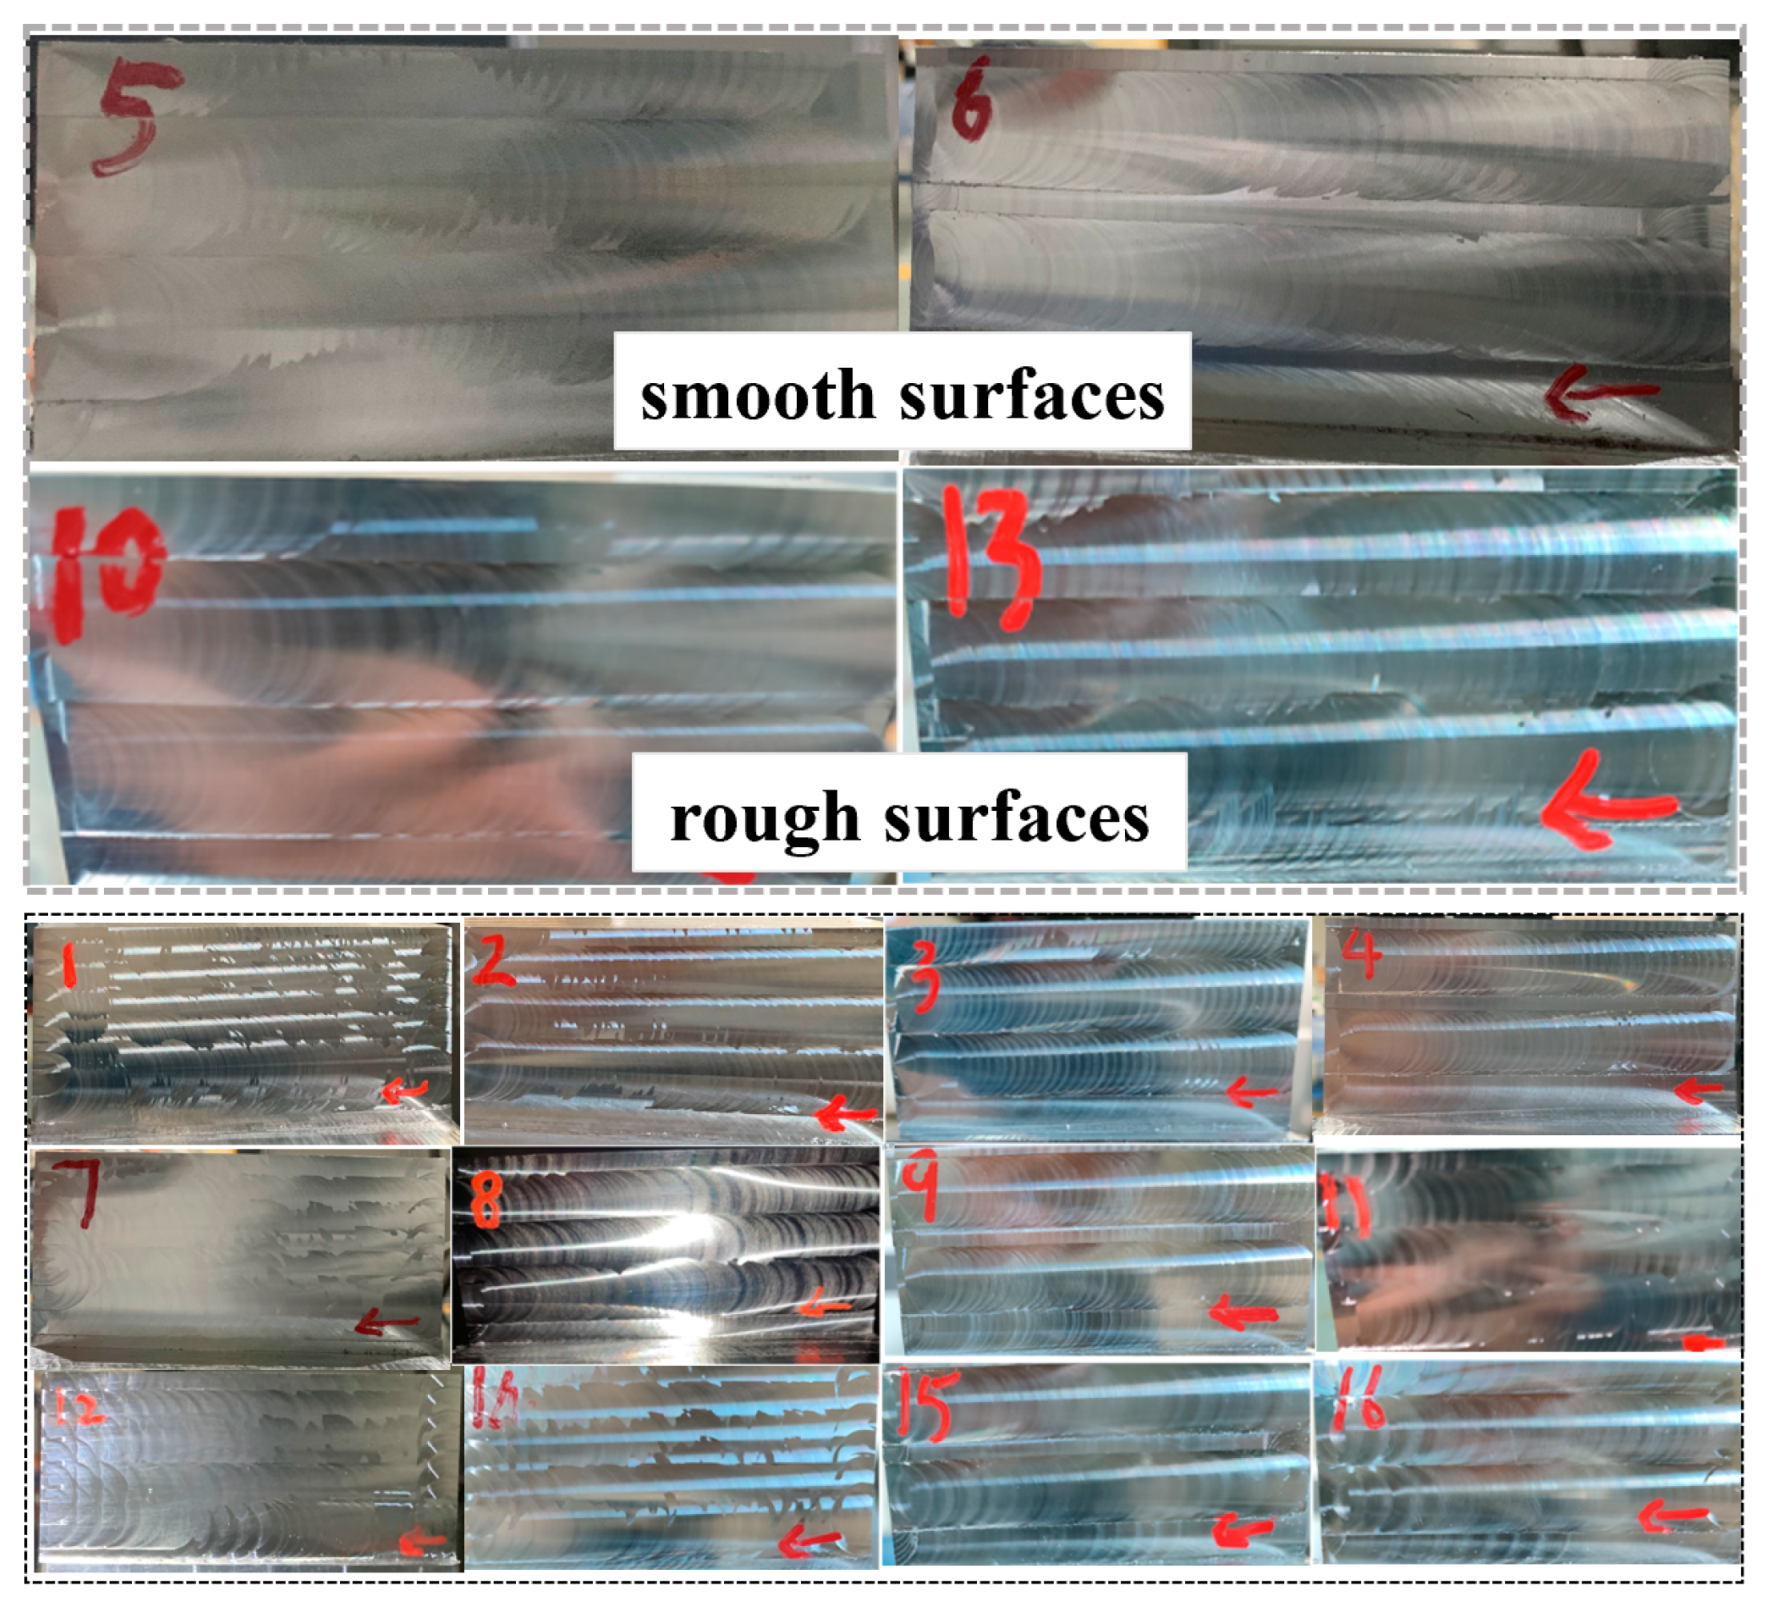
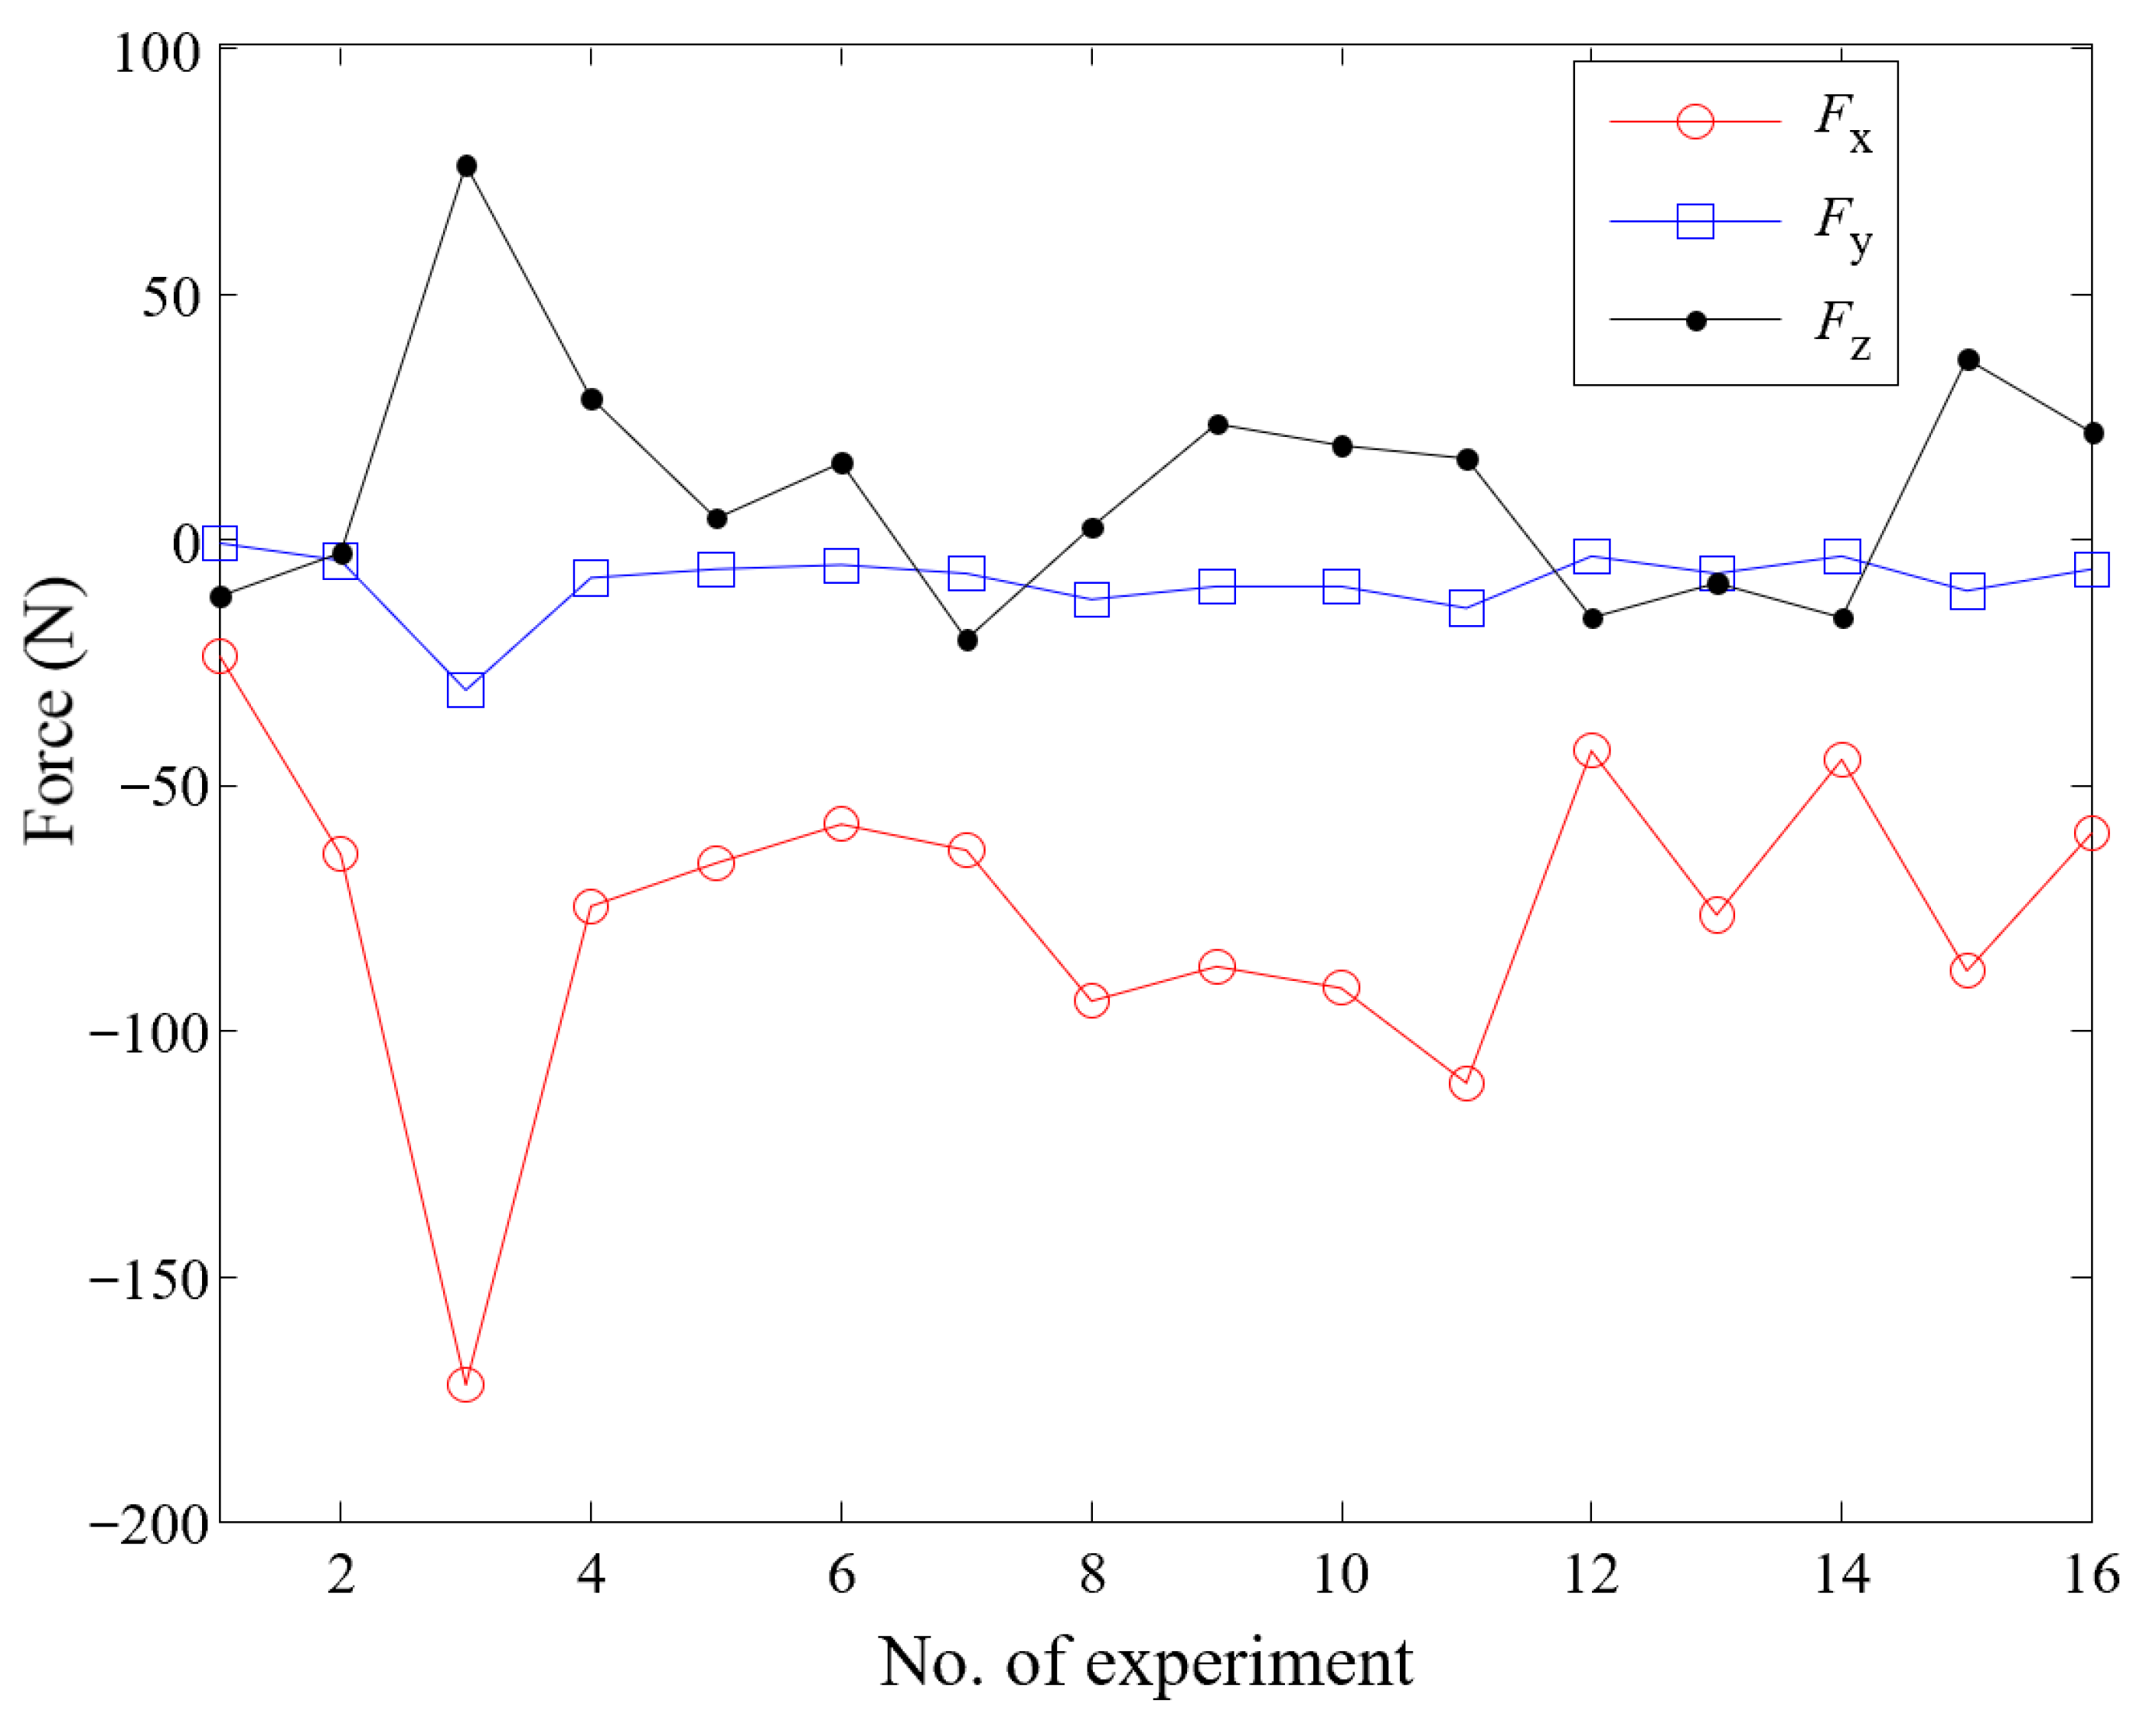
4.1. Experimental Results

In this paper, the experimental device is shown in Figure 2. During the milling process, the robot drove the spindle-connecting link, to drive the electric spindle, and finish the milling process of the part surface along the preset milling path. During the machining process, the change in milling force during the surface milling of the workpiece was recorded, and after each group of experiments was completed, the surface error of the machined part was recorded.
As an example, we will consider the machining robot Group 15 milling experiment. Figure 4 and Figure 5 show the surface area of the machined part after machining, and the measured curves of the machining force under different machining paths. The method of machining was end milling. The surface of the workpiece was machined from bottom to top in the machining process, and the milling trajectory was zigzag. In this case, the previous milling path would be covered by the next one. The machining errors caused by this phenomenon would be magnified by the weak stiffness of the robotic milling system. Through measuring and observing the machined surface of the part, it was found that a more obvious surface error occurred at the junction of the different milling paths under the same milling parameters. As can be seen from Figure 5, the milling force of smooth milling and reverse milling in the machining process is different. Because of the weak rigidity characteristics of the machining system itself, the pulling phenomenon that occurs at the end of the workpiece during the reverse milling process is more obvious, when the actual feed of the tool point along the Y direction is deeper.
Figure 6 shows the workpiece surface after experimenting with 16 robot-assisted milling treatment groups. It can be seen from the figure that the surface of the workpiece of experiments 5 and 6 was smoother, and the surface error was smaller, than that of experiments 10 and 13. As can be seen from Table 2, the milling depth and milling width of experiments 5 and 6 were small, and the variation in the milling force in the process was smaller. Therefore, for the robot milling system with weak stiffness, the actual position of the point was closer to the ideal position, and the surface error of the workpiece was obviously reduced. On the contrary, the surface error of the workpiece increased obviously in experiments 10 and 13. This is consistent with the analysis in Figure 4 above.
From the analysis of the experimental results, it can be seen that the robot milling process often showed the phenomenon of “pulling the tool inward in the up milling process while pushing the tool outward in the down milling process”. Therefore, excessive up milling radial force should be avoided during the milling process of thin-walled cylindrical parts, in order to minimize the surface error after milling, and reduce the risk of cutting through the inner wall of casting cylindrical parts.
Figure 7 shows the statistical graph of the stable cutting force of each up milling tool path during the milling experiment. It can be seen from the graph that the X-directional milling force was the largest during the milling process, which mainly affected the tilt angle of the tool. The Y-direction milling force was smaller, and mainly affected the tool tilt of the vertical workpiece machining surface, and then affected the actual cutting depth of the tool on the workpiece surface, forming the machining surface error. Different milling parameters had different magnitudes of milling force in the machining process, and the control of milling force in the subsequent milling process could be realized through the selection of milling parameters.
Furthermore, the relationship between the milling force and the machining surface error is analyzed as an example of a Y-directional milling force. The statistical relationship between the Y-direction milling force and the machined surface error is shown in Figure 8. From the graph, it can be seen that the milling machining surface error increased with the increase in the axial milling force, and the two showed a non-linear relationship. Meanwhile, the machining surface error was also affected by the force in other directions, and other factors.

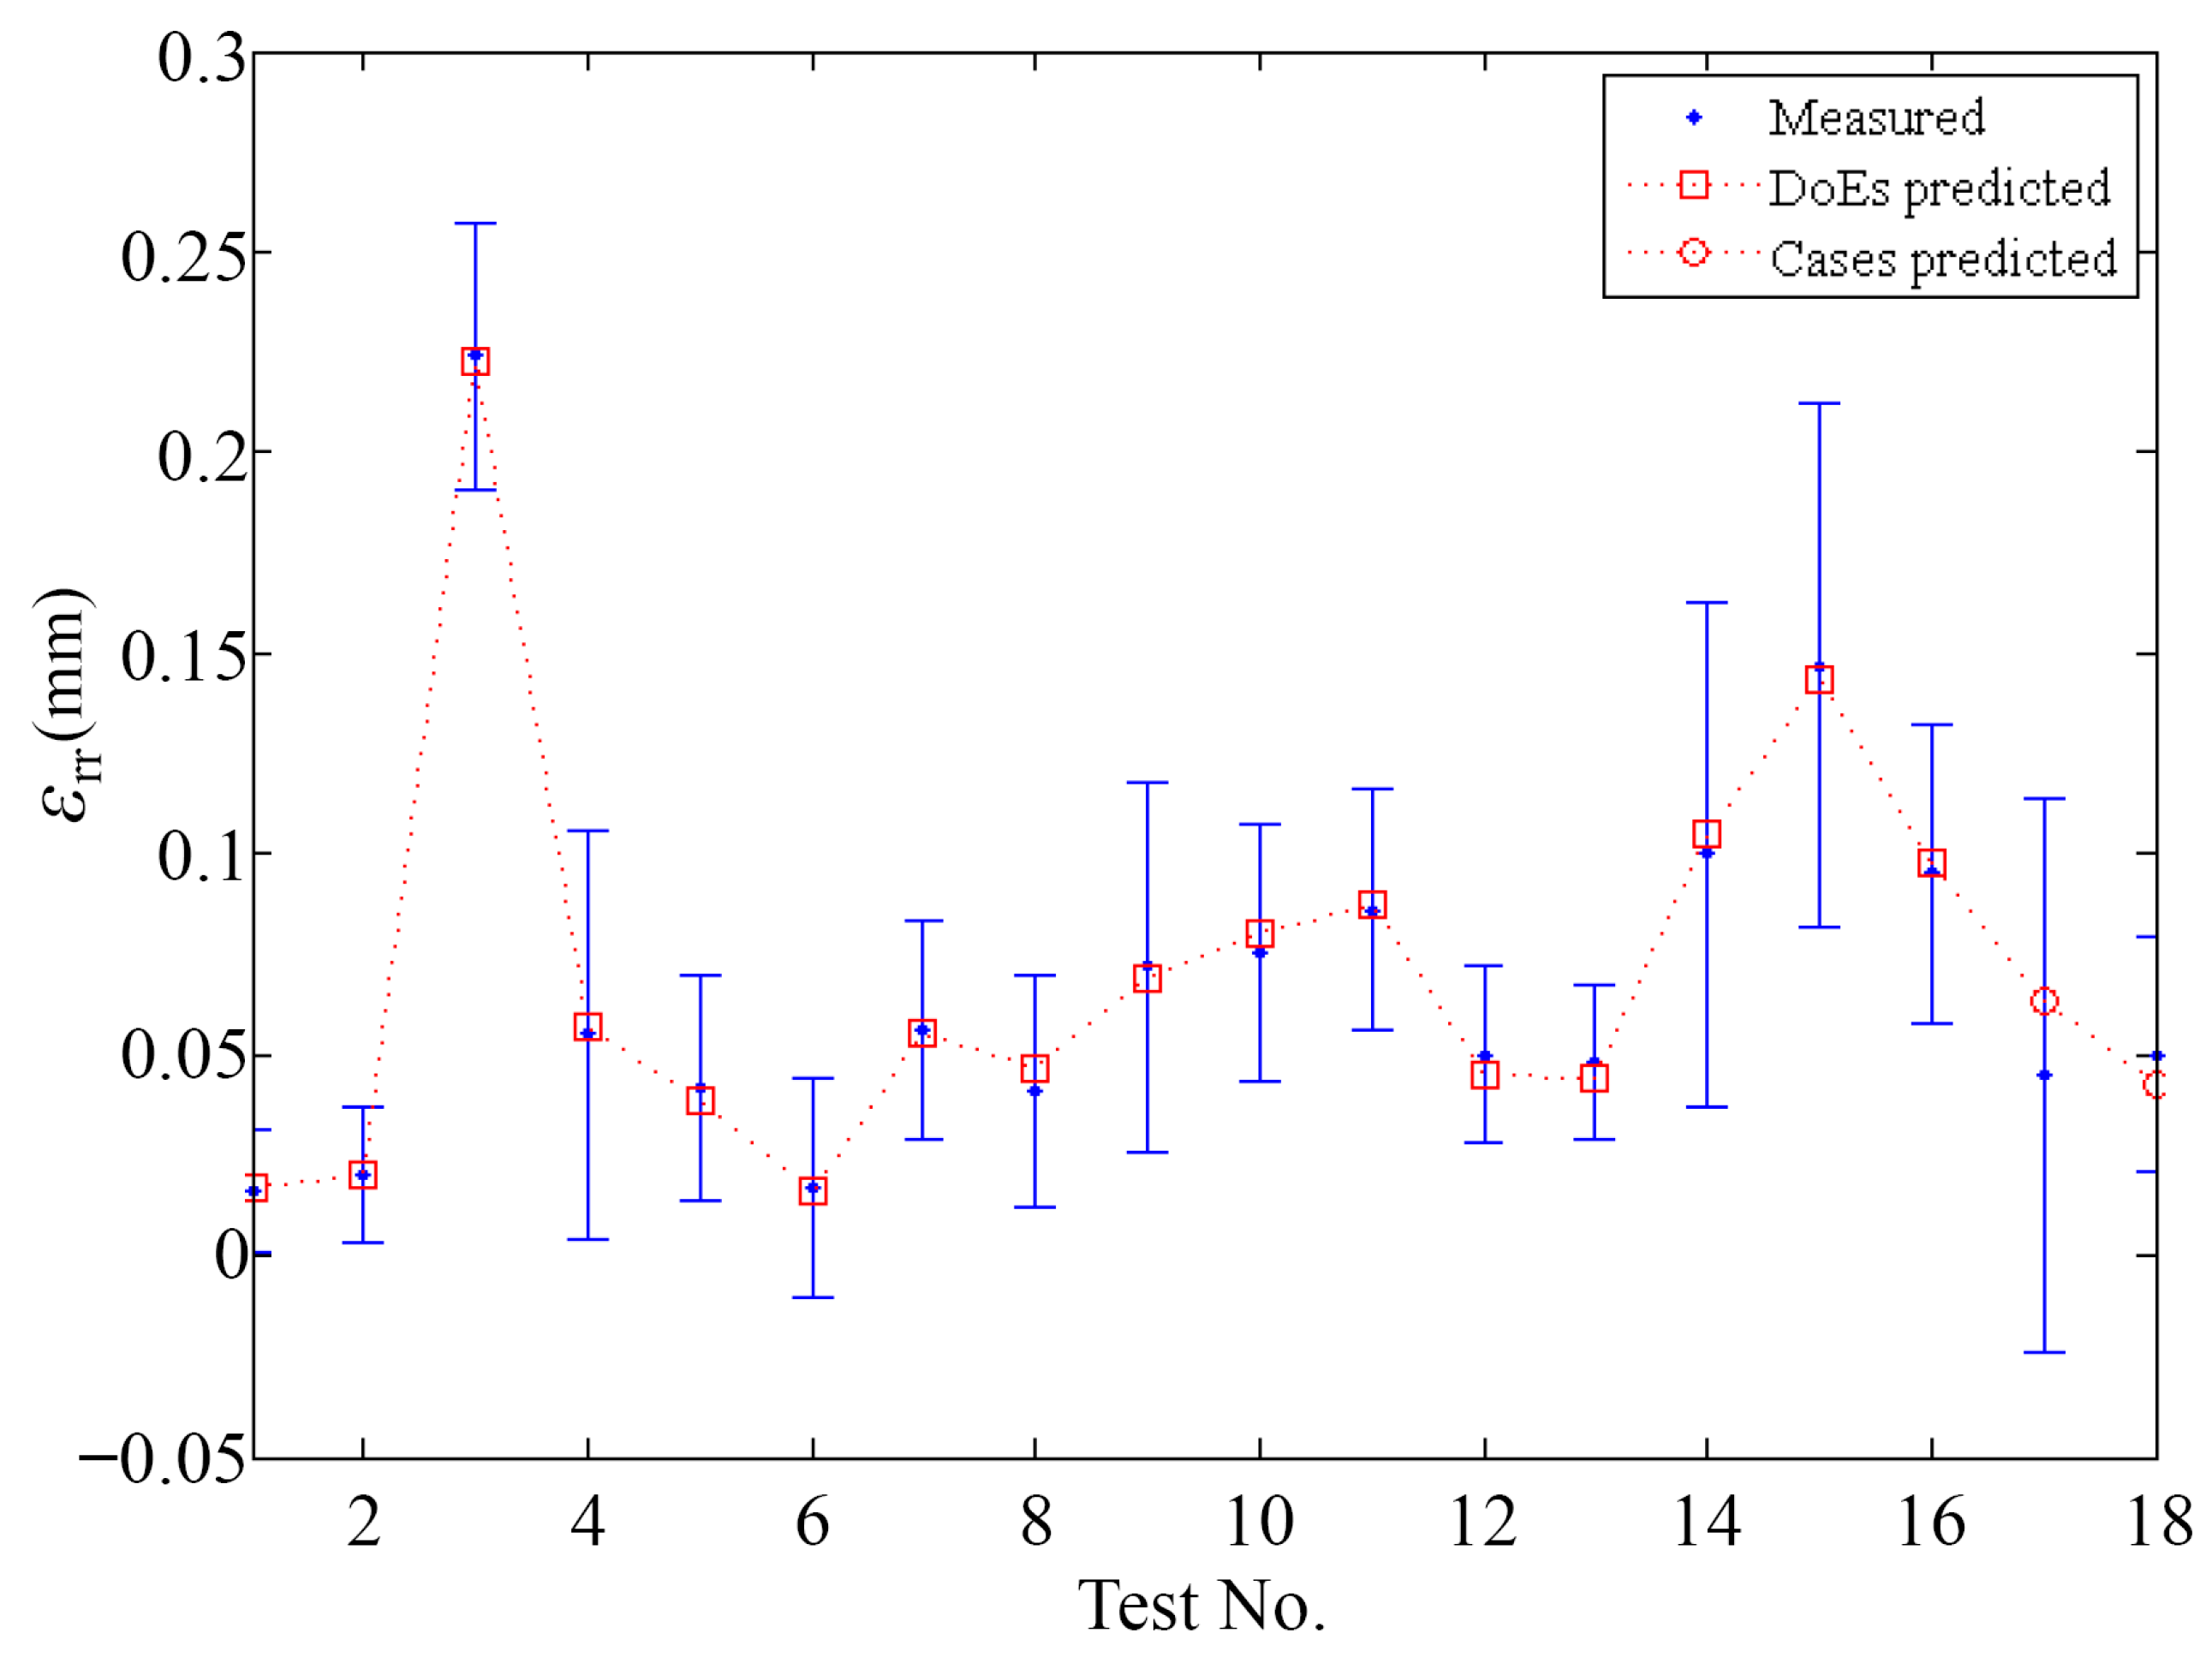
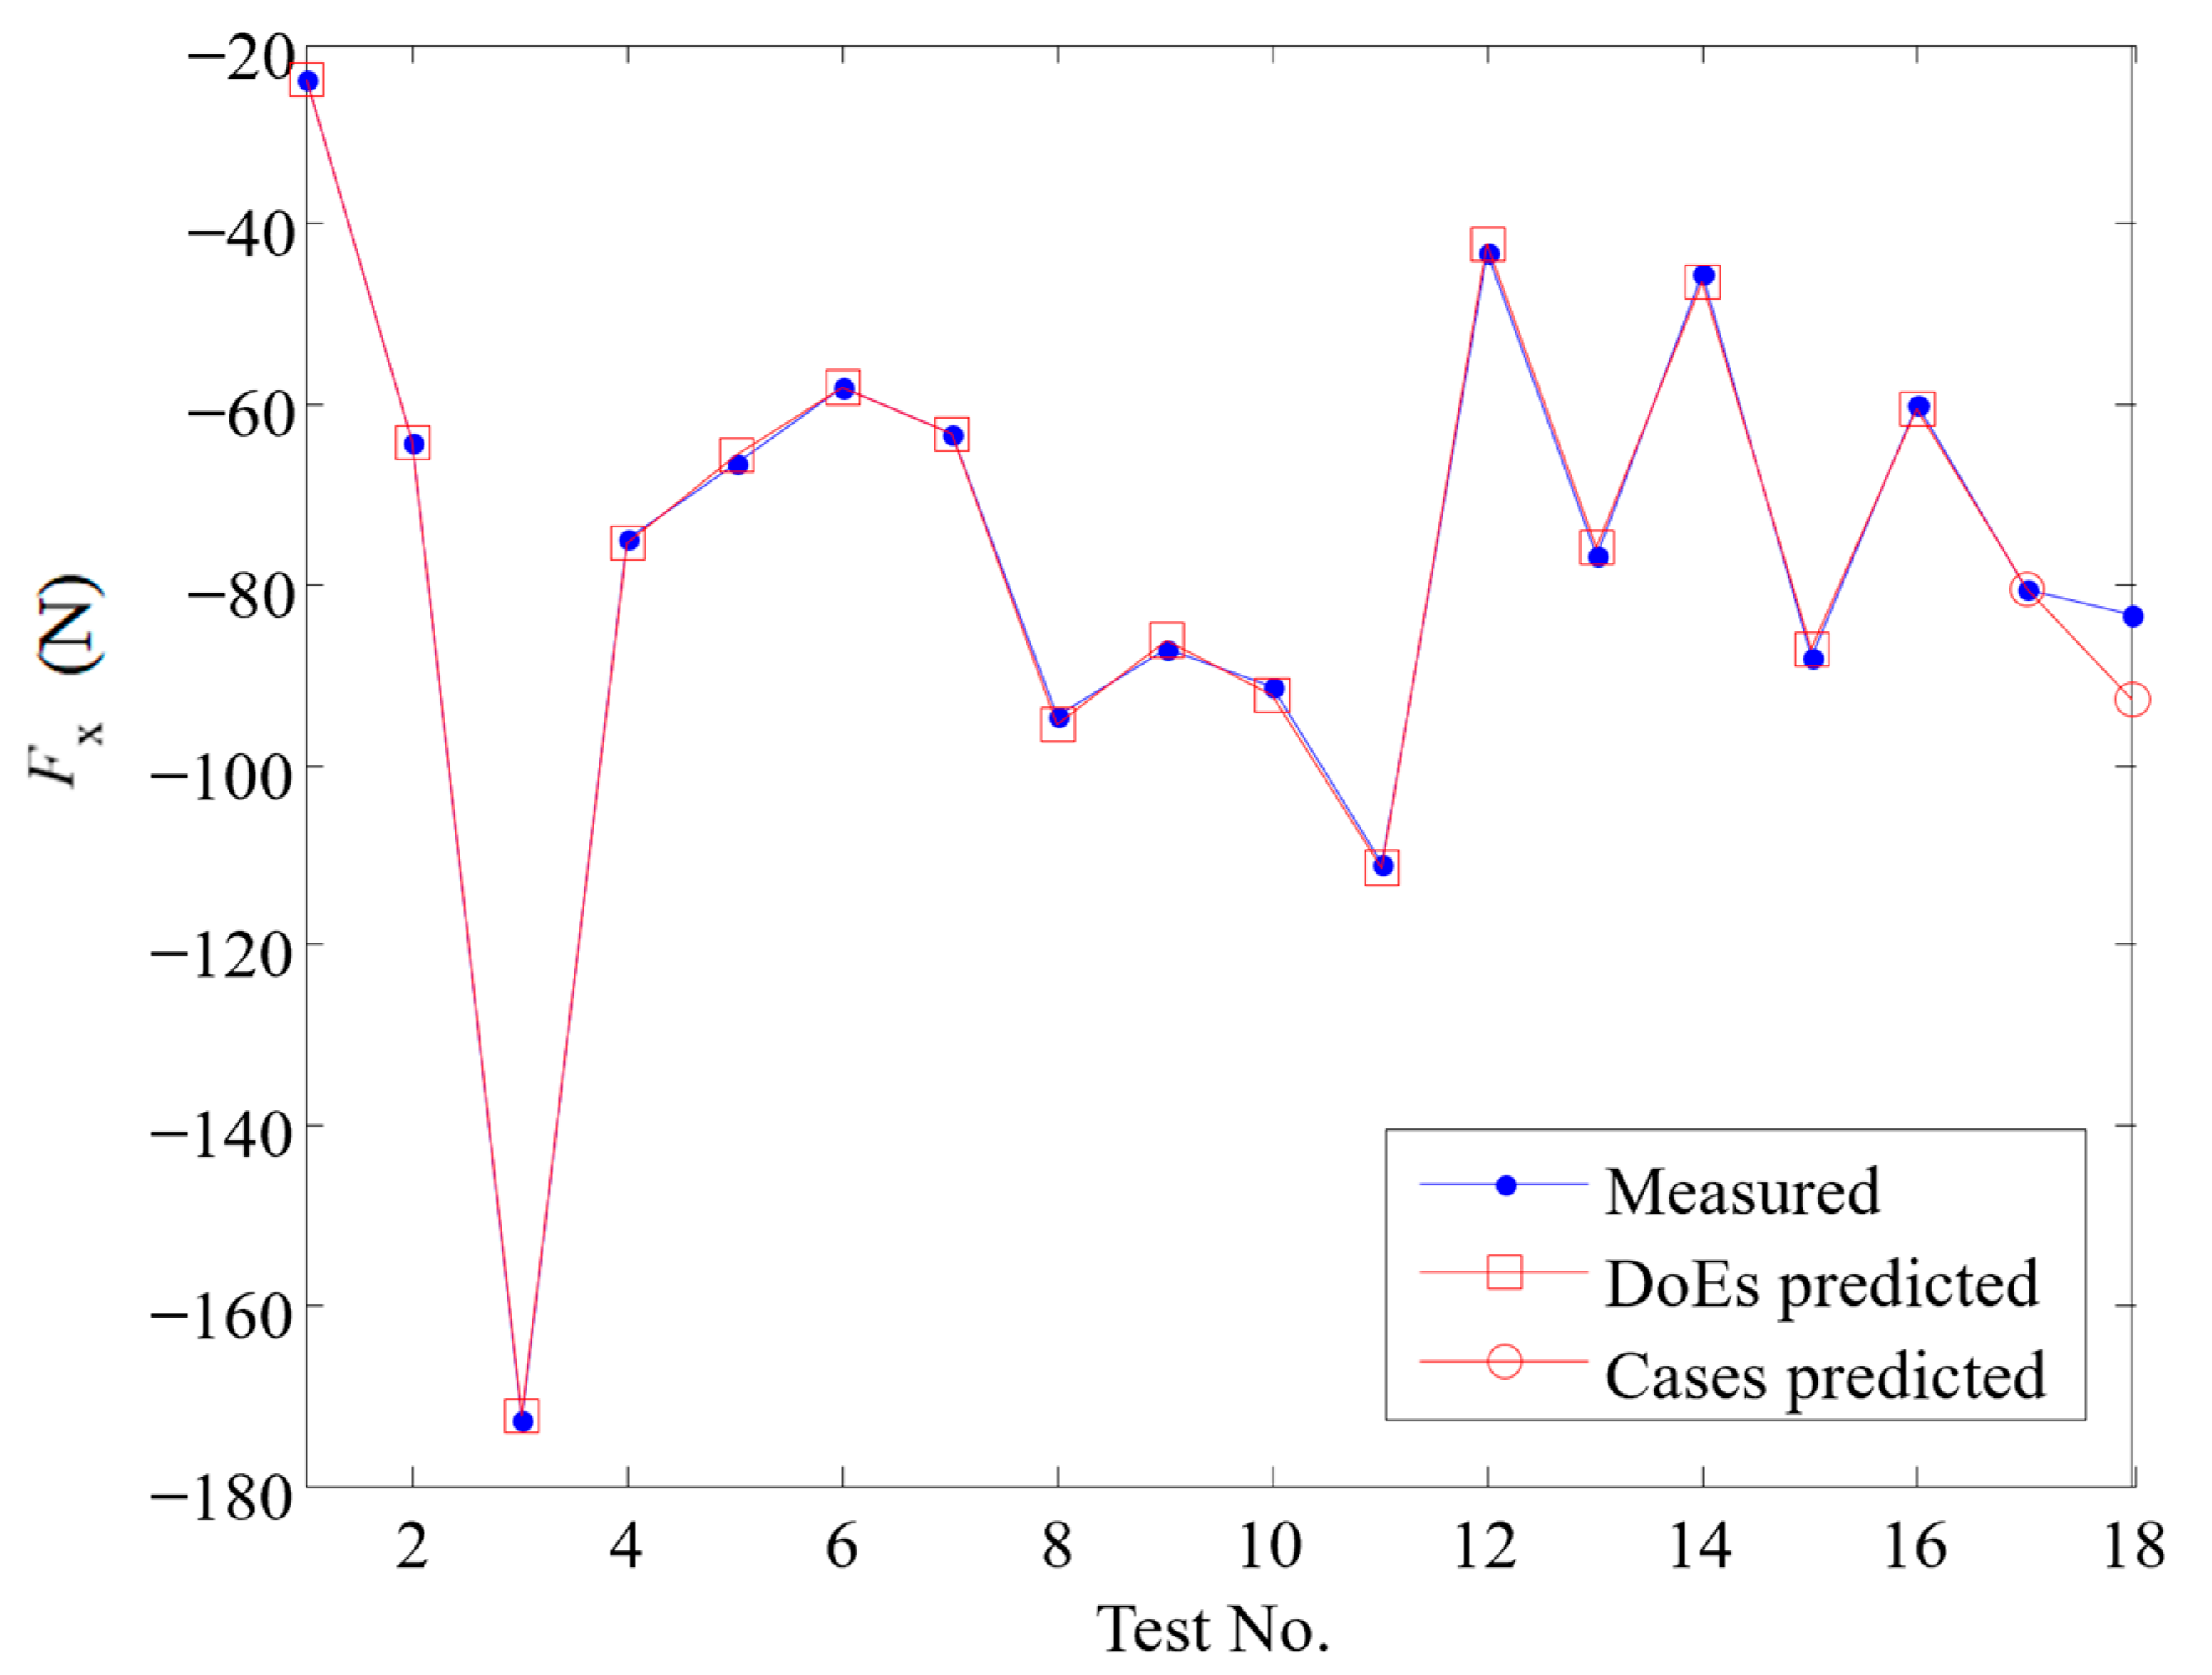
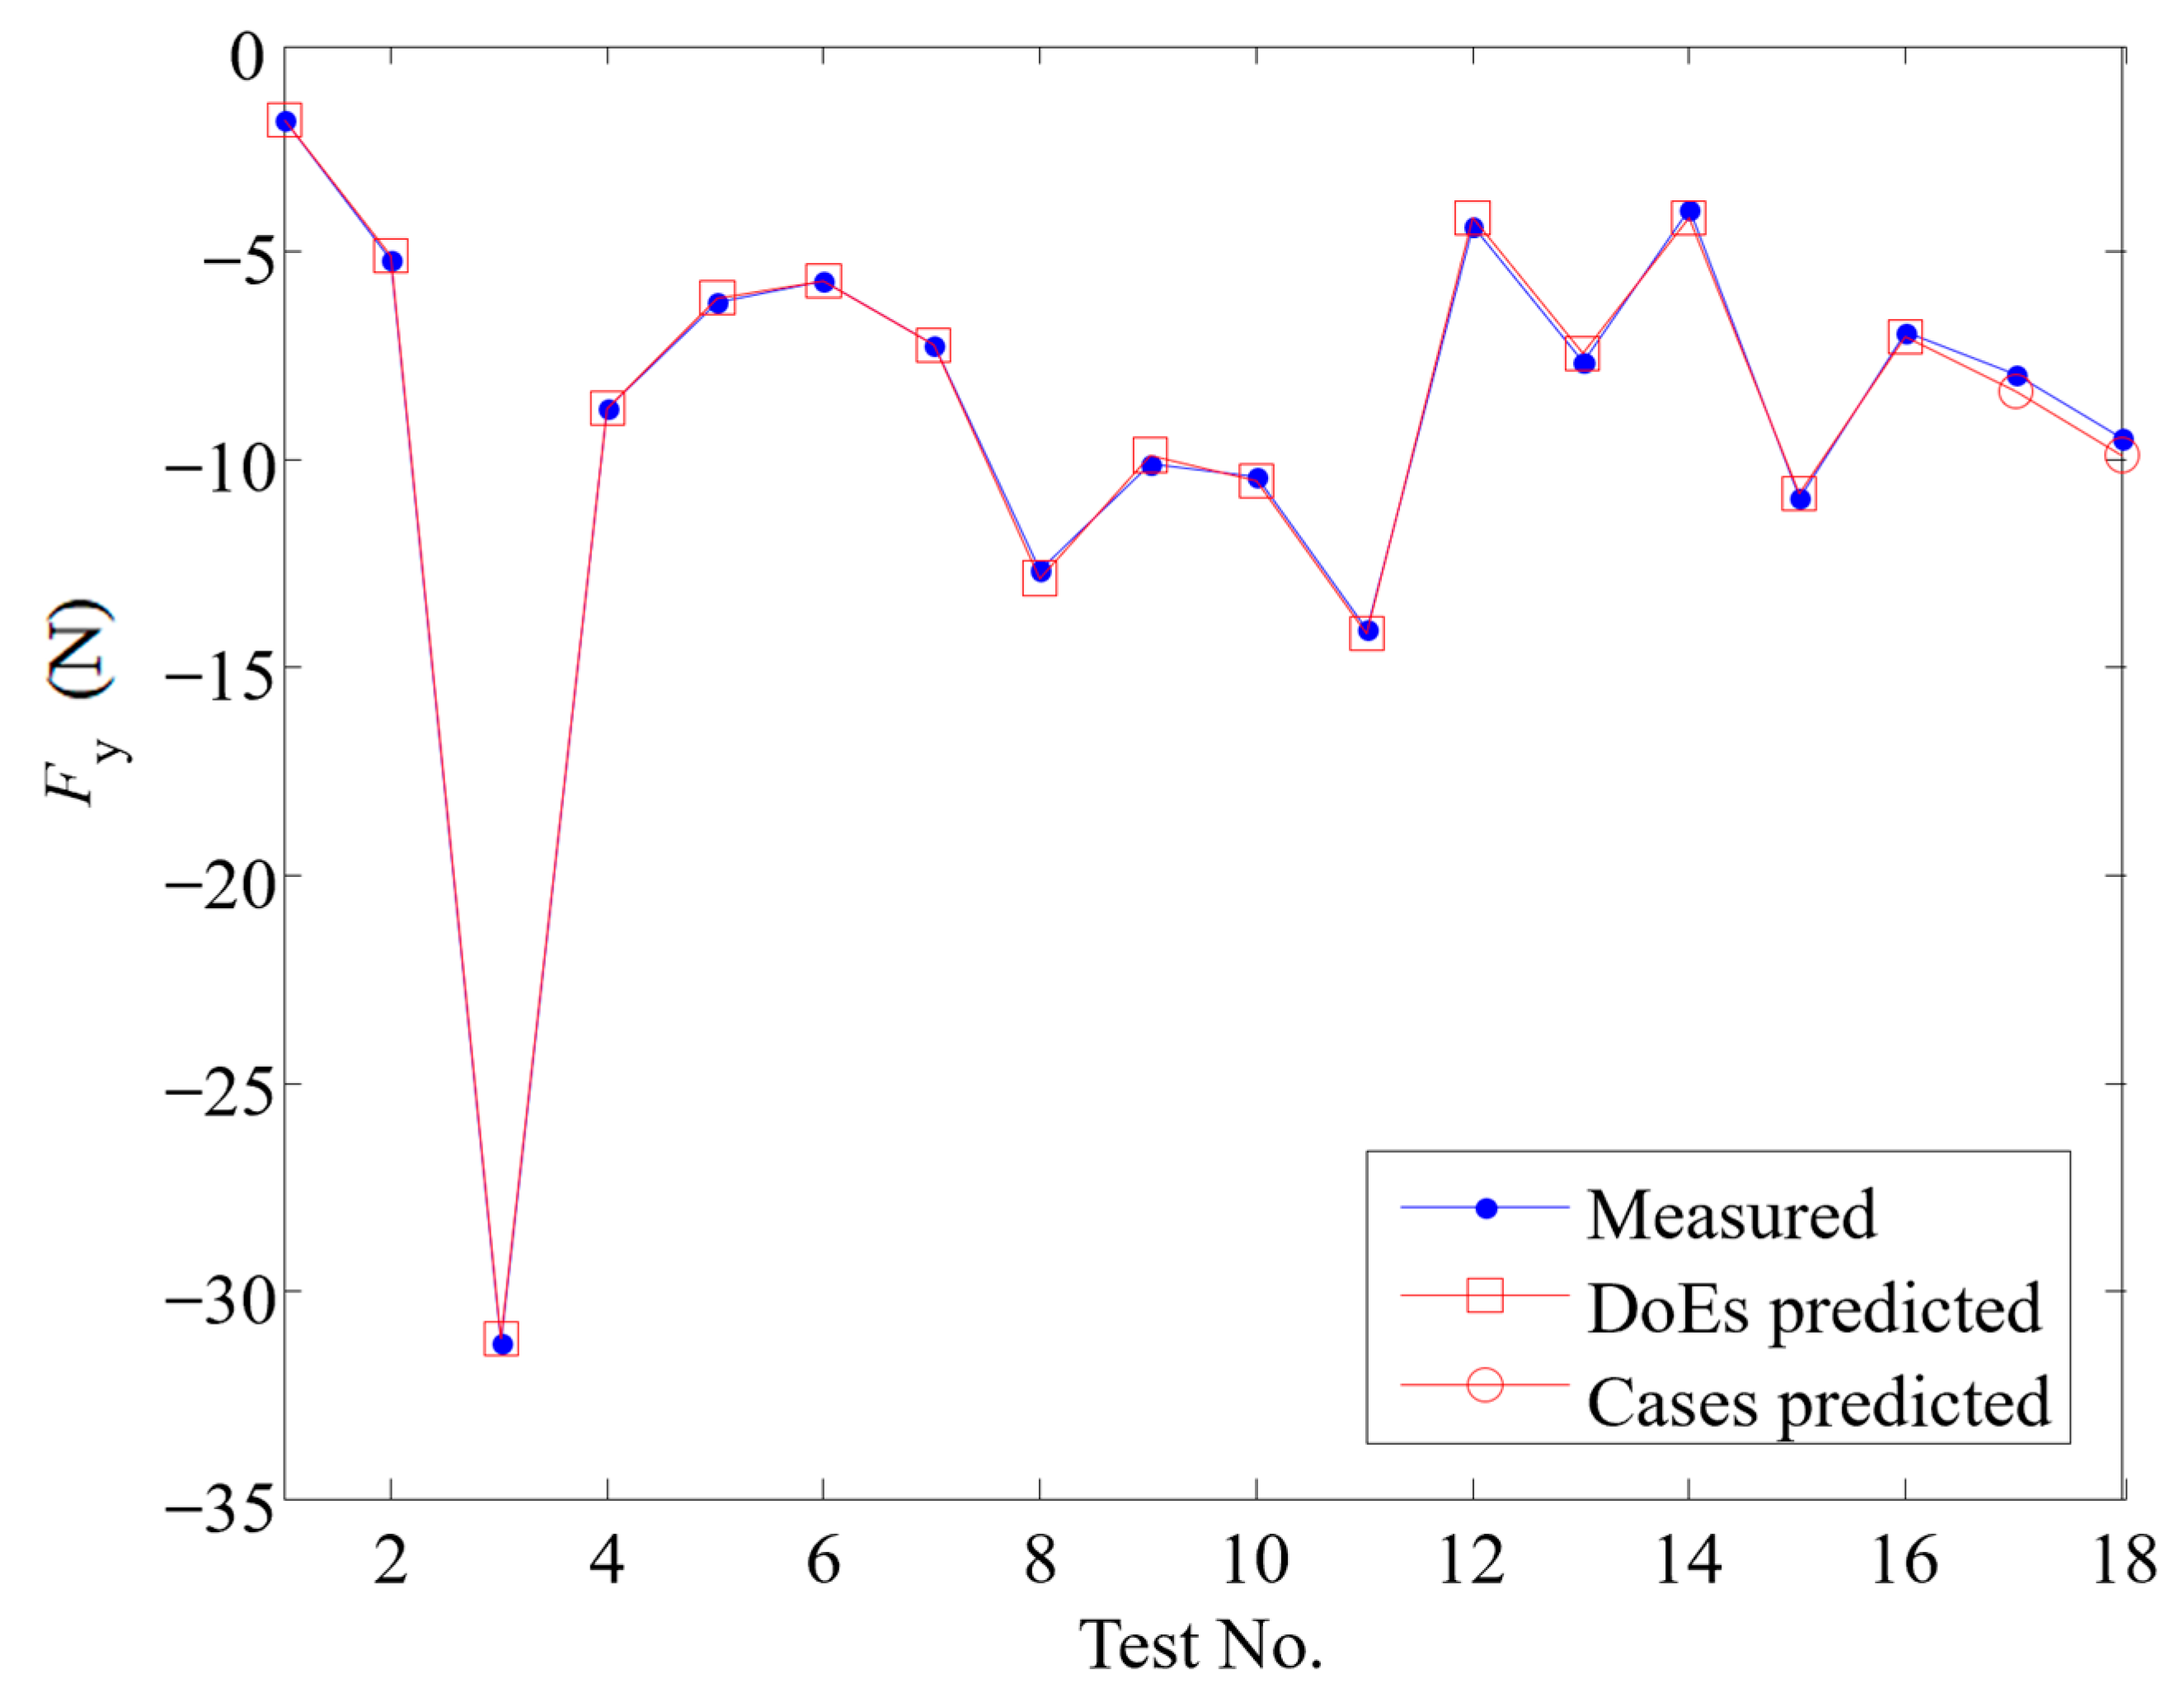
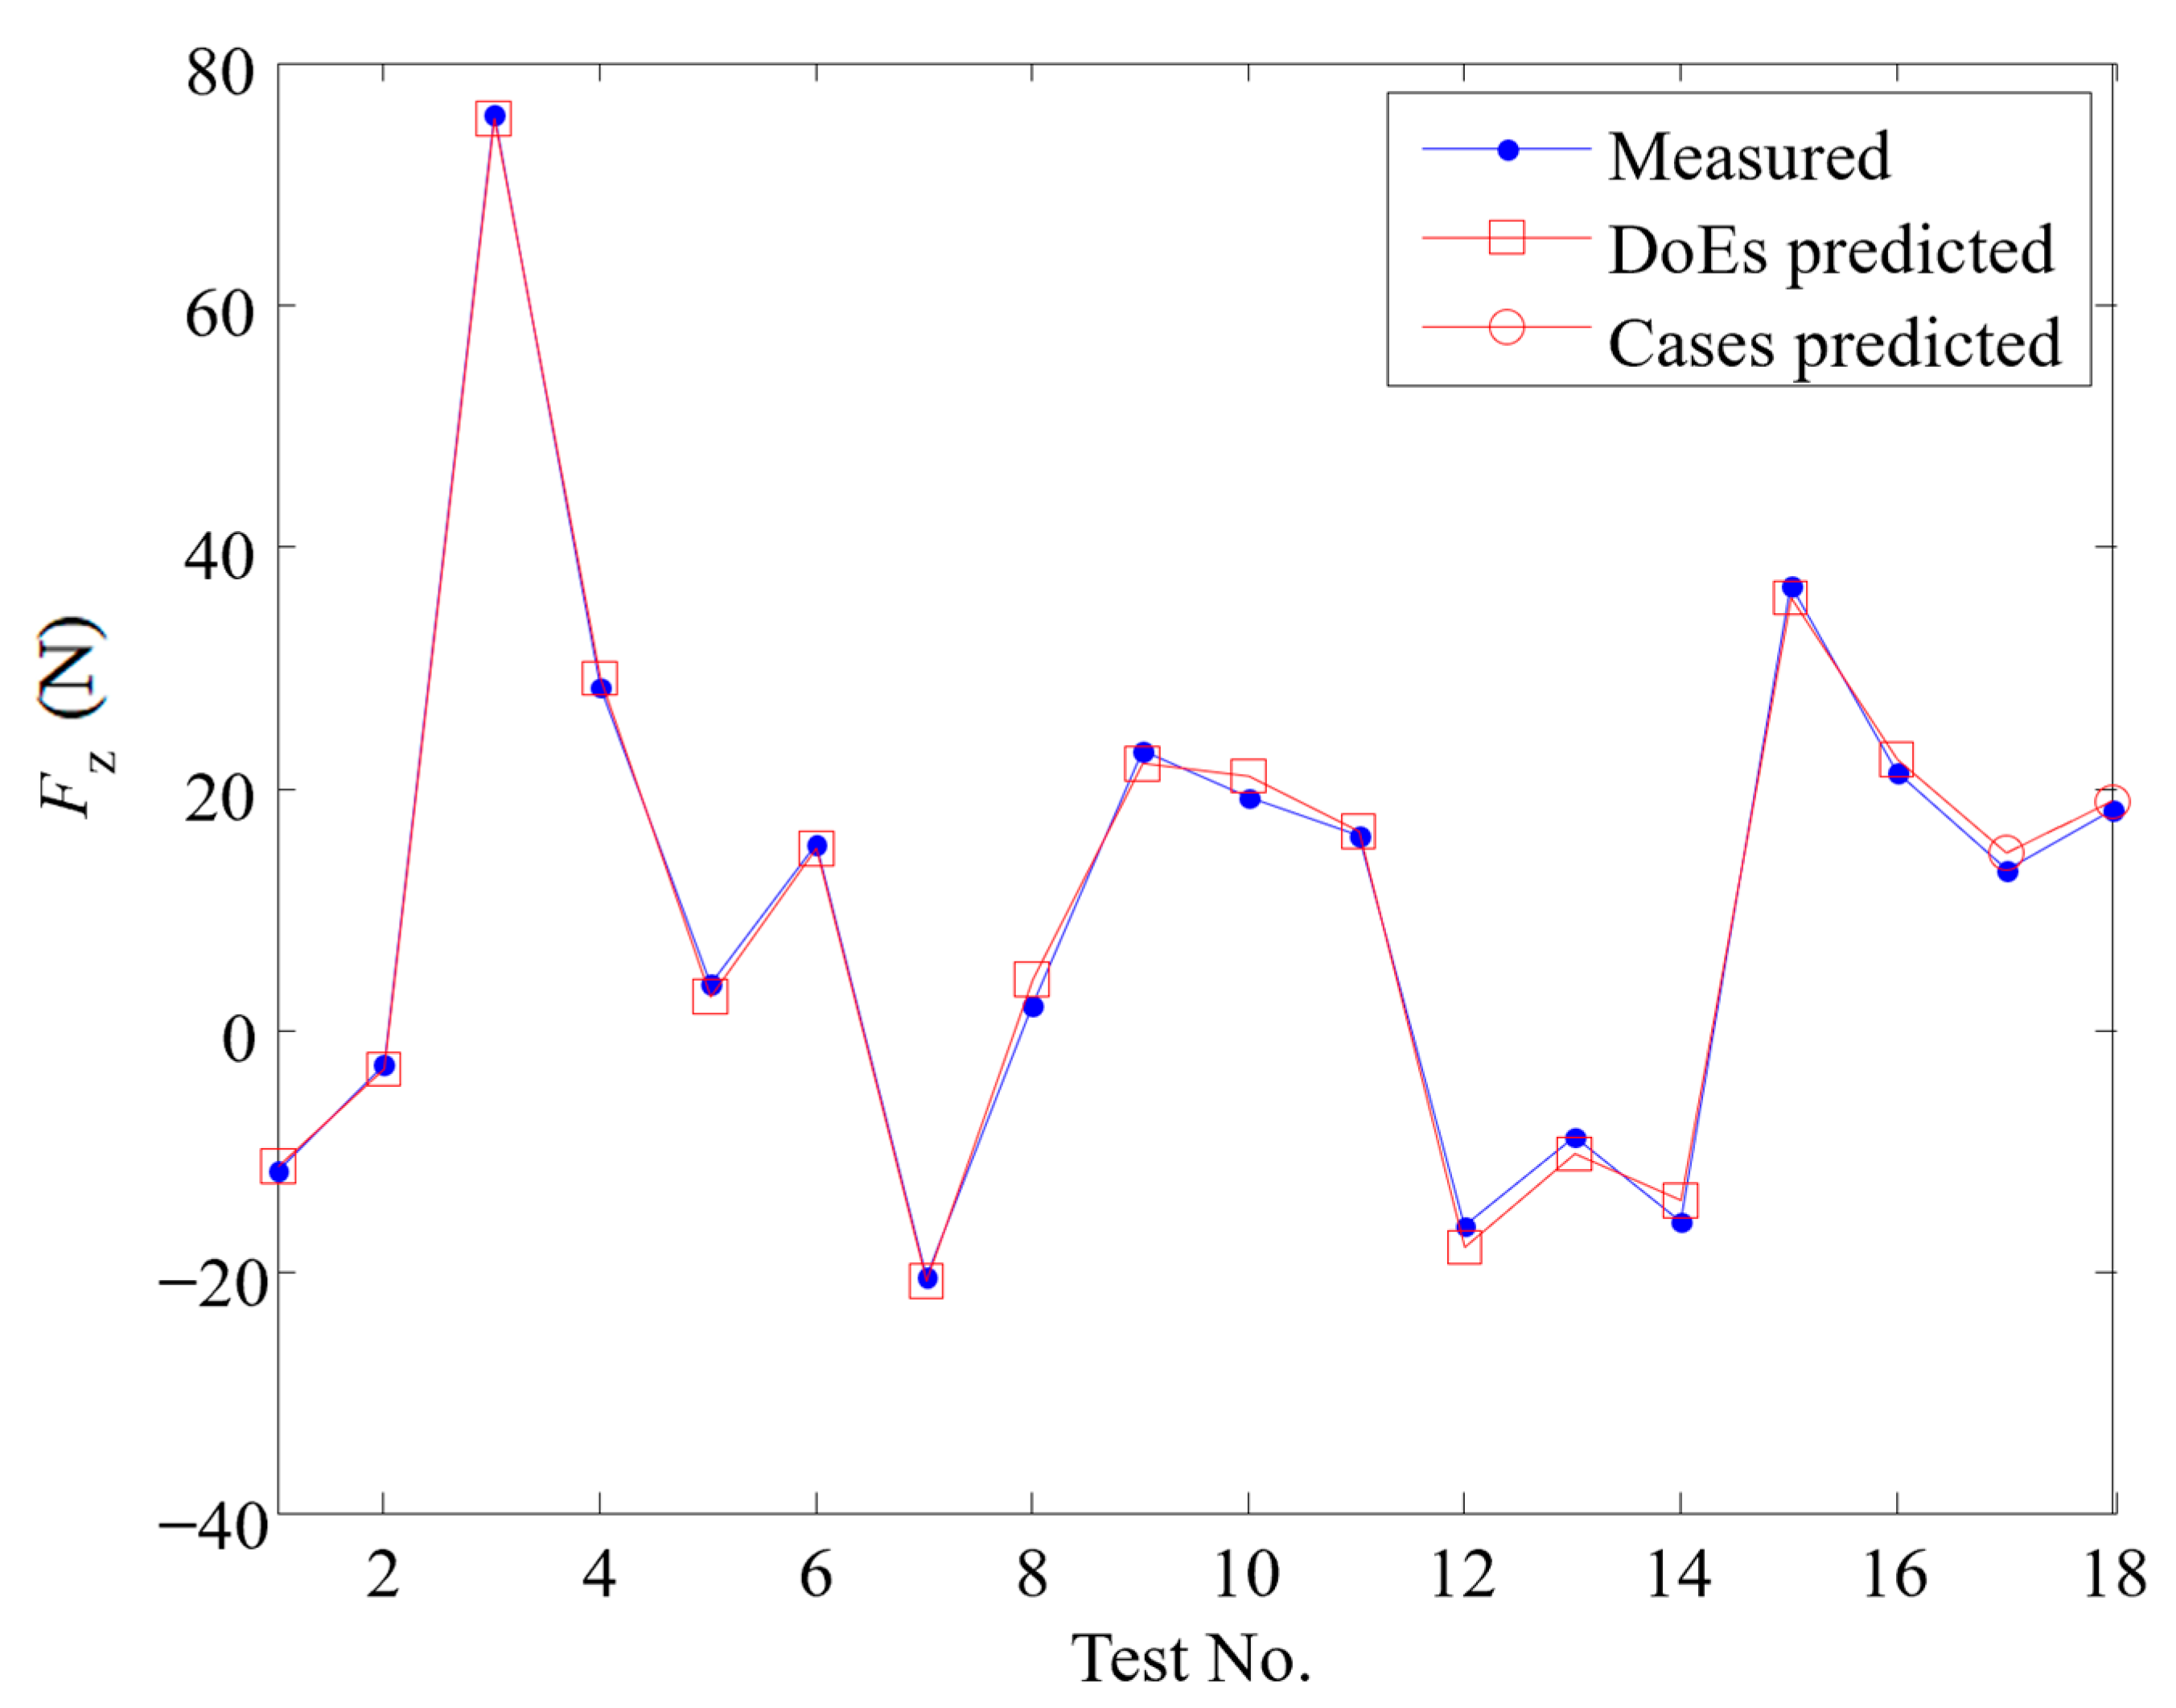
4.2. Response Surface Model Accuracy Analysis

Table 2 gives the measurement results for the first 16 sets of experiments and the final 2 sets of validation experiments, respectively. For the first 16 experimental data groups, respectively, we constructed response surface models of machining area error and milling force in the XYZ direction, and verified the performance of the fit. The prediction results from the two groups of validation experiments were then calculated using the established response-surface models, and compared to the actual measured results, in order to verify the predictive ability of the established response surface models within the feasible region of the machining parameter space. Figure 9, Figure 10, Figure 11 and Figure 12 show the response surface fit accuracy and the prediction accuracy of the machining surface error and the XYZ milling force in three directions, respectively. From the plot, it can be seen that the response surface model had a good accuracy of fit, and also showed a high accuracy of prediction in terms of prediction, which tested the efficacy of the response surface models established in this paper on a surface error and three-direction XYZ milling forces in robot assisted milling processes.

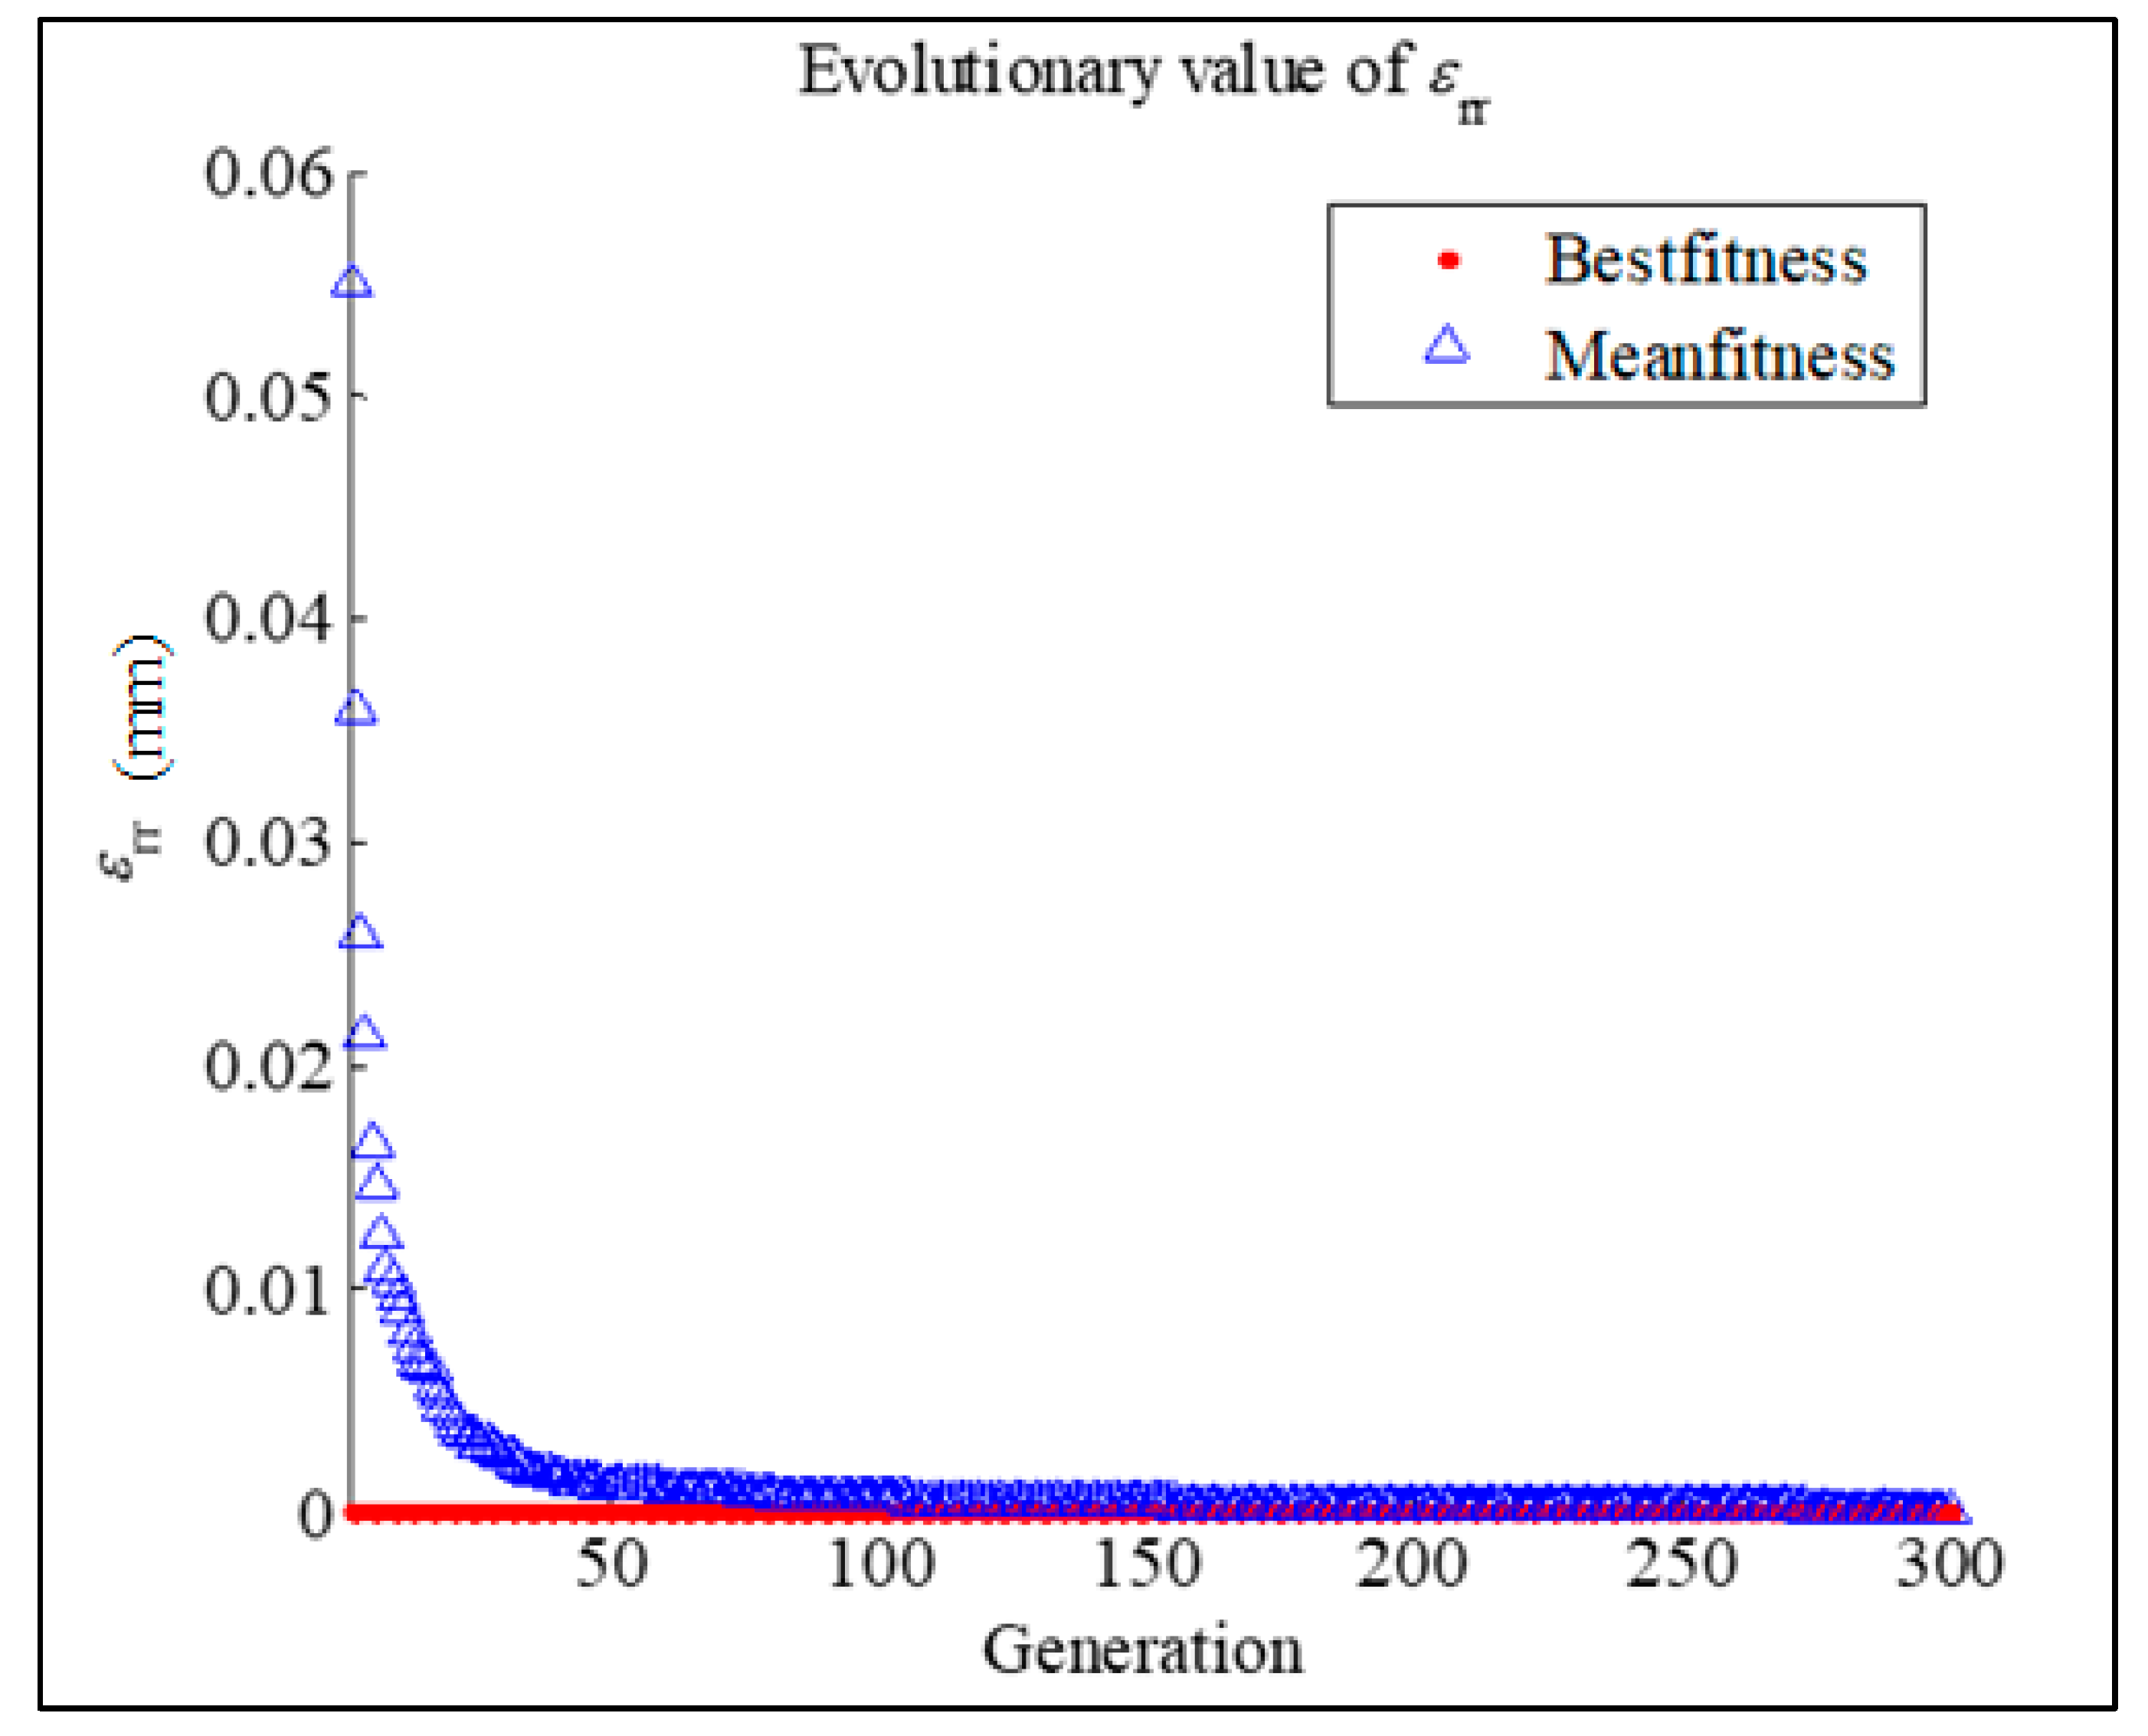
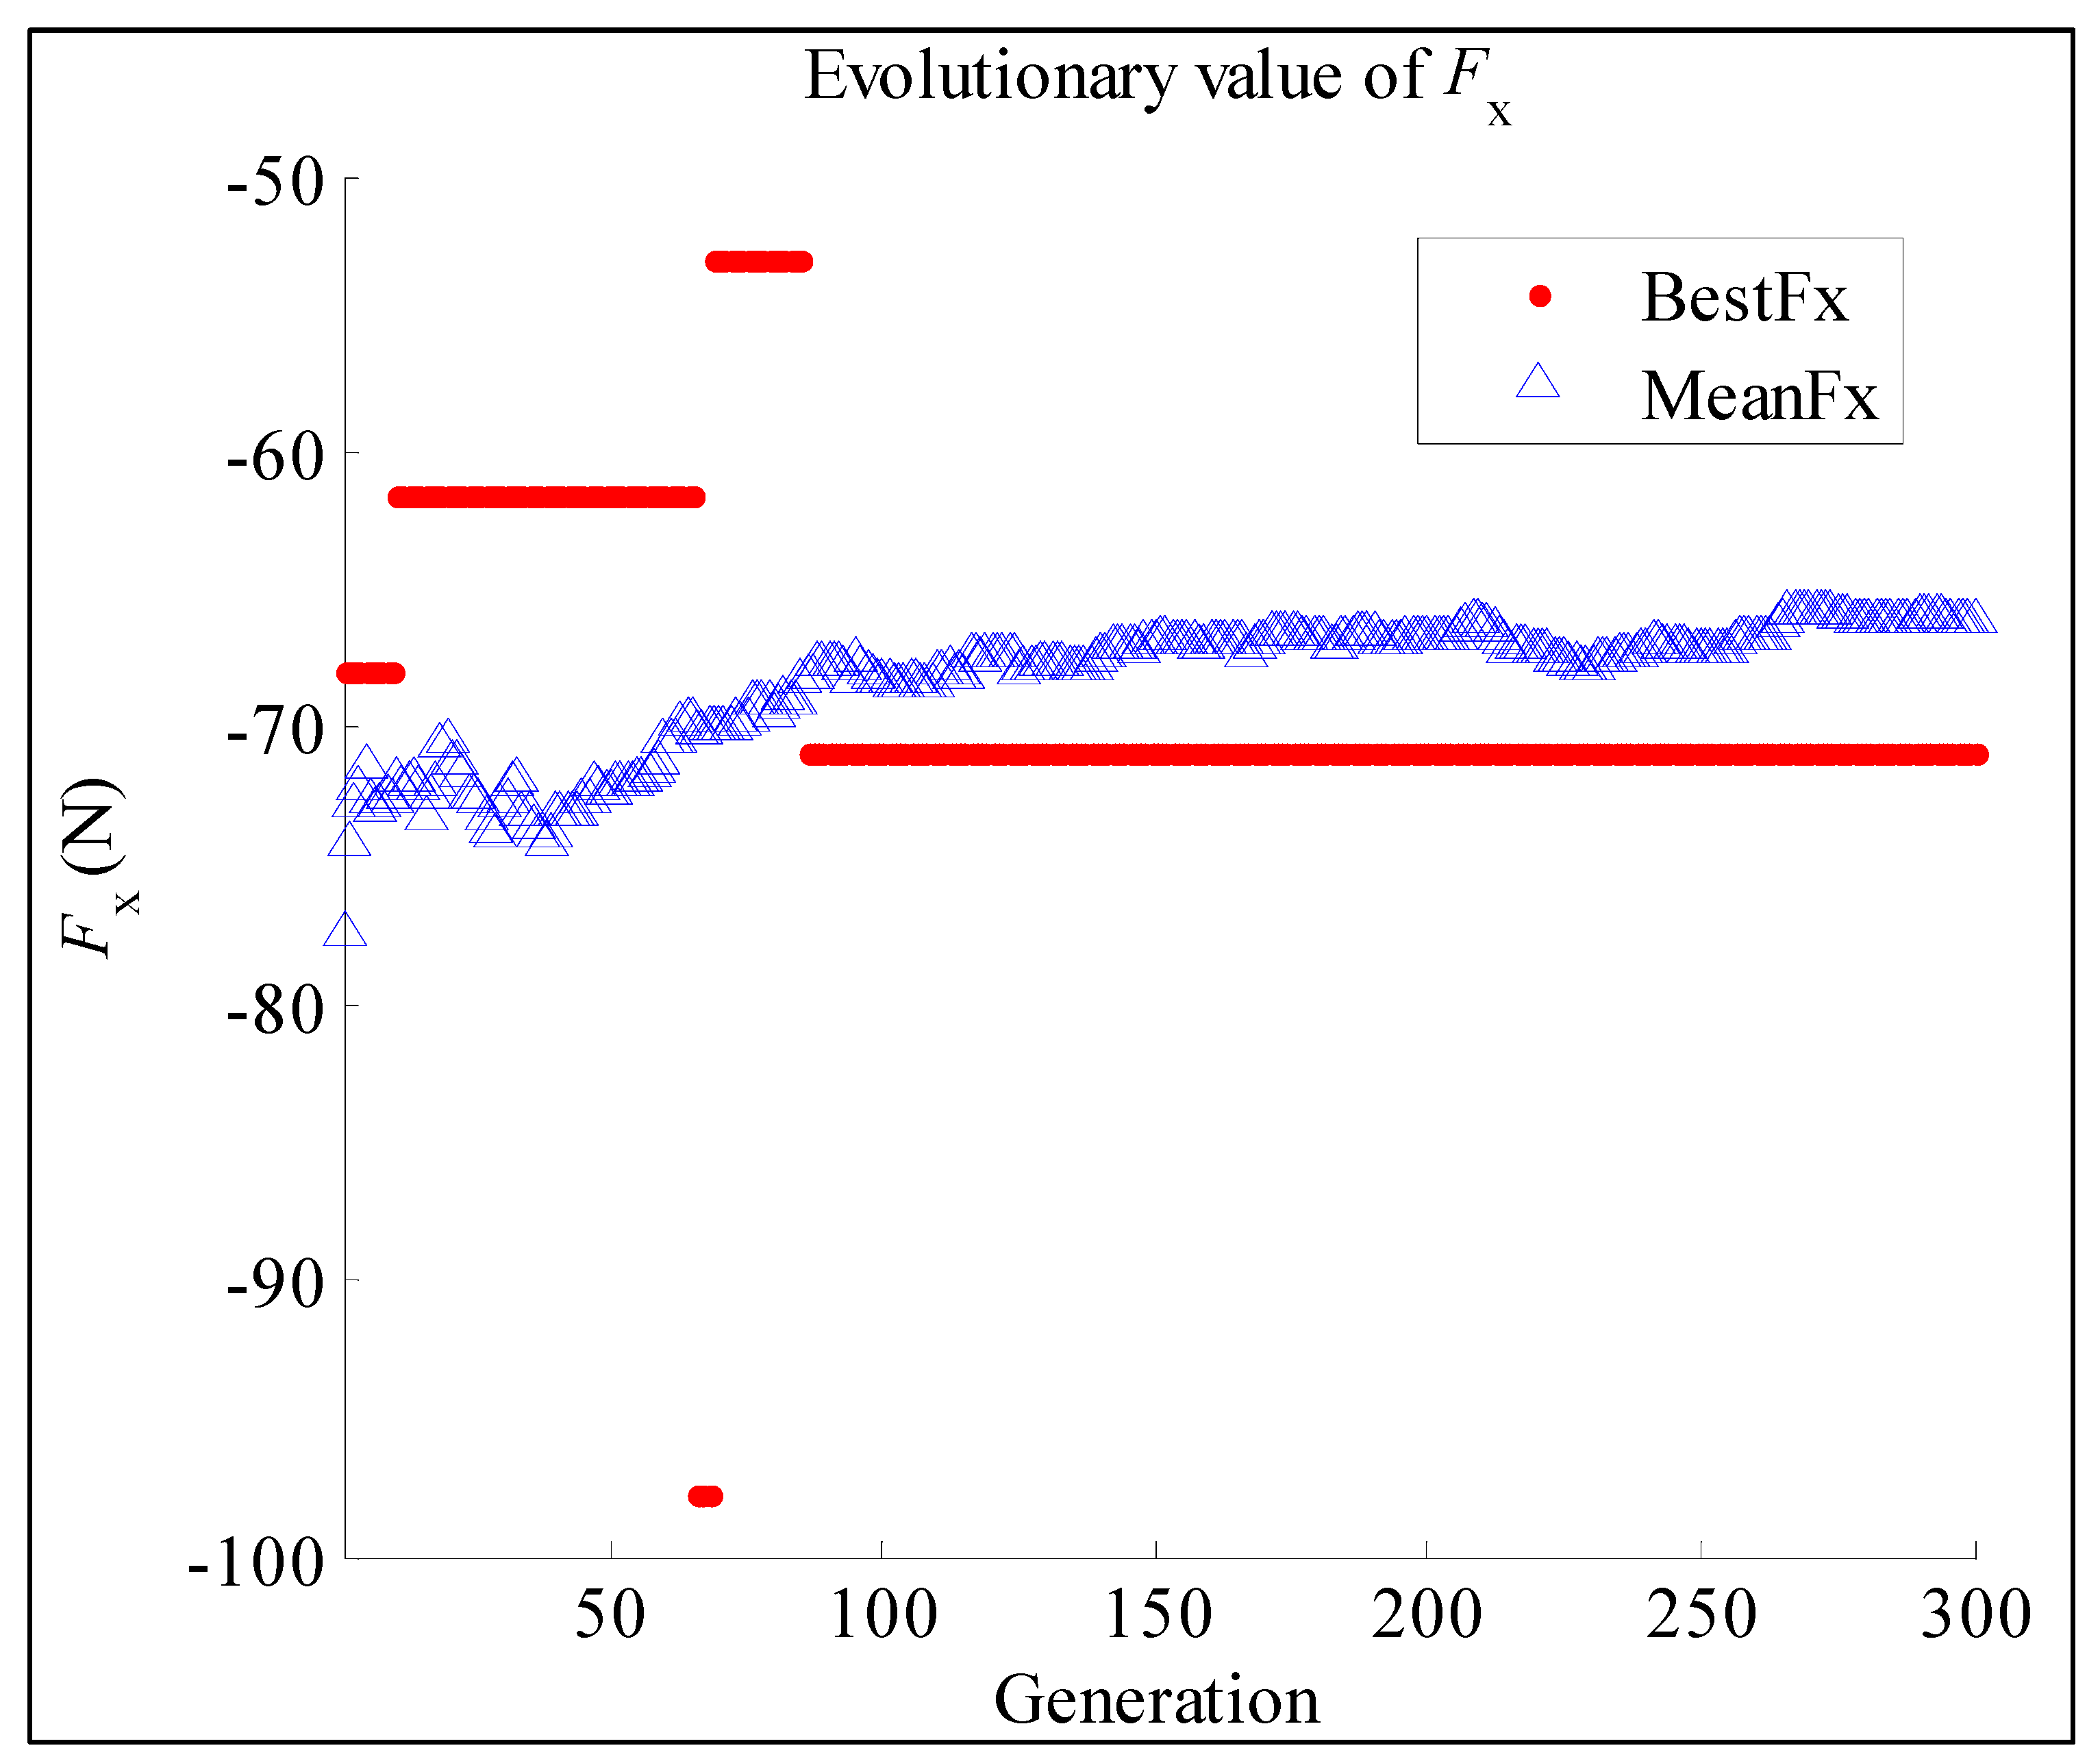
5. Process Optimization Based on Evolutionary Algorithm

The main objective of this study was to investigate the influence law between the milling process parameters and the milling force, as well as the machining surface error of the workpiece, and then to obtain the milling parameters that minimized the machining surface error of the workpiece. An evolutionary algorithm (EA), also known as an evolutionary optimization algorithm, is a heuristic random search algorithm with a “generation + detection” iterative process, and its vigorous development reflects the recent development of science and technology in the interpenetration and mutual promotion of life sciences and engineering sciences [39]. Evolutionary algorithms can achieve the global optimization of multi-factor objective functions via the simulation of the natural evolution process through program iterations, and then searching for the optimal solution for the problem in the feasible domain. Therefore, the milling process optimization work presented in this section was conducted based on the above response surface model, combined with an evolutionary optimization algorithm. The optimization model is constructed as shown in the following equation:
{ minimize ε r r = f ( X ) s . t . X l o w X X u p
where X l o w and X u p , respectively, are the upper and lower limits of the constraint range of the milling process parameters. The upper and lower limits of the range of values of the variables in this paper are X l o w = [ 5000 , 0.02 , 0.8 , 3.0 ] and X u p = [ 16000 , 0.08 , 2.8 , 14 ] .
An evolutionary optimization algorithm was used to carry out the optimization model of the above optimization model, to find the optimal calculation. The variation in the workpiece surface error, with the generations of population evolution in the calculation process, is shown in Figure 13. It can be seen from the graph that the optimization process converged to the optimal value after 100 generations, which reflects the fast optimization-seeking capability of the evolutionary optimization algorithm in the optimization process. After optimization, the optimal surface error is 4.406 × 10⁻⁷ mm, which is close to 0. The corresponding machining parameters are [9511 r/min, 0.039 mm/tooth, 1.078 mm, 10.51 mm], respectively, and the corresponding milling forces are [−70.91 N, −7.01 N, 17.43 N], while the mean values of the milling forces are [−66.11 N, −6.66 N, 6.79 N], as shown in Figure 14, Figure 15 and Figure 16. It can be seen that the surface error of the milling process can be minimized by the optimization of the process parameters. The results also show that the optimized surface error is not corresponding with the minimum milling forces. That is to say, it is not proper to control surface errors in the robot-assisted milling process by indicatively reducing milling forces, which may lead to lower machining efficiency. Therefore, the model proposed in this paper provides a theoretical way to control surface errors, while maintaining higher milling forces and machining efficiency.

6. Conclusions

The exploration of robot milling experiments, and optimization of process parameters can effectively reduce the machining area error. The conclusions of this paper are as follows.
  • The relationship between the ZL114A aluminum alloy robot-assisted milling process parameters and the milling force, as well as the surface error after machining, was investigated through milling machining experiments, machining surface measurement experiments, and milling-force measurement experiments. The process of milling robots demonstrates the phenomenon of “pulling the tool inwards in the up milling process while pushing the tool outwards in the down milling process”, excessive upward radial milling force should therefore be avoided as much as possible in practical application, in order to reduce the risk of cutting into the complex inner wall of cylindrical castings.
  • Experimental results have shown that machined surfaces with different milling parameters have different surface qualities and mechanical properties. The optimization of the machining parameters of the milling process can improve the milling performance and the surface quality of the robot, and the machined area error can be kept within an appropriate range, which provides a theoretical foundation for practical application in later plants.

Author Contributions

Conceptualization, S.L.; methodology and software, Q.G. and Y.J.; writing—original draft preparation, Y.J. and Q.G.; writing—review and editing, Q.G., Y.J., C.Y. and S.L.; supervision, S.L.; funding acquisition, S.L. All authors have read and agreed to the published version of the manuscript.

Funding

This work has been partially supported by the National Natural Science Foundation of China (Grant No. 52205487), the JCKY Research Program (2021110B048), the SAST–SJTU fund (USCAST2021-19), and the Startup Fund for Young Faculty at SJTU (SFYS at SJTU).

Data Availability Statement

Not applicable.

Conflicts of Interest

The authors declare no conflict of interest.

References

  1. Sun, Y.; Zhou, Y.; Ke, Z.; Tian, K.; Wang, B. Stiffener layout optimization framework by isogeometric analysis-based stiffness spreading method. Comput. Methods Appl. Mech. Eng. 2022, 390, 114348. [Google Scholar] [CrossRef]
  2. Chen, F.; Zhu, J.; Du, X.; Zhang, R.; Zhang, W. Shape preserving topology optimization for structural radar cross section control. Chin. J. Aeronaut. 2022, 35, 198–210. [Google Scholar] [CrossRef]
  3. Putra, G.L.; Kitamura, M.; Takezawa, A. Structural optimization of stiffener layout for stiffened plate using hybrid GA. Int. J. Nav. Archit. Ocean Eng. 2019, 11, 809–818. [Google Scholar] [CrossRef]
  4. Liu, Z.; Cho, S.; Takezawa, A.; Zhang, X.; Kitamura, M. Two-stage layout–size optimization method for prow stiffeners. Int. J. Nav. Archit. Ocean Eng. 2019, 11, 44–51. [Google Scholar] [CrossRef]
  5. Zhou, L.; Sigmund, O.; Zhang, W. Self-supporting structure design with feature-driven optimization approach for additive manufacturing. Comput. Methods Appl. Mech. Eng. 2021, 386, 114110. [Google Scholar] [CrossRef]
  6. Ji, W.; Wang, L. Industrial robotic machining: A review. Int. J. Adv. Manuf. Technol. 2019, 103, 1239–1255. [Google Scholar] [CrossRef] [Green Version]
  7. Krüger, J.; Zhao, H.; Reis De Ascencao, G.; Jacobi, P.; Surdilovic, D.; Schöll, S.; Polley, W. Concept of an offline correction method based on historical data for milling operations using industrial robots. Prod. Eng. 2016, 10, 409–420. [Google Scholar] [CrossRef]
  8. Cen, L.; Melkote, S.N.; Castle, J.; Appelman, H. A Wireless Force-Sensing and Model-Based Approach for Enhancement of Machining Accuracy in Robotic Milling. IEEE/ASME Trans. Mechatron. 2016, 21, 2227–2235. [Google Scholar] [CrossRef]
  9. Chen, P.Y.; Liu, S.; Jin, S.; Gu, Q. Geometric Modeling and Characterization of Wall Thickness for Complex Cylindrical Thin-Walled Parts with Uncertain Manufacturing Deviations. In Proceedings of the ASME 2021 International Mechanical Engineering Congress & Exposition (IMECE), Online, 1–5 November 2021. [Google Scholar]
  10. Rivière-Lorphèvre, E.; Huynh, H.N.; Ducobu, F.; Verlinden, O. Cutting Force Prediction in Robotic Machining. Procedia CIRP 2019, 82, 509–514. [Google Scholar] [CrossRef]
  11. Liu, S.; Jin, S.; Zhang, X.P.; Chen, K.; Tian, A.; Xi, L.F. A coupled model for the prediction of surface variation in face milling large-scale workpiece with complex geometry. J. Manuf. Sci. Eng. -Trans. ASME 2019, 1410, 31009–31014. [Google Scholar] [CrossRef]
  12. Liu, S.; Jin, S. Predicting milling force variation in time and space domain for multi-toothed face milling. Int. J. Adv. Manuf. Technol. 2020, 108, 2269–2283. [Google Scholar] [CrossRef]
  13. Abou-El-Hossein, K.A.; Kadirgama, K.; Hamdi, M.; Benyounis, K.Y. Prediction of cutting force in end-milling operation of modified AISI P20 tool steel. J. Mater. Process. Technol. 2007, 182, 241–247. [Google Scholar] [CrossRef]
  14. Ratnam, C.; Arun Vikram, K.; Ben, B.S.; Murthy, B.S.N. Process monitoring and effects of process parameters on responses in turn-milling operations based on SN ratio and ANOVA. Measurement 2016, 94, 221–232. [Google Scholar] [CrossRef]
  15. Ni, J.; Dai, R.; Yue, X.; Zheng, J.; Feng, K. Contribution Ratio Assessment of Process Parameters on Robotic Milling Performance. Materials 2022, 15, 3566. [Google Scholar] [CrossRef] [PubMed]
  16. Vakondios, D.; Kyratsis, P.; Yaldiz, S.; Antoniadis, A. Influence of milling strategy on the surface roughness in ball end milling of the aluminum alloy Al7075-T6. Measurement 2012, 45, 1480–1488. [Google Scholar] [CrossRef]
  17. Hassanpour, H.; Sadeghi, M.; Shajari, S. Empirical Modeling and Analysis of Surface Roughness in Milling Process of Nickel-Based Super Alloy Nimonic 115 through Response Surface Methodology. Adv. Mater. Res. 2011, 325, 430–435. [Google Scholar] [CrossRef]
  18. Persoons, W.; Vanherck, P. A Process Model for Robotic Cup Grinding. CIRP Ann. -Manuf. Technol. 1996, 45, 319–325. [Google Scholar] [CrossRef]
  19. Vakondios, D.; Kyratsis, P.; Yaldiz, S.; Antoniadis, A. Robotic grinding and polishing for turbine-vane overhaul. J. Mater. Process. Technol. 2002, 127, 140–145. [Google Scholar]
  20. Sun, Y.; Giblin, D.J.; Kazerounian, K. Accurate robotic belt grinding of workpieces with complex geometries using relative calibration techniques. Robot. Comput. -Integr. Manuf. 2009, 25, 204–210. [Google Scholar] [CrossRef]
  21. Ren, X.; Cabaravdic, M.; Zhang, X.; Kuhlenkötter, B. A local process model for simulation of robotic belt grinding. Int. J. Mach. Tools Manuf. 2007, 47, 962–970. [Google Scholar] [CrossRef]
  22. Song, Y.; Yang, H.; Lv, H. Intelligent Control for a Robot Belt Grinding System. IEEE Trans. Control Syst. Technol. 2013, 21, 716–724. [Google Scholar]
  23. Yang, F.; Xing, Y.; Li, X. A comprehensive error compensation strategy for machining process with general fixture layouts. Int. J. Adv. Manuf. Technol. 2020, 107, 2707–2717. [Google Scholar] [CrossRef]
  24. Jin, S.; Liu, S.; Zhang, X.P.; Chen, K. A unified prediction model of 3D surface topography in face milling considering multi-error sources. Int. J. Adv. Manuf. Technol. 2019, 102, 705–717. [Google Scholar] [CrossRef]
  25. Xu, P.; Gao, Y.; Yao, X.; Ng, Y.H.; Liu, K.; Bi, G. Influence of process parameters and robot postures on surface quality in robotic machining. Int. J. Adv. Manuf. Technol. 2023, 124, 2545–2561. [Google Scholar] [CrossRef]
  26. Li, W.; Li, B.; He, S.; Mao, X.; Qiu, C.; Qiu, Y.; Tan, X. A novel milling parameter optimization method based on improved deep reinforcement learning considering machining cost. J. Manuf. Process. 2022, 84, 1362–1375. [Google Scholar] [CrossRef]
  27. Qin, H.; Li, Y.; Xiong, X. Workpiece Pose Optimization for Milling with Flexible-Joint Robots to Improve Quasi-Static Performance. Appl. Sci. 2019, 9, 1044. [Google Scholar] [CrossRef] [Green Version]
  28. Vijay, S.; Krishnataj, V. Machining Parameters Optimization in End Milling of Ti6A14V. Procedia Eng. 2013, 64, 1079–1088. [Google Scholar] [CrossRef] [Green Version]
  29. Hou, T.; Su, C.; Liu, W. Parameters optimization of a nano-particle wet milling process using the Taguchi method, response surface method and genetic algorithm. Powder Technol. 2007, 173, 153–162. [Google Scholar] [CrossRef]
  30. Budak, E. Analytical Models for High Performance Milling: Part II: Process Dynamicsand Stability. Int. J. Mach. Tools Manuf. 2006, 46, 1489–1499. [Google Scholar] [CrossRef] [Green Version]
  31. Merdol, D.; Altintas, Y. Virtual Simulation and Optimization of Milling Applications: Part II: Optimization and Feedrate Scheduling. J. Manuf. Sci. Eng. 2008, 130, 051005. [Google Scholar] [CrossRef]
  32. Kumar, D.; Chandna, P.; Pal, M. Efficient optimization of process parameters in 2.5 D end milling using neural network and genetic algorithm. Int. J. Syst. Assur. Eng. Manag. 2018, 9, 1198–1205. [Google Scholar] [CrossRef]
  33. Campatelli, G.; Lorenzini, L.; Scippa, A. Optimization of process parameters using a Response Surface Method for minimizing power consumption in the milling of carbon steel. J. Clean. Prod. 2014, 66, 309–316. [Google Scholar] [CrossRef]
  34. Li, C.; Li, L.; Tang, Y.; Zhu, Y.; Li, L. A comprehensive approach to parameters optimization of energy-aware CNC milling. J. Intell. Manuf. 2019, 30, 123–138. [Google Scholar] [CrossRef]
  35. Velchev, S.; Kolev, I.; Ivanov, K.; Gechevski, S. Empirical models for specific energy consumption and optimization of cutting parameters for minimizing energy consumption during turning. J. Clean. Prod. 2014, 80, 139–149. [Google Scholar] [CrossRef]
  36. Kuram, E.; Ozcelik, B.; Bayramoglu, M.; Demirbas, E.; Simsek, B.T. Optimization of cutting fluids and cutting parameters during end milling by using D-optimal design of experiments. J. Clean. Prod. 2013, 42, 159–166. [Google Scholar] [CrossRef]
  37. Goswami, S.; Ghosh, S.; Chakraborty, S. Reliability analysis of structures by iterative improved response surface method. Struct. Saf. 2016, 60, 56–66. [Google Scholar] [CrossRef]
  38. Neşeli, S.; Yaldız, S.; Türkeş, E. Optimization of tool geometry parameters for turning operations based on the response surface methodology. Measurement 2011, 44, 580–587. [Google Scholar] [CrossRef]
  39. Karafotias, G.; Hoogendoorn, M.; Eiben, A.E. Parameter Control in Evolutionary Algorithms: Trends and Challenges. IEEE Trans. Evol. Comput. 2015, 19, 167–187. [Google Scholar] [CrossRef]
Figure 1. Schematic diagram of the robotic-assisted milling process for casting cylindrical parts.
Machines 11 00655 g001
Figure 2. The setup of the robot-assisted milling system and measurement system.
Machines 11 00655 g002
Figure 3. Measuring points and measuring tools.
Machines 11 00655 g003
Figure 4. Example of milling paths and the machined surface.
Machines 11 00655 g004
Figure 5. Milling forces during the machining process.
Machines 11 00655 g005
Figure 6. The surface of the workpieces after milling in experiments 1–16.
Machines 11 00655 g006
Figure 7. Statistical graph of milling forces during the milling machining experiments.
Machines 11 00655 g007
Figure 8. The relationship between machined-surface error and Y-direction milling force.
Machines 11 00655 g008
Figure 9. The fitting accuracy and prediction accuracy of the response surface model for surface error.
Machines 11 00655 g009
Figure 10. The fitting accuracy and prediction accuracy of the response surface model for X-directional milling force.
Machines 11 00655 g010
Figure 11. The fitting accuracy and prediction accuracy of the response surface model for Y-directional milling force.
Machines 11 00655 g011
Figure 12. The fitting accuracy and prediction accuracy of the response surface model for Z-directional milling force.
Machines 11 00655 g012
Figure 13. The plot of the mean and optimal values of surface error with population evolution in the optimization process.
Machines 11 00655 g013
Figure 14. The plot of the mean and optimal values of X-directional milling force with population evolution in the optimization process.
Machines 11 00655 g014
Figure 15. The plot of the mean and optimal values of Y-directional milling force with population evolution in the optimization process.
Machines 11 00655 g015
Figure 16. The plot of the mean and optimal values of Z-directional milling force with population evolution in the optimization process.
Machines 11 00655 g016
Table 1. Design of finish-milling parameter factor level table.
Parameter LevelSpindle Speed
[r/min]
Feed per Tooth
[mm/tooth]
Cutting Depth
[mm]
Radial Cutting Depth
[mm]
160000.031.03.2
290000.041.56.4
312,0000.052.09.6
415,0000.062.512.8
Table 2. Experimental design and results.
NumberParameter LevelUp Milling
Spindle SpeedFeed per ToothCutting DepthRadial Cutting DepthFxFyFzεrrStandard
Deviation
[r/min][mm/tooth][mm][mm][N][N][N][mm]
160000.0313.2−23.89−1.75−11.810.0160.015
260000.041.56.4−64.10−5.12−3.060.020.017
360000.062.512.8−172.68−31.2575.730.2240.033
480000.051.211.2−74.84−8.7128.180.0550.051
590000.031.59.6−66.55−6.183.830.0420.028
690000.04112.8−58.12−5.6915.210.0170.027
790000.052.53.2−63.24−7.24−20.500.0560.027
890000.0626.4−94.53−12.662.060.0410.029
910,0000.051.68−87.04−10.0422.990.0720.046
1012,0000.03212.8−91.55−10.3419.210.0750.032
1112,0000.042.59.6−111.11−14.0815.860.0860.030
1212,0000.061.53.2−43.19−4.33−16.240.0500.022
1315,0000.032.56.4−76.81−7.62−8.830.0480.019
1415,0000.0423.2−45.47−3.92−15.970.100.063
1515,0000.051.512.8−87.95−10.9336.760.1470.065
1615,0000.0619.6−59.82−6.9221.400.0950.037
T180000.041.69.6−80.45−7.9713.270.0450.069
T213,0000.031.811.2−83.17−9.4718.170.0500.029
Table 3. Correlation coefficients of the regression models.
Correlation CoefficientFxFyFzεrr
R 2 0.99540.99960.99960.9979
Disclaimer/Publisher’s Note: The statements, opinions and data contained in all publications are solely those of the individual author(s) and contributor(s) and not of MDPI and/or the editor(s). MDPI and/or the editor(s) disclaim responsibility for any injury to people or property resulting from any ideas, methods, instructions or products referred to in the content.

