Article

Artificial Neural Network-Based Predictive Model for Finite Element Analysis of Additive-Manufactured Components

1
Faculty of Industrial Engineering, Robotics and Production Management, Technical University of Cluj-Napoca, Bulevardul Muncii nr. 103-105, 400641 Cluj-Napoca, Romania
2
Faculty of Manufacturing Technologies with a Seat in Presov, Technical University of Kosice, Bayerova 1, 080 01 Presov, Slovakia
*
Author to whom correspondence should be addressed.
Machines 2023, 11(5), 547; https://doi.org/10.3390/machines11050547
Submission received: 15 April 2023 / Revised: 8 May 2023 / Accepted: 9 May 2023 / Published: 12 May 2023
(This article belongs to the Special Issue Advances in Computer-Aided Technology II)

Abstract

:
Additive manufacturing is becoming one of the most utilized tools in an increasing number of fields from Industry 4.0 concepts, engineering, and manufacturing to aerospace and medical applications. One important issue with additive-manufactured components is their orthotropic behaviour where mechanical properties are concerned. This behaviour is due to the layer-by-layer manufacturing process and is particularly hard to predict since it depends on a number of factors, including the manufacturing parameters used during the manufacturing process (speed, temperature, etc.). This study aimed to create and train an artificial neural network-based predictive model using empirical tensile strength data obtained from additive manufactured test parts using the FDM method and PLA material. The predictive model was designed to predict mechanical characteristics for different orientation axis, which were used to set the material properties for finite element analysis. Results indicate a strong correlation between predicted finite element analysis behaviour and real-world tests on additive-manufactured components. The neural network model was trained to an accuracy of ~93% for predicting the mechanical characteristics of 3D-printed PLA material. Using the predicted mechanical characteristics for defining a custom orthotropic material profile in finite element analysis, the simulated failure mode and the behaviour of a complex geometry component agreed with the real-world test.

1. Introduction

The advantages of additive manufacturing technologies make them an attractive option in a variety of fields. Direct CAD to finished product manufacturing, the ability to fabricate components of high geometric complexity, and the overall flexibility and versatility of additive manufacturing techniques have contributed to an increase in the exploitation of these technologies. For all the advantages, additive manufacturing also suffers from a series of disadvantages, for example, low dimensional accuracy and surface quality. One of the most limiting factors of additive manufacturing is the orthotropic mechanical behaviour of the components fabricated using these technologies. Due to the layer-by-layer fabrication process intrinsic to additive manufacturing, the parts obtained present different mechanical properties for different orientation planes. As such, any given additive manufactured component tends to have a lower tensile strength in the direction perpendicular to the planes of the deposited layers. The tensile strength of additive manufactured components in the direction parallel to the deposited layers can also differ drastically from the tensile strength of the bulk material, mostly because the walls and, thus, the contours of the fabricated parts are generated by lines which are fused by sintering (in the case of selective laser sintering), melting (for fused deposition modelling and selective laser melting), or polymerisation (in the case of SLA).
Due to the nature of additive manufacturing technologies and the strategy of fusing lines to form walls and layers to build up the parts, the mechanical behaviour of additive-manufactured components is hard to model since it depends on a large number of factors, for example, the different process parameters (manufacturing speed, temperature, part orientation, etc.) and interactions between factors.
Previous studies by A.D. Sterca et al. [1] determined by statistical methods that there is a correlation between FDM process parameters and the dimensional accuracy of the printed parts. Further studies by S.D. Grozav et al. [2] tested, with good results, the feasibility of employing neural-network-based models for predicting the dimensional accuracy as well as the mechanical properties of components obtained by FDM additive manufacturing.
Work by Rodriguez et al. [3] used statistical methods with good results to determine the influence of parameters such as nozzle diameter, layer height, infill density, printing speed, layer orientation, and infill pattern on the mechanical characteristics of components fabricated using FDM from PLA material.
A study by Tura et al. [4] used predictive models to determine, to a good degree of accuracy, the effects of parameters such as raster angle, orientation angle, air gap, raster width, and layer height on the mechanical properties of FDM-manufactured parts using ABS material. Studies by Yadav D. et al. [5] were carried out on improving the tensile strength of additive manufactured parts by employing neural networks trained on parameters such as infill density, extrusion temperature, and material density, showing a 4.54% improvement in subsequent samples. Saleh et al. [6] performed a study using mathematical and neural-network-based predictive models to determine the mechanical characteristics of lattice structures fabricated using carbon fibre/PLA material, reaching a prediction accuracy of ~93%. Jatti et al. [7] performed research on optimising the tensile strength of FDM-manufactured components by using machine learning algorithms and the desirability approach with great results, showing a good correlation between predictions and real-world data. Ding et al. [8] conducted studies on special plastics for engineering, e.g., PEI and PEEK, showing a strong correlation between process parameters and mechanical behaviour, allowing them to optimize the mechanical characteristics by adjusting the process parameters. Studies [9] performed on components printed using different orientation angles were also performed by Khosravani et al., evidentiating the orthotropic behaviour of additive-manufactured components. Zhang et al. [10] performed a study on reducing dimensional error and warping of 3D-printed components by optimizing the process parameters using the Taguchi method and fuzzy comprehensive evaluation, showing that the most influential factor in the study is the extrusion speed of the material. Alhazmi et al. [11] performed a study on the influence of raster angle and infill density, showing different mechanical behaviour and failure modes for different combinations of parameters. Omiyale et al. [12] studied the effects of process parameters using the Taguchi method, predicting combinations of parameters that can be optimized for different mechanical characteristics of the 3D-printed components. Tran et al. [13] researched the possibility of improving 3D-printed components’ quality and mechanical behaviour by varying the process parameters according to experimental data and results reported in the literature, showing that the components produced using the recommended parameters presented good dimensional and geometric characteristics as well as good mechanical behaviour. Peng et al. [14] applied genetic algorithms for the prediction of optimized process parameters for the manufacturing of 3D-printed components, showing an increase in part quality. Chacon [15] studied the effects of process parameters on the mechanical properties of 3D-printed structures, leading to a mathematical model for the selection of the optimal combination of parameters for a given geometry. Ayatollahi et al. [16] performed an in-depth analysis of the mechanical properties of 3D-printed parts using advanced techniques such as scanning electron microscopy, showing and explaining the different failure modes of the test samples.
As can be seen from these studies, the behaviour of 3D-printed components can be characterized using predictive models and statistical techniques with varying degrees of accuracy, encouraging further research in the field.
The study presented in this paper attempted to address the issue of modelling the mechanical behaviour of additive-manufactured components by employing an artificial neural network-based predictive model to determine the mechanical characteristics of 3D-printed parts which can be used to inform material profiles for use in finite element analysis, enabling the simulation of the behaviour of these components under load.
The study was performed on a set of 48 test samples fabricated using fused deposition modelling (FDM) with different parameters and combinations of parameters (nozzle temperature, printing speed, orientation). The material used for testing was PLA (polylactic acid), and all the test samples were fabricated from the same roll of material. The fabricated components were subjected to tensile strength measurements, providing empirical data on the mechanical characteristics of different process parameter combinations. PLA was chosen because in a previous study [2] it was shown to have the highest variability of mechanical properties for different process parameter combinations and because it is one of the most popular 3D-printing materials. Another reason for choosing PLA is the availability of more data from previous studies on components manufactured using this material. These data can be used to average out the noise and outliers in the measurements, increasing the statistical significance of the data and the accuracy of the predictive mathematical model.
In order to predict the mechanical characteristics of a given set of process parameters, a predictive model needs to be devised. Because mechanical characteristics of the 3D-printed components depend on the bonding strength between both the layers and the lines which form the wall, the predictive model needs to be able to approximate very complex functions; therefore, the model used in this study employed an artificial neural network which was trained on the empirical data obtained from tensile strength measurements of the test samples. The predicted mechanical characteristics, together with empirical data obtained from strain–stress measurements, were used to create an orthotropic material profile for finite element analysis, which can be used for modelling the behaviour of complex additive manufactured components.

2. Materials and Methods

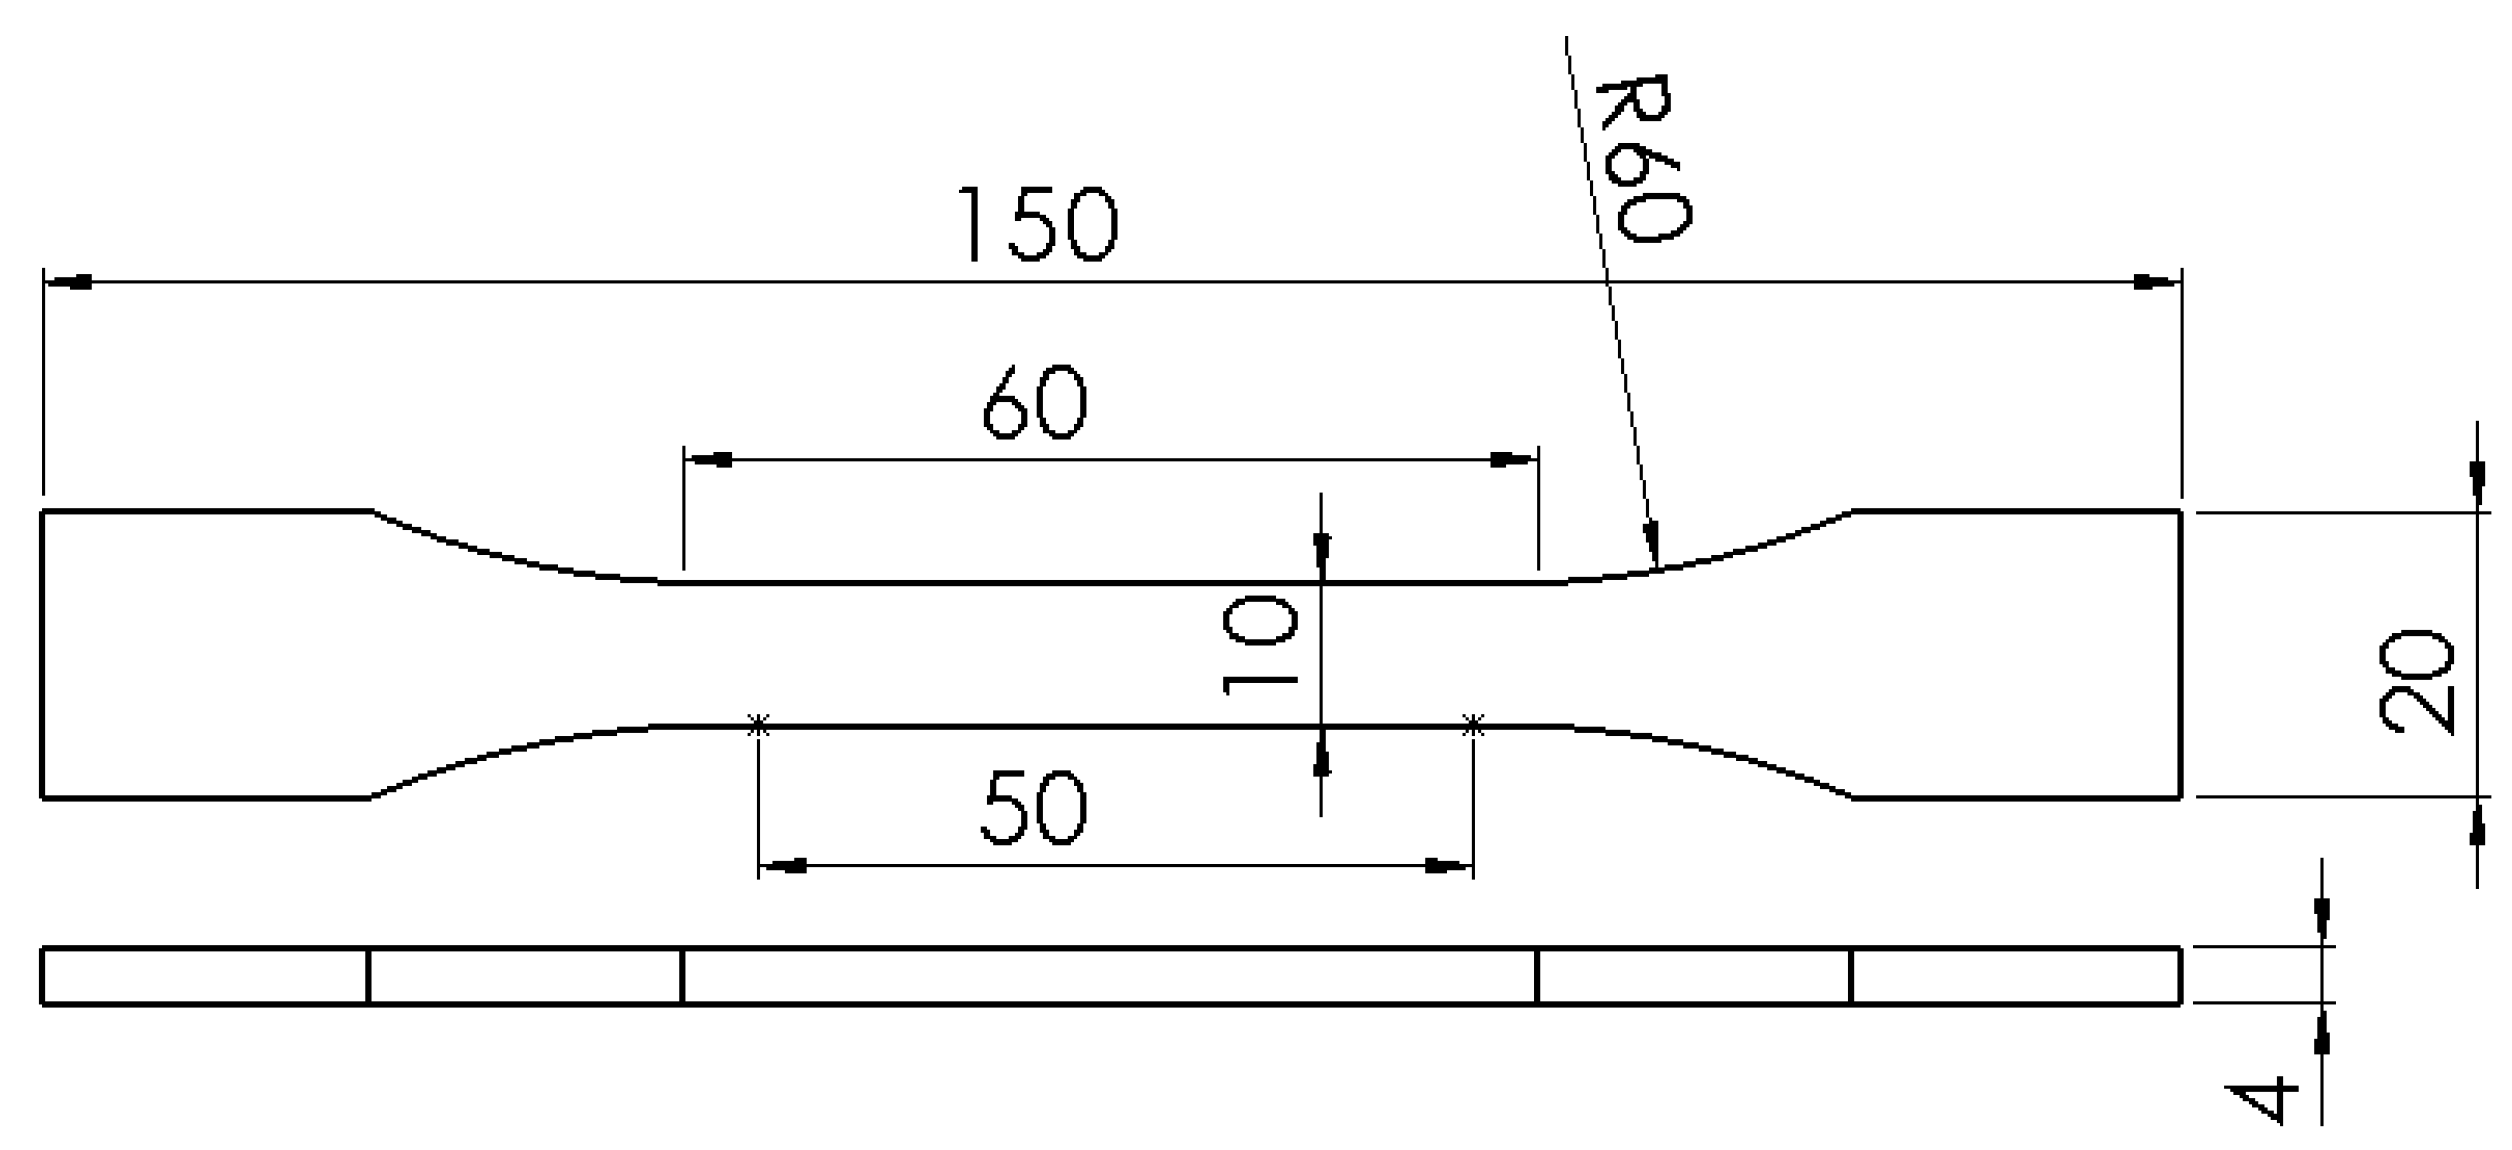
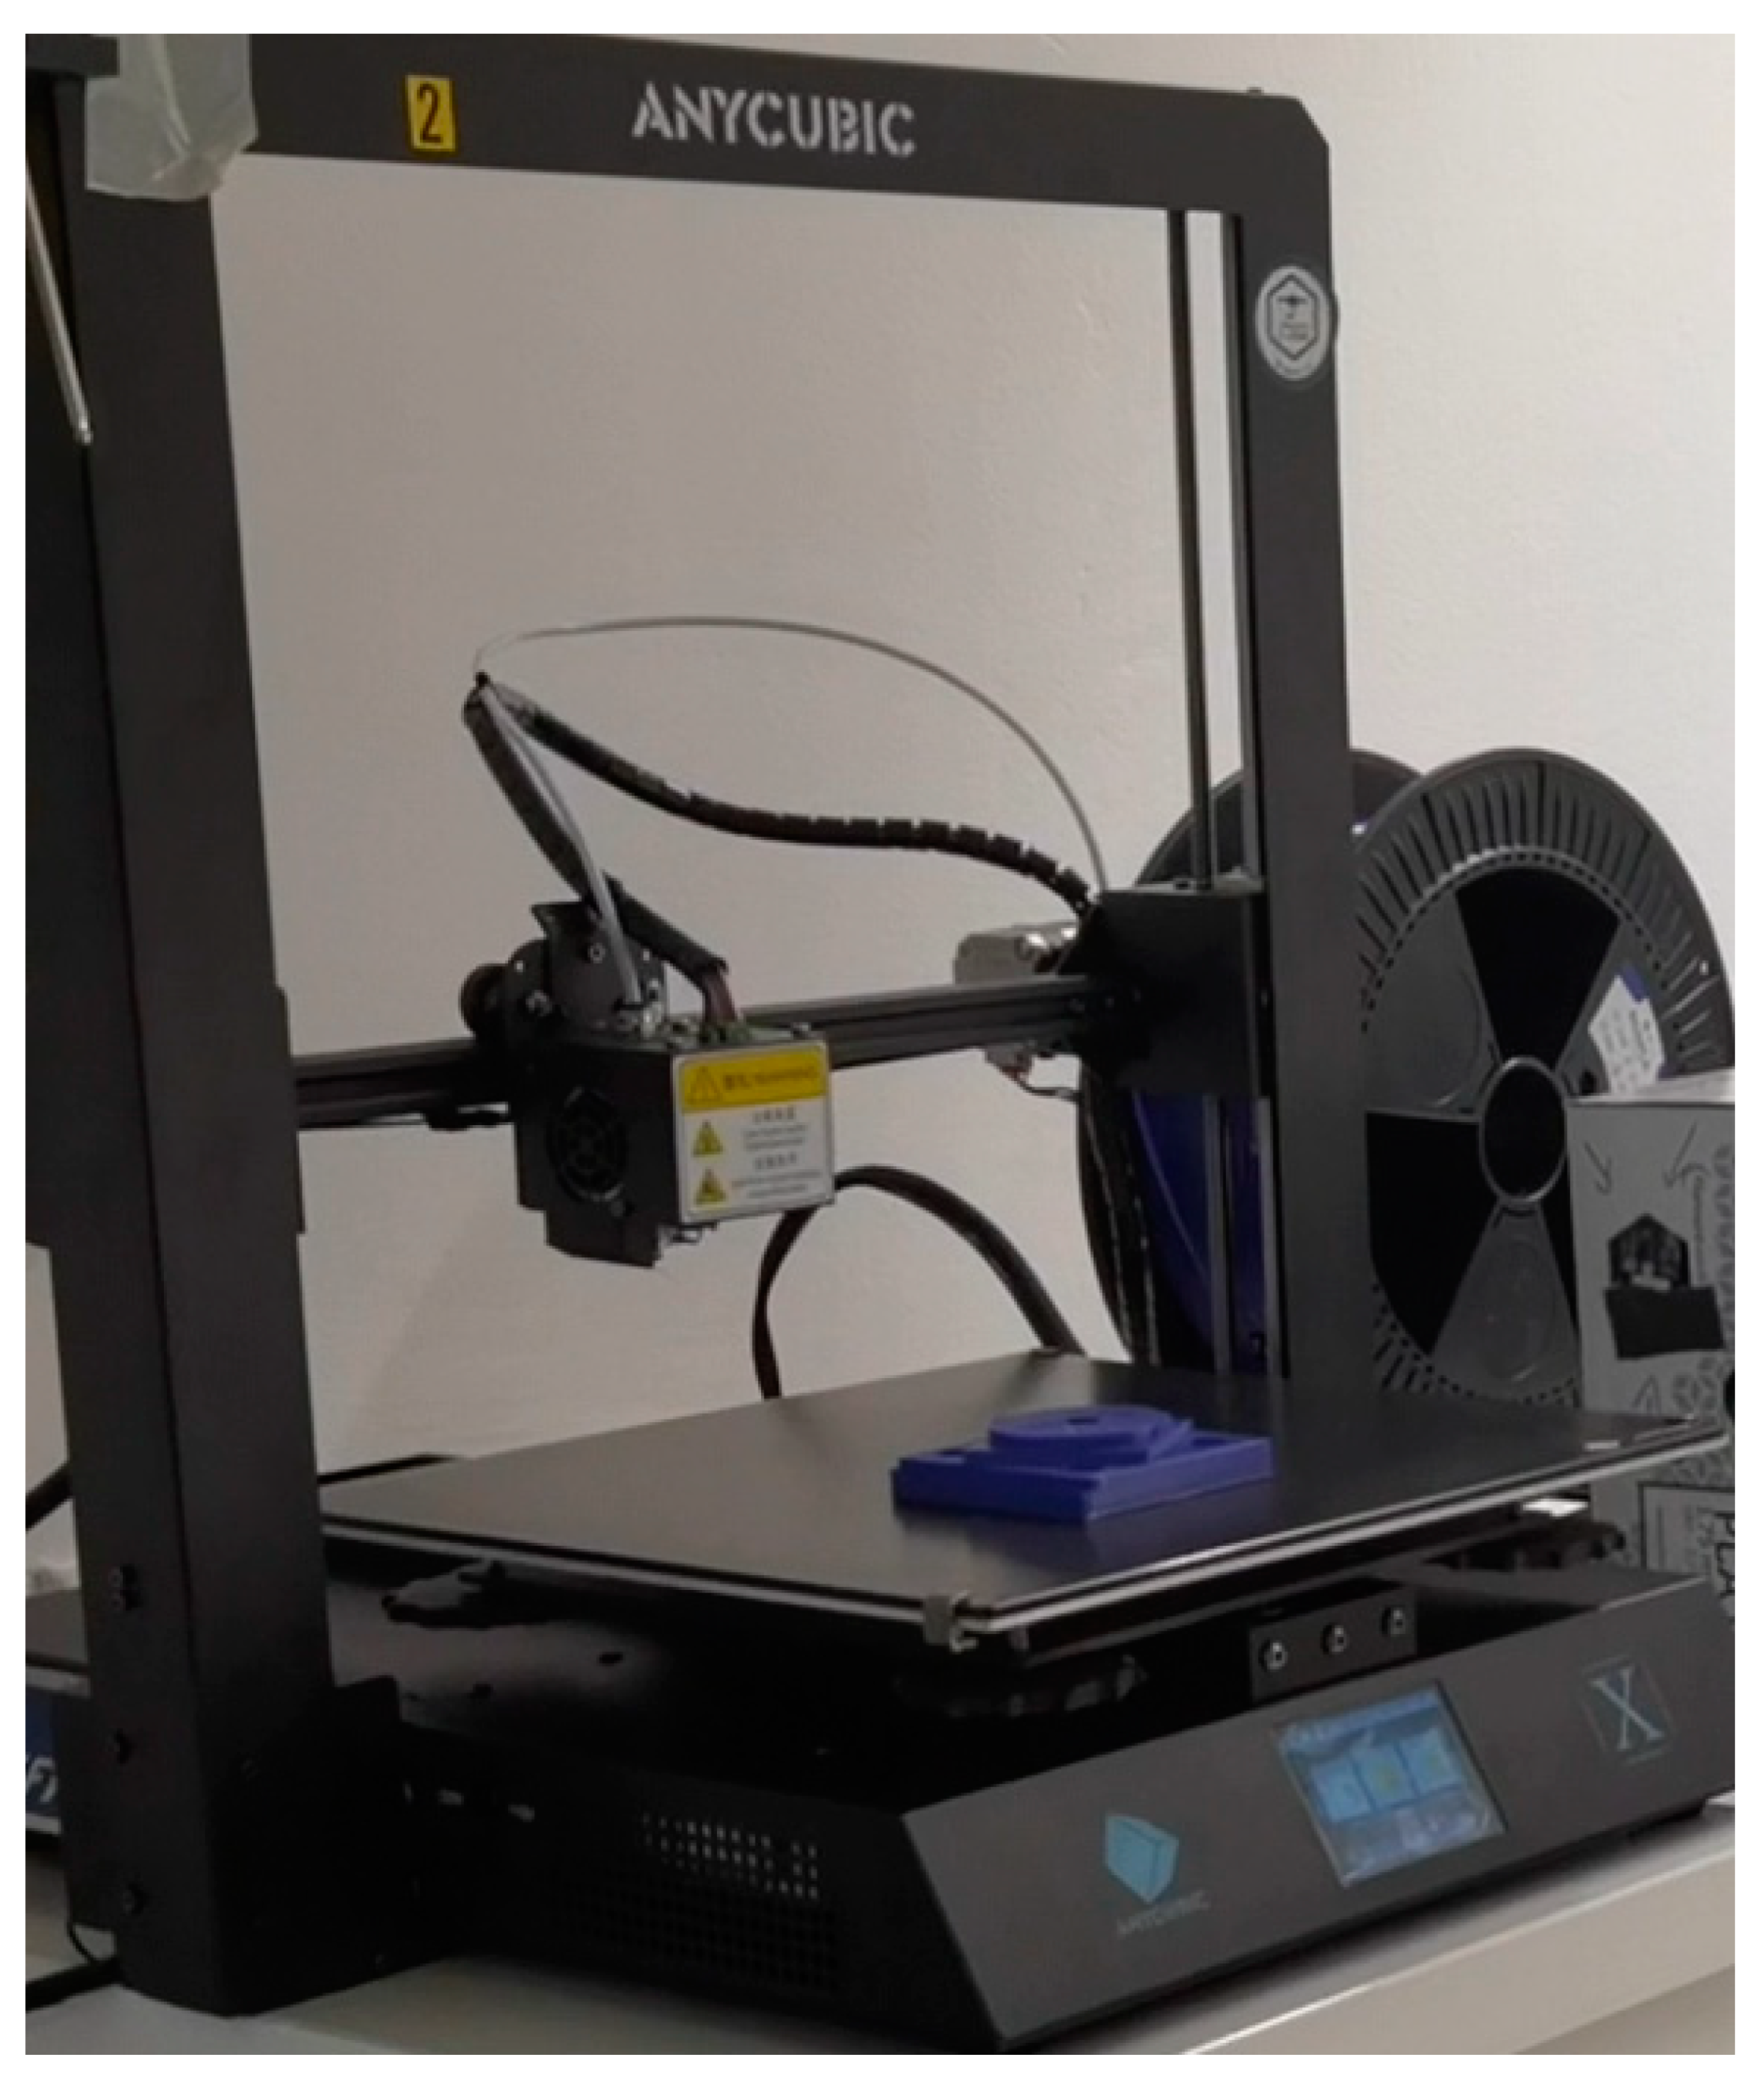
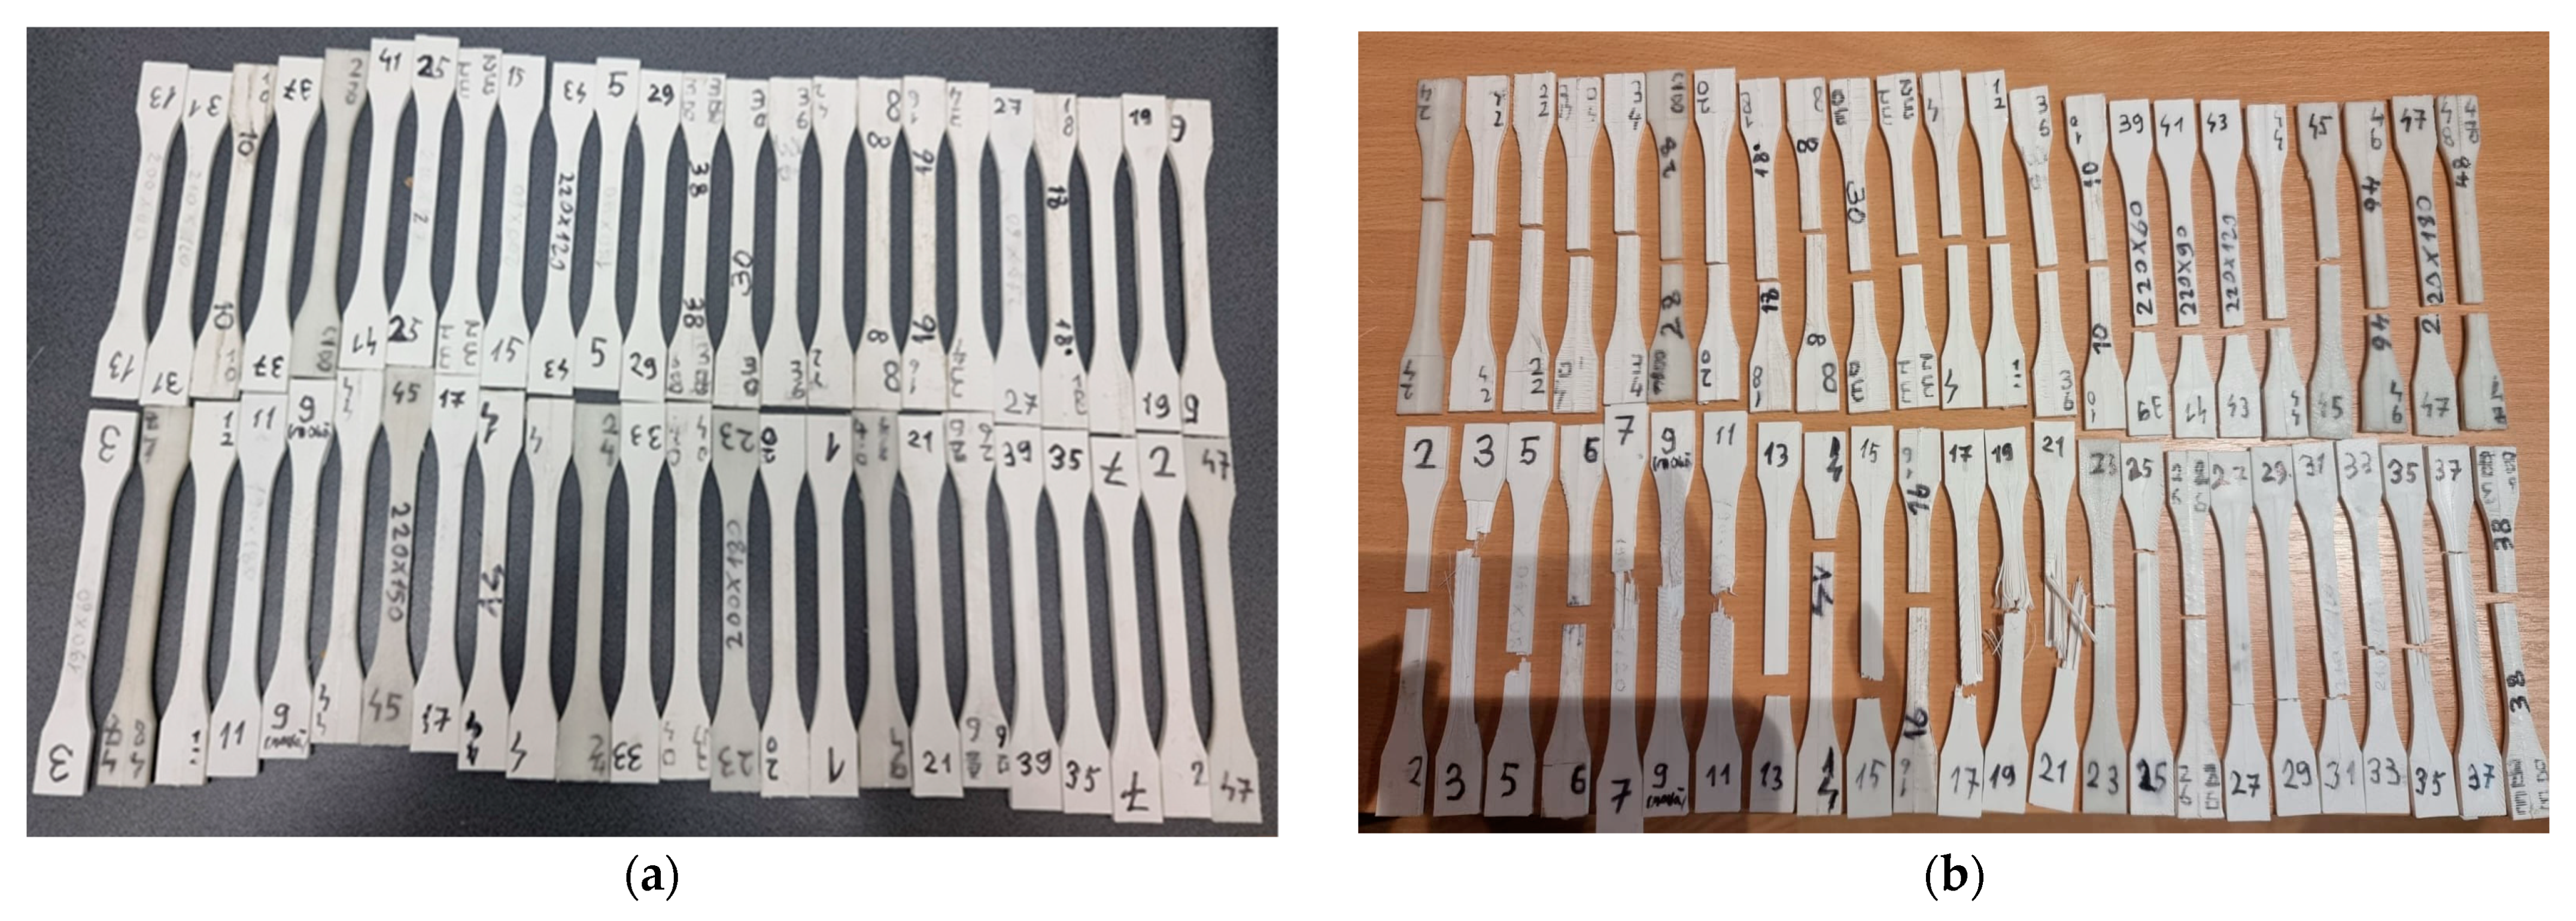
2.1. Test Sample Preparation

The study was performed on 48 test samples which were manufactured according to the ISO527-2 standard [17] using the FDM additive manufacturing technique. The test sample used with relevant dimensions for the ISO527-1B tensile test sample can be seen in Figure 1.
Manufacturing of the test samples was performed in pairs of two, one horizontal and one vertical, positioned in the central area of the machine build platform, ensuring the same manufacturing conditions in both orientations. The process parameters (speed and nozzle temperature) were varied according to Table 1.
The fabrication of the test samples was performed using an Anycubic Mega X 3D printer [18], which is presented in Figure 2. The test samples were manufactured using a 0.4 mm diameter nozzle at a layer height of 0.2 mm. The infill was 100%; however, a strategy of printing the samples using only concentric walls instead of an infill pattern was chosen, to further evidentiate the orthotropic behaviour.
An image of the manufactured tensile test specimens is presented in Figure 3a, while an image of the test specimens after tensile testing is presented in Figure 3b. The principal physical and mechanical characteristics of the PLA material in bulk are presented in Table 2.

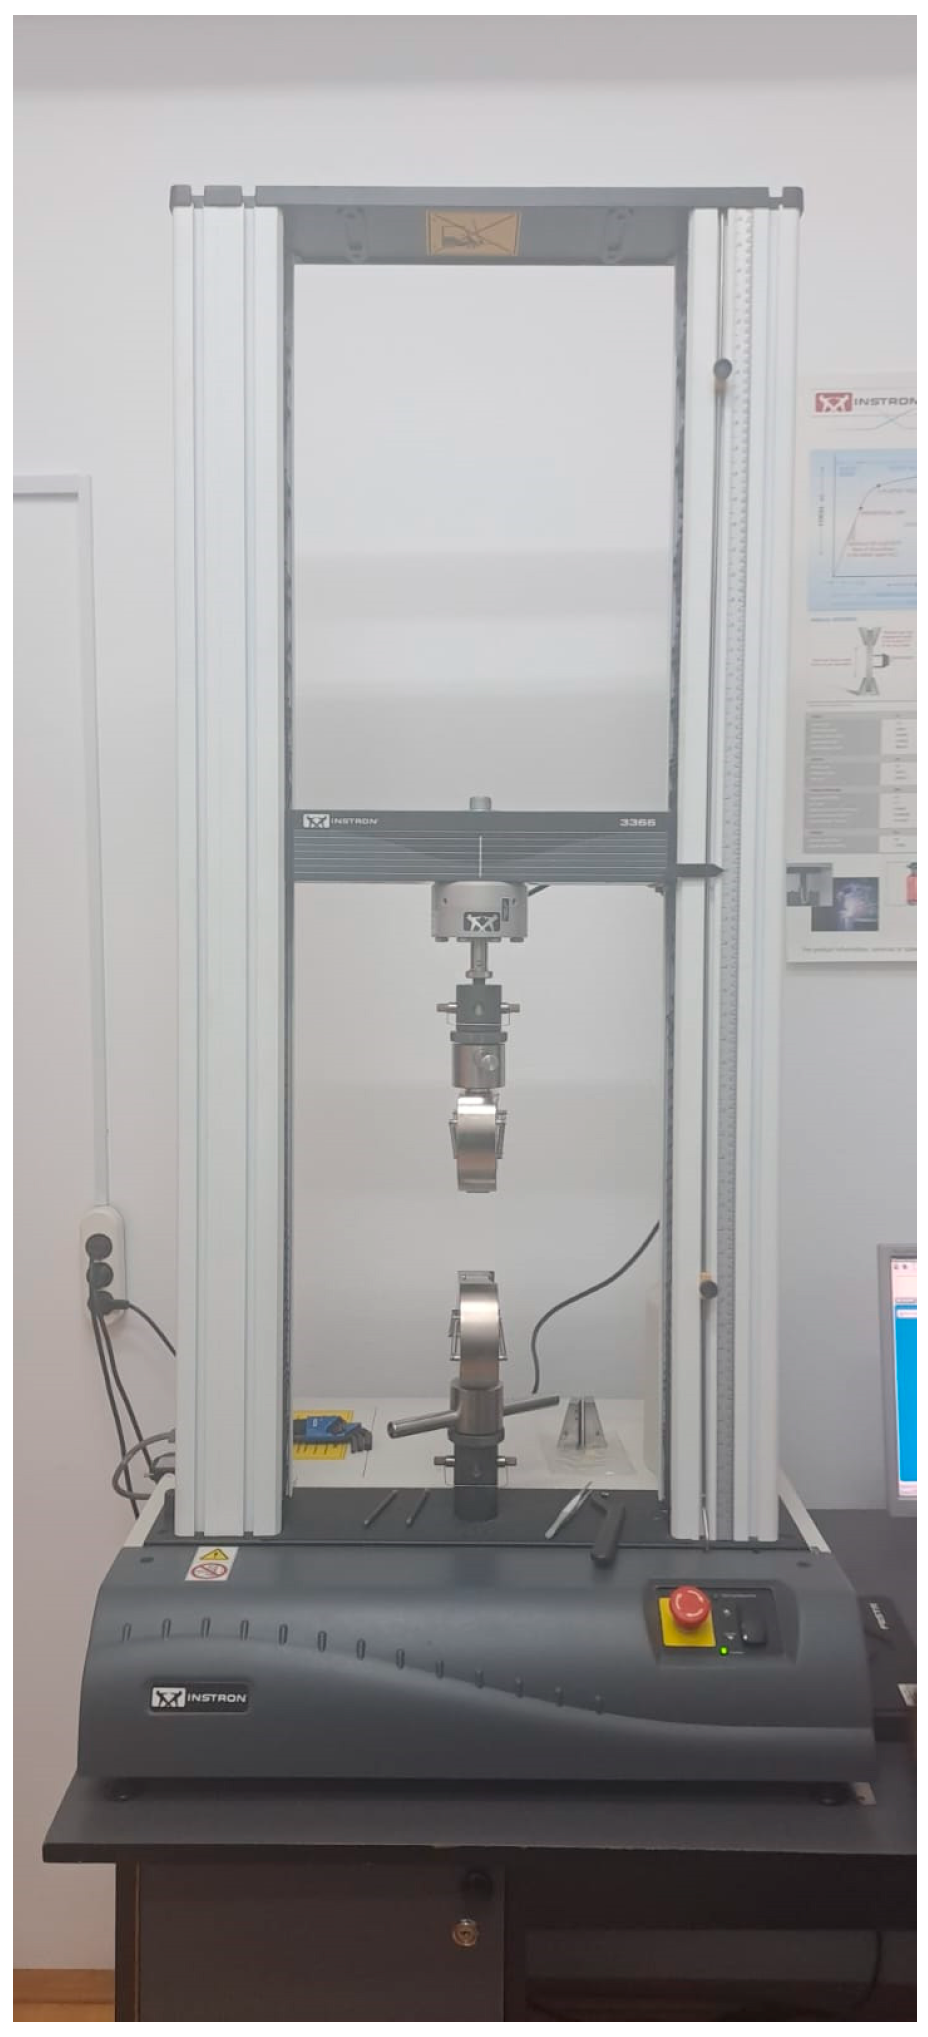
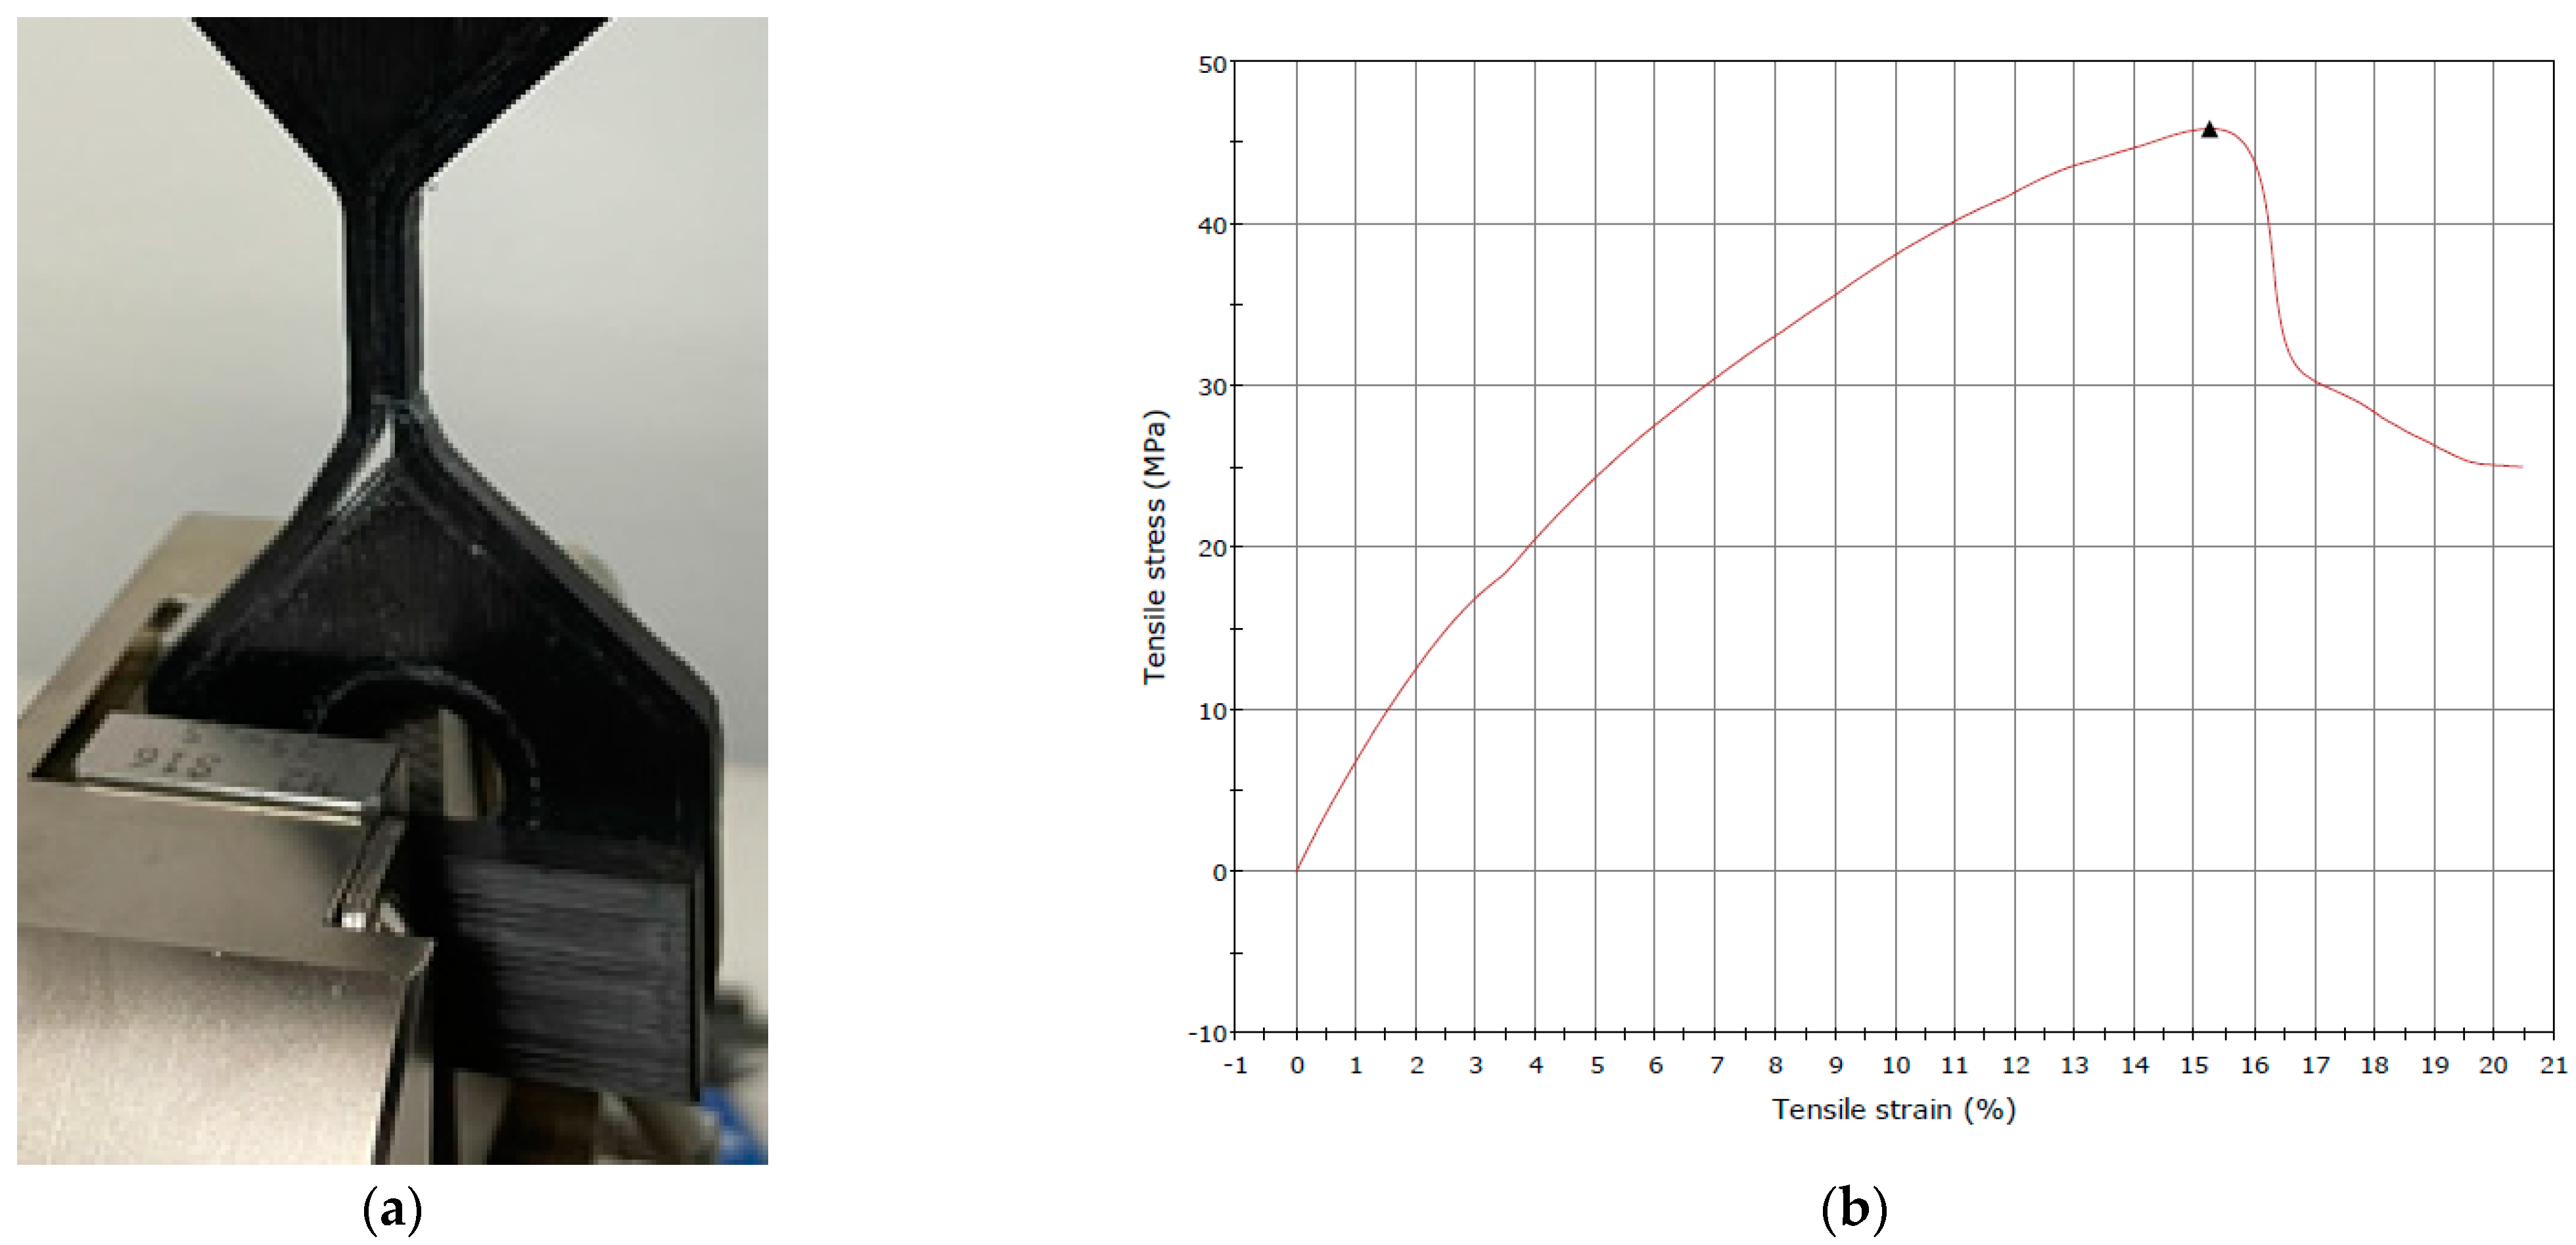
2.2. Tensile Testing

Tensile testing of the samples was performed on an Instron 3366 machine [19] seen in Figure 4. The test is performed on a measuring length of 50 mm at the speed of 6.6 m/s and provides both tensile strength measurements and strain measurements, which are needed for training the predictive model and creating the material profile for finite element analysis.
The test parts after tensile testing are presented in Figure 3b, where the failure mode can be observed.

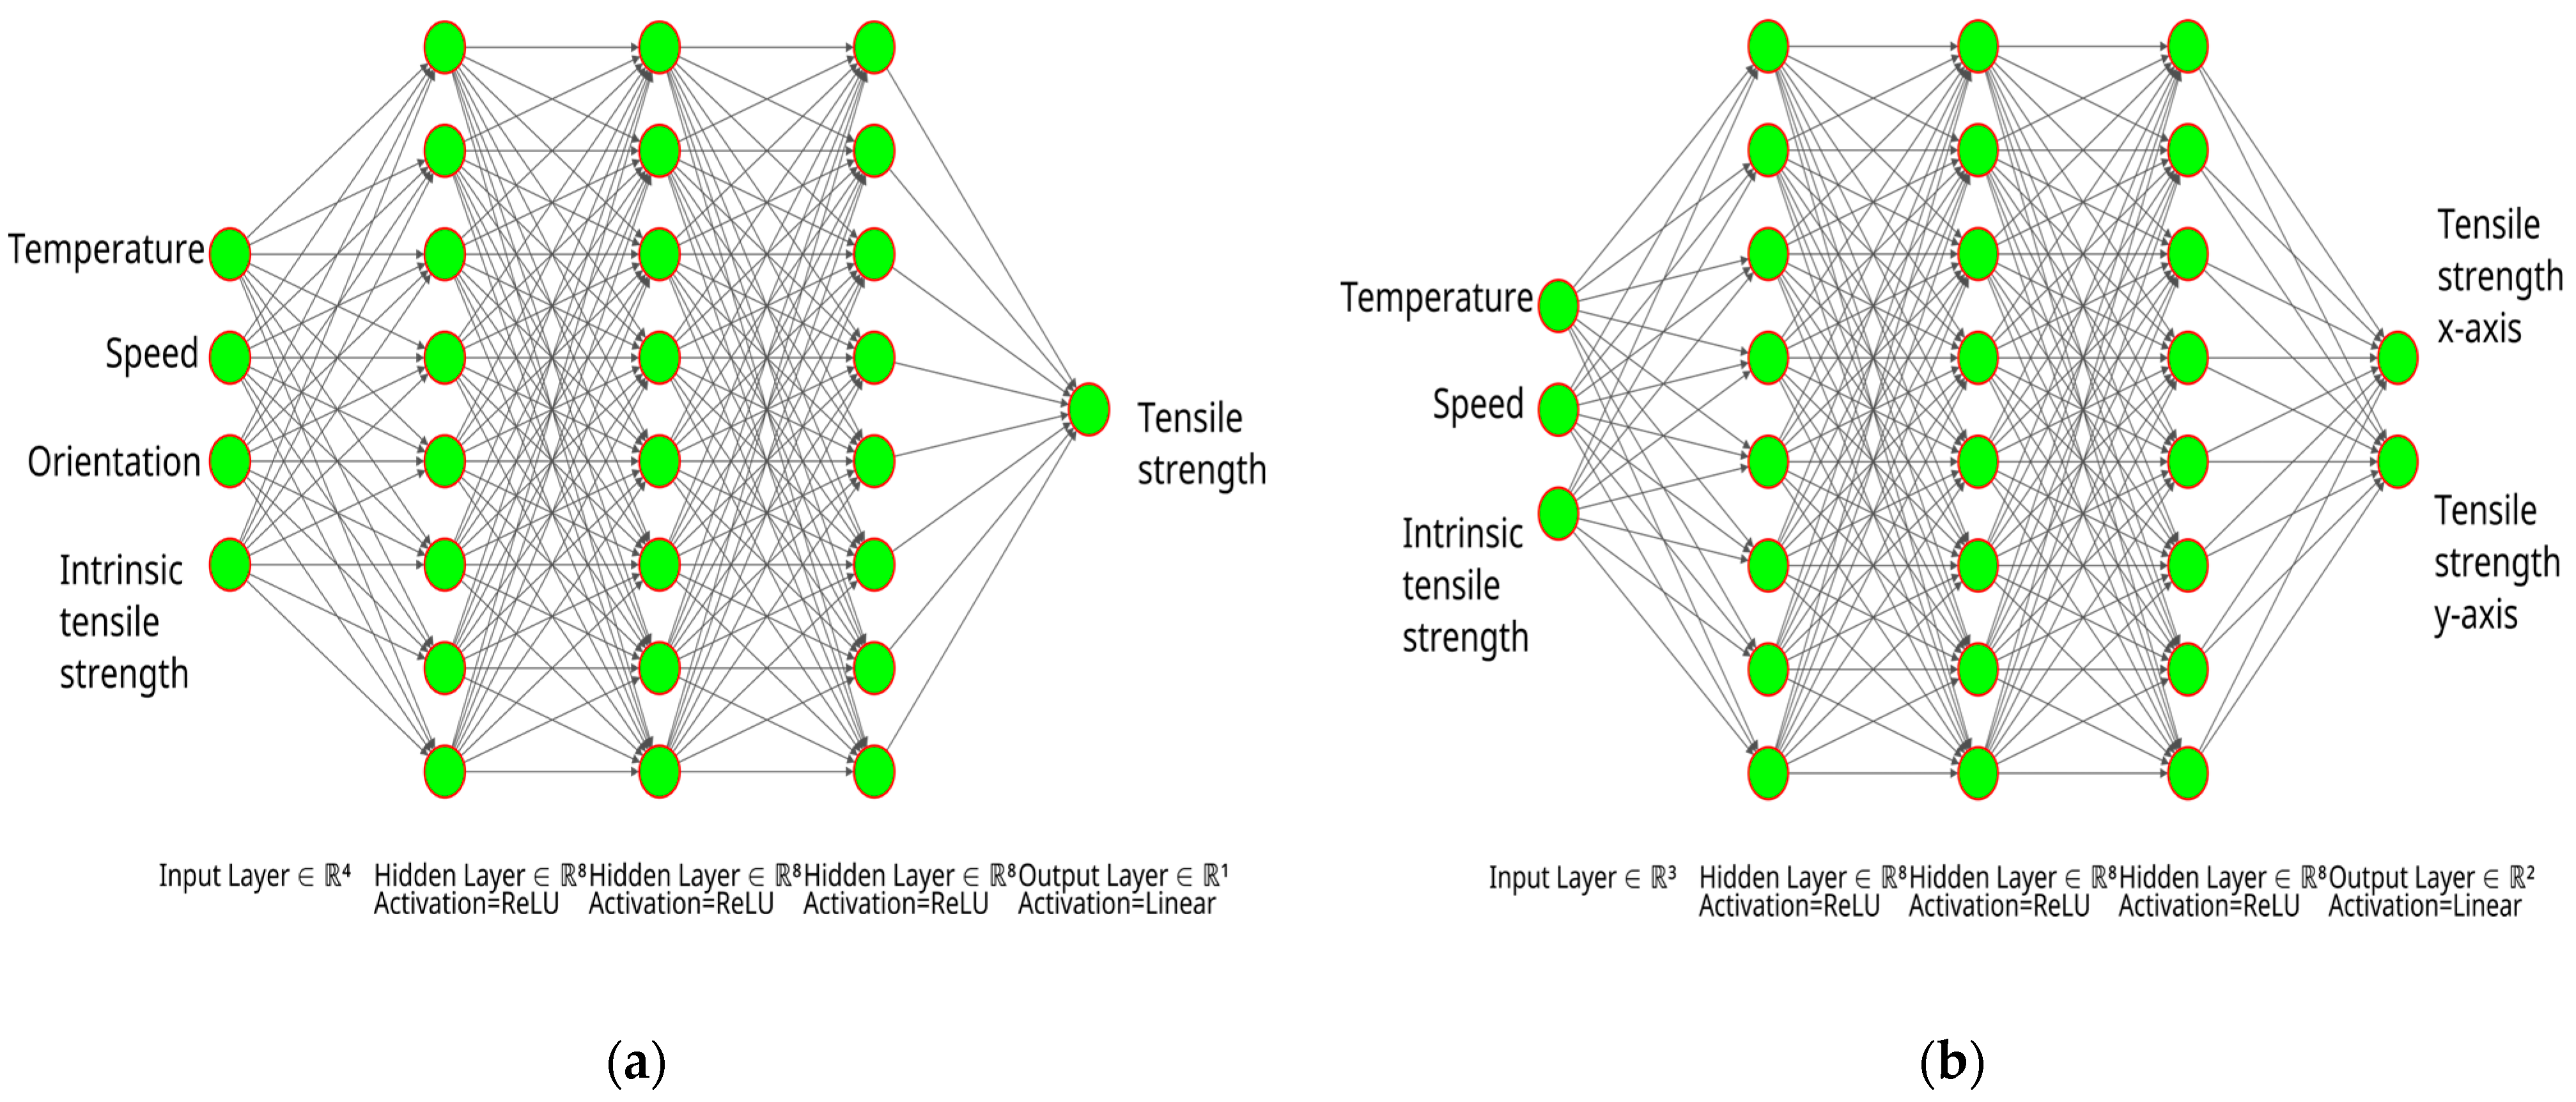
2.3. Neural Network Development and Training

The predictive model has at its core an artificial neural network which takes process parameters (speed, temperature, orientation) as inputs and empirical data in the form of tensile strength from tensile testing as outputs for the training process. The neural network architecture choice was informed by previous studies [2], where a number of neural network architectures were developed and tested for performance and compared to statistical techniques and models from other studies [1]. The presented neural network was tested against the best model from the study [2] as a reference point, and the parameters and architecture were adjusted to increase prediction accuracy.
The neural network was developed in the Python [20] programming language using the PyCharm community edition IDE [21]. In order to ensure cross-platform compatibility and to make use of efficient machine learning algorithms and functions, the Tensorflow [22] machine learning library was employed with the Keras [23] front-end.
Performance analysis and graphing for the neural network were performed using the Tensorboard [24] module from Tensorflow.
The architecture of the neural network employed in the study consisted of three fully connected hidden layers containing eight nodes each. For the inputs and outputs of the neural network, there were two possible configurations, one where the layer orientation parameter was used as a categorical input variable, and the output of the neural network consisted of one node for tensile strength values. The second configuration took as inputs the temperature, speed, and intrinsic tensile strength of the material, while the output consisted of two nodes, one for tensile strength in the horizontal orientation and the other in the vertical orientation, providing predictions for both orientations given a set of process parameters. Both architectures were tested; however, the first configuration was preferred since it allows training on uneven datasets where the number of data points for one orientation may differ from the other. A graphical representation of the neural network architecture for both configurations is presented in Figure 5.
The inputs for the neural network consisted of the main process parameters, printing speed, nozzle temperature, and the intrinsic tensile strength of the bulk material. The intrinsic tensile strength of the bulk material is relevant only if the neural network is trained on data obtained from test samples fabricated from a variety of materials, which is the subject of a future study. The bulk material tensile strength can be obtained by subjecting a section of filament to tensile strength measurements. In the case of this study, all test samples were manufactured from the same roll of filament; therefore, the bulk material tensile strength was the same for all components, in which case, the neural network will ignore it or normalize it to 1 during training.
The outputs of the neural network use empirical tensile test data during training and provide predicted tensile strength values in MPa during inference.
The optimizer [25] used in the neural network was Adamax [26] and the loss function was MeanAbsolutePergentageError. The neural network weights and biases were initialized as zeroes. The activation function [27] for the hidden layer was ReLU (rectified linear unit), and for the output layer, a linear activation function was implemented. The activation function was chosen based on performance evaluation and the input/output data ranges. Performance evaluations of neural networks developed for this study and previous work [2] show better generalization and convergence as well as increased accuracy when using the ReLU activation function for hidden layers and a linear function for the output layers. This may be due to the range of the input and output variables not being constrained between a min and max value.
The tensile test data were split into 80% for training and 20% for validation. The percentages of data used for training and validation were chosen to optimize the training on a sparse dataset with a limited number of input and output values; reducing the percentage of available training data could lead to overfitting of the model during sparse-data scenarios. The validation data are never seen by the neural network during training, which ensures that the model can predict real-world values, giving an unbiased evaluation of the neural network performance. The neural network was trained until the mean absolute percentage error for the validation predictions reached the lowest point (highest accuracy) and the model with the best accuracy was saved.

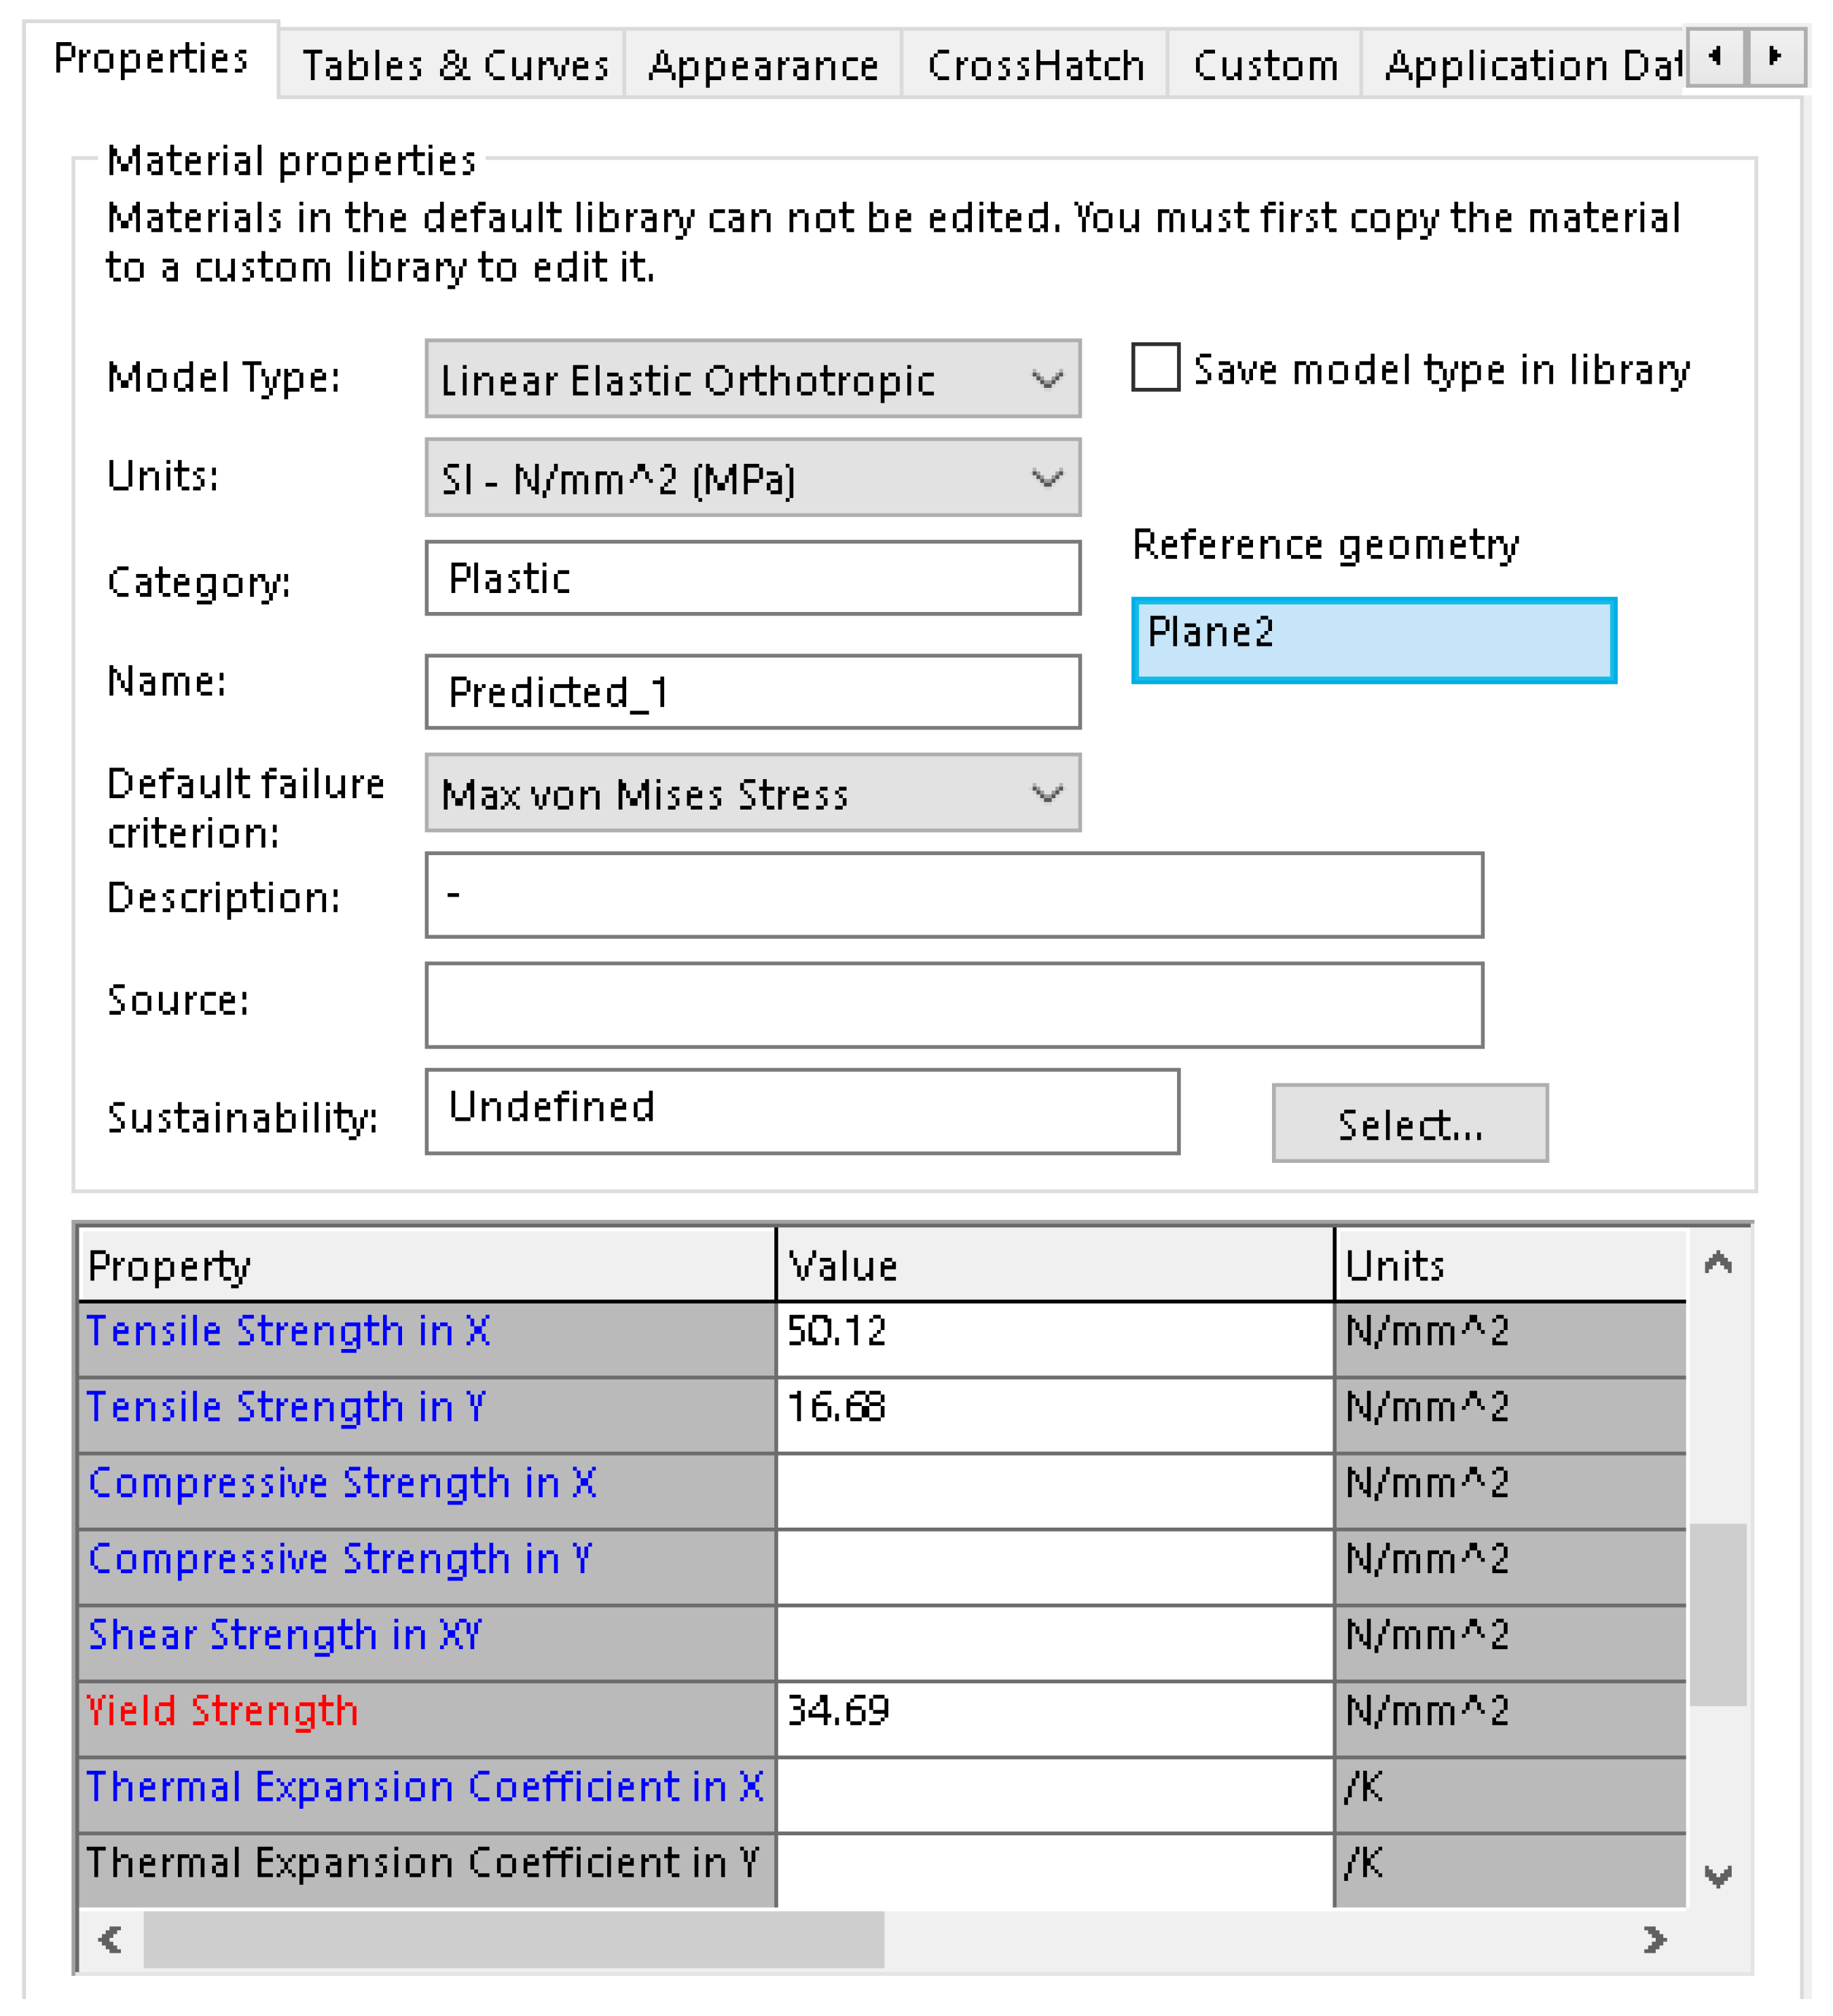
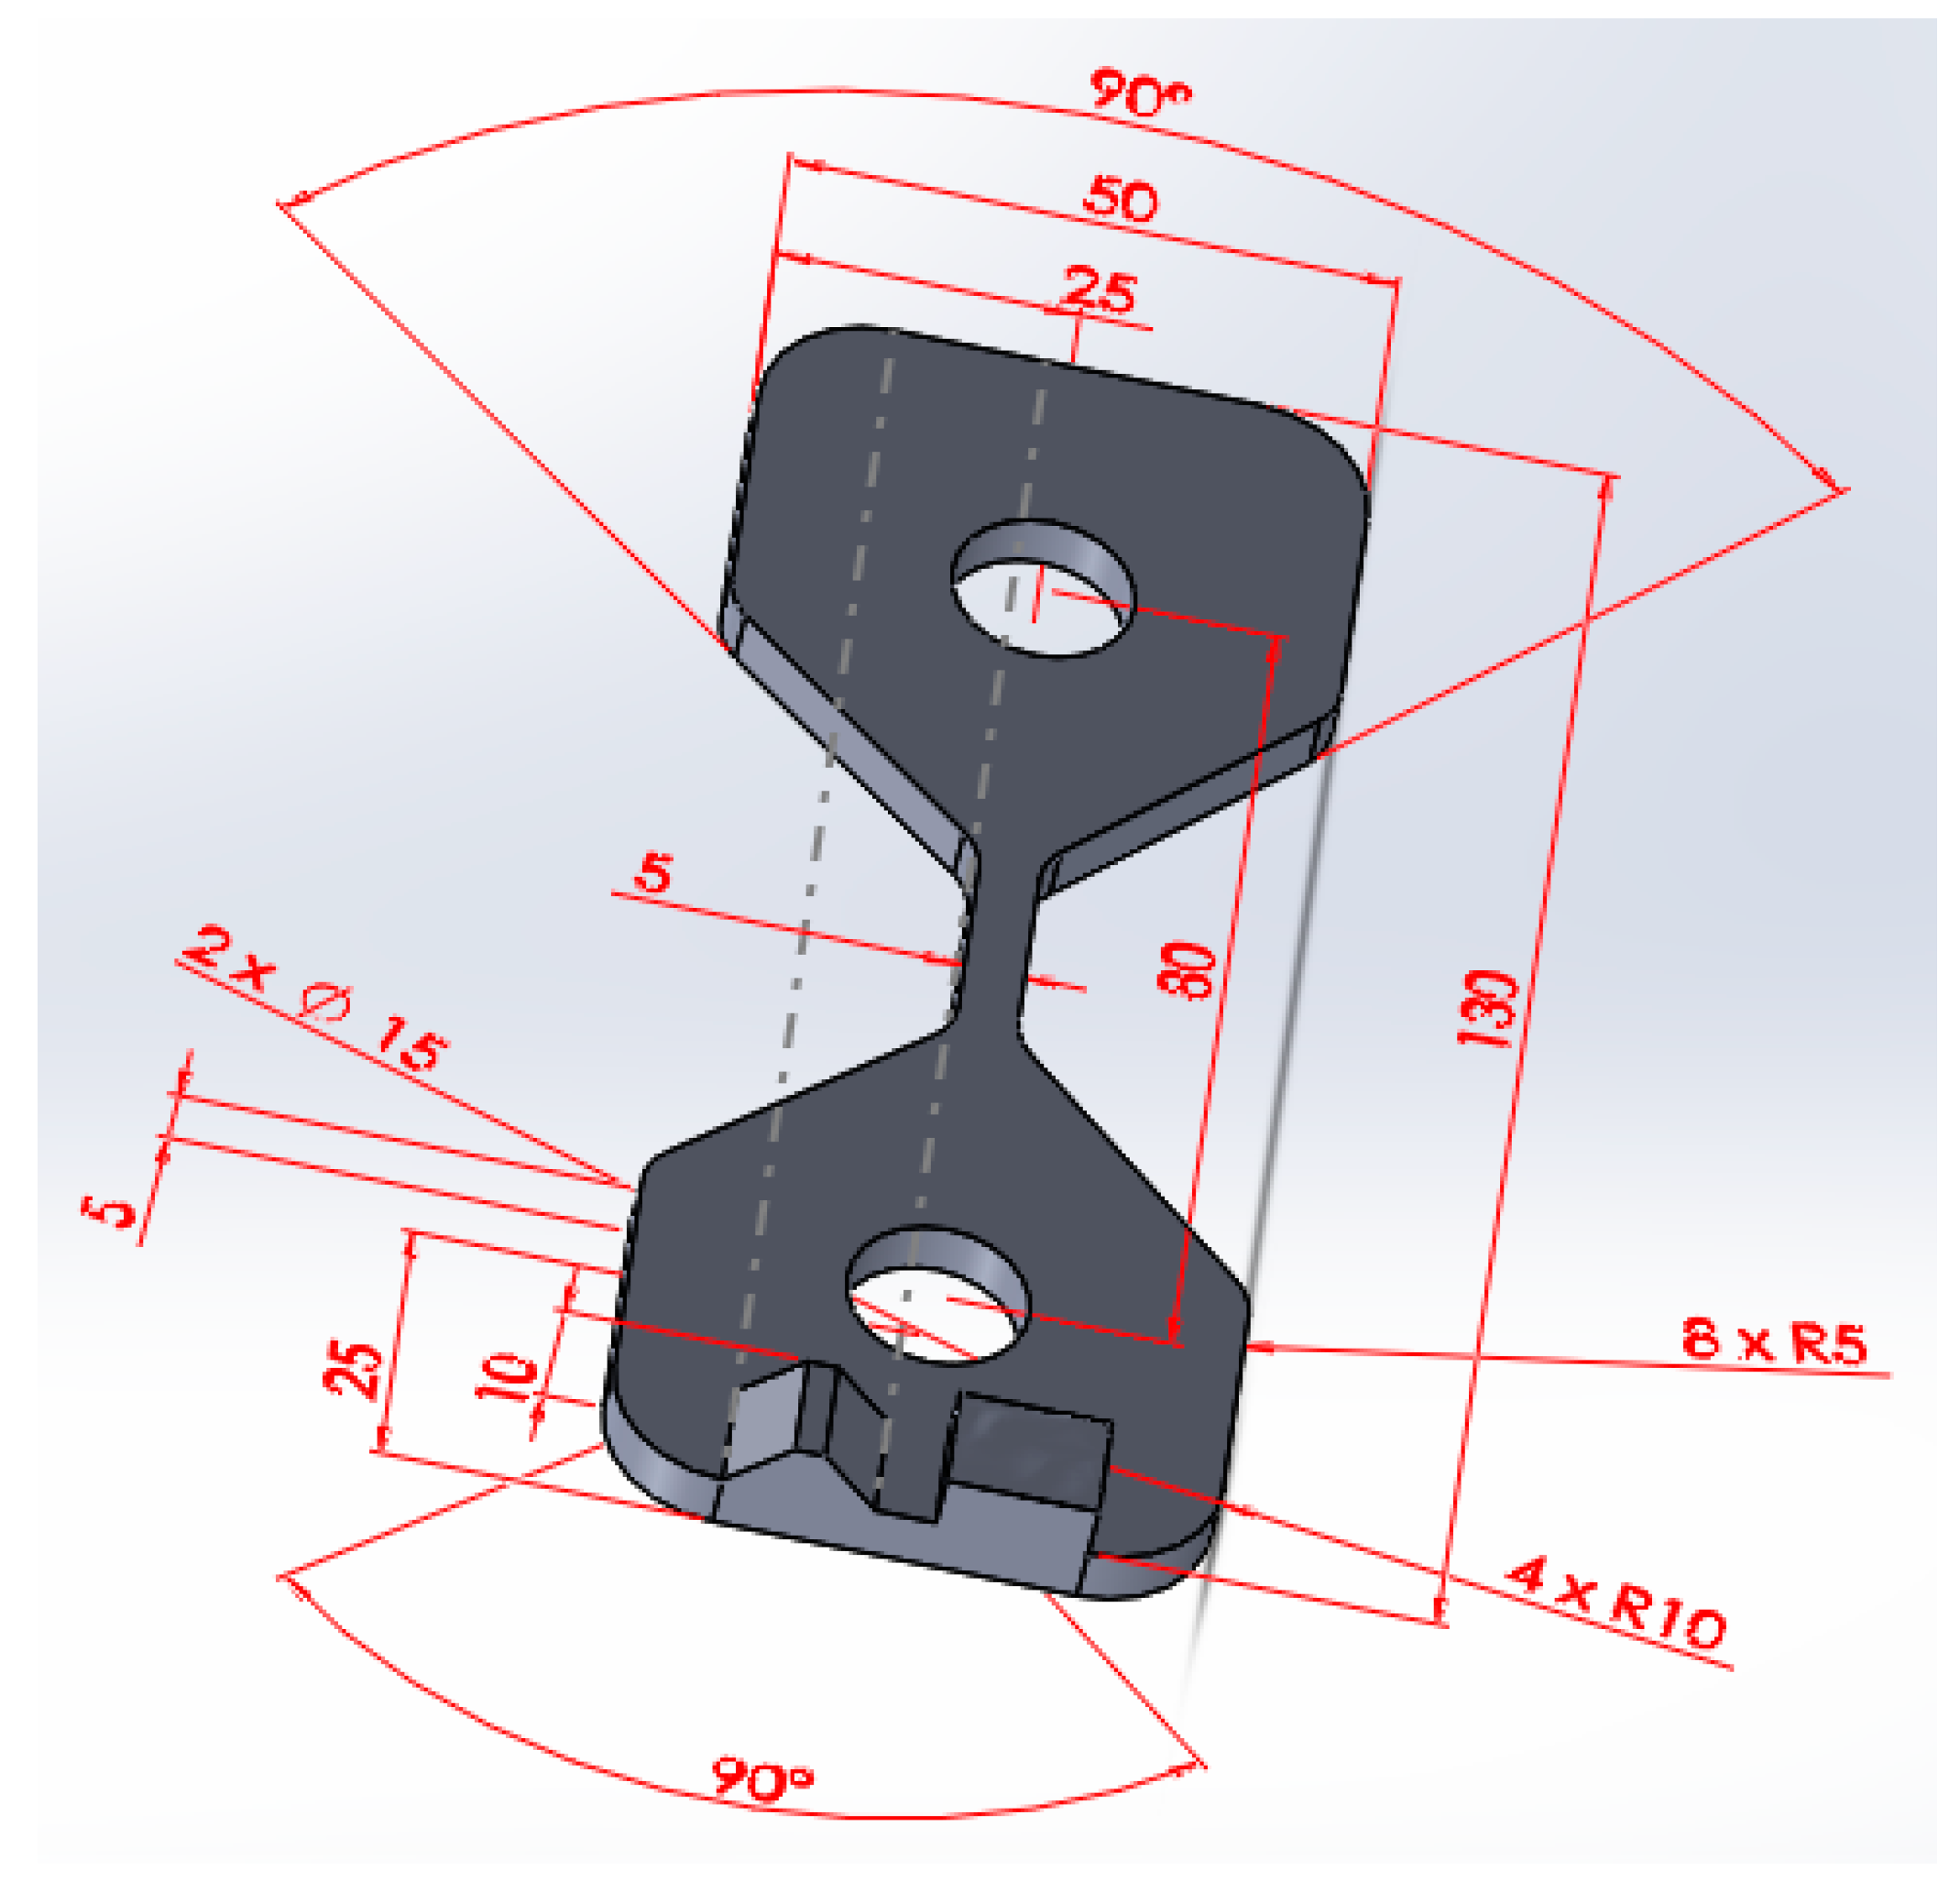
2.4. Finite Element Analysis Using Predicted Mechanical Properties

The tensile strength predictions obtained from the neural network can be used together with empirical data from tensile testing to define a custom orthotropic material profile. By applying the custom material profile to the CAD model of a functional component, finite element analysis can be employed to determine the behaviour of the part during the design stage. Finite element analysis was performed using the simulation module available in the Solidworks software suite [28]. The material profile definition using values predicted by the artificial neural network is presented in Figure 6.

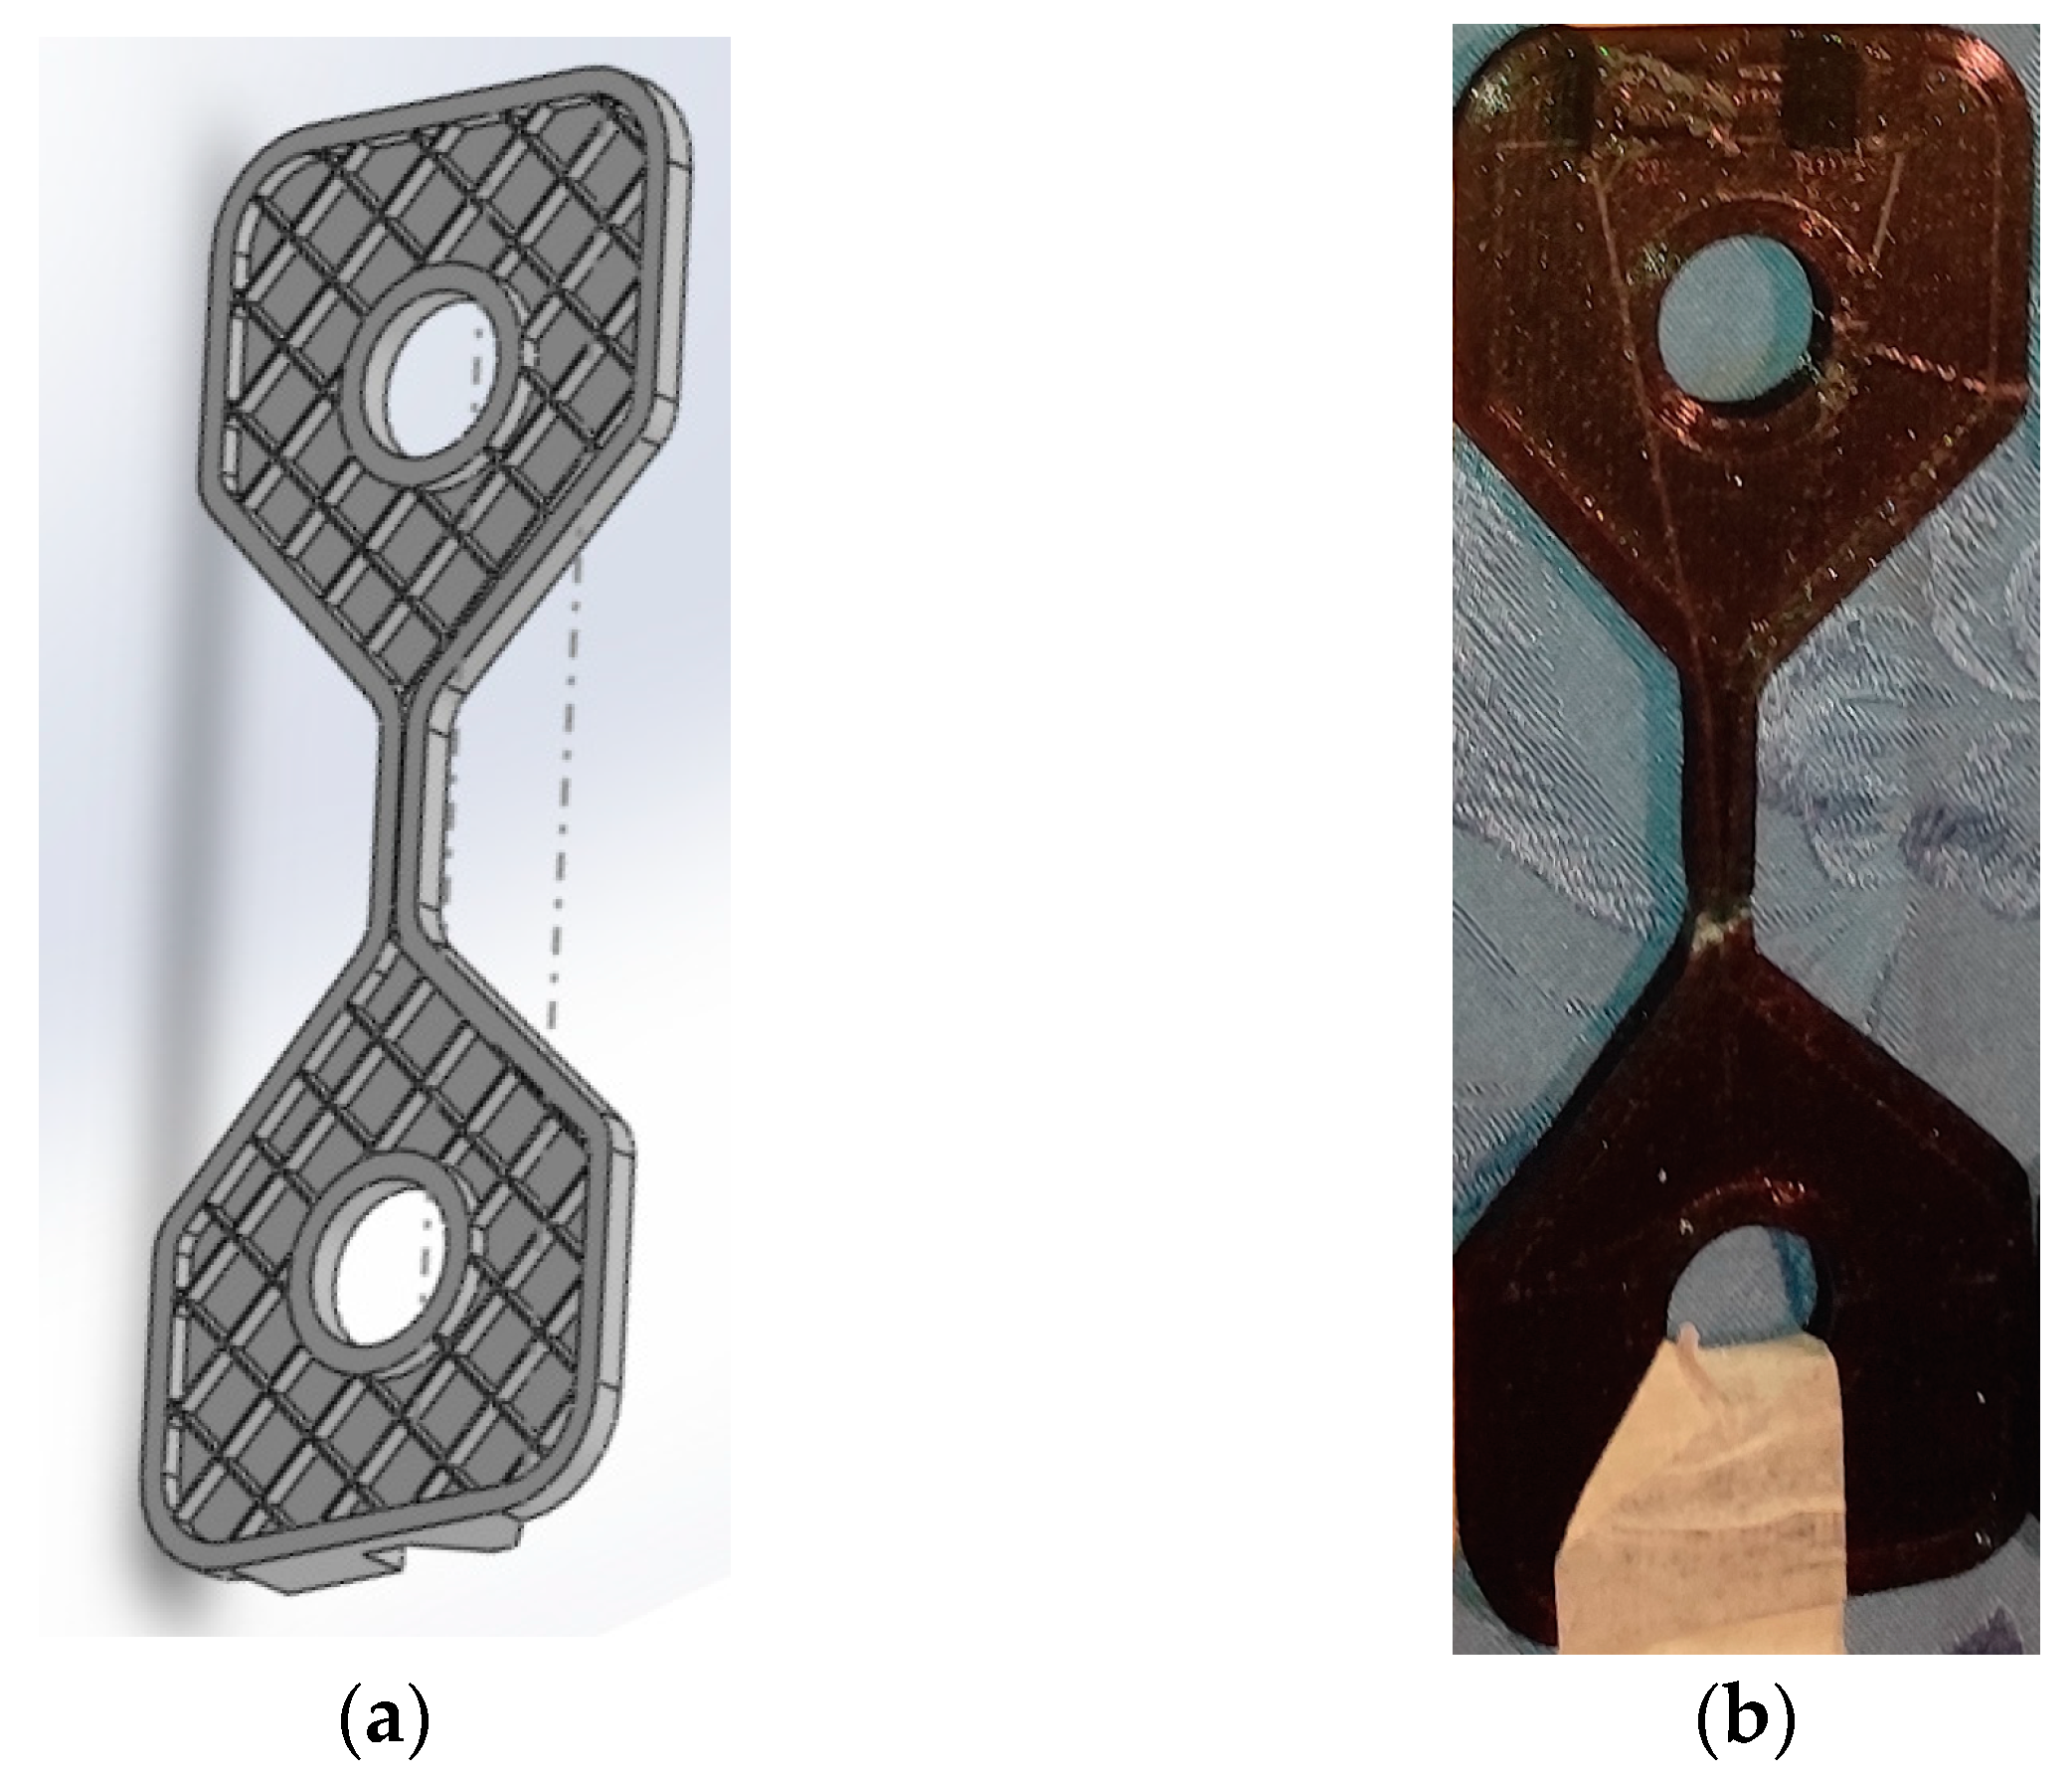
2.5. Corroborating Predicted Results with Real-World Data

Finite element analysis was performed on the CAD model of a part which was fabricated using the FDM method and subjected to tensile testing. A blended-curvature type mesh was applied to the part with a maximum element size of 3 mm and minimum element size of 0.15 mm, containing 12,443 elements and 22,236 nodes. The external load was 1000 N applied on the internal surface of the 15 mm diameter holes, in opposite directions, simulating a tensile strength test. The average simulation time was ~30 s. The predicted behaviour and tensile strength were compared to the observed real-world test.
The CAD model of the part used for testing is shown in Figure 7. The geometry is the same as for the components used for previous studies, allowing the use of previous data to further evaluate the predictive model.
Because the failure mode of 3D printing components is dependent on factors such as infill pattern and density, wall line count, and top/bottom thickness, the CAD model used for finite element analysis was designed to include these features, as can be observed in the section presented in Figure 8a.
The material for the test part was chosen to have the same mechanical characteristics as the material for the test samples, with a tensile strength of ~60 Mpa (average over 10 measurements). The process parameters used for fabricating the test part were 195 °C nozzle temperature, 45 mm/s printing speed, and horizontal orientation. An image of the manufactured test part is presented in Figure 8b.

3. Results

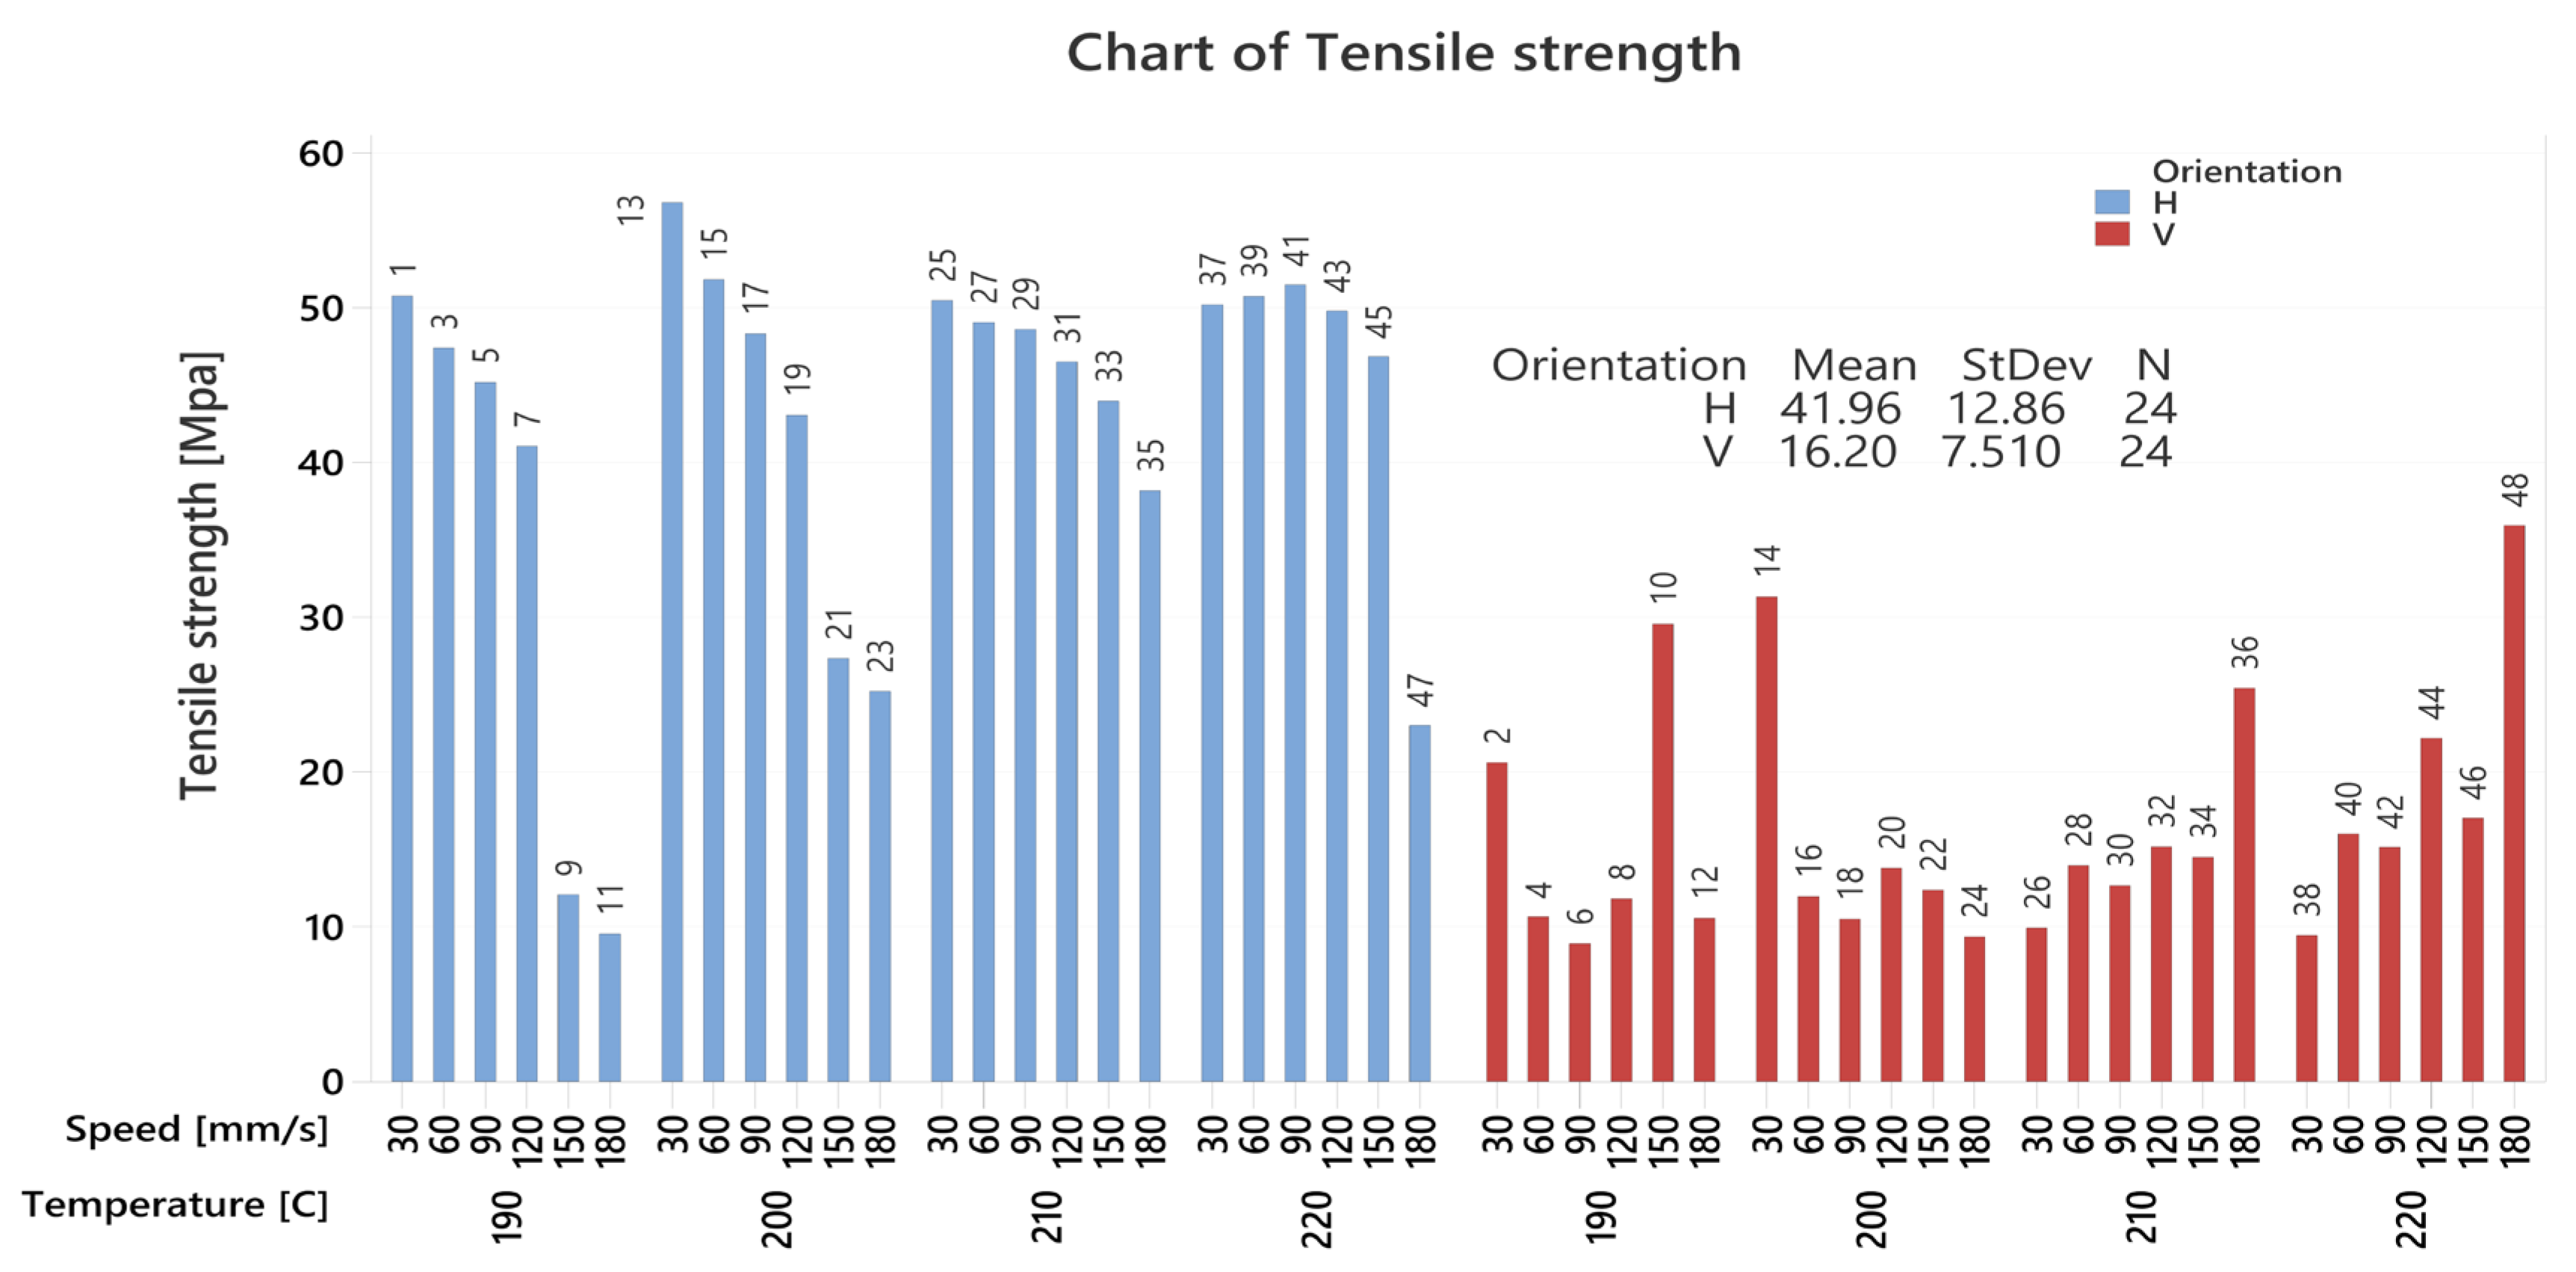
3.1. Tensile Test Results

The tensile test results for the test samples are displayed in Figure 9. The graph indicates that the tensile strength is much lower in the direction perpendicular to the layer orientation, due to it being determined by the bonding strength between the layers, which is in turn affected by the temperature of the deposited material and the printing speed.

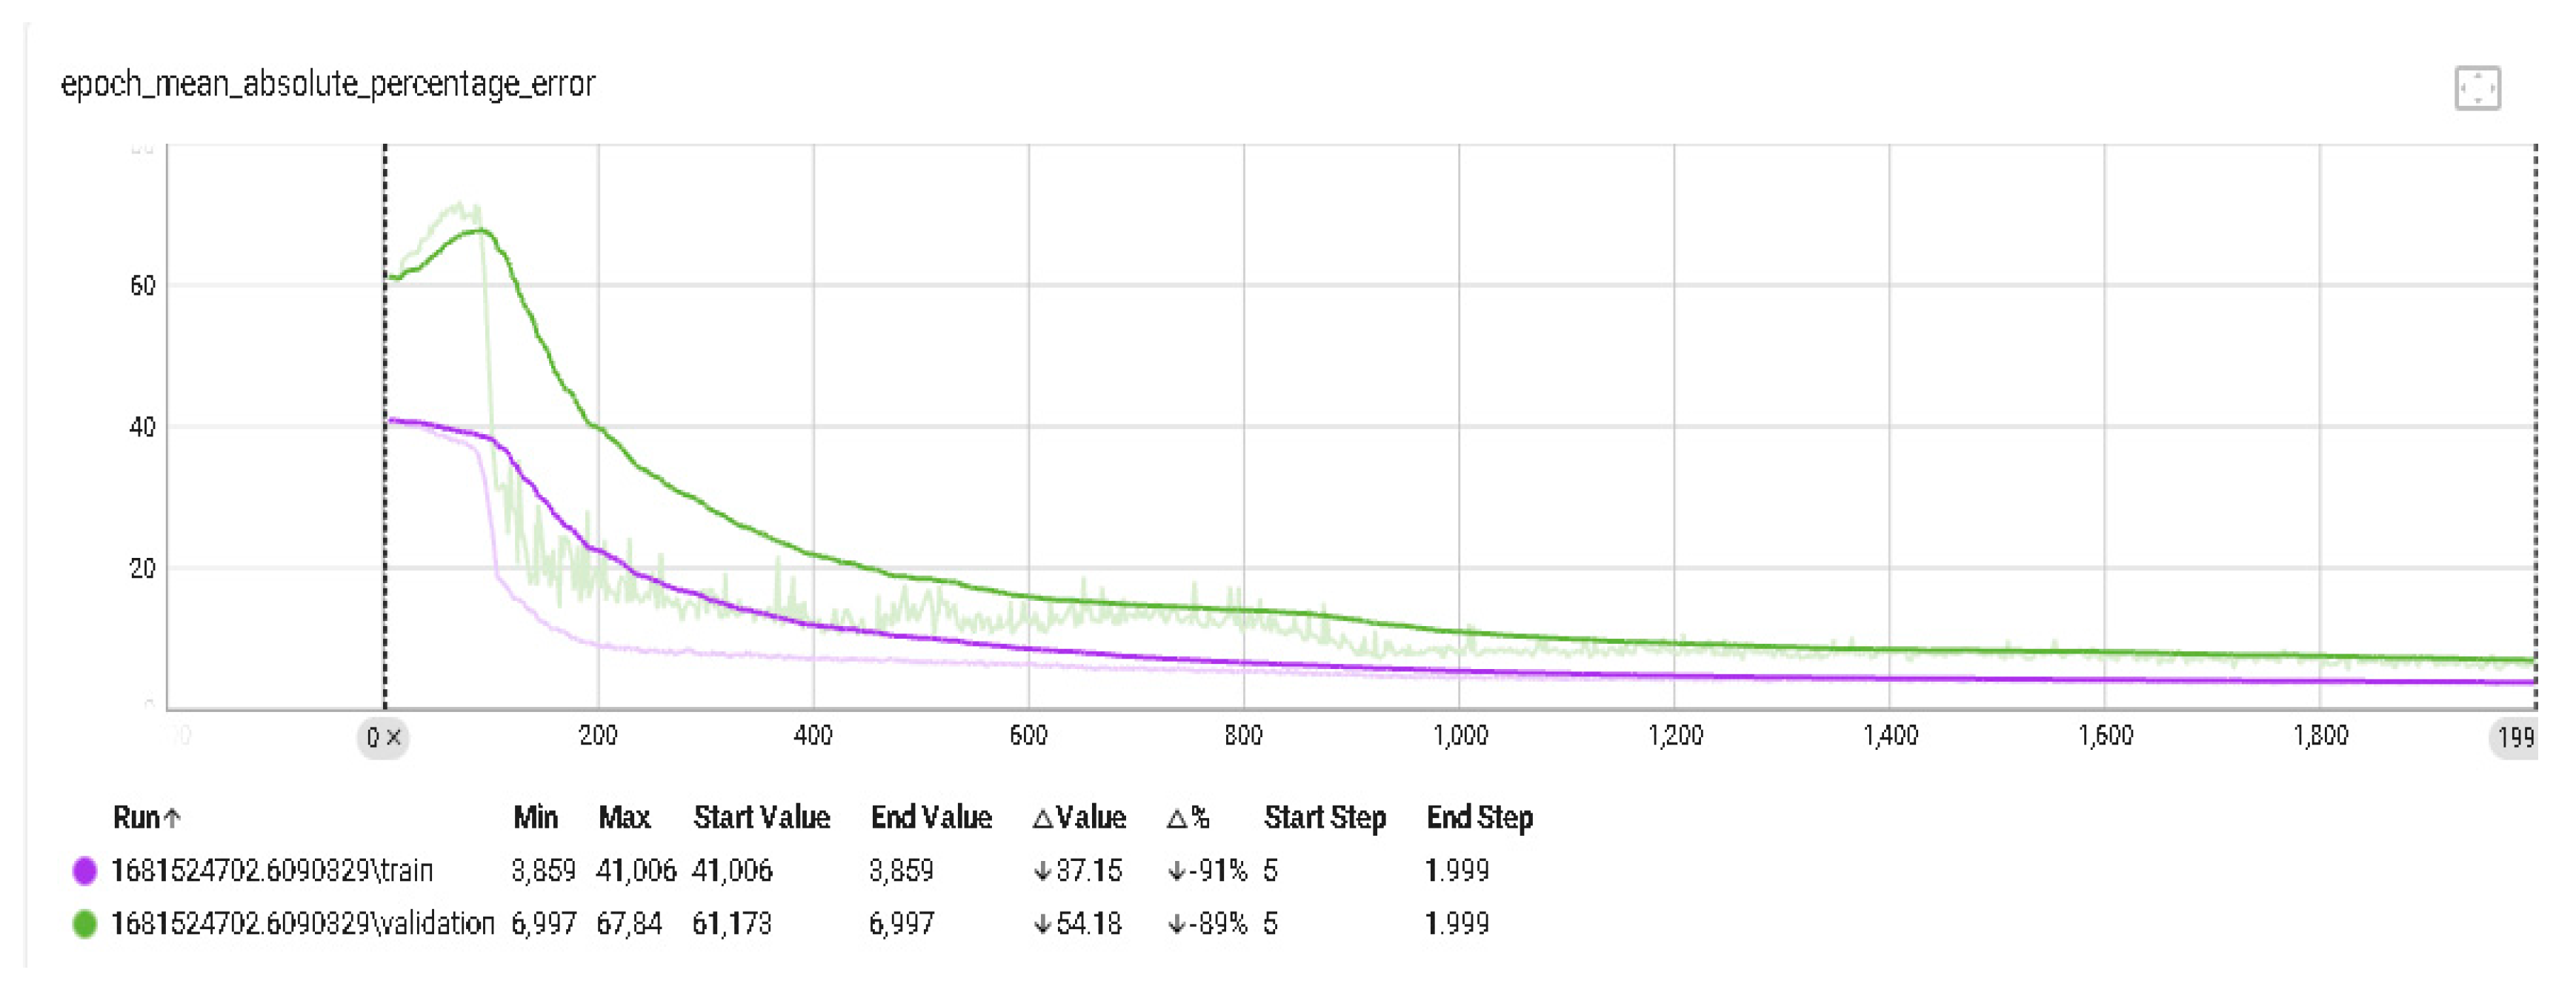
3.2. Neural Network Training and Prediction Results

The tensile test results were used as empirical data to train the neural network which will provide predictions for future parameter combinations. Figure 10 shows a performance plot for the trained neural network in the form of training data versus validation data prediction mean absolute percentage error. The results show a prediction accuracy of ~93%, indicating a strong correlation between process parameters and tensile strength and the ability of the neural network to approximate the complex function needed to predict tensile strength values for a given set of parameters.
The predicted tensile strength value for the set of parameters used to manufacture the test part (temperature 195 °C, speed 45 mm/s horizontal orientation) was 50.12 MPa.

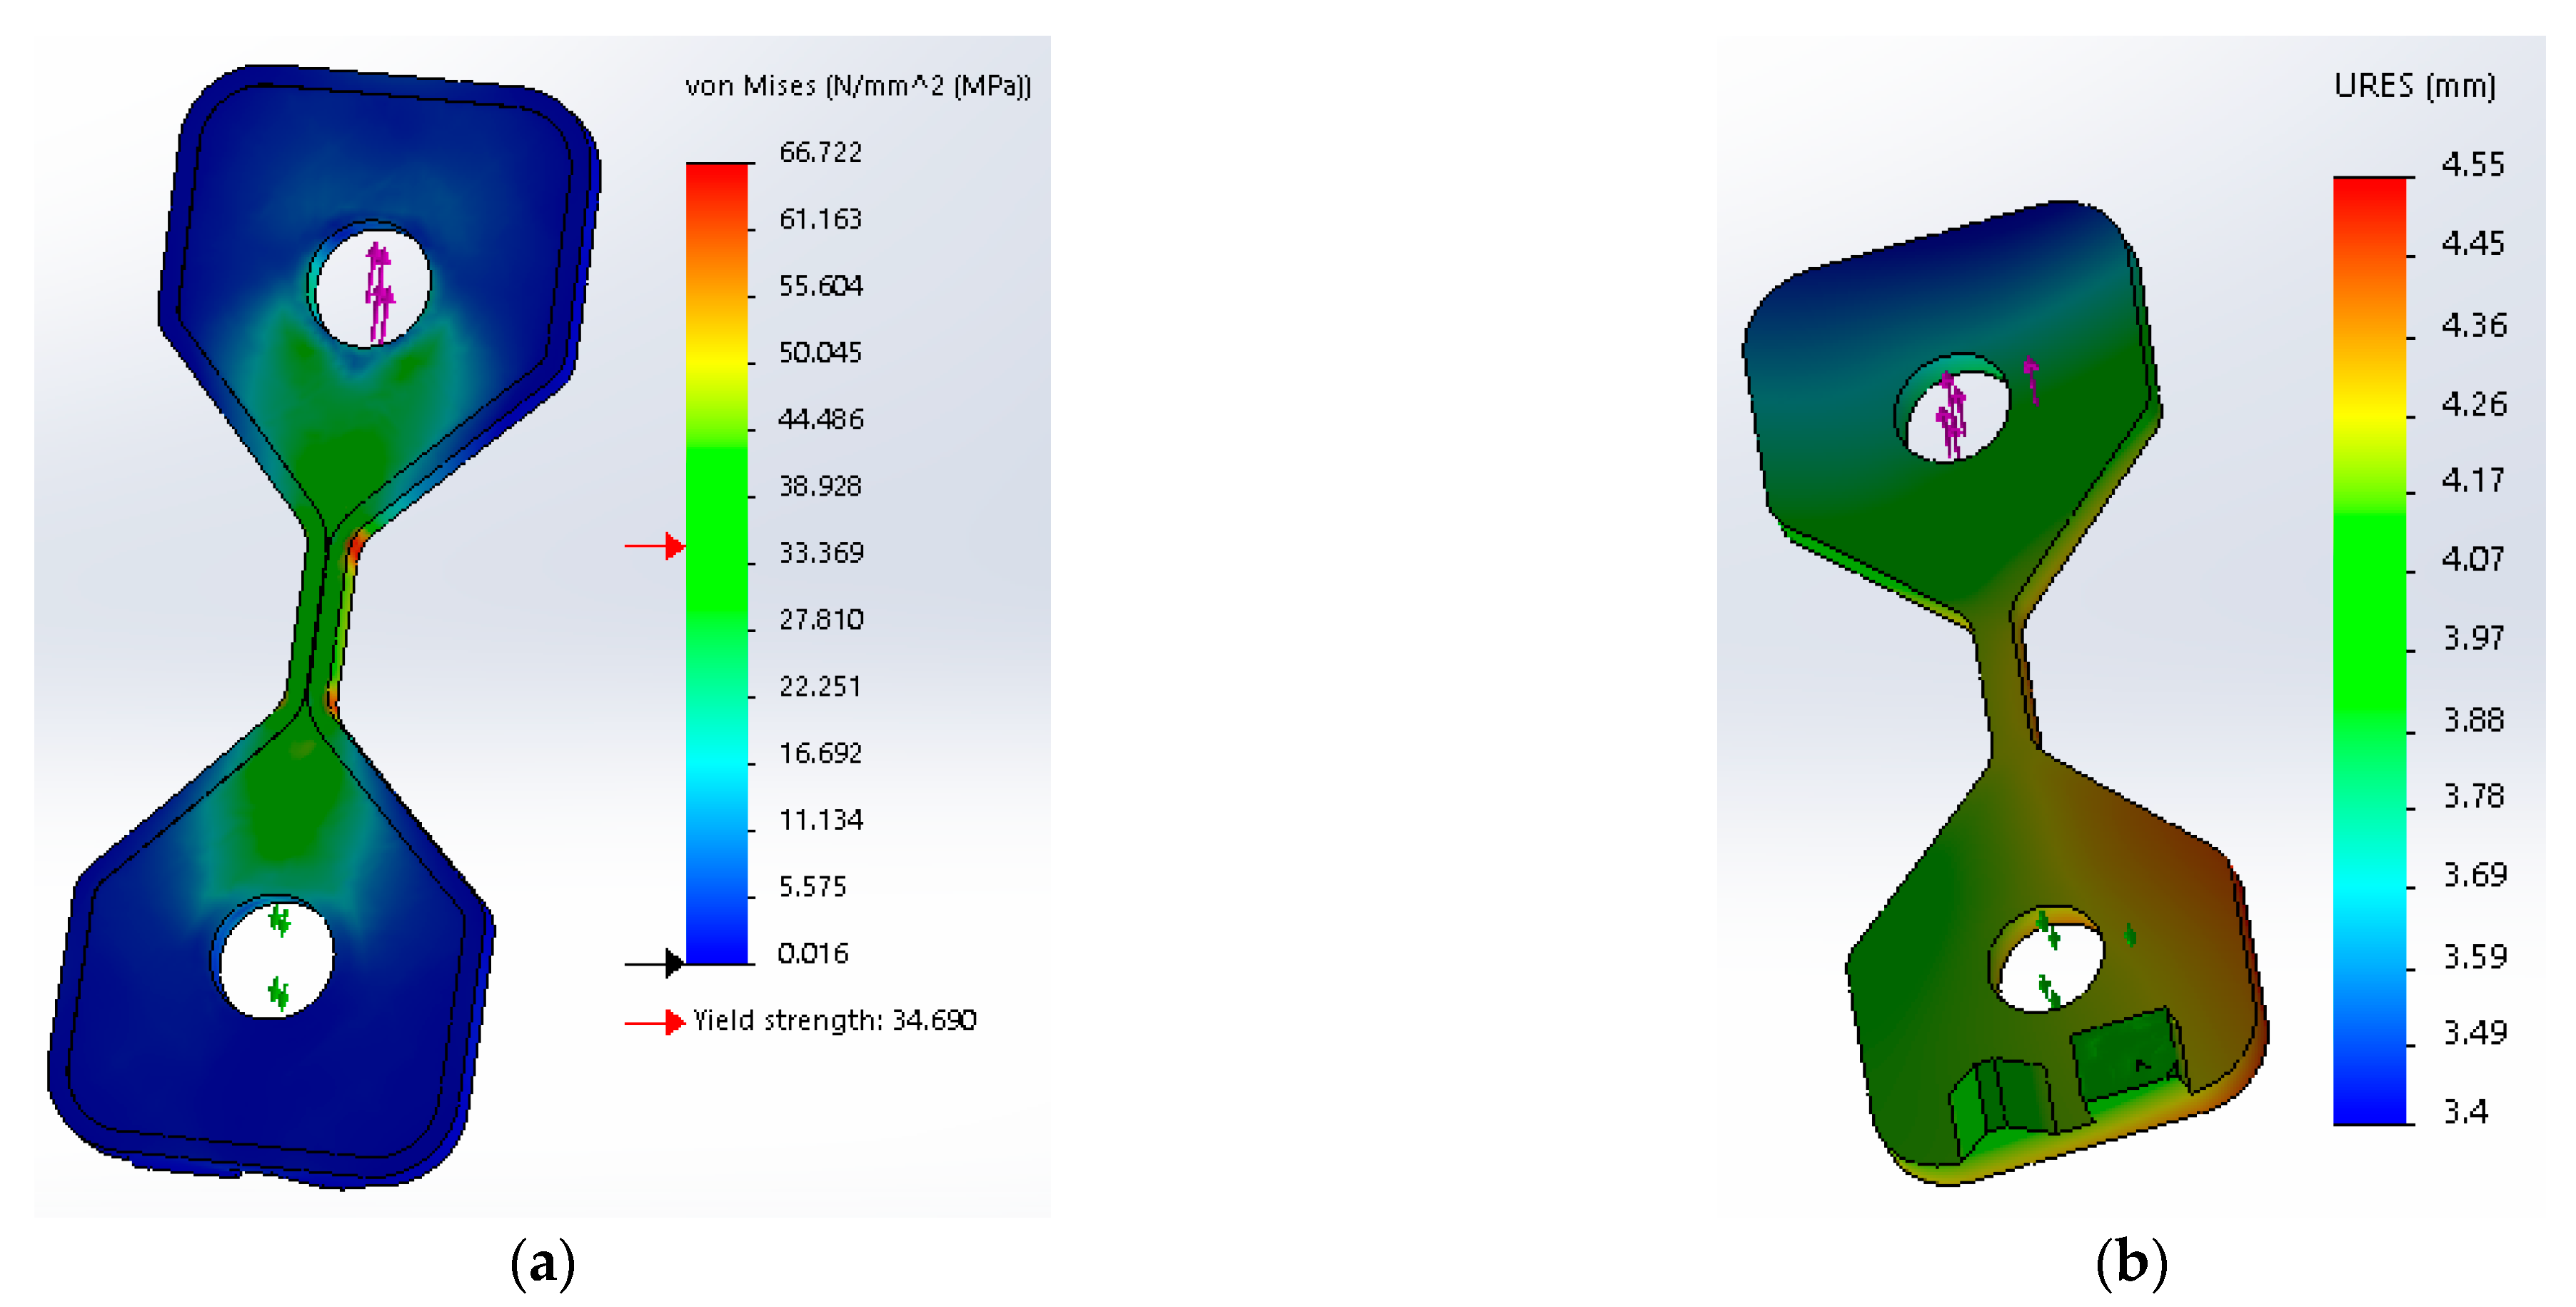
3.3. Finite Element Analysis Results

The predicted values obtained from the neural network were used to create a custom material with orthotropic properties for finite element analysis. A test part was manufactured with the same process parameters used for making the prediction and was subjected to tensile testing. The results of the finite element analysis are shown in Figure 11.
For comparison, the results of the tensile test for the manufactured test part are shown in Figure 12, where (a) is an image of the part after breaking and (b) is the stress–strain plot generated while the part was under test.
The test part failure mode shows that the contour walls broke away from the top and bottom layers, indicating low bonding strength between them and a weak point for the mechanical behaviour of the part. The same areas were identified by finite element analysis as weak points with a high probability of failure under load. The results indicate that the model can predict the behaviour of FDM-manufactured components for both tensile strength and failure mode.

4. Discussion

The findings agree with results from other studies in the literature, with studies performed by Khosravani et al. [9], Alhazmi et al. [11], and others showing the same strong relationship between part build orientation and mechanical characteristics. Studies by Ding et al. also showed a strong correlation between orientation and mechanical characteristics, and at the same time, an influence of nozzle temperature was observed. Many of the studies in the literature used statistical methods for characterizing the influence of parameters and predicting mechanical behaviour; however, the results of this study and research performed by Yadev et al. [5] show that artificial neural networks, due to their ability to approximate complex functions, can provide higher accuracy predictions.
The results show that the simulated and actual behaviours are similar to within an acceptable margin of error for the test part and the process parameters analysed. This indicates that artificial neural network-based predictive models can be used to augment finite element analysis by predicting the mechanical characteristics of materials in the context of FDM manufacturing.
A degree of error in the predicted and simulated data is present and to be expected; however, the accuracy of the predictions and the results are sufficient to prove the concept. The source of the errors is the limited number of data points available and the noise which is to be expected in a limited dataset. Another source of errors can be factors that influence the mechanical behaviour of FDM-fabricated parts but were not included as parameters for training the neural network. The inclusion of these factors (layer cooling, ambient temperature, print bed temperature, etc.) may be the subject of a future study.
This study builds on and validates the results of previous studies carried out in the field, with each study adding to the number of measurement data points leading to an increase in the precision and complexity of predictive models, encouraging future research in the field.
Future research is proposed to include more materials and process parameter combinations as well as a more extensive dataset which helps in reducing the number of outliers in the analysed data by averaging out the noise and increasing the precision and the versatility of predictive models. The results are promising enough to warrant future research on implementing neural-network-based models for predicting the mechanical behaviour of materials in the context of other manufacturing technologies such as SLS, SLM, and SLA.

5. Conclusions

This study shows that using artificial neural networks to predict orthotropic, FDM, 3D-printed material mechanical characteristics can aid finite element analysis in simulating the mechanical behaviour of 3D-printed components.
This kind of predictive model is useful for reducing the costs of additive manufacturing by predicting the mechanical behaviour of 3D-printed components during the design phase and informing decisions on either redesigning the part or choosing different process parameters.
Future research on more extensive datasets can increase the accuracy, complexity, and versatility of the predictions.

Author Contributions

Conceptualization, S.D.G., A.D.S. and V.C.; methodology, S.D.G., A.D.S. and V.C.; software, A.D.S.; validation, S.D.G. and V.C.; formal analysis, S.D.G., A.D.S. and V.C.; investigation, S.D.G., A.D.S. and V.C.; resources, S.D.G. and V.C.; data curation, A.D.S.; writing—original draft preparation, A.D.S.; writing—review and editing, M.K. and M.P.; visualization, A.D.S.; supervision, S.D.G.; project administration, V.C.; funding acquisition, S.D.G. All authors have read and agreed to the published version of the manuscript.

Funding

This research was funded by the Technical University Of Cluj-Napoca, and the APC was funded by the Technical University Of Cluj-Napoca.

Acknowledgments

This paper has been elaborated in the framework of the project VEGA 1/0121/23.

Conflicts of Interest

The authors declare no conflict of interest.

References

  1. Sterca, A.D.; Calin, R.A.; Cristian, L.; Walcher, E.M.; Bodur, O.; Ceclan, V.; Grozav, S.D.; Durakbasa, N.M. Evaluation of Fused Deposition Modeling Process Parameters Influence on 3D Printed Components by High Precision Metrology. In Digitizing Production Systems; Lecture Notes in Mechanical Engineering; Durakbasa, N.M., Gençyılmaz, M.G., Eds.; Springer: Cham, Switzerland, 2022. [Google Scholar]
  2. Grozav, S.D.; Sterca, A.D.; Kočiško, M.; Pollák, M.; Ceclan, V. Feasibility of Predictive Models for the Quality of Additive Manufactured Components Based on Artificial Neural Networks. Machines 2022, 10, 128. [Google Scholar] [CrossRef]
  3. Travieso-Rodriguez, J.A.; Jerez-Mesa, R.; Llumà, J.; Traver-Ramos, O.; Gomez-Gras, G.; Roa Rovira, J.J. Mechanical Properties of 3D-Printing Polylactic Acid Parts subjected to Bending Stress and Fatigue Testing. Materials 2019, 12, 3859. [Google Scholar] [CrossRef] [PubMed]
  4. Tura, A.D.; Lemu, H.G.; Mamo, H.B. Experimental Investigation and Prediction of Mechanical Properties in a Fused Deposition Modeling Process. Crystals 2022, 12, 844. [Google Scholar] [CrossRef]
  5. Yadav, D.; Chhabra, D.; Garg, R.K.; Ahlawat, A.; Phogat, A. Optimization of FDM 3D printing process parameters for multi-material using artificial neural network. Mater. Today Proc. 2020, 21, 1583–1591. [Google Scholar] [CrossRef]
  6. Saleh, M.; Anwar, S.; Al-Ahmari, A.M.; AlFaify, A.Y. Prediction of Mechanical Properties for Carbon fiber/PLA Composite Lattice Structures Using Mathematical and ANFIS Models. Polymers 2023, 15, 1720. [Google Scholar] [CrossRef] [PubMed]
  7. Jatti, V.S.; Sapre, M.S.; Jatti, A.V.; Khedkar, N.K.; Jatti, V.S. Mechanical Properties of 3D-Printed Components Using Fused Deposition Modeling: Optimization Using the Desirability Approach and Machine Learning Regressor. Appl. Syst. Innov. 2022, 5, 112. [Google Scholar] [CrossRef]
  8. Ding, S.; Zou, B.; Wang, P.; Ding, H. Effects of nozzle temperature and building orientation on mechanical properties and microstructure of PEEK and PEI printed by 3D-FDM. Polym. Test. 2019, 78, 105948. [Google Scholar] [CrossRef]
  9. Khosravani, M.R.; Reinicke, T. Effects of raster layup and printing speed on strength of 3D-printed structural components. In Proceedings of the 1st European-Structural-Integrity-Society (ESIS) Virtual European Conference on Fracture (ECF), Virtual, 29 June–1 July 2020; pp. 720–725. [Google Scholar]
  10. Zhang, J.W.; Peng, A.H. Process-parameter optimization for fused deposition modeling based on Taguchi method. Adv. Mater. Res. 2012, 538, 444–447. [Google Scholar] [CrossRef]
  11. Alhazmi, M.W.; Backar, A.; Backar, A.H. Influence of infill density and orientation on the mechanical response of PLA+ specimens produced using FDM 3D printing. Int. J. Adv. Sci. Technol. 2020, 29, 3362–3371. [Google Scholar]
  12. Omiyale, P.K.; Omiyale, B.O. Mechanical behaviour of polylactic acid parts fabricated via material extrusion process: A taguchi-grey relational analysis approach. Int. J. Eng. Res. Afr. 2020, 46, 32–44. [Google Scholar]
  13. Tran, N.H.; Nguyen, V.N.; Ngo, A.V.; Nguyen, V.C. Study on the effect of fused deposition modeling (FDM) process parameters on the printed part quality. Int. J. Eng. Res. Appl. 2017, 7, 71–77. [Google Scholar]
  14. Peng, A.; Xiao, X.; Yue, R. Process parameter optimization for fused deposition modeling using response surface methodology combined with fuzzy inference system. Int. J. Adv. Manuf. Technol. 2014, 73, 87–100. [Google Scholar] [CrossRef]
  15. Chacon, J.M.; Caminero, M.A.; Garcia-Plaza, E.; Nunez, P.J. Additive manufacturing of PLA structures using fused deposition modelling: Effect of process parameters on mechanical properties and their optimal selection. Mater. Des. 2017, 124, 143–157. [Google Scholar] [CrossRef]
  16. Ayatollahi, M.R.; Nabavi-Kivi, A.; Bahrami, B.; Yahya, M.Y.; Khosravani, M.R. The influence of in-plane raster angle on tensile and fracture strengths of 3D-printed PLA specimens. Eng. Fract. Mech. 2020, 237, 106905. [Google Scholar] [CrossRef]
  17. ISO527-2; Plastics-Determination of Tensile Properties-Part 2: Test Conditions for Moulding and Extrusion Plastics. International Organization for Standardization: Geneva, Switzerland, 2012.
  18. Anycubic Mega, X. Anycubic, China. Available online: https://de.anycubic.com/products/mega-x (accessed on 15 April 2023).
  19. Instron 3360 Series Mechanical Testing Systems. Available online: https://www.instron.com/~/media/literature-library/products/2011/06/3300-series-table-model.pdf (accessed on 27 December 2021).
  20. Python Programming Language. Available online: https://www.python.org/ (accessed on 27 December 2021).
  21. PyCharm Integrated Development Environment. Available online: https://www.jetbrains.com/pycharm/ (accessed on 27 December 2021).
  22. TensorFlow Machine Learning Platform. Available online: https://www.tensorflow.org/ (accessed on 27 December 2021).
  23. Keras Frontend for TensorFlow. Available online: https://keras.io/ (accessed on 27 December 2021).
  24. TensorBoard Visualisation Kit for TensorFlow. Available online: https://www.tensorflow.org/tensorboard (accessed on 27 December 2021).
  25. An Overview of Gradient Descent Optimization Algorithms. Available online: https://ruder.io/optimizing-gradient-descent/ (accessed on 29 December 2021).
  26. Kingma, D.P.; Ba, J. Adam: A Method for Stochastic Optimization. In Proceedings of the 3rd International Conference for Learning Representations, San Diego, CA, USA, 7–9 May 2015. [Google Scholar] [CrossRef]
  27. Fávero, L.P.; Belfiore, P.; de Freitas Souza, R. Chapter 22—Artificial neural networks. In Data Science, Analytics and Machine Learning with R; Academic Press: Cambridge, MA, USA, 2023; pp. 441–467. [Google Scholar] [CrossRef]
  28. Dassault Systems Solidworks. Available online: https://www.solidworks.com/ (accessed on 15 April 2023).
Figure 1. ISO527-2 tensile test specimen 1B with relevant dimensions.
Machines 11 00547 g001
Figure 2. Anycubic Mega X 3D printer used for the manufacturing of the tensile test specimens.
Machines 11 00547 g002
Figure 3. Manufactured tensile test specimens (a); test specimens after tensile testing (b).
Machines 11 00547 g003
Figure 4. Instron 3366 tensile testing machine.
Machines 11 00547 g004
Figure 5. Artificial neural network architecture: single-output configuration (a), and two-output configuration (b).
Machines 11 00547 g005
Figure 6. Orthotropic material definition in Solidworks using predicted mechanical characteristics.
Machines 11 00547 g006
Figure 7. CAD model of the test part used for analysis.
Machines 11 00547 g007
Figure 8. Section through the CAD model of the test part (a) and manufactured test part (b).
Machines 11 00547 g008
Figure 9. Results of tensile strength tests on specimens.
Machines 11 00547 g009
Figure 10. Performance analysis plot for the artificial neural network used to predict tensile strength values.
Machines 11 00547 g010
Figure 11. Finite element analysis results for orthotropic material with predicted mechanical characteristics. Tensile stress results (a); displacement results (b).
Machines 11 00547 g011
Figure 12. (a) Test part failure mode under tensile testing. (b) Stress–strain plot generated during tensile testing of the part, indicating maximum tensile stress (upward triangle).
Machines 11 00547 g012
Table 1. FDM process parameter combinations used to manufacture the tensile test specimen pairs.
Speed (mm/s)306090120150180
Nozzle temperature (°C)190190190190190190
200200200200200200
210210210210210210
220220220220220220
Table 2. Mechanical and physical characteristics of bulk PLA.
PropertyValue
Heat Deflection Temperature (HDT)126 °F (52 °C)
Density1.24 g/cm3
Tensile Strength50 MPa
Flexural Strength80 MPa
Impact Strength (Unnotched) IZOD (J/m)96.1
Shrink Rate0.37–0.41% (0.0037–0.0041 in/in)
Disclaimer/Publisher’s Note: The statements, opinions and data contained in all publications are solely those of the individual author(s) and contributor(s) and not of MDPI and/or the editor(s). MDPI and/or the editor(s) disclaim responsibility for any injury to people or property resulting from any ideas, methods, instructions or products referred to in the content.

