Article

Geometric Design of a Low-Power Arcjet Constrictor and Determination of Velocity of Air-Based Plasma by Means of Analytical and Numerical Methods

by
Pedro José Argumedo Teuffer
,
Luis Enrique Marron Ramirez
,
Jean Fulbert Ituna-Yudonago
*,
Pablo Alejandro Arizpe Carreón
and
Carlos Manuel Rodríguez Roman
Department of Aerospace Engineering, Metropolitan Polytechnic University of Hidalgo, Boulevard Acceso a Tolcayuca 1009, Ex Hacienda San Javier, Tolcayuca 43860, Hidalgo, Mexico
*
Author to whom correspondence should be addressed.
Machines 2023, 11(5), 527; https://doi.org/10.3390/machines11050527
Submission received: 14 March 2023 / Revised: 3 April 2023 / Accepted: 24 April 2023 / Published: 2 May 2023

Abstract

:
The following research focuses on the analytical and numerical study of an arcjet constrictor. In order to perform these analyses, a geometric design of the constrictor was proposed. The analytical study considers mathematical models proposed by Stine and Watson, related to the properties of air propellants, such as the specific enthalpy, electric conductivity, thermal conductivity, and specific heat. The numerical study considered the equations for mass, momentum, energy, and electricity that describe the interaction between the electric arc and the fluid flow. These equations were solved in ANSYS FLUENT software, in which the κ - ϵ turbulence and the magnetohydrodynamic (MHD) models were used. The external routines, including user-defined functions, user-defined scalars, and user-defined memory were implemented in C++ language for source terms and linked to ANSYS FLUENT. The velocity profiles were obtained analytically for the electric arc temperatures of 9000 K, 10,000 K, and 11,000 K with peak magnitudes of 2960 m/s, 3350 m/s, and 3100 m/s, respectively, at the outlet of the constrictor. It was observed from the numerical results that the velocity magnitude of the air-based plasma inside the constrictor increases as the temperature of the electric arc rises up to 10,000 K However, above 10,000 K, the velocity magnitude decreases because at this temperature level, the air particles become completely ionized, and the specific heat of the air-based plasma decreases. The numerical simulation produced velocity profile magnitudes at two different electric arc temperatures (9000 K and 10,000 K) with peak magnitudes of 2400 m/s and 2900 m/s, respectively, at the outlet of the constrictor. The numerical and analytical results were very close with an error of 16.327%.

1. Introduction

Electric thrusters are widely used in orbital missions, especially in the last stage to place the payload in its designated orbit [1,2,3,4,5,6].
There are three different types of electric thrusters: electrostatic (ion), electromagnetic (Hall), and electrothermal (resistojet and arcjet), which are generally described in terms of the acceleration method used to produce the thrust [7,8,9,10]. Each electric thruster provides better mission performance for different missions. Hall thrusters and arcjet thrusters with lower specific impulses are best for quick orbit insertion and Earth transfer missions, while ion thrusters, with higher specific impulses, are better for orbit maintenance and interplanetary missions. There are three different types of electric thrusters: electrostatic (ion), electromagnetic (Hall), and electrothermal (resistojet and arcjet), which are generally described in terms of the acceleration method used to produce the thrust [7,8,9]. Each electric thruster provides better mission performance for different missions.
Ion thrusters with higher specific impulses (Isps) ranging from 3000 s to 3800 s are better for orbit maintenance and interplanetary missions [11]. Resistojet thrusters with the lowest Isps (300–350 s) are capable of performing orbit correction and stationkeeping maneuvers for small satellites as well as attitude control missions [12].
Hall thrusters and arcjet thrusters with lower Isps (ranging from 1500 to 2000 s and from 400 to 1000 s, respectively) are better for quick orbit insertion and Earth transfer missions [9,11].
Arcjet thrusters offer several advantages, including direct heating of gas, low voltage requirements, simple device construction, and high thrust. They can use various propellants, including inert gases, hydrazine, air, and nitrogen. However, they have several disadvantages, including low efficiency, high erosion at high power, low specific impulse (Isp), high current, heavy wiring, heat loss, and more complex power conditioning compared to Hall thrusters. On the other hand, while Hall thrusters have the disadvantage of using a single propellant and having high beam divergence, they have relatively simple power conditioning, desirable specific impulse (Isp) ranges, and are compact in size [9].
Throughout the twentieth and twenty-first centuries, various efforts have been made to study the performances and applications of arcjet thrusters. Studies have been conducted experimentally, analytically, and numerically. Experimental data were reported in the 1950s and 1960s, including by CANN et al. [13], who investigated the behavior of the specific enthalpy curve inside an arcjet constrictor using different propellants, such as helium, hydrogen, argon, air, and ammonia. In addition, they measured and studied trends of thermal and electrical conductivity using air as a propellant at different temperatures and pressure levels. Correlations based on experimental data using the Stine–Watson theory have also been used. Wallner and Czika [14] conducted a thorough analysis based on experimental tests on different arcjet thrusters, describing in detail their characteristics and classification, such as geometry, configurations, differences between alternate and direct current arcjet geometries, performance data, propellant thermodynamics, arcjet flow aerodynamics, and mathematical models used to analyze arc-energy transfer modes, including the uniformly heated propellant model, the core flow model, and the Stine–Watson model. Other experimental results were reported by Morris et al. [15]; they focused on the analysis of arc column temperature distributions and voltage gradients by the use of nitrogen as a propellant at different pressure values. Kriebel and Stevens [16] performed experimental tests of an arcjet class flight unit as part of the Arcjet Advanced Technology Transition Demonstration Program (Arcjet ATTD). Other tests were performed in space on the ESEX mission, verifying the availability of high-power arc jet technology for operational use in electric orbital transfer and insertion vehicles. Experimental data on thrust performance, plume deposition, contamination electromagnetic interference, thermal radiation, and plume heating were obtained.
According to analytical studies, King [17] developed a model to describe the interaction between an electric arc and the fluid inside a column using nitrogen and air as propellants. Two different cases were studied: the first one focused on the behavior of the diffuse arc at a low current, while the second one analyzed the arc behavior with a bright central core at high power. The results showed the radial temperature profile in the column using thermal and electrical conductivity properties. Goldenberg [18] implemented the approximation method using the Elenbaas differential equation to obtain the radial temperature profile in the column of an electric arc, considering the thermal and electrical conductivity properties. Hansen [19] reported tabulated air thermodynamic variables and properties, such as compressibility, energy, entropy, specific heat, speed of sound, coefficients of viscosity, thermal conductivity, and Prandtl numbers of different gases at temperature ranges, from 500 K to 15,000 K. Another model studied in the present document was one by Stine and Watson [20]. This model provides an approximation for the internal distribution of specific enthalpy and electrical conductivity in any part of the cylinder or constrictor. Bauer [21,22] published two documents with interesting information regarding the behavior of air when heated to temperatures between 1000 K and 10,000 K. These documents also describe the changes that air undergoes as it is heated to different temperatures, starting from an initial state as a neutral gas, followed by a dissociation process of nitrogen, oxygen, and rare gases, such as argon and xenon, and finally the ionization process of these constituents at temperatures above 2000 K. Yamada et al. [23] used the cross-flow arc (CFA) model, which is a non-classical model of an arc column, to study the curvature of the electric arc in the region of the constrictor. The thermal diffusivity and mass transport properties of the propellant were considered to calculate the temperature distribution in the arcjet.
Concerning the numerical studies, numerical codes have been developed to analyze the behavior of propellant-based plasma in the arcjet constrictor or arcjet torch. Heiermann [24] used a numerical code to compute the thermophysical properties of argon and air-based plasma generated by an inductive plasma generator of radio frequency (RF) inside a wind tunnel. A finite volume code was used to iterate the transient equation, and Osher’s approximate Riemann solver, including the electron pressure, was used to compute the inviscid flow. Results showed that a large amount of plasma does not directly enter the vacuum pump system, but rather recirculates back from the plasma source. Moreover, the recirculated plasma mixes with the plasma source jet, causing a change in its physical properties, such as temperature and density. Trelles et al. [25] studied the behavior of the electric arc inside a plasma torch numerically. They used a reattachment model to simulate the physical reattachment process as part of a local thermodynamic equilibrium description of the plasma flow. This model was incorporated into a three-dimensional and transient description of the plasma flow. They solved the fluid and electromagnetic equations describing the plasma flow using a fully-coupled approach with a variational multi-scale finite element method. It was observed that the temperature and pressure rapidly increase, causing a radial expansion of the neutral gas. Time-averaged profiles along the longitudinal and radial axes at the outlet were also plotted. Lopez et al. [26] conducted a numerical analysis of a plasma arcjet torch using two numerical codes: the ARES and PAPYRUS codes. The ARES code used a finite volume method to solve the time-dependent form of Navier–Stokes equations in the chemical non-equilibrium, and viscous terms were calculated by a finite difference method. The PAPYRUS code was used to predict the arc flow by solving Navier–Stokes equations in the thermal non-equilibrium using a finite volume approach. However, this code was limited to argon gas simulations. The results showed that species densities are highly sensitive to the electric arc, and the implementation of the electric arc model in the ARES code was crucial in predicting the properties of the plasma flow accurately. Gokcen et al. [27] used the data-parallel line relaxation (DPLR) code developed by NASA to analyze the behavior of the arcjet panel-testing capability development using semi-elliptical nozzles in a highly specific enthalpy arcjet facility. The supersonic and hypersonic flows in chemical and thermal imbalances were analyzed using Navier–Stokes equations. The results show the contours of pressure, heat flux, and Mach number.
Commercial computational fluid dynamics (CFD) software tools are used to study the behavior of propellant-based plasma in the arcjet constrictor. Selezneva et al. [28] used ANSYS FLUENT software to study the dynamical and physical properties of the supersonically expanding neon, argon, and xenon-based plasma formed by a cascaded arc (arcjet). Simulations were carried out using the Navier–Stokes model in two axisymmetric cascaded arcs. The results showed that the large differences in atomic weight and ionization potential between argon, neon, and xenon-based plasma are primarily responsible for the differences in dynamic and physical properties during the expansion of rare gases. Wei et al. [29] used the magnetohydrodynamic (MHD) model included in ANSYS FLUENT to simulate the behavior of the argon-based plasma flow in a cascade arc. The viscous turbulent flow was considered, and the κ - ϵ model was used. The results show that the temperature can reach a value as high as 13,600 K for the calculated potential value of 160 V with a given current density of 106 A/m 2 , and the pressure drops from 105 Pa to 100 Pa along the arc. The radial distributions of temperature, velocity, density, and electric potential in the cascade arc for three different cross-sections have also been plotted. Ardakani [30] carried out a numerical–experimental study of the arc fluctuations in a direct current (DC) plasma torch. A detailed three-dimensional model of the plasma torch was developed. The plasma jet stream, composed of various common plasma torch gas mixtures, such as argon–hydrogen and argon–carbon dioxide–methane, was numerically simulated using ANSYS FLUENT software, and a user-defined function (UDF) code was developed in which the general fluid mechanics governing equations were modified to incorporate terms representing electromagnetic equations. Turbulent κ - ϵ and the κ - ω models were used. The results show that simulation results using the κ - ϵ model are much more accurate than those using the κ - ω model. The turbulence kinetic energy generation is one of the main factors affecting particle acceleration and heating. This energy is highly dependent on the velocity gradient in the plasma torch. In argon and argon–hydrogen plasma, the temperature was close to 3000 K at the cathode where the heat generation was maximum. Moreover, the voltage drop increases as the arc length increases and decreases when the arc radius increases.
Based on the bibliographic reviews of the three methods (experimental, analytical, and numerical) used in the different studies performed on arcjet, it can be inferred that each method has its advantages and disadvantages. The experimental method provides firm control over the variables to obtain results, allows for cause and effect to be determined, and results obtained are specific and replicable. Moreover, the experimental method can be combined with other research methods. However, its main disadvantages include the high manufacturing cost of equipment, such as a vacuum chamber, the time-consuming process, extraneous variables that cannot always be controlled, and subjective results due to the possibility of human error. The analytical method provides exact solutions and is the most rigorous one. However, it becomes hard to use for complex problems. The numerical method is very suitable for solving complex arcjet engineering problems and also for arcjet design or redesign. Although the numerical method provides benefits compared to the analytical and experimental methods, it still has weaknesses. The numerical method is an approximation method for solving mathematical problems, and to obtain accurate values, many iterations are necessary, which consume more time to solve the problem precisely to the desired value. Therefore, it is recommended that the numerical method be combined with the experimental or analytical method to validate its results.
In order to reduce the time and cost of a study, it is advisable to combine the numerical method with the analytical one. In the arcjet constrictor study technique, the analytical method can be used to obtain the first result of the behavior of the proposed constrictor, which will serve as a reference point for the numerical study. This is the technique that is proposed in the present work, which consists of geometrically designing a low-power arcjet constrictor and determining the velocity of the air-based plasma by means of analytical and numerical methods. This constrictor is designed to be used in an arcjet to propel a nano- or micro-satellite in the last stage of its mission. The use of air as a propellant is significant for several reasons, including its cost-effectiveness compared to other propellants used in propulsion systems, such as argon, xenon, hydrogen, hydrazine, etc. Furthermore, the study of the velocity of the air-based plasma is crucial because the thrust generated by the arcjet is related to the velocity magnitude at the constrictor outlet, which helps to determine the nozzle dimensions. The work is divided into four sections, including the introduction. The second section deals with materials and methods, starting with the geometric design of the constrictor, followed by the implementation of the analytical and numerical methods. The third section is dedicated to analytical and numerical results as well as discussions, while the fourth section presents the conclusions of the study and offers some suggestions for future research.

2. Materials and Methods

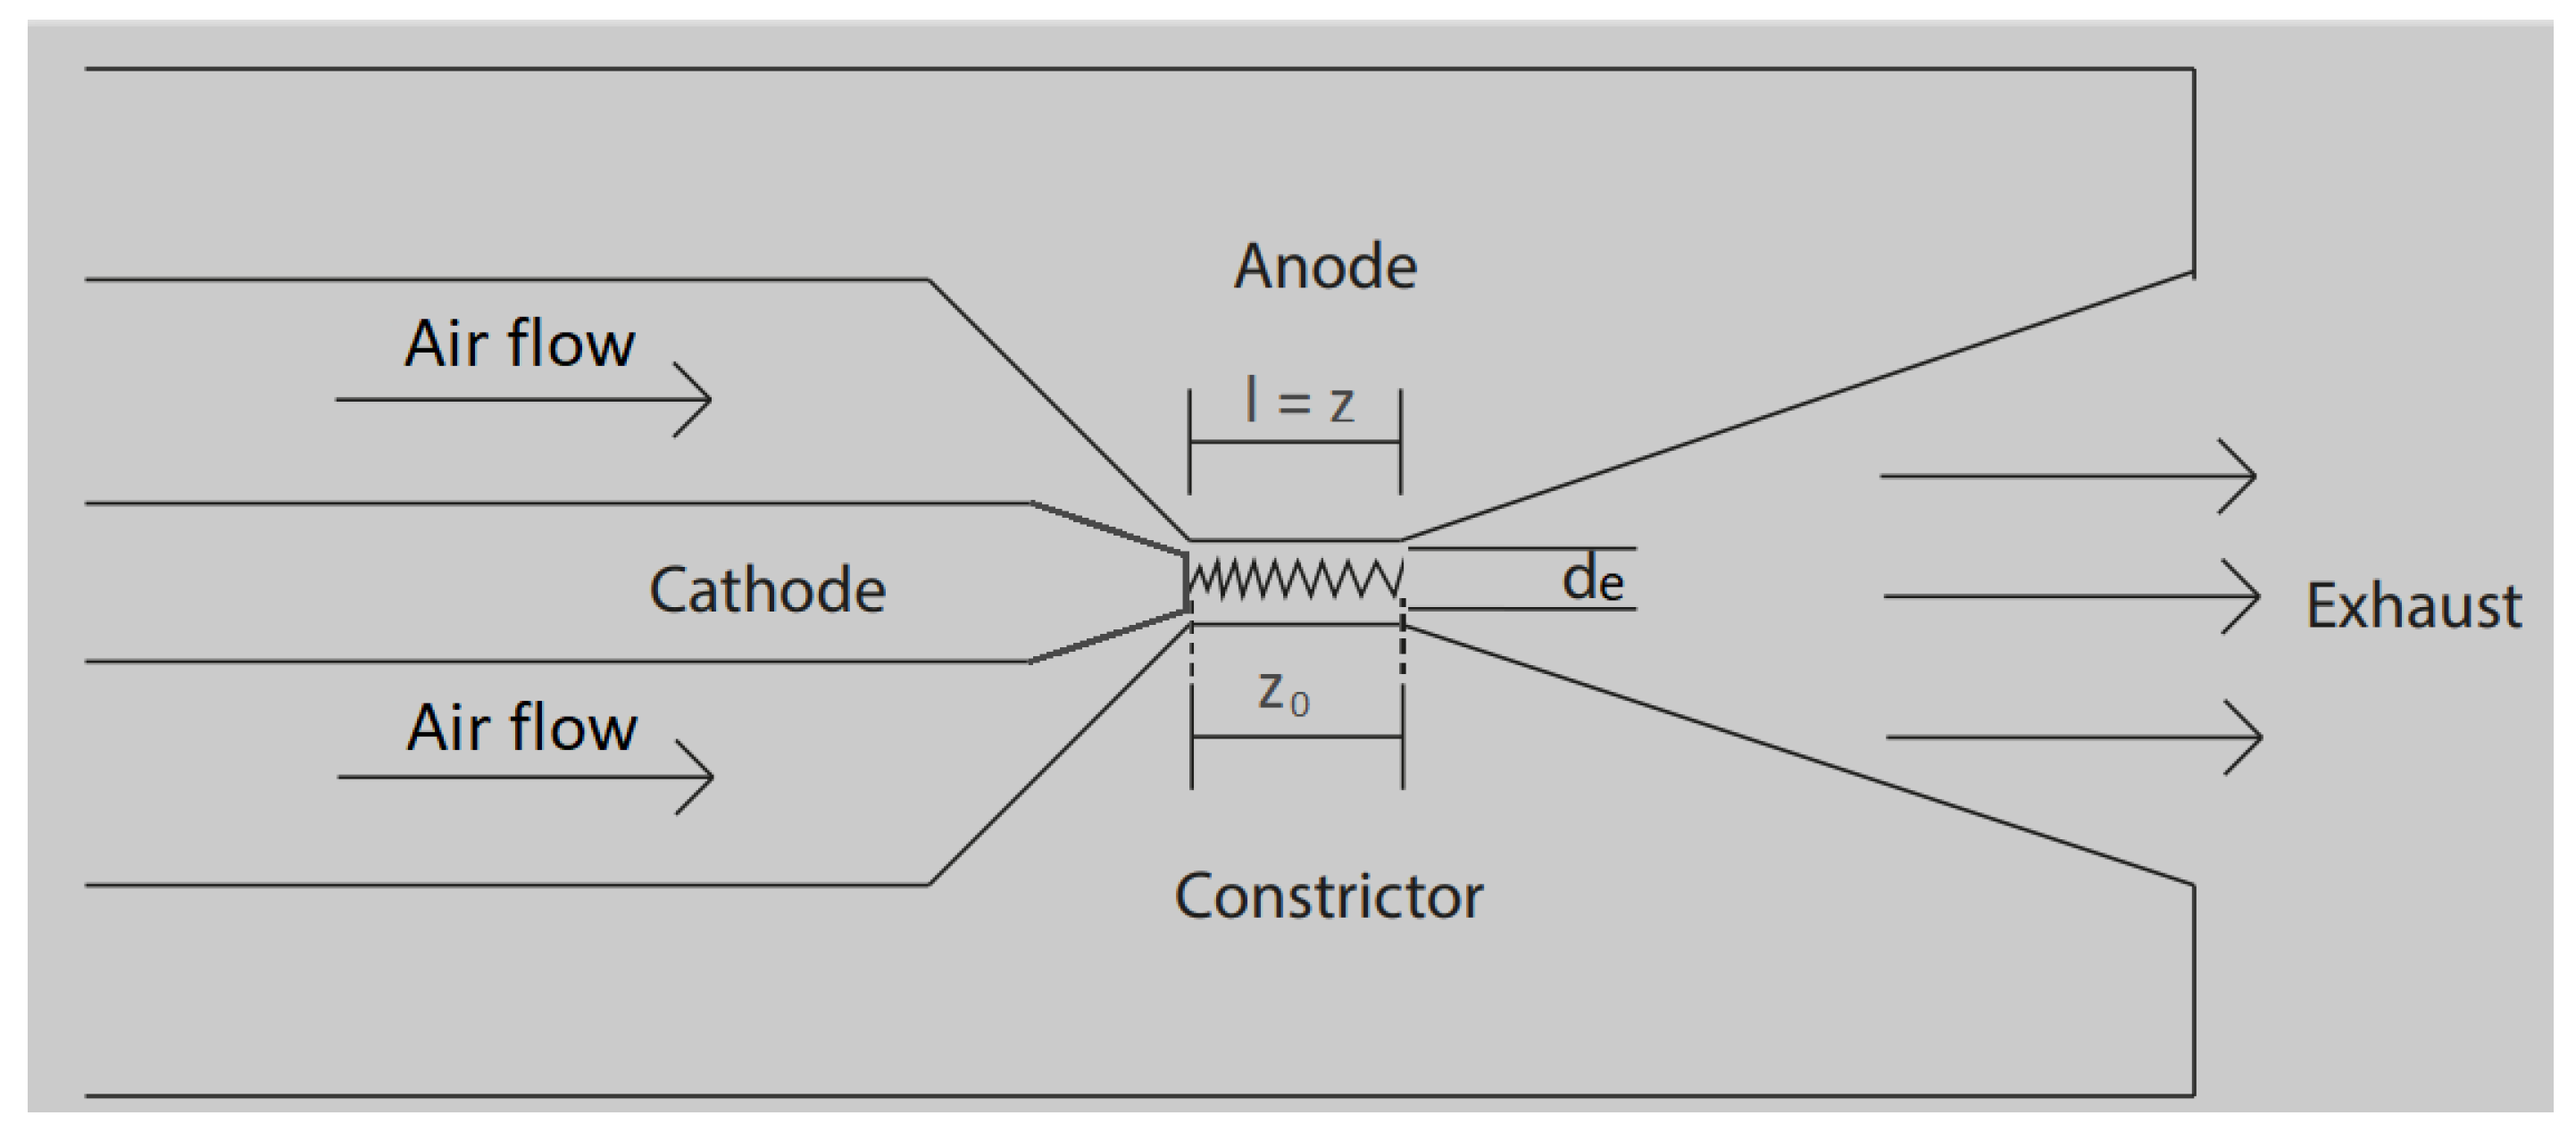
2.1. Geometric Design of the Constrictor

The constrictor is part of the arc jet thruster located between the propellant injector and the nozzle; its main task is to heat the propellant by an electric arc, until its ionization in the form of plasma, increasing its velocity magnitude before the expansion of plasma at the nozzle. The geometric design of the constrictor proposed in this study is based on two main parameters: the constrictor length and diameter. The magnitudes proposed for the design parameters are included in the ranges reported by Wallner et al. [14], as can be seen in expressions (1) to (3). These ranges correspond to a low-power arc jet thruster of 1 kW.
1.5 l c d c 1.8
0.4 mm d c 1 mm
0.1 mm x 1 mm
where ( l c ) and ( d c ) are the length and diameter of the constrictor, respectively, and (x) is the increment interval at a given station of the constrictor length. For this design, the value of l c / d c and d c is 1.5 and 1 mm, respectively. The methodology proposed by Morel [31] is used to determine the length of the convergent section of the constrictor entrance, as shown in the following expression.
0.75 l i n t d i n t 1.25
where l i n t and d i n t are the length and diameter of the convergent nozzle at the constrictor inlet. For the calculation of the wall thickness of the constrictor, Fourier’s heat transfer law is considered, using tungsten as material. A maximum temperature of 2300 K in the wall of the constrictor is considered in order to obtain a thickness of 4 mm. The constrictor’s total mass is 0.076 g. This mass magnitude allows the constrictor to be installed in a nano- or micro-satellite propulsion system [32]. The dimensions of the constrictor are described in Table 1.
Based on the dimensional characteristics reported in Table 1, the geometry of the constrictor was drawn in the SolidWorks software. Different views of the constrictor geometry are presented in Figure 1 with corresponding dimensions.

2.2. Assumptions for Analytical and Numerical Methods

To model the electric arc in the constrictor, the following assumptions are considered [20,33]:
  • The airflow is assumed to be one-dimensional, laminar, steady-state, and with a constant mass flow rate.
  • The electric discharge is steady.
  • The heat loss due to thermal conduction is much greater compared to radiation.
  • The air-based plasma is in thermodynamic equilibrium.
  • The Lorentz force is negligible.
  • The radial variation of the electric potential is negligible.
The numerical method is based on the following assumptions:
  • The air-based plasma is in the thermodynamic equilibrium.
  • The air-based plasma has an atmospheric pressure of 1.
  • The gravitational effects are negligible.
  • The flow is turbulent.
  • Radiation loss is considered.

2.3. Analytical Method

The analytical method for studying the velocity behavior of the air-based plasma in the constrictor is based on the Stine–Watson model [20] and the Cengel–Cimbala method [33]. The Stine–Watson model accounts for axial convection heat transfer and specific enthalpy gradient terms (see Equation (5)) in comparison with other models, such as core-flow and the uniformly heated propellant [14].
ρ u h ¯ z = C c J 2 σ + 2 S r 2 + 1 r S r + 2 S z 2
where ρ is the density, u is the axial velocity, C c is the conversion constant, J is the current density, σ is the electrical conductivity, and S is the thermal conductivity function ( S = K · d T ). The first term is the rate of energy absorption by the air, the second term is the rate of energy production by ohmic heating, and the remaining terms give the rate of heat loss by conduction.
One of the main differences between the core-flow model and the Stine–Watson model is that the Stine–Watson model considers axial convection terms in the specific enthalpy gradient, while the radial conduction terms are neglected after solving the energy transfer model due to their low contributions. The radial heat transfer conduction term is considered a loss of energy due to the oscillation of the electric arc inside the constrictor in a small zone called the damping zone, located between the arc surface and the constrictor wall.
In addition, in the Stine–Watson model, the arc is assumed to fill a relatively large part of the constrictor while in the core-flow model, the fluid that flows through the constrictor is heated by a thin electric arc; the flow is divided into two regions: the inner flow at a high temperature in contact with the electric arc and the outer flow with a lower temperature. The current-carrying region of the electric arc column is illustrated in Figure 2, where the shape of the electric arc is represented as a circular cylinder with a length of l and a diameter of d e .
Considering the assumptions described above, the specific enthalpy ( h ( r , z ) ) from Equation (5) can be expressed as follows:
h ( r , z ) = 9.43 × 10 3 ( C p K A 1 / 2 ) ( I r e ) ( 1 e 11.5 z z 0 ) 1 / 2 j 0 ( 2.4 r r e )
where r e is the radius of the electric arc, I is the arc current, Z 0 is the electric arc length, Z is the length of the constrictor, J 0 is the Bessel function of the first kind, zero order, r is the constrictor radius variation, r c is the internal constrictor radius, and A is the conductivity ratio, which is calculated from Equation (7).
σ = A S
In Equations (6) and (7), the specific heat, thermal conductivity, and electrical conductivity vary according to the temperature at a specific pressure. For air-based plasma [34], the curves representing these properties are shown in Figure 3a,b for a pressure of 1 atm.
The temperature distribution (T) of the propellant is obtained by the mean of Equation (8), where it is considered that the fluid is calorically perfect [23].
h ( r , z ) = C p T
In order to obtain the velocity distribution of the propellant in the constrictor region, first, the speed of sound (a) must be defined as follows [29].
a = γ R T M
where γ denotes the adiabatic constant, R is the gas universal constant, and m is the molar mass of the air-based plasma.
Once the speed of sound along the axial is defined, the maximum velocity of the propellant ( V m a x ) can be described as follows [29].
V m a x = a γ + 1 γ 1
Finally, the radial distribution of the air-based plasma velocity in the constrictor can be obtained using the Cengel–Cimbala [33] method as shown in Equation (11).
u ( r ) = V m a x ( 1 r p 2 r 2 )

2.4. Numerical Method

2.4.1. Governing Equations

The numerical method for studying the velocity behavior of the air-based plasma in the constrictor is based on four main equations: mass, momentum, energy, and electric potential conservation equations. These equations are developed considering the assumptions described in Section 2.1.
Mass equation:
Mass Equation (12) is written in cylindrical coordinates with no source terms.
1 r r ( r ρ v r ) + z ( ρ v z ) = 0
where ρ is the density of the air-based plasma, r is the constrictor radius, v r and v z are the radial and axial velocities of the air-based plasma, respectively.
Momentum equation:
Momentum Equation (13) is written in compact form, it includes the convective, diffusive, and source terms.
( v · ) v = p + μ e f f 2 v + F
where μ e f f is the effective viscosity, which is the sum of the molecular and turbulent viscosities, while F is the source term that includes the Lorentz and gravitational forces. The Lorentz force that is generated by the product of the current density ( j ) and the magnetic field ( B ) [35] are described in Equation (14).
( v · ) v = p + μ e f f 2 v + j × B
On the other hand, the gravitational force is neglected due to its low contribution to the plasma ion acceleration process [25].
Energy equation
Energy Equation (15) is made up of the convective, diffusive, and source terms:
( v · ) h = · ( k e f f T ) + S t o t
where k e f f is the sum of the laminar and turbulent thermal conductivity [36], h is the specific enthalpy difference between two cells defined as h = C p T , where C p is the specific heat of the fluid and T is the temperature difference between two cells. S t o t is the source term (see Equation (16)), which includes ohmic heating ( j 2 / σ ), the radiative heat flux ( S r a d ), and the heat transport by diffusion of electrons ( e e f f ).
S t o t = j 2 σ + S r a d + e e f f
where
e e f f = 5 2 k B e ( j r r T + j r z T )
S r a d = 4 k B k 0 P P 0 ( T 4 T 0 4 )
In Equations (17) and (18), k B is the Stefan–Boltzmann constant with a constant value of 5.67057 × 10 8 W/m 2 K 4 , j r is the radial current density in the constrictor, k 0 is the extension of the coefficient with a constant value of 13 m 1 [37], P is the absolute pressure, P 0 is the pressure of reference with a value of 1 atm, T is the temperature, and T 0 is the ambient temperature [38]. The radiative heat flux behavior of the air-based plasma is shown in Figure 4.
Electric potential equation:
The electric potential ( ϕ ) supplied to the constrictor is modeled according to [29], as follows:
E = ϕ z
j = σ ϕ z
In Equation (19), the electric potential is a function of the electric field (E) while in Equation (20), it is a function of the current density (j). Substituting (19) in (20) yields:
j = σ E
The current density and the electric field can be expressed in conservative form as follows:
j z z = z ( σ ϕ z ) = 0
j z z + 1 r r ( r j r ) = 0
E z r = 0
E r = 0
where j z and j r are the axial and radial current density, respectively, while E z and E r are the axial and radial electric fields, respectively.
In this study, the realizable κ - ϵ turbulence model integrated in the FLUENT is used to solve the state equations. This model is semi-empirical; it contains and solves two equations: turbulent kinetic energy ( κ ) equation and the turbulent dissipation rate ( ϵ ) [39].
Turbulent kinetic energy:
x i ( ρ k v i ) = x j [ ( μ + μ t σ k ) k x j ] + P k + P b ρ ϵ Y M + S k
Turbulent dissipation rate:
x i ( ρ ϵ v i ) = x j [ ( μ + μ t σ ϵ ) ϵ x j ] + ρ C 1 S ϵ ρ C 2 ( ϵ 2 k + v ϵ ) + C 1 ϵ ϵ k C 3 ϵ P b + S ϵ
C 1 ϵ = 1.44; C 2 = 1.9; σ k = 1.0; σ ϵ = 1.2
C 1 = m a x [ 0.43 , η η + 5 ]
η = S k ϵ
where S = 2 S i j S i j .
In the turbulent viscosity, we have
μ t = ρ μ μ k 2 ϵ
C t = 1 A 0 + A s k U * ϵ
U * = S i j S i j + Ω i j ˜ Ω i j ˜
Ω i j ˜ = Ω i j 2 ϵ i j k ω k
Ω i j = Ω i j ¯ ϵ i j k ω k
where Ω i j ¯ is the tensor of the center of the rotation velocity in a rotating zone with angular velocity Ω i j . Constants A 0 and A S are described by
A 0 = 4.04
A s = 6 cos φ
where
φ = 1 3 cos 1 ( 6 W )
W = S i j S i k S k i S 3 ¯
S ¯ = S i j S i j
S i j = 1 2 ( u j x i + u i u j )

2.4.2. Numerical Simulation Procedures

The numerical analysis is performed using CFD ANSYS FLUENT software (2022 R1). This analysis is focused on obtaining the plasma velocity profile, which is much more influenced by the electric arc temperature. The following operating conditions are considered: the air mass flow rate of 2.4 × 10 5 kg/s, the current density of 1.96 × 10 7 A/m 2 , and the electric arc temperature vary from 9000 K to 10,000 K. This is due to the fact that the air-based plasma is widely ionized between 9000 K and 10,000 K [21].
To carry out the setup in ANSYS FLUENT (to solve the numerical model of the arcjet), the MHD model was used, which included the source terms of momentum and energy [40]. The Lorentz force and ohmic heating were included in the momentum source term and the energy source term, respectively. The Lorentz equation and ohmic heating were programmed in C++ and linked to ANSYS FLUENT by means of user-defined functions (UDFs), user-defined scalars (UDSs), and user-defined memories (UDMs). Additionally, the radiative behavior of the electric arc was considered by using the P1 radiation energy model [41,42]. Thermophysical properties of the air-based plasma, such as (specific heat, thermal conductivity, density, and dynamic viscosity) are dependent on the temperature [43]. The trends of thermal conductivity and specific heat were previously shown in Figure 3a,b, respectively, while the trends of the air-based plasma density and dynamic viscosity are shown in Figure 5 for a pressure of 1 atm. These properties are written in C++ and linked to ANSYS FLUENT via UDFs.
For the viscous model of the air-based plasma, the realizable κ - ϵ model was used. The boundary conditions used in the simulation are described in Table 2. The terms j ( r ) and T ( r ) depend on the constrictor radius, as shown in Equations (32) and (34), respectively.
j ( r ) = j c a t h e x p ( ( r d a r t c 4 ) )
where j c a t h is the current density at the cathode tip, r d a is the radial distance of the electric arc ( r d a 2 = x 2 + y 2 ) , and r t c is the radius of the tip of the cathode [44]. The current density at the tip is defined as [45]:
j c a t h = I 2 π r t c 2
where the parabolic temperature profile is described mathematically as:
T ( r ) = 300 + 3200 e x p ( ( r d a 2 r t c ) 4 )
The simulation was performed using the pressure-based solver and the coupled algorithm was used to couple the velocity and pressure. For spatial discretization, the second-order upwind was used for momentum and energy equations. Finally, the initialization of the MHD model was carried out by adjusting the magnitudes of all variables in the electric potential equations.

2.4.3. Computational Domain and Mesh Independence Analysis

The computational domain on which this study is focused is the fluid domain inside the constrictor. The advantage that ANSYS FLUENT offers is that the wall thickness of the constrictor can be generated in the setup step. This allows for analyzing the heat transfer phenomena at the wall. This procedure allows for minimizing the number of elements or nodes and, consequently, reducing the computational simulation time. Figure 6 shows the computational domain, which was drawn in ANSYS Design Modeler CAD (2022 R1).
The computational domain was meshed using ANSYS Meshing software (2022 R1) with an unstructured method, as shown in Figure 7a. This method is recommended for geometric shape domains and allows reducing the number of nodes. Body sizing was used to refine the mesh and inflation was applied to the boundary layer (see Figure 7b). As can be seen in Figure 7c, the mesh at the tip of the cathode is very fine due to the fact that it is a zone of major importance for the analysis where the electric arc occurs.
In order to conduct the mesh independence analysis, the computational domain was meshed into nine different sizes, represented by M1 to M9 in Table 3. The number of elements, nodes, and mesh metrics (minimum, maximum, average, and standard deviation) are described for each mesh size.
The velocity of the air-based plasma in the constrictor was selected as the mean variable to carry out the mesh independence analysis. Figure 8 shows the volumetric average velocity of the air-based plasma in the constrictor for each mesh size. It can be observed that the curve has very little variation when the number of mesh elements reaches 450,898, indicating the mesh independence of the results. As a result, for the numerical simulation of the constrictor, a mesh size M8 with 450,898 elements was selected. The mesh metric values of M8 are reported to be within the excellent quality range according to the ANSYS FLUENT user guide [42].

3. Results and Discussion

3.1. Results of the Analytical Approach

The analytical model of the air-based plasma-specific enthalpy in the constrictor was carried out considering the following input variables: air mass flow rate of 2.4 × 10 5 kg/s, current intensity of 7.7 A, voltage of 97 V, J 0 of 2.4, and pressure 1 atm. Considering that the electric arc reaches a temperature of 9000 K, the behavior of the specific enthalpy along the constrictor can be seen in Figure 9a. The specific enthalpy increases along the axial axis until it reaches a maximum value of around 30% of the constrictor length. This is due to the amount of maximum energy that the air-based plasma can acquire from the electric arc. It decreases as the radial distance between the electric arc and the wall of the constrictor increases. The minimum value (2 × 10 6 J/kg) is reached at the region near the wall, while the maximum value (11 × 10 6 J/kg) is reached at the center of the constrictor. On the other hand, when the constrictor radius value r = r e = 0.25 × 10 3 m, the fluid is tangential and comes into direct contact with the electric arc. Above this radius value, the fluid is no longer in direct contact with the electric arc and, therefore, at the region next to the wall, the fluid receives less energy from the electric arc.
Similar behavior is shown in Figure 9b,c when the electric arc temperatures reach 10,000 K and 11,000 K, respectively. The specific enthalpy values increased significantly (14 × 10 6 J/kg) at a radius of 0.1 × 10 3 m, when the electric arc temperature reaches 10,000 K. Although the electric arc temperature reaches 11,000 K, the maximum value of specific enthalpy decreases to 12.5 × 10 6 J/kg (at a radius of 0.1 × 10 3 m). This trend is mainly due to the behavior of the specific heat ( C p ) of the air-based plasma, as shown in Figure 3b. C p reaches a maximum value at a temperature of approximately 10,000 K, and then decreases as the temperature value increases. A similar specific heat behavior of the air-based plasma was reported by D’Angola et al. [34].
The distributions of the axial velocity along the constrictor at different radii are shown in Figure 10a–c when the electric arc temperatures are 9000 K, 10,000 K, and 11,000 K, respectively. In general, the trends of the velocity distribution are the same as those of the specific enthalpy. In Figure 10a, the axial velocity at the center of the constrictor ( r = 0 m) reaches a magnitude of 2900 m/s, while in Figure 10b, when the electric arc temperature rises to 10,000 K, the velocity magnitude at the same radius increases up to 3400 m/s. However, in Figure 10c, when the electric arc temperature reaches 11,000 K, the velocity magnitude at the center of the constrictor decreases to 3100 m/s. These velocity variations can be well visualized in the form of radial profiles at the outlet of the constrictor, as shown in Figure 11. One can clearly see the variation in the velocity magnitude profiles at the electric arc temperatures of 9000 K, 10,000 K, and 11,000 K. It can be observed that at 11,000 K, the velocity magnitudes decreased compared to the one at 10,000 K. It is clear that the velocity magnitude variation is related to the specific heat behavior described above.

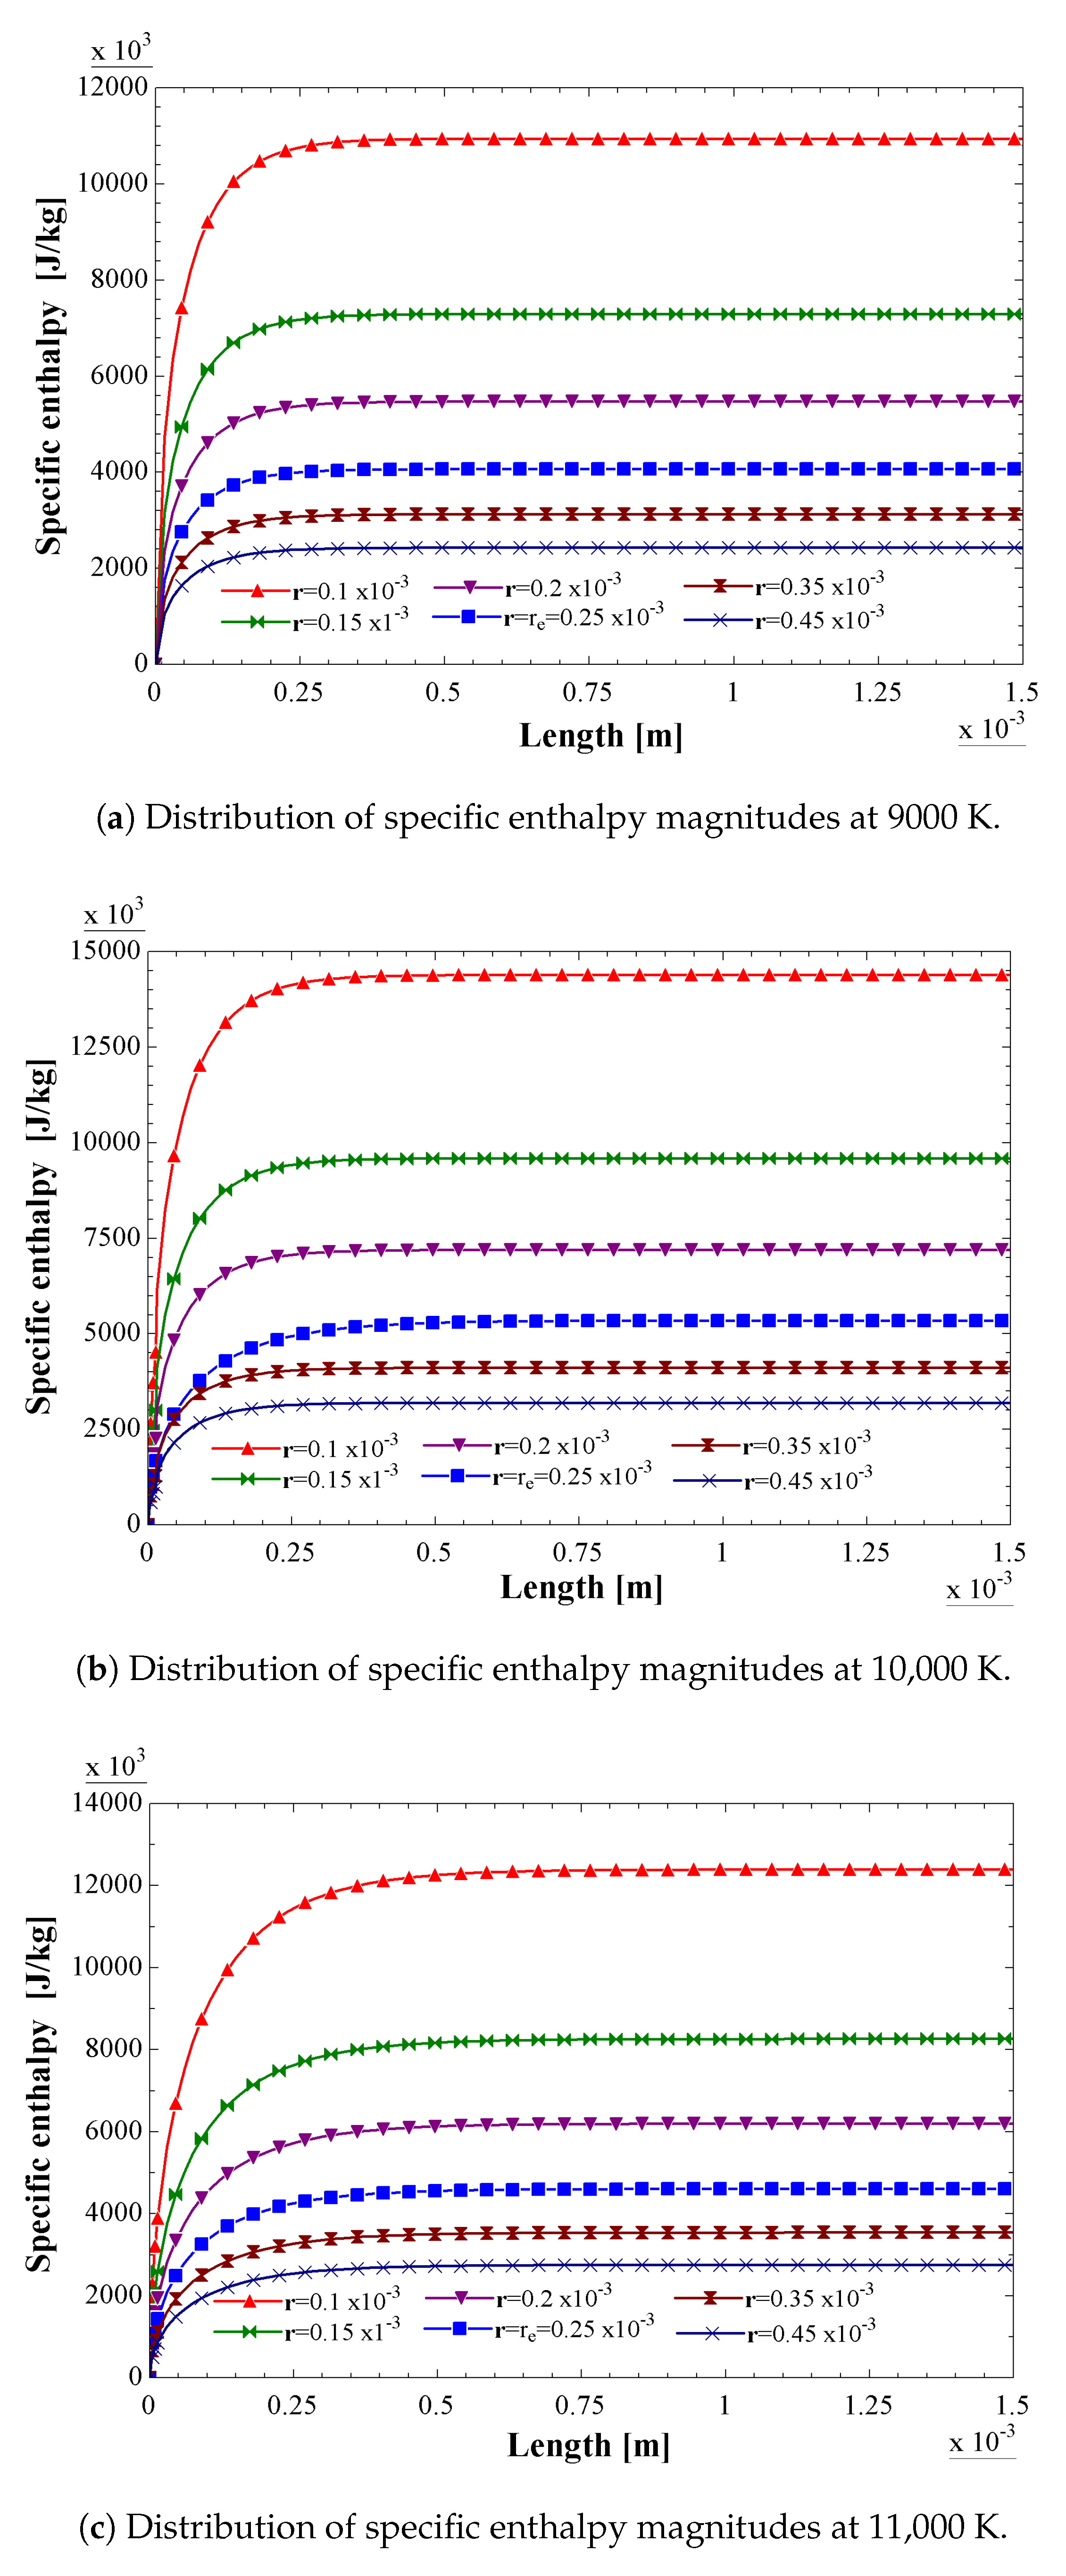
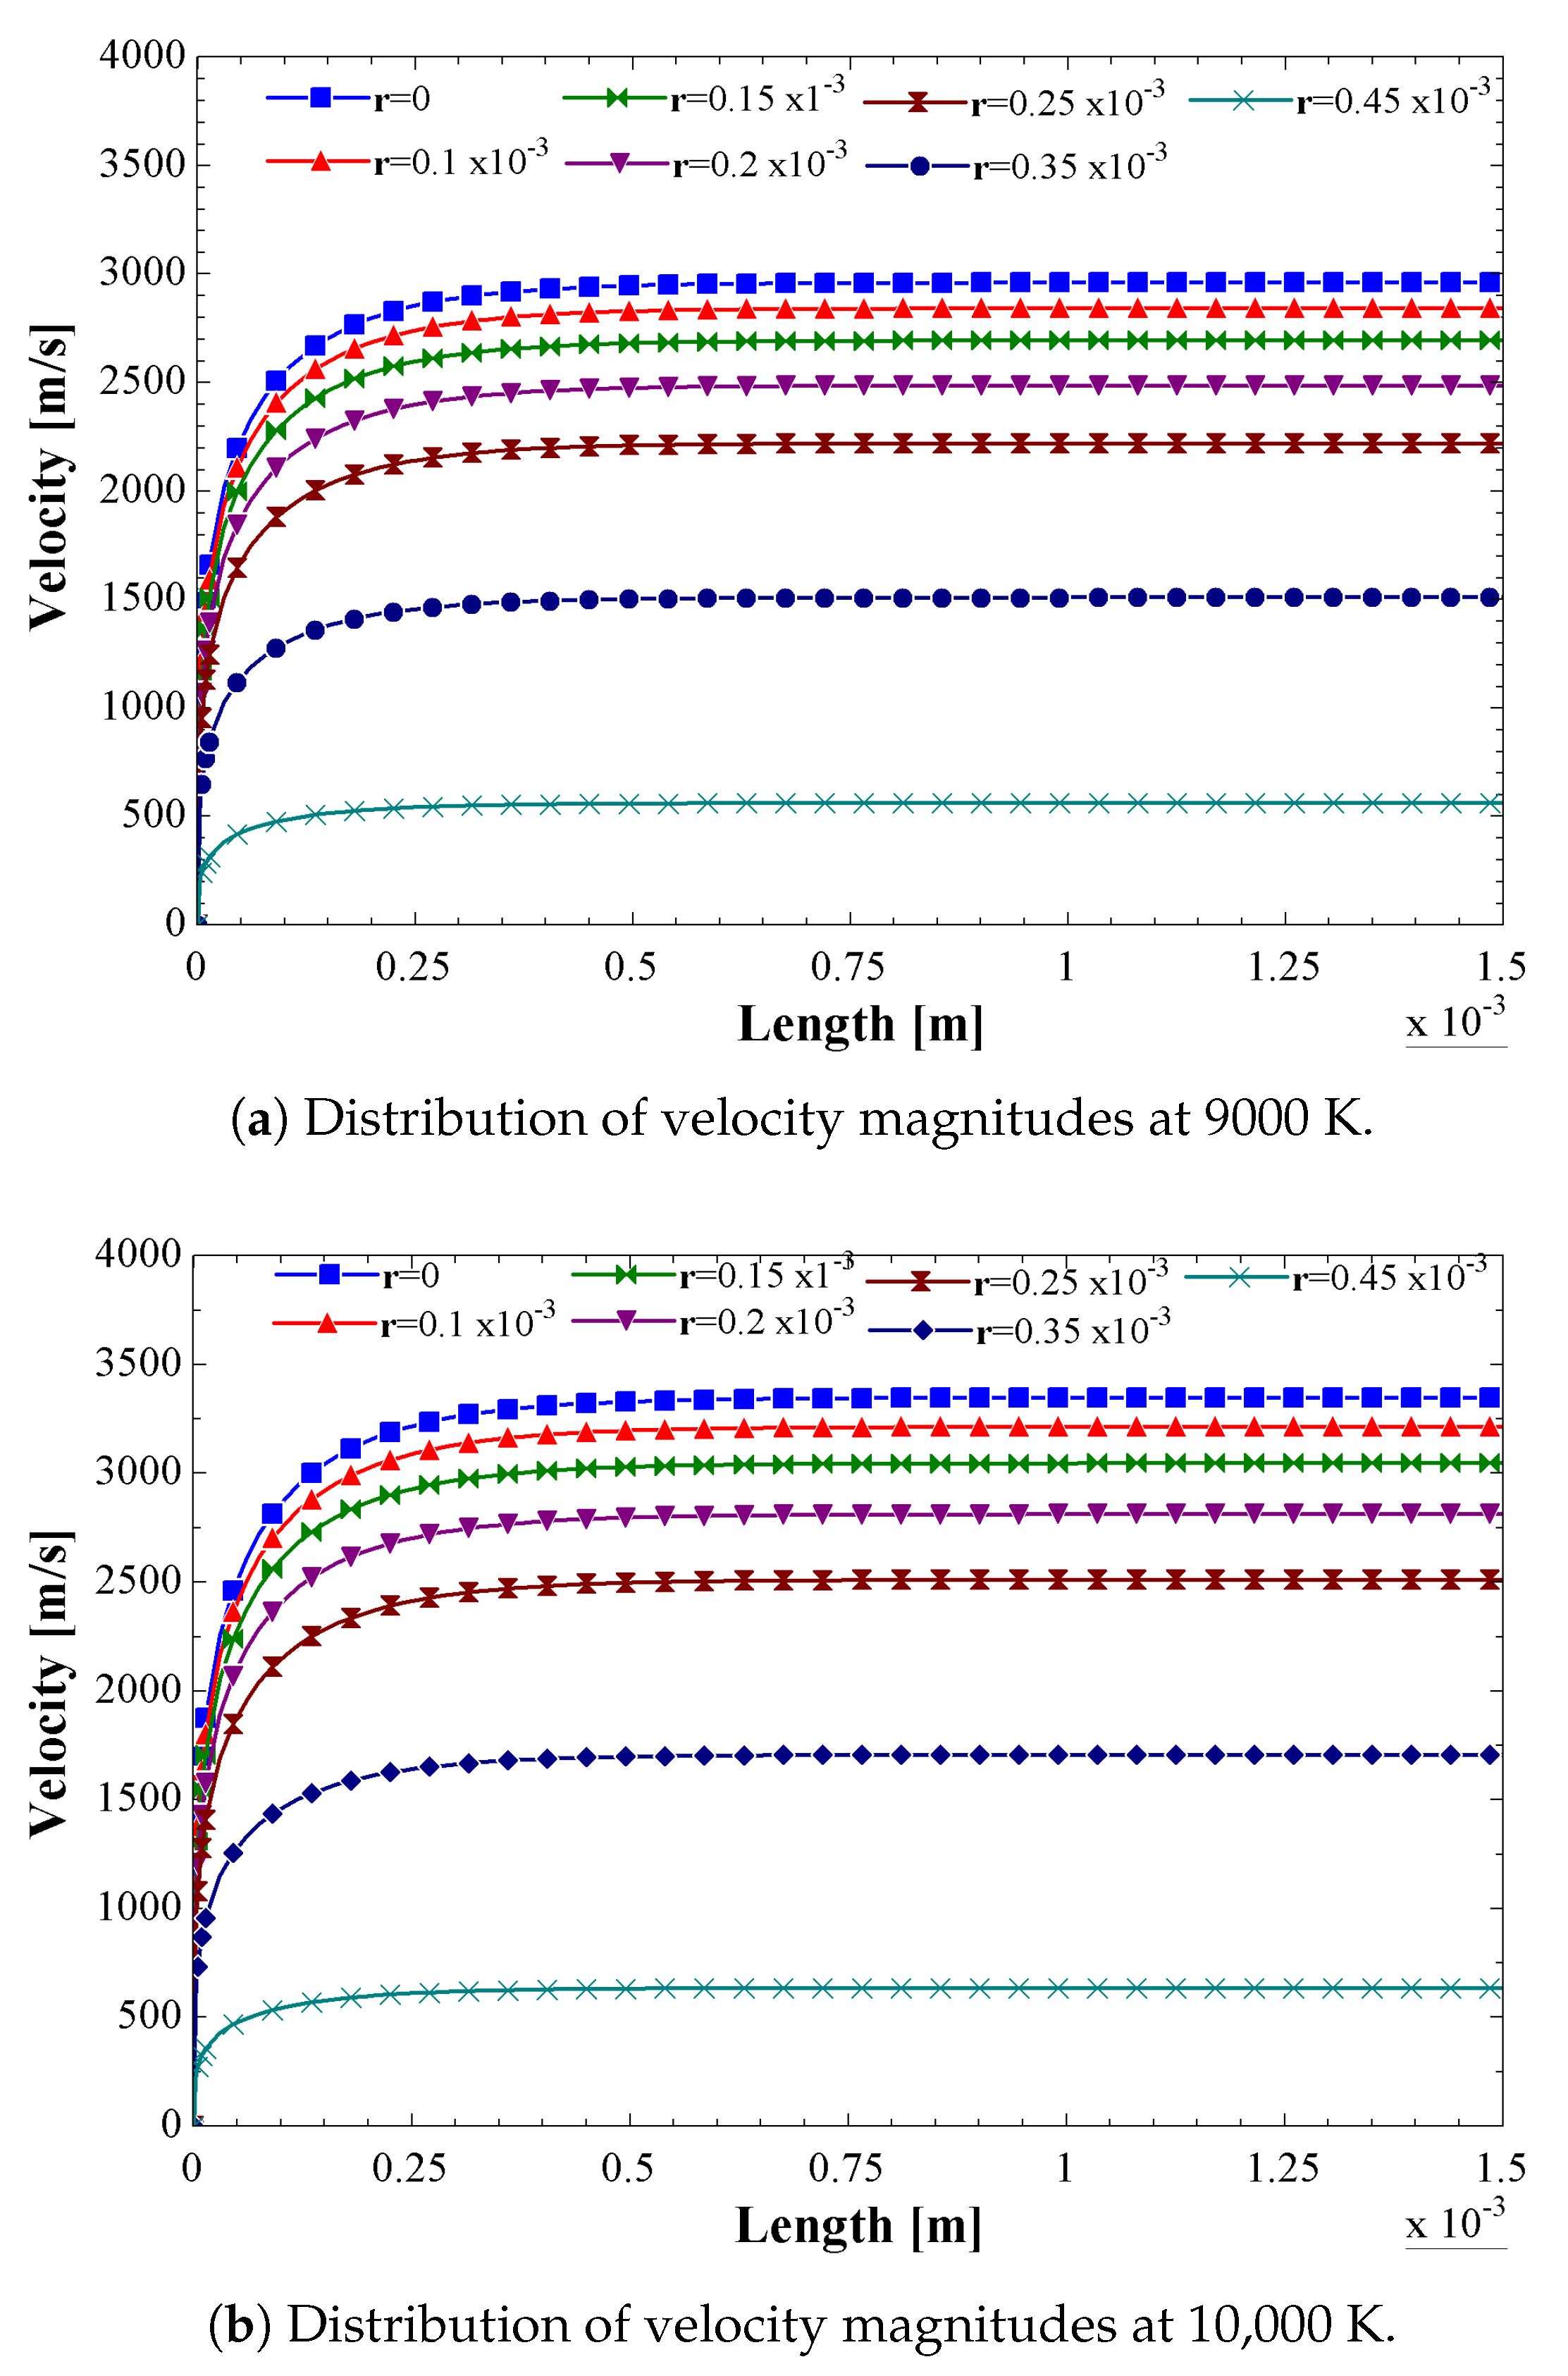
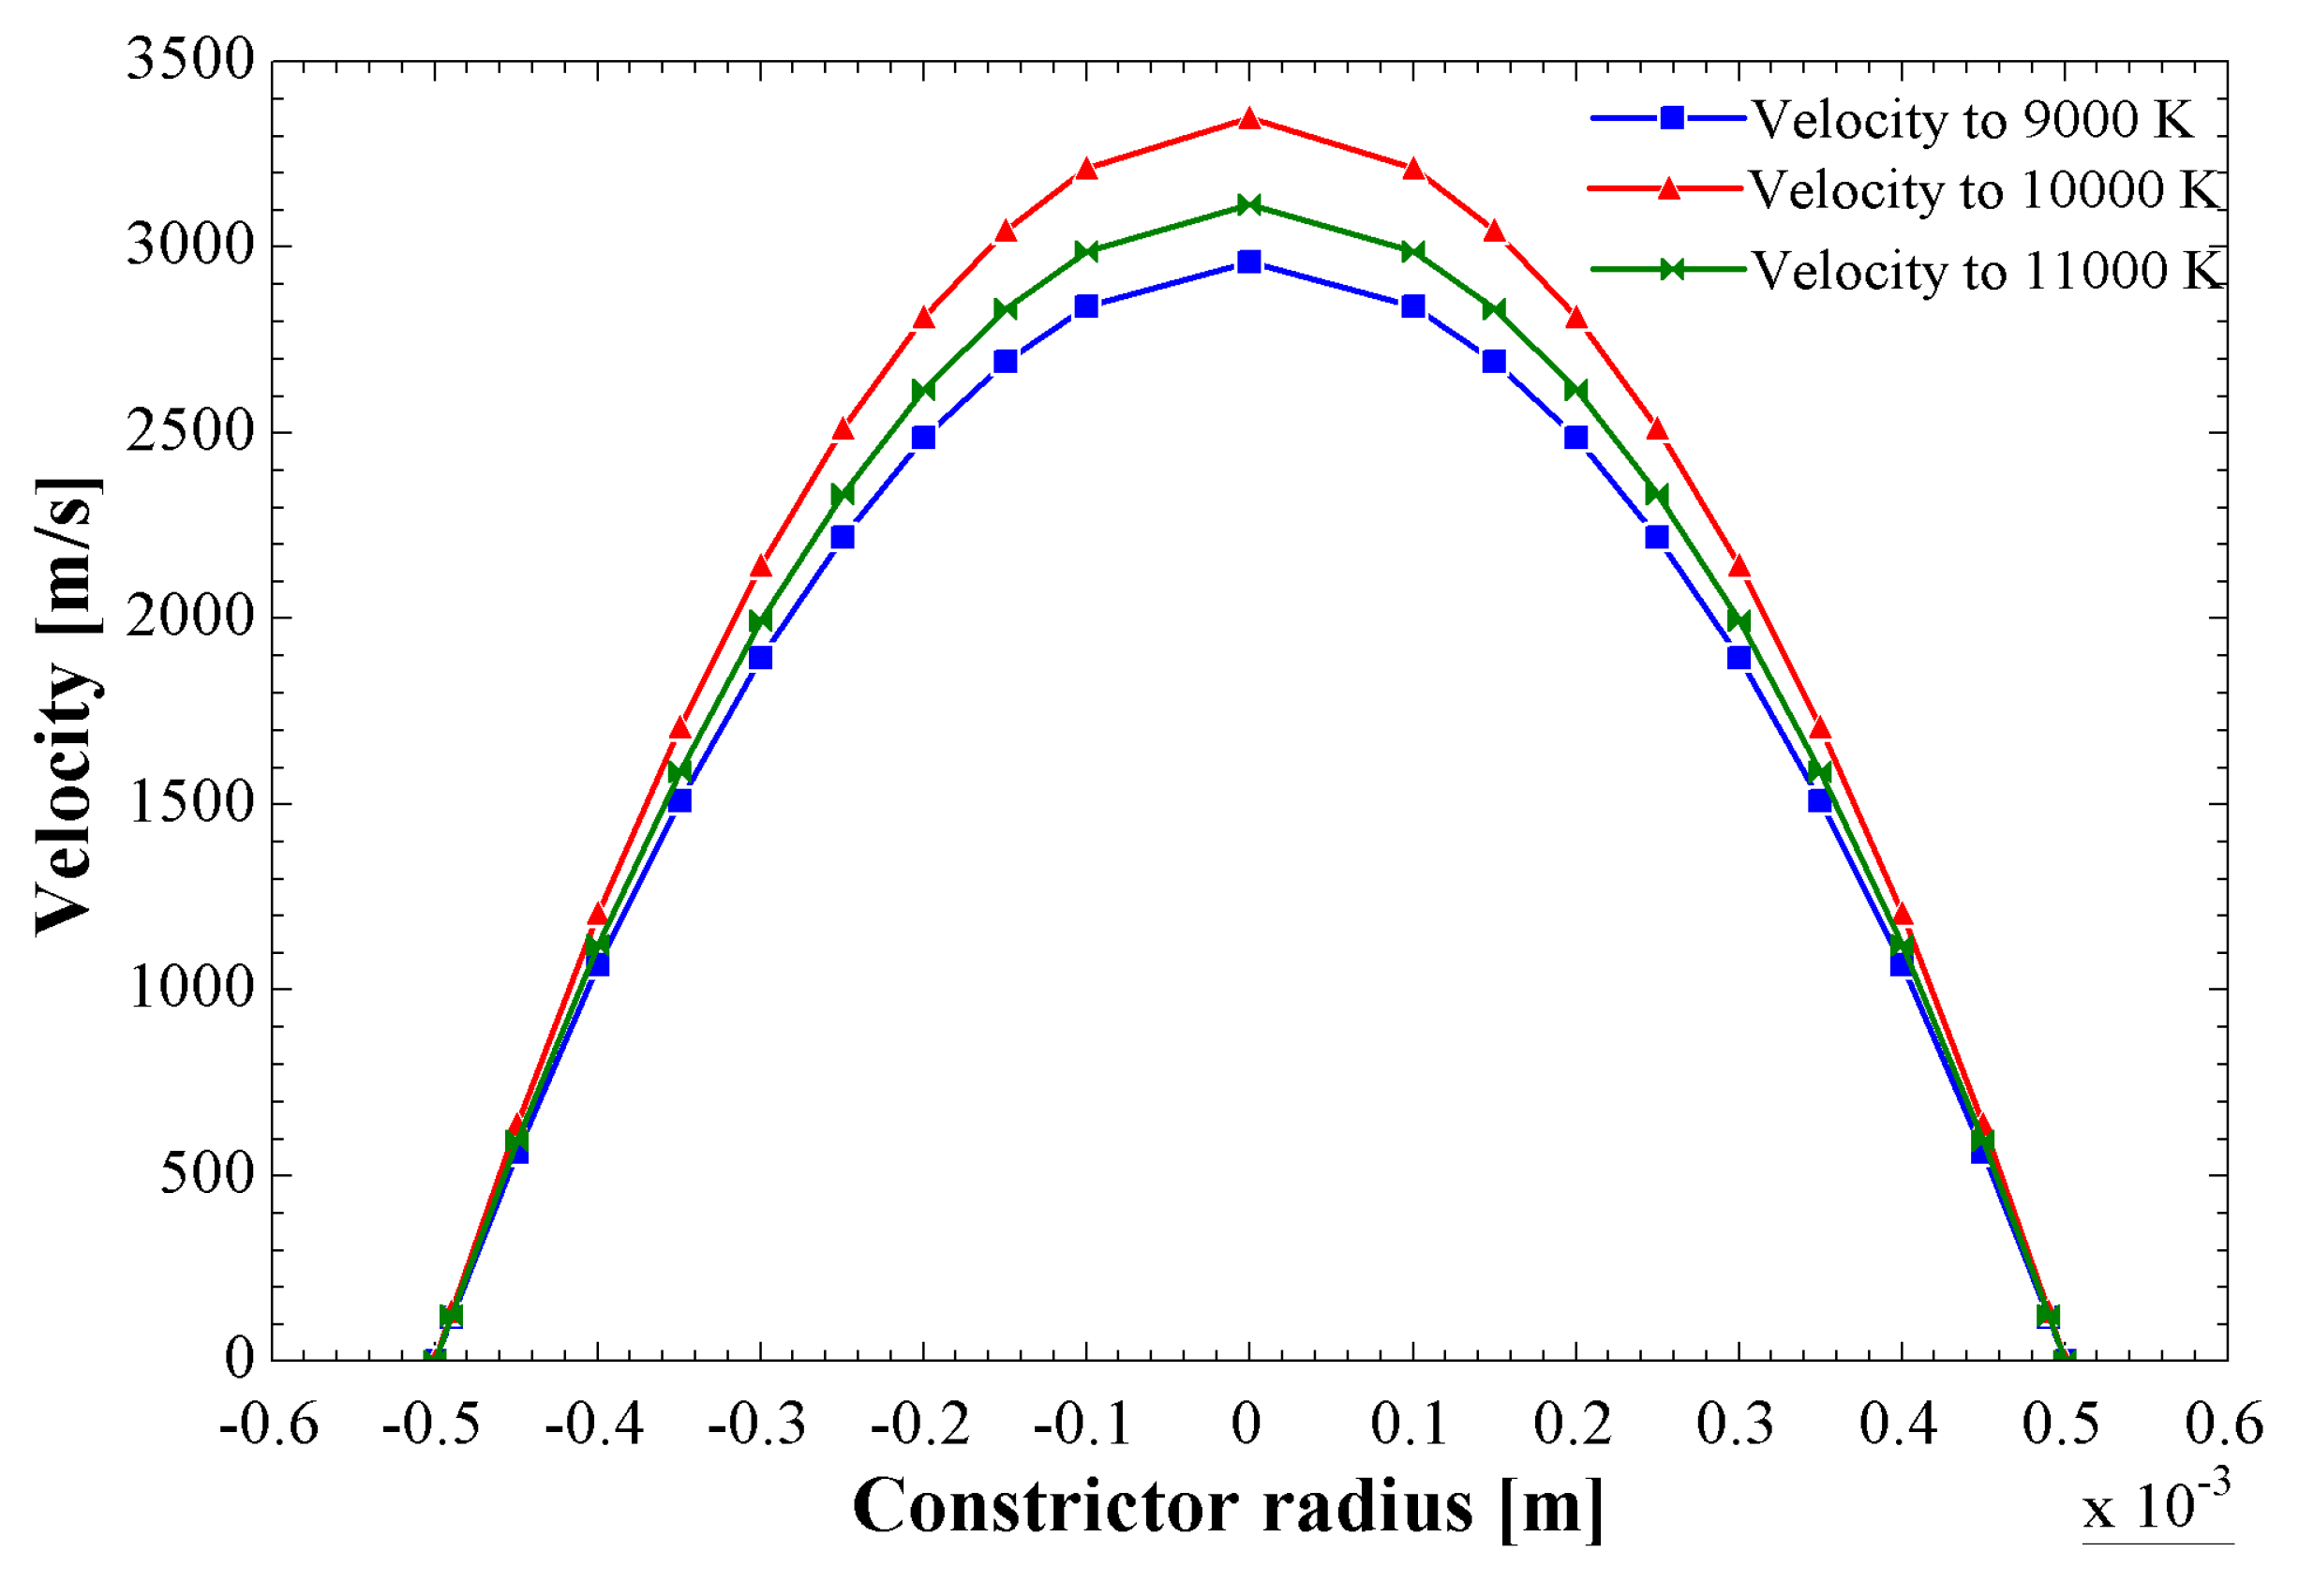
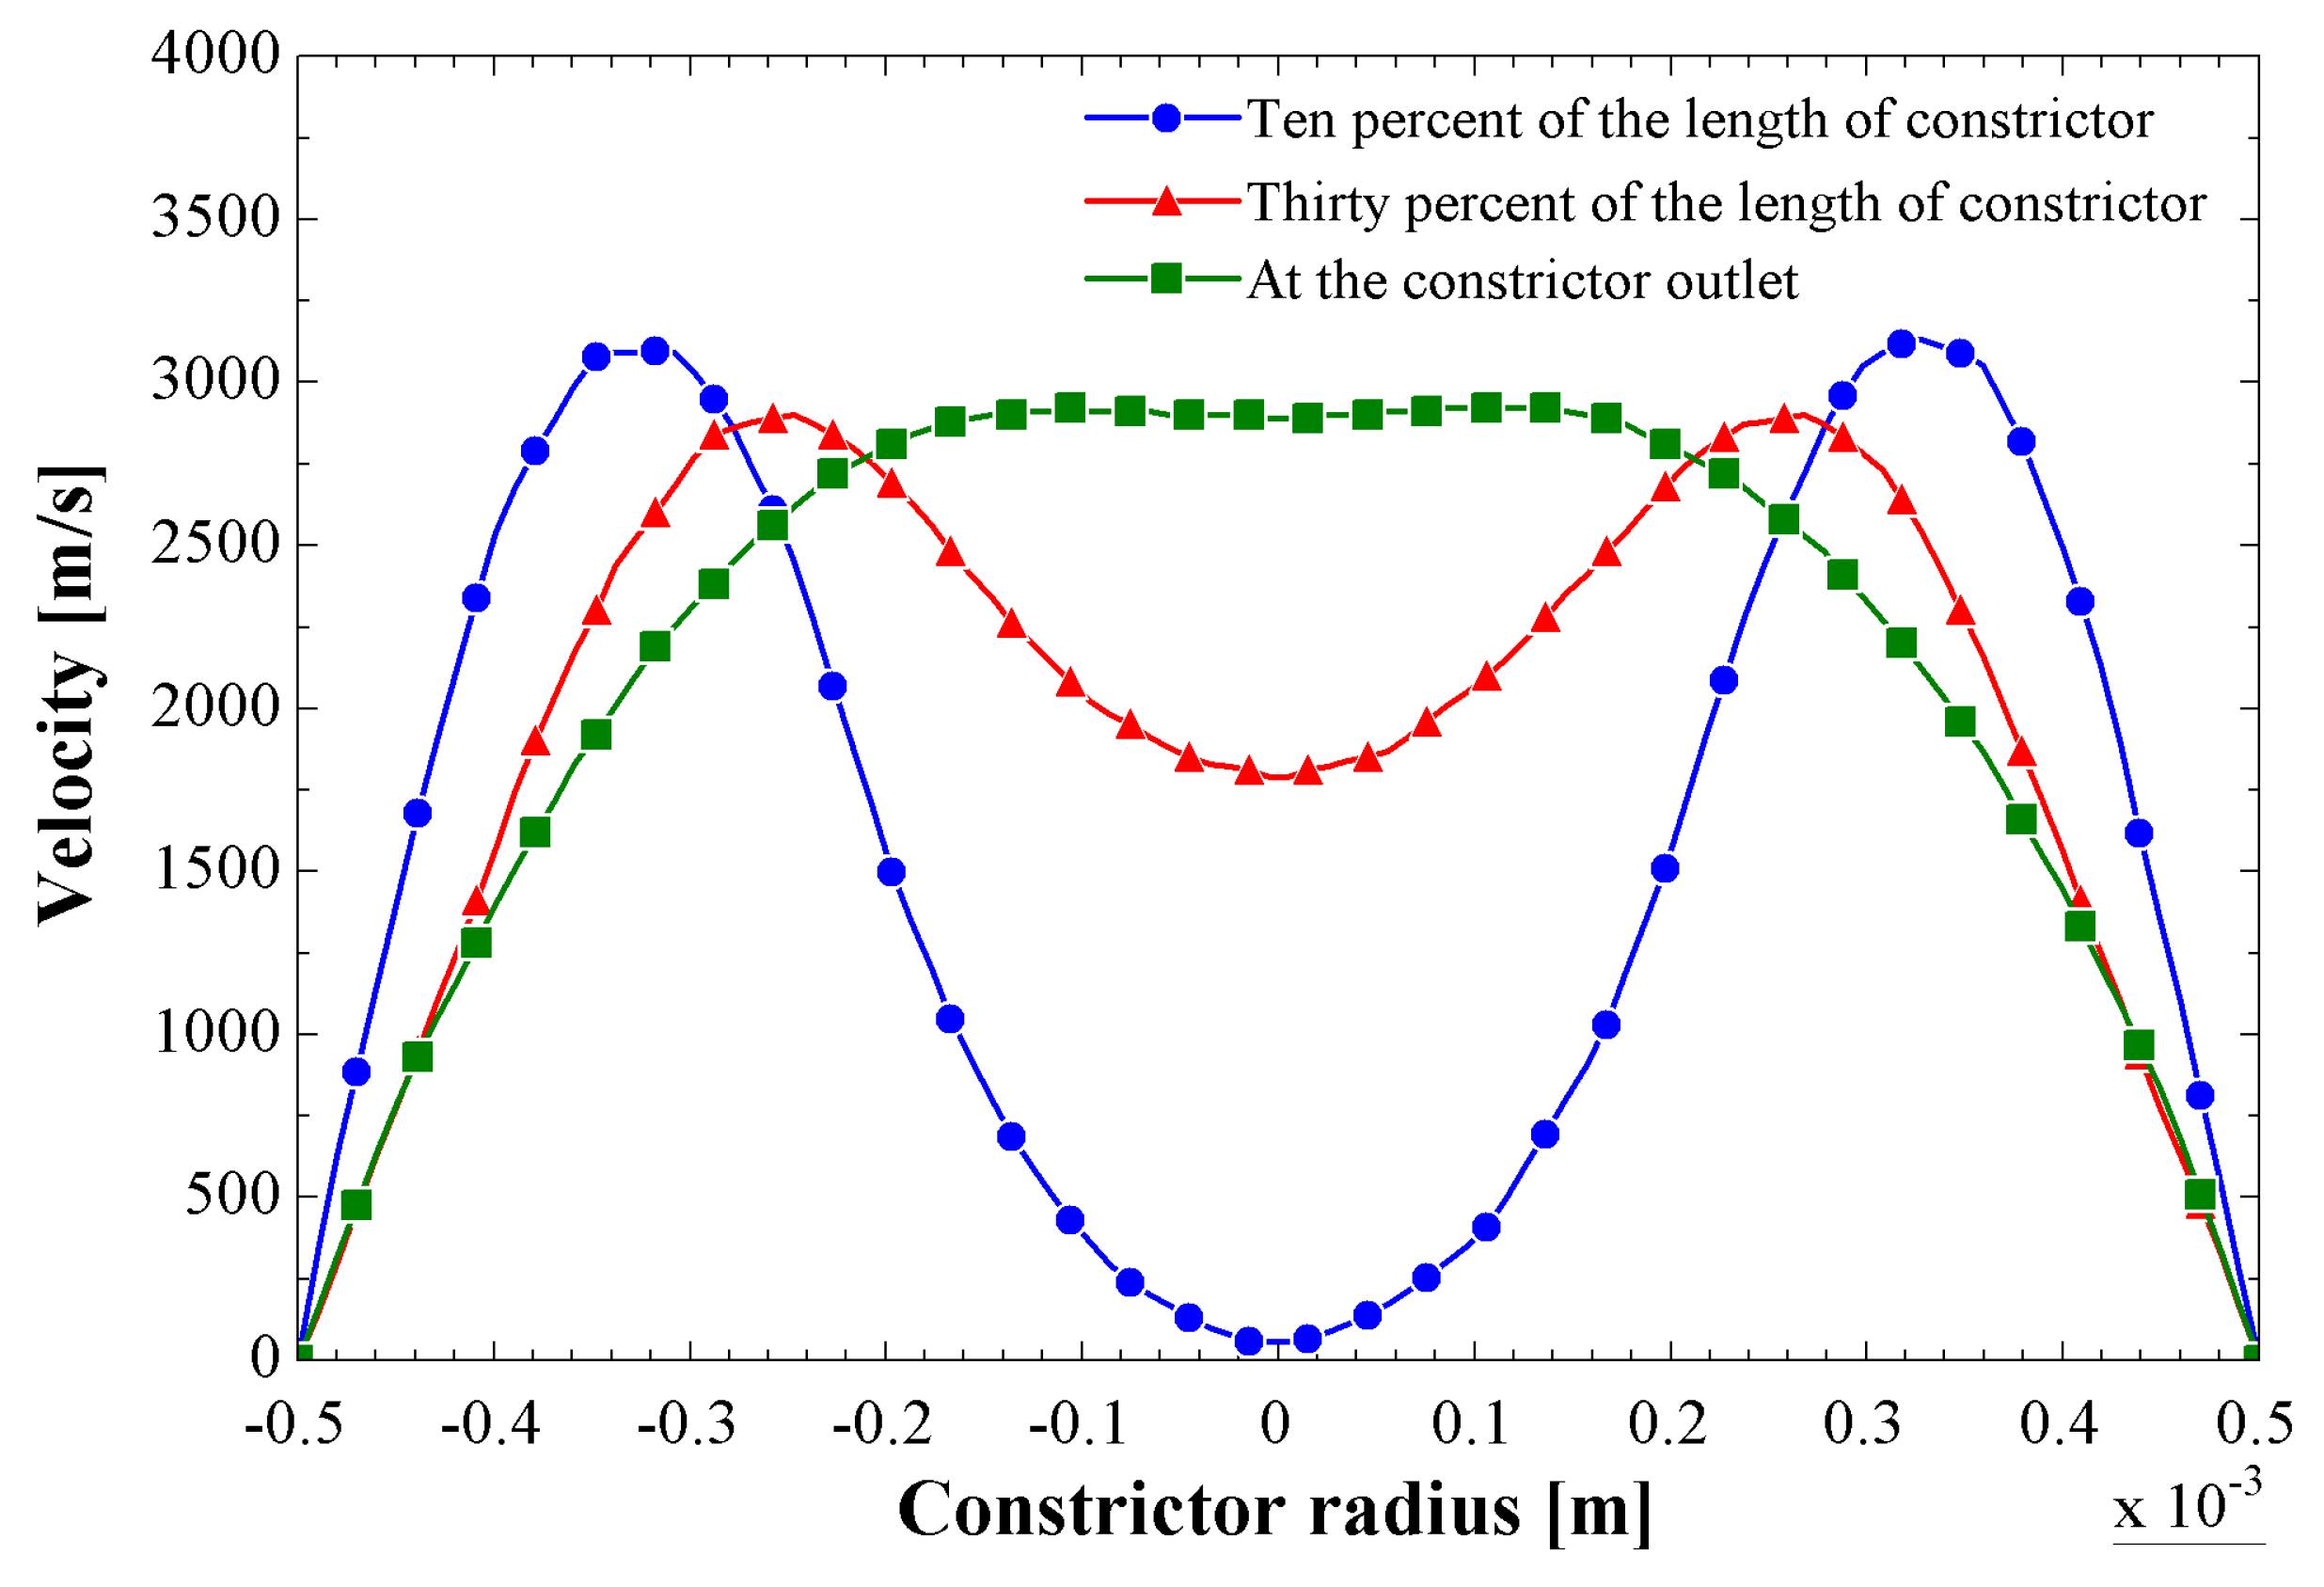
3.2. Results of the Numerical Simulation

This subsection presents the numerical simulation results of the constrictor. Consistent with the main objective of this present work, air-based plasma velocity contours in the constrictor are presented for the electric arc temperatures of 9000 K and 10,000 K. The choice of these two magnitudes of temperature is justified by the fact that 9000 K is the temperature at which the particles of the air are largely ionized causing a significant increase in the velocity of the plasma [21]. At 10,000 K, the plasma reaches its maximum velocity, as reported in the analytical results of the present study.
Figure 12 shows the velocity contour of the air-based plasma along the constrictor when the electric arc temperature is 9000 K. It can be observed that the velocity increases considerably from 30 to 2400 m/s at the outlet, especially in the middle zone of the constrictor where the air is in contact with the electric arc. This increase in velocity is the consequence of the ionization of the air generated by the electric arc.
Similar to the analytical results, Figure 13 shows the radial velocity magnitude profiles. The facility that presents the numerical method in comparison with the analytical method is that, in the numerical method, it is possible to analyze the evolution of the velocity profiles at any location within the constrictor. The locations of 10 and 30% of the constrictor length, as well as the constrictor outlet, are proposed for this analysis. The choice of the location of 10% of the constrictor length is justified by the fact that it is the location near the tip of the cathode where the flow is not fully developed, as shown in the analytical results, especially in Figure 10a–c. Additionally, it was observed in the same figures that the velocity reaches the maximum value at 30% of the constrictor length and then remains constant until the exit. It can be seen in Figure 13 that the velocity profile is developing gradually along the constrictor from the entrance to the exit. The maximum velocity magnitude for the outlet profile is 2400 m/s. The concave parabolic shape that is seen in the velocity profile at 10% of the constrictor length is due, on the one hand, to the tangential force of the air-based plasma acting on the surface of the cathode (of convergent shape), which causes a decrease in velocity, and on the other hand, to the fact that this zone is closer to the entrance of the constrictor where the electric arc is barely in contact with the air, which does not promote good ionization of the air. At 30% of the constrictor length, velocity is sufficiently developed, but not completely, as observed in the analytical results. However, the exit of the constrictor is where the velocity of the air-based plasma is fully developed.
Similarly, Figure 14 shows the air-based plasma velocity contour along the constrictor when the electric arc temperature reaches 10,000 K. One can observe an improvement in the distribution and an increase in the magnitude of the velocity in comparison with the behavior observed when the temperature of the electric arc is 9000 K. This behavior is due to the high level of air ionization as reported in the literature [21].
In addition, Figure 15 shows the radial profiles for the three locations described above when the temperature of the electric arc is 10,000 K. The profile trends are the same as the previous ones shown in Figure 13; the only difference is that the velocity magnitudes have increased significantly with a peak of 2900 m/s at the outlet of the constrictor.

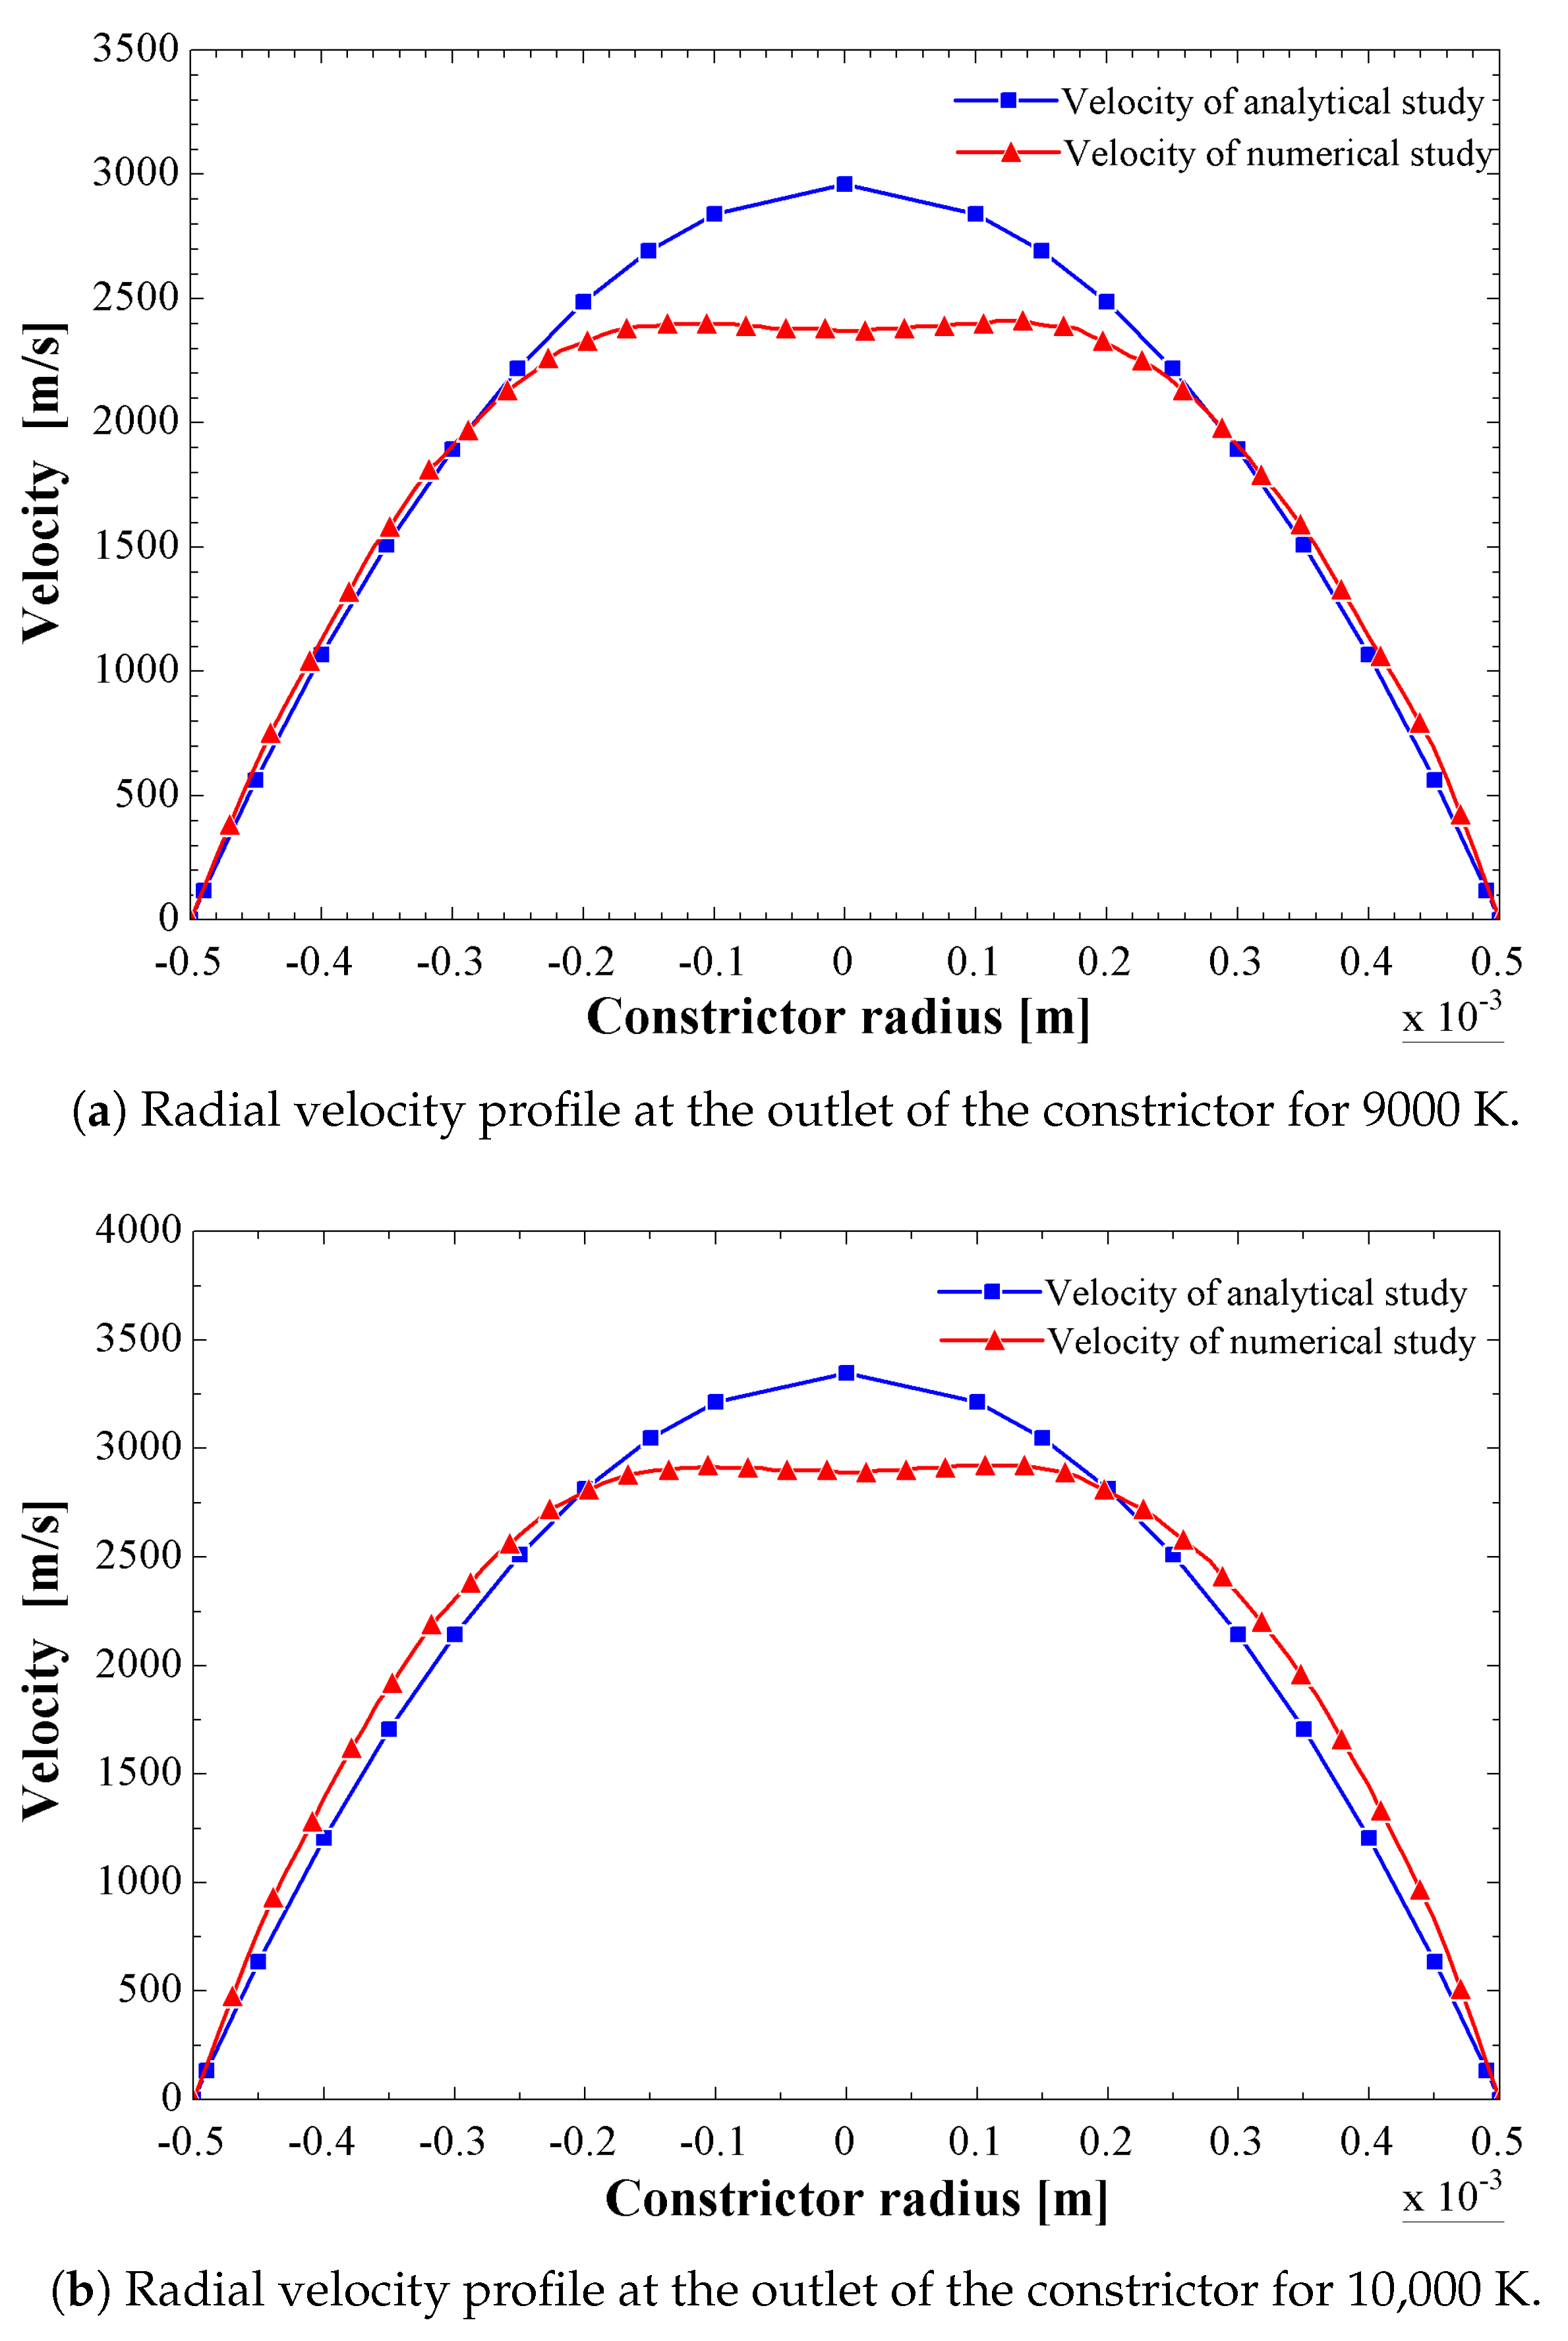
3.3. Comparison of Analytical and Numerical Results

This subsection compares the analytical and numerical results, especially the velocity magnitude profiles at the constrictor outlet described in the previous subsections. Figure 16a,b compare the radial velocity profiles for 9000 K and 10,000 K, respectively, carried out from analytical and numerical methods. It is generally observed that both results have a good approximation between the radii of 0.2 × 10 3 m and 0.5 × 10 3 m. A slight difference between both results is observed in the region near the center of the constrictor. These discrepancies are mainly due to the different assumptions considered in the analytical method, especially in the flow regime that was considered as laminar when the flow regime was really turbulent. Furthermore, the Lorentz force was not considered in the analysis. On the other hand, it is known that the numerical method is an approximate method, and the results are not free from certain errors.
The error graphs between both results are shown in Figure 17a,b. The oblique lines shown in the graphs are the upper and lower limits with a 25% error margin between the analytical and numerical studies [46]. In both figures, it can be seen that between 0 and 2500 m/s, the points stick to the side of the −25% line, this means that in this interval, the numerical results have a greater deviation compared to the analytical results. The opposite behavior is observed, above 2500 m/s in Figure 17a, and above 3000 m/s in Figure 17b, where the points stick very close to the 25% line.
In addition, the relative percentage error between the analytical and numerical results for the velocity profiles (described above) is calculated using the following expression.
e r r o r ( % ) = 100 n i = 1 i = n | v a n a , i v n u m , i | v a n a , i
where v a n a is the velocity obtained from the analytical method, v n u m is the velocity obtained from the numerical method, and n is the data number. The results show that the relative percentage error between both results is 13.369% when the temperature of the electric arc is 9000 K, and 16.328% when the electric arc temperature reaches 10,000 K. These errors are within the acceptable range since they are less than 20%.

4. Conclusions

The analytical and numerical study of the velocity distribution of the air-based plasma in a constrictor of an arc jet thruster was performed in this paper. To carry out this study, a new geometric design of the constrictor is proposed. The magnitudes proposed for the design parameters were included in the ranges reported by the NASA Technical Note. The magnitude of the diameter and length of the constrictor were chosen for a low-power arc jet. Tungsten was proposed as the material in the design, and the wall thickness was determined based on the temperature of the air-based plasma and the heat transfer mechanism analyses.
The numerical results were very close to the analytical ones. The slight difference between both results was mainly due to the different assumptions considered in the analytical method. The analytical method provides an approximation of the air-based plasma behavior in the constrictor, but it neglects important characteristics related to the plasma behavior. On the other hand, the numerical method, although computationally expensive, is suitable for studying the behavior of the air-based plasma at different stations in the constrictor. In the analytical method, the results of the velocity magnitude profiles are shown at the outlet of the constrictor, while in the numerical method, the velocity magnitude profiles are shown at different stations along the constrictor, detailing the shape and values of the velocity magnitude profiles.
The errors between the results of both methods did not exceed 16.328%, which indicates that both methods are adequate for analyzing the fluid dynamic behavior of the air-based plasma inside the constrictor. It was observed that the velocity magnitude of the air-based plasma inside the constrictor increases as the temperature of the electric arc increases up to 10,000 K. This is due to the ionization of air particles, which intensifies as the temperature of the electric arc increases. However, above 10,000 K (for example, at 11,000 K), it was observed that the velocity magnitude of the air-based plasma began to decrease. This is because, at this temperature level, the air particles are completely ionized. This trend is mainly due to the behavior of the specific heat of the air-based plasma, which reaches a maximum value around a temperature of 10,000 K, and then decreases as the temperature value rises. Similar specific heat behavior of the air-based plasma has been reported by D’Angola et al. [34].
By implementing the proposed design of the constrictor, the air velocity was increased from 30 to 3000 m/s, which is a significant achievement in maximizing the thrust of the arcjet. The increased velocity magnitude can be attributed to the length of the constrictor, which allows for a longer exposure time of the air-based plasma with the electric arc, resulting in an increase in velocity magnitude within the constrictor. A similar study was carried out by Horisawa et al. [47] on the optimization of arc constrictor sizes in low-power arcjet thrusters, which show that the discharge voltage of the arc increases with the constrictor length. Most of the constrictor lengths found in other works [48,49] are smaller than the proposed constrictor design. Therefore, this proposed constrictor design can also be operated with other propellants, such as hydrogen, hydrazine, argon, nitrogen, and ammonia, among others.
In future work, it is recommended to analyze the temperature and dynamic pressure distribution inside the constrictor to obtain more information on the energetic behavior of the air-based plasma before conducting the thrust analysis of the arc jet thruster, which is the main goal of the propulsion for nano- and micro-satellites.

Author Contributions

Author contributions: conceptualization, P.J.A.T. and L.E.M.R.; methodology, J.F.I.-Y., P.J.A.T. and L.E.M.R.; software, J.F.I.-Y., P.J.A.T., L.E.M.R. and C.M.R.R.; validation, P.A.A.C., J.F.I.-Y., P.J.A.T. and L.E.M.R.; formal analysis, J.F.I.-Y., P.J.A.T. and L.E.M.R.; investigation, J.F.I.-Y., P.J.A.T., L.E.M.R., P.A.A.C. and C.M.R.R.; writing—original draft preparation, L.E.M.R.; writing—review and editing, J.F.I.-Y., P.J.A.T. and L.E.M.R.; supervision, P.A.A.C. and C.M.R.R.; project administration, J.F.I.-Y. All authors have read and agreed to the published version of the manuscript.

Funding

The funding for the registration fee of this article was provided by the Universidad Politecnica Metropolitana de Hidalgo (UPMH) Boulevard Acceso a Tolcayuca 1009, Ex Hacienda San Javier, Tolcayuca 43860, Hidalgo, Mexico.

Data Availability Statement

Acknowledgments

The authors appreciate the support given by the UPMH while writing this document, for providing the facilities, software, and computational equipment necessary to achieve this goal. The funding for the registration fee of this article was provided by the Metropolitan Polytechnic University of Hidalgo. Luis Enrique Marron Ramirez would like to thank CONACYT for the financial support provided during the development of this project at the Metropolitan Polytechnic University of Hidalgo.

Conflicts of Interest

The authors declare no conflict of interest.

References

  1. Guyot, M.; Denise, S.; Dusseau, L.; Saigné, F.; Bernard, M.; Claudé, P.; Dudeck, M. Electrostatic propulsion for satellites application to the Robusta-3 nanosatellite. IEEE Trans. Dielectr. Electr. Insul. 2014, 21, 1161–1165. [Google Scholar] [CrossRef]
  2. Bock, D.; Auweter-Kurtz, M.; Herdrich, G.; Kurtz, H.; Röser, H.P. An advanced ammonia propellant feed system for the thermal arcjet TALOS. In Proceedings of the 43rd AIAA/ASME/SAE/ASEE Joint Propulsion Conference & Exhibit, Cincinnati, OH, USA, 8–11 July 2007; p. 5186. [Google Scholar]
  3. Wollenhaupt, B.; Hammer, A.; Herdrich, G.; Fasoulas, S.; Roser, H. A very low power arcjet (VELARC) for small satellite missions. In Proceedings of the 32nd International Electric Propulsion Conference, Wiesbaden, Germany, 11–15 September 2011; pp. 1988–2007. [Google Scholar]
  4. Skalden, J.; Herdrich, G.; Ehresmann, M.; Fasoulas, S. Development Progress of an Adaptable Deorbit System for Satellite Constellations. In Proceedings of the 36th International Electric Propulsion Conference, Vienna, Austria, 15–20 September 2019; pp. 15–20. [Google Scholar]
  5. National Aeronautics and Space Administration. Space Launch System Core Stage. 2021. Available online: https://www.nasa.gov/exploration/systems/sls/fs/core_stage.html (accessed on 1 January 2023).
  6. Kaminska, A.; Bialek, A.; Dudeck, M. Performances of an argon arcjet thruster for satellites. Rom. J. Phys. 2015, 60, 549–559. [Google Scholar]
  7. Goebel, D.M.; Katz, I. Fundamentals of Electric Propulsion: Ion and Hall Thrusters; John Wiley & Sons: Hoboken, NJ, USA, 2008. [Google Scholar]
  8. Bapat, A.; Salunkhe, P.B.; Patil, A.V. Hall-effect thrusters for deep-space missions: A review. IEEE Trans. Plasma Sci. 2022, 50, 189–202. [Google Scholar] [CrossRef]
  9. Sutton, G.P.; Biblarz, O. Rocket Propulsion Elements; John Wiley & Sons: Hoboken, NJ, USA, 2016. [Google Scholar]
  10. Kalentev, O.; Matyash, K.; Duras, J.; Lüskow, K.F.; Schneider, R.; Koch, N.; Schirra, M. Electrostatic Ion Thrusters-Towards Predictive Modeling. Contrib. Plasma Phys. 2014, 54, 235–248. [Google Scholar] [CrossRef]
  11. Oleson, S. Mission advantages of constant power, variable Isp electrostatic thrusters. In Proceedings of the 36th AIAA/ASME/SAE/ASEE Joint Propulsion Conference and Exhibit, Las Vegas, NV, USA, 24–28 July 2000; p. 3413. [Google Scholar]
  12. Mankavi, F.; Rezaeiha, A. Design and Development of a Low Power Laboratory Resistojet. In Proceedings of the Asian Joint Conference on Propulsion and Power (AJCPP2012), Xi’an, China, 1–4 March 2012. [Google Scholar]
  13. Cann, G.L.; Buhler, R.; Harder, R.L.; Moore, R. Basic Research on Gas Flows Through Electric Arcs-Hot Gas Containment Limits; Technical Report; Xerox Electro-Optical Systems: Pasadena, CA, USA, 1964. [Google Scholar]
  14. Wallner, L.E.; Czika, J., Jr. Arc-Jet Thrustor for Space Propulsion; Technical Report; National Aeronautics and Space Administration Lewis Research Center: Cleveland, OH, USA, 1965.
  15. Morris, J.C.; AVCO Corporation Members. Evaluation of High Temperature Gas Transport Properties. NASA Cr-575 1966, 129, 130–131. [Google Scholar]
  16. Kriebel, M.; Stevens, N. 30-kW class arcjet advanced technology transition demonstration (ATTD) flight experiment diagnostic package. In Proceedings of the 28th Joint Propulsion Conference and Exhibit, Nashville, TN, USA, 6–8 July 1992; p. 3561. [Google Scholar]
  17. King, L.A. Theoretical calculation of arc temperatures in different gases. Spectrochim. Acta 1956, 11, 152–161. [Google Scholar] [CrossRef]
  18. Goldenberg, H. Approximate solution of a non-linear differential equation giving the temperature distribution in the positive column of a static arc. Br. J. Appl. Phys. 1958, 10, 47–51. [Google Scholar] [CrossRef]
  19. Hansen, C.F. Approximations for the Thermodynamic and Transport Properties of High-Temperature Air; Number 4150; National Advisory Committee for Aeronautics: NC, USA, 1958. [Google Scholar]
  20. Stine, H.A.; Watson, V.R. The Theoretical Enthalpy Distribution of air in Steady Flow Along the Axis of a Direct-Current Electric Arc; National Aeronautics and Space Administration: Washington, DC, USA, 1962.
  21. Bauer, E. Physics of High-Temperature Air. Part 1. Basics. Final Report, October 1987–December 1988; Technical Report; Institute for Defense Analyses: Alexandria, VA, USA, 1990. [Google Scholar]
  22. Bauer, E. Physics of High-Temperature Air. Part. 2. Applications; Technical Report; Institute For Defense Analyses: Alexandria, VA, USA, 1990. [Google Scholar]
  23. Yamada, T.; Toki, K.; Kuriki, K. Behavior of Arc Column in Arcjet Constrictor; Institute of Space and Astronautical Science: Kanagawa, Japan, 2008. [Google Scholar]
  24. Heiermann, J.; Kurtz, M.A.; Slezion, P.; Herdrich, G. Numerical Evaluation of an Inductive Plasma Wind Tunnel Source on Structured and Unstructured Meshes; NASA Astrophysics Data System; National Aeronautics and Space Administration: Washington, DC, USA, 1988.
  25. Trelles, J.P.; Pfender, E.; Heberlein, J.V.R. Modelling of the arc reattachment process in plasma torches. J. Phys. D Appl. Phys. 2007, 40, 5635. [Google Scholar] [CrossRef]
  26. Lopez, B.; Barbosa, E.; Dudeck, M.; Izrar, B.; Kaminska, A. Modelling of a DC arc plasma source for the simulation of mars atmosphere around a spacecraft. Radiat. High Temp. Gases Atmos. Entry 2006, 629, 29. [Google Scholar]
  27. Gokcen, T.; Balboni, J.A.; Hartman, G.J. CFD Simulations for Arc-Jet Panel Testing Capability Development Using Semi-Elliptical Nozzles. AIAA Aviat. 2016, 2016, 3983. [Google Scholar]
  28. Selezneva, S.E.; Boulos, M.I.; Letourneur, K.G.Y.; Van Hest, M.F.A.M.; Van de Sanden, M.C.M.; Schram, D.C. Supersonically expanding cascaded arc plasma properties: Comparison of Ne, Ar and Xe. Plasma Sources Sci. Technol. 2003, 12, 107. [Google Scholar] [CrossRef]
  29. Wei, G.D.; Qi, X.; Yang, L. Modelling on dynamics properties of a stationary argon cascaded arc plasma flows. J. Appl. Phys. 2014, 21, 03350. [Google Scholar] [CrossRef]
  30. Ardakani, E.S. Numerical and Experimental Study of the Arc Fluctuations in a DC Plasma Torch. Ph.D. Thesis, University of Toronto, Toronto, ON, USA, 2016. [Google Scholar]
  31. Morel, T. Comprehensive Design of Axisymmetric Wind Tunnel Contractions. ASME J. Fluids Eng. 1975, 97, 225–233. [Google Scholar] [CrossRef]
  32. National Aeronautics and Space Administration. What Are SmallSats and CubeSats? 2017. Available online: https://www.nasa.gov/content/what-are-smallsats-and-cubesats (accessed on 30 November 2022).
  33. Cengel, Y.A.; Cimbala, J.M. Mecánica de Fluidos Fundamentos y Aplicaciones; The McGrawHill: New York, NY, USA, 2010. [Google Scholar]
  34. D’angola, A.; Colonna, G.; Gorse, C.; Capitelli, M. Thermodynamic and transport properties in equilibrium air plasma in a wide pressure and temperature range. Eur. Phys. J. D 2008, 46, 129–150. [Google Scholar] [CrossRef]
  35. Bird, R.B.; Stewart, W.E. Transport Phenomena, 2nd ed.; John Wiley & Sons Inc.: Hoboken, NJ, USA, 2002. [Google Scholar]
  36. Westermoen, A. Modelling of Dynamic Arc Behaviour in a Plasma Reactor; Norwegian University of Science and Technology Facuty of Natural Sciences and Technology Department of Material Sciences and Engineering: Trondheim, Norway, 2007. [Google Scholar]
  37. Karetta, F.; Lindmayer, M. Simulation of the gasdynamic and electromagnetic processes in low voltage switching arcs. IEEE Trans. Components Packag. Manuf. Technol. Part A 1996, 21, 35–44. [Google Scholar]
  38. Mutzkea, A.; Ruther, T.; Lindmayer, M. Arc behavior in low-voltage arc chambers. Eur. Phys. J. Appl. Phys. 2010, 49, 133. [Google Scholar] [CrossRef]
  39. Román-Roldán, N.; Yudonago, J.I.; López-Ortiz, A.; Rodríguez-Ramírez, J.; Sandoval-Torres, S. A new air recirculation system for homogeneous solar drying: Computational fluid dynamics approach. Renew. Energy 2021, 179, 1727–1741. [Google Scholar] [CrossRef]
  40. Ansys Fluent. ANSYS Fluent Magnetohydrodynamics (MHD) Module Manual, Release 15.0; Ansys Fluent Inc.: Canonsburg, PA, USA, 2013; Available online: https://www.scribd.com/document/284401251/ANSYS-Fluent-Magnetohydrodynamics-MHD-Module-Manual# (accessed on 2 April 2023).
  41. Cruz, J.C.B. Characterization of Arc Extinction in Direct Current Residential Circuit Breakers; Instituto Tecnológico y de Estudios Superiores de Monterrey: Monterrey, Mexico, 2018. [Google Scholar]
  42. Ansys Fluent. Fluent 14.0 User’s Guide; Ansys Fluent Inc.: Canonsburg, PA, USA, 2011. [Google Scholar]
  43. Boulos, M.I.; Fauchais, P.; Pfender, E. Thermal Plasma: Fundamentals and Applications; Springer Science & Business Media: Berlin/Heidelberg, Germany, 2013. [Google Scholar]
  44. Trelles, J.P.; Heberlein, J.; Pfender, E. Non-equilibrium modelling of arc plasma torches. J. Phys. D Appl. Phys. 2007, 40, 5937. [Google Scholar] [CrossRef]
  45. Hameurlaine, K. Contribution to the Study of a Lower Power Electric Arc; Université d’Orléans: Orléans, France, 2012. [Google Scholar]
  46. Islas-Narvaez, E.A.; Ituna-Yudonago, J.F.; Ramos-Velasco, L.E.; Vega-Navarrete, M.A.; Garcia-Salazar, O. Design and Determination of Aerodynamic Coefficients of a Tail-Sitter Aircraft by Means of CFD Numerical Simulation. Machines 2022, 11, 17. [Google Scholar] [CrossRef]
  47. Horisawa, H.; Kimura, I.; Horisawa, H.; Kimura, I. Optimization of arc constrictor sizes in low power arcjet thrusters. In Proceedings of the 33rd Joint Propulsion Conference and Exhibit, Seattle, WA, USA, 6–9 July 1997; p. 3202. [Google Scholar]
  48. Sun, W.P.; Wei, F.Z.; Wang, H.X. Numerical Simulation of Nonequilibrium Flow in a Low-Power Hydrogen Arcjet. In Proceedings of the 33rd International Electric Propulsion Conference, Washington, DC, USA, 6–10 October 2013. [Google Scholar]
  49. Powell, K.; Gallimore, A.; Van Leer, B. A Numerical and Experimental Study of Arcjet Fluctuation; Technical Report; Department of Aerospace Engineering, Michigan University Ann Arbor: Ann Arbor, MI, USA, 1999. [Google Scholar]
Figure 1. Detailed drawing of constrictor geometry.
Machines 11 00527 g001
Figure 2. Generic scheme of arcjet with the proposed constrictor.
Machines 11 00527 g002
Figure 3. Variations in the properties of the air-based plasma at 1 atmospheric pressure.
Machines 11 00527 g003
Figure 4. Radiative heat flux behavior of the air-based plasma.
Machines 11 00527 g004
Figure 5. Density and dynamic viscosity of the air-based plasma at 1 atm.
Machines 11 00527 g005
Figure 6. The 3D computational domain of the constrictor.
Machines 11 00527 g006
Figure 7. Computational domain meshing.
Machines 11 00527 g007
Figure 8. Mesh independence analysis of the constrictor’s volumetric average velocity.
Machines 11 00527 g008
Figure 9. Distributions of specific enthalpy magnitudes along the constrictor for different radii and electric arc temperatures, from the analytical method.
Machines 11 00527 g009
Figure 10. Distributions of velocity magnitudes along the constrictor for different radii and electric arc temperatures, from the analytical method.
Machines 11 00527 g010aMachines 11 00527 g010b
Figure 11. Radial velocity profile at the outlet of the constrictor, from the analytical method.
Machines 11 00527 g011
Figure 12. Velocity distribution contour in the computational domain of the constrictor at a maximum temperature of 9000 K.
Machines 11 00527 g012
Figure 13. Radial velocity profiles at 10% and 30%, and the outlet of the constrictor for the electric arc of 9000 K, from the numerical method.
Machines 11 00527 g013
Figure 14. Velocity distribution contour in the computational domain of the constrictor at a maximum temperature of 10,000 K.
Machines 11 00527 g014
Figure 15. Radial velocity profiles at 10% and 30%, and the outlet of the constrictor for the electric arc of 10,000 K, from the numerical method.
Machines 11 00527 g015
Figure 16. Comparison between the radial velocity profile at the outlet of the constrictor for 9000 K and 10,000 K carried out from analytical and numerical methods.
Machines 11 00527 g016
Figure 17. Errors between the analytical and numerical results for electric arcs with temperatures of 9000 K and 10,000 K.
Machines 11 00527 g017
Table 1. Arcjet dimensions.
ConstrictorConstrictor dimensions
l c / d c 1.5
d c 1 mm
l c 1.5 mm
x0.25 mm
t0.4 mm
InletInlet dimensions
θ i n t 30
l i n t 0.5 mm
d i n t 0.25 mm
Table 2. Boundary conditions.
InletOutletCathodeCathode TipAnode
P P i n = 101,325 Pa P o u t = 63,284 Pa P n = 0 P n = 0 P n = 0
v m ˙ = 2.4 × 10 5   kg s v i n = 0 000
T300 K T n = 0 T = 1000 K T ( r ) Q w = h w ( T T w )
ϕ ϕ n = 0 ϕ n = 0 ϕ n = 0 j ( r ) 0
A 00 A i n = 0 A i n = 0 A i n = 0
Table 3. Characteristics of the mesh independence study.
FeaturesMesh Size
M1M2M3M4M5M6M7M8M9
Nodes2952130961619,25438,12955,85675,21283,54491,512
Elements101110,22750,429102,093204,791300,551405,049450,898495,706
Mesh metric Skewness
Minimum5.4575 × 10 4 1.3471 × 10 3 2.761 × 10 5 1.0203 × 10 5 7.5313 × 10 5 3.4219 × 10 5 1.9023 × 10 6 3.2377 × 10 7 8.7762 × 10 8
Maximum0.711950.725750.791560.799820.795440.794420.795840.79150.83724
Avarage0.231880.236150.237820.23180.226880.224920.222890.222930.21789
Standard deviation0.11810.125250.123340.12110.119130.118250.117470.11760.11674
Disclaimer/Publisher’s Note: The statements, opinions and data contained in all publications are solely those of the individual author(s) and contributor(s) and not of MDPI and/or the editor(s). MDPI and/or the editor(s) disclaim responsibility for any injury to people or property resulting from any ideas, methods, instructions or products referred to in the content.

